Embed Size (px)
Citation preview
Prospects for international tourism
Project LINKUN DESA Expert Group Meeting
on the World Economy,NYC, USA
24-26 October 2011
John G.C. KesterProgramme Manager, Tourism
Trends and Marketing Strategies [email protected]

The World Tourism Organization (UNWTO)a specialized agency of the United Nations (UN) and the leading international
organization in the field of tourism. It serves as a global forum for tourism policy issues and a practical source of tourism know‐how.
plays a central and decisive role in promoting the development of responsible, sustainable and universally accessible tourism, paying particular attention to the interests of developing countries.
encourages the implementation of the Global Code of Ethics for Tourism, with a view to ensuring that member countries, tourist destinations and businesses maximize the positive economic, social and cultural effects of tourism and fully reap its benefits, while minimizing its negative social and environmental impacts.
intergovernmental organization with membership includes 162 countries and territories and more than 400 Affiliate Members representing the private sector, educational institutions, tourism associations and local tourism authorities.
committed to the United Nations Millennium Development Goals, geared toward reducing poverty and fostering sustainable development.

International tourist arrivals by purpose, 2008
Not specified7%
Business and
professional15%
VFR, Other27%
Leisure, recreation
and holidays51%
Tourism“comprises the activities of persons travelling to and staying in places outside their usual environment for not more than one consecutive year for leisure, business and other purposes”Forms and indicators:• same-day visitors and tourists (staying overnight at least one night)• international and domestic• inbound (destination) and outbound (origin)• several indicators possible: arrivals, trips, nights, receipts, expenditure• UNWTO 2 key indicators: ITA, ITR• all purposes except paid work in the destination
Tourism: concepts, forms and indicators
Source: Methodology UNWTO and United Nations, Recommendations on Tourism Statistics

Results 2010
International Tourist Arrivals940 million
+6.6%
International Tourism ReceiptsUS$ 919 billion (euro 693 bn)
+4.7% (real terms)
www.unwto.org/facts

International TourismInternational tourist arrivals and receipts and market share (%)
International Tourism Receipts (ITR), 2010*US$ 918 billion
International Tourist Arrivals (ITA), 2010*940 million
AmericasITA: 150 million (16%)ITR: US$ 182 billion (20%)
AfricaITA: 49 million (5%)ITR:US$ 31 billion (3%)
EuropeITA: 477 million (51%)ITR: US$ 406 billion (44%)
Middle EastITA: 60 million (6%)ITR: US$ 50 bn (6%)
Asia and the PacificITA: 204 million (22%)ITR: US$ 249 billion (27%)
Source: World Tourism Organization (UNWTO)

International Tourist Arrivals (% change 2010 over pre-crisis peak year 2008)
Source: World Tourism Organization (UNWTO) ©
-5.3
0.3
-5.3-0.9
10.5 13.1
4.29.0
0.3
-3.9
7.2 8.9 10.5 9.9
0.42.4
-10-505
1015
WorldNorthe
rn Europe
Western E
urope
Central/Eastern
E...Southern/Medite
r. Eu.
North-East A
siaSouth-East A
sia
OceaniaSouth Asia
North Americ
aCaribb
eanCentral America
South America
North Afric
aSubsaharan
Africa
Middle East
2010 compared to pre‐crisis peak year 2008
International Tourist Arrivals (absolute change 2010 over pre-crisis peak year 2008, million)
Source: World Tourism Organization (UNWTO) ©
-3.2
0.5
-5.3 -1.5
10.6 8.10.5 0.9 0.1 -0.3 1.6 1.5 2.9 5.5
22.3
0.4
-10-505
1015202530
WorldNorthe
rn Europe
Western E
urope
Central/Eastern
E...Southern/Medite
r. Eu.
North-East A
siaSouth-East A
sia
OceaniaSouth Asia
North Americ
aCaribb
eanCentral America
South America
North Afric
aSubsaharan
Africa
Middle East

Inbound tourism: World 2010
International tourist arrivals and receipts, 1995‐2010*
528561
586 603625
675 674 683
753
798
842
898 917882
403437 436 443 457 476 466
485
533
634
679
743
857
940
852
694
940 mn
US$ 918 bn
200
300
400
500
600
700
800
900
1000
1995 2000 2005 2010*
International tourist arrivals (million)
International tourism receipts (US$ billion)
Source: World Tourism Organization (UNWTO)

International Tourism Arrivals and Receipts, World
-7-6-5-4-3-2-10123456789
1011
'90/89
'91/90
'92/91
'93/92
'94/93
'95/94
'96/95
'97/96
'98/97
'99/98
'00/99
'01/00
'02/01
'03/02
'04/03
'05/04
'06/05
'07/06
'08/07
'09/08
'10*/0
9
% c
hang
e ov
er p
revi
ous
year
International tourist arrivalsInternational tourism receipts (local currencies, constant prices)
growth in receipts follows growth in arrivals closelyAsian financial and economic crisis: receipts grew slower
11S, SARS, economic downturn:receipts more affected
‘Great recession’:receipts more affected and slower to recover

0
500
1,000
1,500
2,000
2,500
3,000
1990 1991 1992 1993 1994 1995 1996 1997 1998 1999 2000 2001 2002 2003 2004 2005 2006 2007 2008 2009 2010
US$
billio
n
International Tourism (BOP Travel & Passenger transport)FuelsChemicalsFoodAutomotive products
International tourism vs. other export categories
International tourism:30% of export of services
6% of exports of goods and services
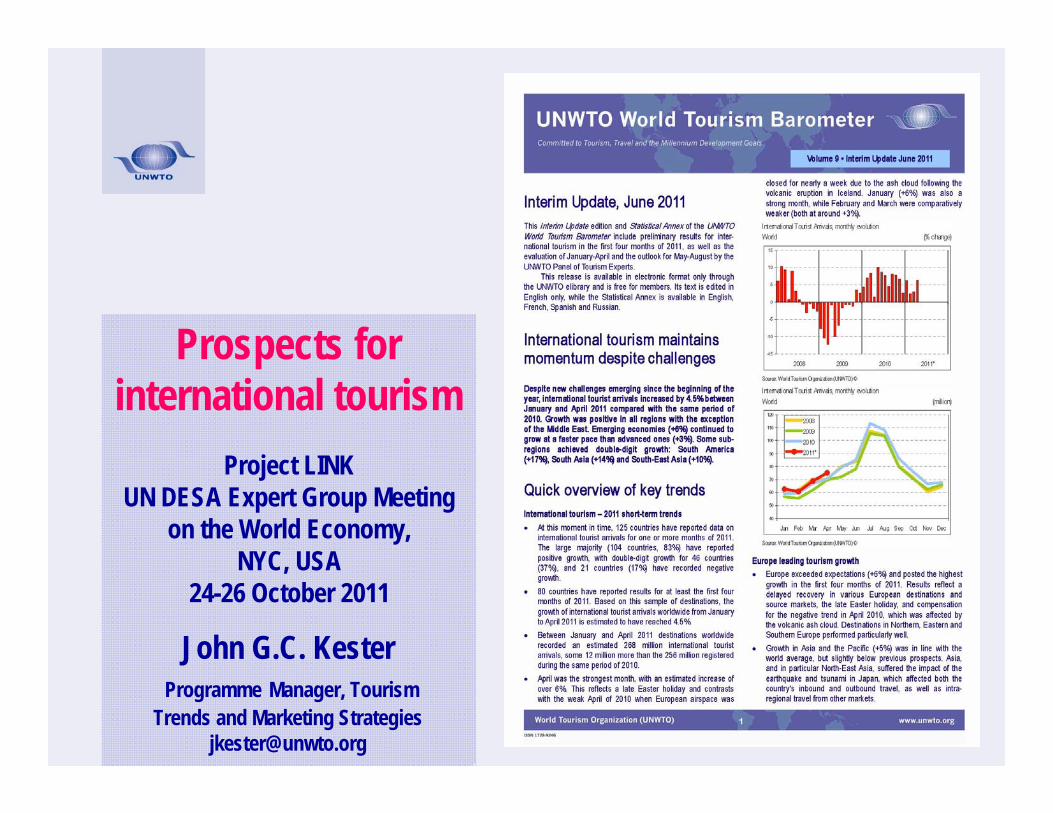
Tourism as Generator of prosperity
Tourism as % of Gross Domestic Product (GDP)
• World wide
• Advanced Diversified Economies
• Small Island Economies and Developing Economies
Approx. 5% of GDP
2-12 % of GDP
up to 40% of GDP

Results 2011

International Tourist Arrivals, monthly evolution World (% change)
Source: World Tourism Organization (UNWTO) ©
-15
-10
-5
0
5
10
15
2008 2009 2010 2011*
Source: World Tourism Organization (UNWTO)
V‐shape decline of 15 consecutive months of
negative growth
+2.1% ‐3.8% +6.6% +4.5%

International Tourist Arrivals, monthly evolution World (million)
Source: World Tourism Organization (UNWTO) ©
40
50
60
70
80
90
100
110
120
Jan Feb Mar Apr May Jun Jul Aug Sep Oct Nov Dec
2008200920102011*
2010: 940 mn
2009: 881 mn => 2010: +59 mn
2008: 916 mn => 2010: +24 mn
Source: World Tourism Organization (UNWTO)

International Tourist Arrivals, monthly evolution Advanced economies & Emerging economies (% change)
Source: World Tourism Organization (UNWTO) ©
-20
-15
-10
-5
0
5
10
15
2008 2009 2010 2011*
Advanced economies
Emerging economies
10 months
16 months
Multi‐speed recovery

International Tourist Arrivals (% change over same period of the previous year)
Source: World Tourism Organization (UNWTO) ©
0
35
3
1412
6
12
7
3 4
10
67
15
7
3
9 8
1
12
0
13
34 4
13
-15
7
-11
6.6
4.5
-16-14-12-10
-8-6-4-202468
10121416
WorldNort
hern E
urope
Western
Europe
Central/
Eastern
Europe
Souther
n/Medi
ter. Eu.
North-E
ast Asia
South-E
ast Asia
Oceania
South A
siaNort
h Americ
aCarib
bean
Central
America
South A
merica
North A
frica
Subsaha
ran Afric
aMidd
le East
10/09
11*/10 January - August
2010 and 2011 year to date by subregion
Source: World Tourism Organization (UNWTO)

International Tourism Expenditure (% change of same period year before, local currencies current prices)
-10
0
10
20
30
40
50
60
Germany
United S
tates
China
United K
ingdom
France
Canada
Japan Ital
y
Russian
Federati
onAust
ralia
Saudi Arab
iaNeth
erlands
Belgium
Korea, R
epublic
of
Hong Kong
(Chin
a)Spai
nSing
apore
Brazil
Norway
Sweden
2010 2011 ytd
Major outbound markets

UNWTO Panel of Tourism Experts: World
Better
Equal
Worse
Source: World Tourism Organization (UNWTO) ©
25
50
75
100
125
150
175
T1 T2'03
T3 T1 T2'04
T3 T1 T2'05
T3 T1 T2'06
T3 T1 T2'07
T3 T1 T2'08
T3 T1 T2'09
T3 T1 T2'10
T3 T1 T2'11
T3
Prospects
Evaluation
Outlook and evaluation 2003‐2011: World
V‐shape comparable to arrivals
Source: World Tourism Organization (UNWTO)

UNWTO tourism business-cycle clock
Upswing May 2003 Boom
October 2011
Recession Downswing
Pros
pect
s co
min
g 4
mon
ths
Evaluation past 4 months
50
75
100
125
150
25 50 75 100 125 150 175
UNWTO tourism business-cycle clock

Outlook

2010 Forecast 2011
World +6.6% +4.0% to +4.5%
Europe +3.2% +5% to +6%
Asia and the Pacific +12.8% +5% to +6%
Americas +6.4% +4% to +5%
Africa +7.8% ‐2% to +1%
Middle East +14.8% ‐10% to ‐5%
International Tourism: Forecast 2011
Source: World Tourism Organization (UNWTO)

International tourist arrivals
8.0
‐0.1
3.0
‐1.6
10.3
5.4 5.56.6
‐3.8
6.6
2.1
‐6
‐4
‐2
0
2
4
6
8
10
12
2000 2001 2002 2003 2004 2005 2006 2007 2008 2009 2010 2011* 2012*
Forecast
2011: 4.0% to 4.5%
2012: 2% to 4%
Outlook: Worldchan
ge(%
)
Source: World Tourism Organization (UNWTO)

Long-term trend

International tourist arrivals
0
200
400
600
800
1,000
1,200
1,400
1,600
1995 2000 2005 2010 2015 2020
million Tourism 2020 Vision forecast
Actual 1995‐2010*
881 mn
Tourism 2020 Vision vs. actual trendWorld
528 mn
940 mn
Source: World Tourism Organization (UNWTO)

Tourism Towards 2030
• A broad research project in continuation of UNWTO’s work in the area of long-term forecasting initiated in the 1990s.
• Objectives:– Assist UNWTO Members in formulating policies and long-term strategic plans– Provide a global reference on tourism future development– Reinforce UNWTO’s role in agenda setting for tourism-related subjects– Constitute a reference for UNWTO strategic documents, programme of work and
activities• Central in the study are the projections for international tourism flows in
the two decades 2010-2030– Data series on international tourist arrivals as reported by destination countries are
used as the key indicator, taking into account subregion of destination, region of origin, mode of transport and purpose of visit for the period 1980-2010
– The quantitative forecast is based on a causal econometric model with international tourist arrivals as the dependent variable and as independent variables growth of Gross Domestic Product (GDP), a proxy for traveller affluence and business travel potential, and also cost of transport

Growth in international tourism will continue, but at a more moderate pace
International tourism, World International Tourist Arrivals, % change over previous year
source: World Tourism Organization (UNWTO) ©
3
0
0
1
9
4
3
9
7
6
7
0
9
3
44
6
5
3
4
8
0
3
-2
10
6 6
7
2
-4
7
-6
-4
-2
0
2
4
6
8
10
12
1980/'79 1985/'84 1990/'89 1995/'94 2000/'99 2005/'04 2010/'09 2015/'14 2020/'19 2025/'24 2030/'29

International tourist arrivals to increase by 43 million a year on average
International tourism, World International Tourist Arrivals, absolute change over previous year, million
source: World Tourism Organization (UNWTO) ©
8
0
0
4
25
1310
3027
22
28
-2
39
15
21 20
33
26
16
22
49
-1
20
-11
70
45 45
56
20
-35
58
-40
-20
0
20
40
60
80
1980 1985 1990 1995 2000 2005 2010 2015 2020 2025 2030

International tourist arrivals to reach 1.8 billion by 2030
International tourism, World International Tourist Arrivals, million
source: World Tourism Organization (UNWTO) ©
0
250
500
750
1,000
1,250
1,500
1,750
2,000
1980 1985 1990 1995 2000 2005 2010 2015 2020 2025 2030

Emerging economy destinations to surpass advanced destinations in 2015
Inbound tourism, advanced and emerging economies International Tourist Arrivals, million
emerging economies
advanced economies
source: World Tourism Organization (UNWTO) ©
0
250
500
750
1,000
1,250
1980 1985 1990 1995 2000 2005 2010 2015 2020 2025 2030

Asia and the Pacific will gain most of the new arrivals
Inbound tourism by region of destination International Tourist Arrivals, million
Europe
Asia and the Pacific
Americas
Middle East
Africa
source: World Tourism Organization (UNWTO) ©
0
100
200
300
400
500
600
700
800
1980 1985 1990 1995 2000 2005 2010 2015 2020 2025 2030

Asia and the Pacific, the Middle East and Africa to increase their shares
Africa3%
Americas23%
Asia and the Pacific8%
Europe63%
Middle East3%
Middle East6%
Europe51%
Asia and the Pacific22%
Americas16%
Africa5%
Africa7%
Americas14%
Asia and the Pacific30%
Europe41%
Middle East8%
1980 (277 mn)
2010 (940 mn)
2030 (1.8 bn)

North-East Asia will be the most visited subregion in 2030

Europe continues to lead in international arrivals received per 100 of population

No major change in share by purpose of visit
International tourism by purpose of visit International Tourist Arrivals, million
Leisure, recreation and holidays
VFR, health, religion, other
Business and professional
source: World Tourism Organization (UNWTO) ©
0
100
200
300
400
500
600
700
800
900
1,000
1980 1985 1990 1995 2000 2005 2010 2015 2020 2025 2030

Air transport will continue to increasemarket share, but at a slower pace
International tourism by means of transport International Tourist Arrivals, million
by air
over surface
source: World Tourism Organization (UNWTO) ©
0
250
500
750
1,000
1980 1985 1990 1995 2000 2005 2010 2015 2020 2025 2030

Travel between regions continues to grow slightly faster than within the same region
International tourism by region of destination and origin International Tourist Arrivals, share, %
within same region
between regions
source: World Tourism Organization (UNWTO) ©
0
10
20
30
40
50
60
70
80
90
100
1980 1985 1990 1995 2000 2005 2010 2015 2020 2025 2030
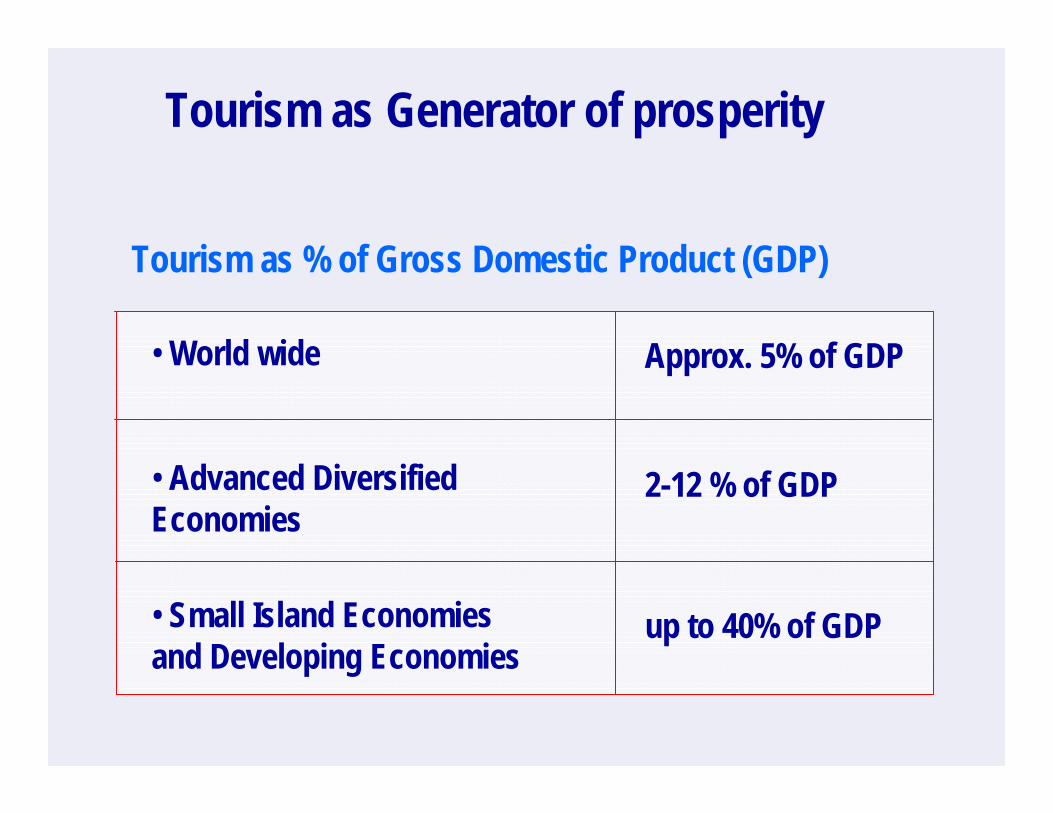
Asia and the Pacific will also be the outbound region that grows most
Outbound tourism by region of origin International Tourist Arrivals generated, million
12
110 88
308
1030
160204
509
3790
265
541
832
81
6
169
2571
60
100
200
300
400
500
600
700
800
900
Africa Americas Asia and the Pacific Europe Middle East
1980 1995 2010 2030

Outbound tourism participation is highest in Europe and still low in Asia and the Pacific
Outbound tourism by region of origin International Tourist Arrivals generated per 100 population
source: World Tourism Organization (UNWTO) ©
92
14
3
36
614
3
17
5
57
1722
6
24
12
89
25
61
12
1
21
6
0
10
20
30
40
50
60
70
80
90
100
World Africa Americas Asia and thePacific
Europe Middle East
1980 1995 2010 2030

What if assumptions change?
Tourism Towards 2030: global projection and sensitivity analysis International Tourist Arrivals, million
source: World Tourism Organization (UNWTO) ©
0
250
500
750
1,000
1,250
1,500
1,750
2,000
1980 1985 1990 1995 2000 2005 2010 2015 2020 2025 2030
Actual data 1980-2010Transport costs continue to fall (scenario 3)Central projectionFaster rising cost of transport (scenario 2)A slower-than-expected economic recovery and future growth (Scenario 1)

One-Page Tourism Towards 2030
• Global growth in international tourist arrivals to continue, but at a more moderate pace, from 4.2% per year (1980–2020) to 3.3% (2010–2030), as a result of four factors:
– The base volumes are higher, so smaller increases still add substantial numbers– Lower GDP growth, as economies mature– A lower elasticity of travel to GDP– A shift from falling transport costs to increasing ones
• Tourism Towards 2030 shows that there is still a substantial potential for further expansion in coming decades; established as well as new destinations can benefit from this trend and opportunity, provided they do shape the adequate conditions and policies with regard to business environment, infrastructure, facilitation, marketing and human resources• Along with opportunities, challenges also arise in maximising social and economic benefits and minimising negative impactsLong-term tourism growth pattern: more moderate, sustainable and inclusive

Opportunities and challenges:how to make it possible
Five key areas that mark the future:
• For many countries tourism represent a powerful tool for social and economic development and the reduction of poverty through the creation of job and enterprises, infrastructure development and the export revenues earned• In order to tap this potential, it is essential to continue creating and raising awareness and to mainstream tourism in the political agenda• Sustainability (social, economic and environment) is more important than ever,addressing issues such as energy dependency, climate change adaptation and mitigation, green economy, congestion management and risk management• Keep track of the changing consumer: more experienced and demanding customers, demographic change (ageing, migration and diversification of family structure), changing values and lifestyles, from service economy to experience economy, etc. • Enhance competitiveness in sense of shaping an adequate business environment: innovation, diversification of products, markets and segments, product development, ICT and technology in general, marketing and promotion, research, evaluation, human resources development, quality, etc.

Where to find information prepared by UNWTO?www.unwto.org => Facts & Figures
publications www.unwto.org/pub• electronic:
=> UNWTO eLibrary• hardcopy:
=> UNWTO Infoshop=> depositary libraries
Affiliate Membership: www.unwto.org/edsco/index.php

Tourism towards 2030 /Global Overview
Thank you very much for your attention!
World Tourism Organization (UNWTO)
www.unwto.org


![N t +1 /N t = r t = exp[ R m (1 - N t /K )] (1.6) =λ exp(- cN t ) (1.6a)](https://img.dokumen.tips/doc/110x75/56812f26550346895d94bb40/n-t-1-n-t-r-t-exp-r-m-1-n-t-k-16-exp-cn-t-16a.jpg)