Embed Size (px)
Citation preview

* Tel.: +44 114 2713021; fax: +44 114 2713852. E-mail address: [email protected]
SDI Paper Template Version 1.6 Date 11.10.2012 1
Prospective pilot study looking at the size and 2
variation of the blind spot scotoma in adults 3
measured on the Octopus 900 field analyser. 4
5
Martin J Rhodes1* 6
7 1Royal Hallamshire Hospital. Glossop Road, Sheffield. England. S10 2JF 8
9 10
11
ABSTRACT 12
13
Aims: Literature regarding the size of the blind spot is old and recorded on instruments no longer in production. This pilot study looks to provide normative data for the size of the visual blind spot scotoma in adults measured by the Octopus 900 kinetic perimeter. Study Design: A prospective repeated measures study involving nineteen participants. Place and Duration of Study: Ophthalmology department, Royal Hallamshire Hospital, Sheffield, between April 2012 and July 2012. Methodology: The blind spot scotoma area was measured in degrees
2 using three kinetic
targets. Two trials were conducted to assess variability across the targets. Results: The mean blind spot scotoma area decreased as target luminosity increased. The mean blind spot scotoma area was; 197.6±152.8 deg
2 with the I1e, 63.6±21.7 deg
2 with the
I2e and 33.9±6.8 deg2 with the I4e.
Agreement between the first trial and second trial for the three different forms of target luminance was examined using Bland-Altman analysis. The target I4e has the closest mean difference to zero and the I4e also has the highest precision as shown by the SD; I1e bias -1.764±3.852SD, I2e bias -0.368±0.938SD and I4e bias -0.151±0.477SD. Conclusion: This study found the mean size of the blind spot scotoma to be influenced by the luminosity of the target stimulus, with mean area (deg
2) decreasing as target luminosity
increases. This can be attributed to the blind spot’s amblyopic zone or light scattering across the refractive media of the eye. The target I4e shows the least variation between subsequent measures and would be the most reliable of the targets used for monitoring change in blind spot scotoma area over time. 14 Keywords: Kinetic Perimetry, Blind Spot, Visual Fields, Octopus 15

16
17
1. INTRODUCTION 18 19 A literature review was conducted asking the question “What is the normative size of the 20 blind spot scotoma in adults and how much do these measurements vary?” A lack of data 21 appropriate for clinical use was identified, no standard way of recording the blind spot 22 scotoma was found and measurements were recorded using equipment that is no longer in 23 production. 24
Advancements in technology have provided new equipment offering greater precision in 25 measuring the size of the blind spot scotoma. Benefits such as correcting for reaction times 26 are now incorporated in the most recent field analysers, one of which is the Octopus 900. 27
The Octopus 900 is the official successor to the Goldmann perimeter and is commonly used 28 in clinical practice to conduct perimetry in patients with neurological visual field deficit. The 29 target can be presented in a range of sizes ranging from 1/16mm
2 to 64mm
2 these are 30
represented by a roman numeral, ‘0’ being the smallest ‘V’ being the largest. The luminance 31 intensity of the targets can also be changed and these are represented numerically, ‘1’ being 32 the faintest and ‘4’ being the brightest. These numbers are further split into five levels of 33 luminosity represented by alphabetic letters; ‘a’ being the faintest and ‘e’ the brightest. 34
The Octopus 900’s advantages over the Goldmann are that of reaction time compensation 35 and the ability to standardise the speed in which the targets are moved, leading to greater 36 reliability in testing. 37
This project aims to provide normative data on the size and repeatability of the blind spot 38 scotoma as measured by the Octopus 900. The main objectives of this research project are 39 to provide: 40
i. Normative data of the blind spot scotoma size for adults. 41
ii. Variation of the size of the blind spot scotoma on repeat testing using three targets 42 of increasing luminosity I1e, I2e and I4e. 43
iii Normative data of the peripheral field using the targets I4e and I2e. 44
45
46
47
2. METHODOLOGY 48
49 A prospective repeated measures study involved nineteen participants all were employed in 50 the Ophthalmology department at the Royal Hallamshire Hospital, Sheffield. All employment 51 roles and ethnic backgrounds were given the opportunity to participate. 52
Volunteers were eligible to participate if they had a corrected visual acuity of 0.200 Log units 53 (6/9.5 Snellen equivalent) or greater and had no previous diagnosis of Idiopathic Intracranial 54 Hypertension (IIH), stroke, glaucoma or any known field defect. No participants had lid 55 abnormalities that could interfere with perimetry. If any Ocular anomalies were detected 56 during screening these were to be investigated further by the on-call Ophthalmologist. 57
This project was registered at Sheffield University and approved by the Research Ethics 58 Committee of the School of Health and Related Research (ScHARR). A sample size to 59 determine statistical power was calculated using the statistical calculator G*power 3.1[1] for 60 an ANOVA (repeated measures, between factors) measuring an effect size of 0.25 with 0.95 61 power and alpha being set to 0.05, the number of participants required for statistical power 62 was a minimum of 14. 63
The peripheral visual field was measured in both the right and left eye in degrees2 firstly 64
using the I4e and secondly the I2e moving at the speed of 5°/s, these targets were chosen 65 as they follow protocol commonly used in the United Kingdom. 66
The blind spot scotoma was similarly measured in degrees2 for the right and left eye but 67
using three target stimuli; I1e, I2e and I4e moving at the slower speed of 2°/s. Two trials 68 were conducted on the same day to assess variability across the targets, a minimum of five 69 minutes rest period was given between trials. Reaction times were corrected and appropriate 70 refractive correction was calculated in accordance with the Octopus 900 user manual [2], 71 this is important as under or over corrected prescriptions can unjustly influence the size of 72 the blind spot scotoma [3]. 73
The size of the blind spot using each of the three different targets stimuli (I1e, I2e and I4e) 74 will be shown. Repeated measures ANOVA shall be conducted on area measurements the 75 factors that shall be analysed will be; eye, dominant eye, target luminosity and trial. It may 76 be that the second recordings of the blind spot scotoma are of a smaller area due to a 77 learning experience and familiarity with the field analyser. 78
The average size of the peripheral field using the I4e and I2e shall be given in degrees2. 79
Again repeated measures ANOVA shall be conducted this time the factors considered shall 80 be; eye and target stimulus. 81
Bland-Altman tests shall also be utilised to visually compare the bias associated with plotting 82 the blind spot with a I1e, I2e and I4e target showing which gives more accurate and 83 repeatable results and that most appropriate for clinical use[4]. 84
The area of the visual field is known to be non-normally distributed, this is because the area 85 is related to the radius squared, if two people differ by a set amount along this radius, the 86 amount of radius increase has a non-linear (squared) effect on the area, a small difference 87 will become amplified. Therefore by taking the square root of the area, this problem is 88 eliminated making the data normally distributed. All statistical analysis shall be conducted on 89 the square root of the area of the blind spot scotoma [5]. 90
91 92
3. RESULTS AND DISCUSSION 93
94
3.1 Results 95 96 Of a group of approximately 100 staff, a total of 19 participants (13 females, 6 males) mean 97 age 35.3±12.3 years (range 21 – 60 years) took part. The mean visual acuity was -0.06±0.1 98 logMAR in the right eye and -0.08±0.1 logMAR in the left eye. Ten participants were 99 emmetropic, 6 were myopic (range -3.75DS – -0.75DS) and 3 were hypermetropic (range 100 +3.00DS – +0.75DS). Fourteen participants were right eye dominant and five were left eye 101 dominant. Only one volunteer was excluded, this was due to a very high myopic prescription 102 and previous retinal detachment surgery. 103

A summary of the participant data can be found in Table 1. 104 Table 1. - Summary of participant data 105 106 Participant Gender
♂=male ♀=female
Age (Years)
Dominant Eye
R = right L = left
Right Visual Acuity LogMAR
Left Visual Acuity LogMAR
Height (M)
Weight (KG)
BMI
1 ♀ 21 L 0.0 -0.3 1.68 56 19.927
2 ♂ 22 R -0.1 -0.1 1.86 70.85 20.528
3 ♀ 26 L -0.32 -0.3 1.75 68.03 22.148
4 ♀ 31 R -0.2 -0.2 1.72 72.6 24.540
5 ♀ 37 R 0.0 0.0 1.63 51 19.195
6 ♂ 29 R 0.02 0.02 1.70 109.76 37.899
7 ♀ 25 R -0.1 -0.1 1.63 51.71 19.568
8 ♀ 60 R 0.22 0.02 1.55 62.59 26.072
9 ♂ 31 R -0.1 -0.1 1.70 80.8 27.899
10 ♀ 30 R -0.1 -0.1 1.63 60.8 22.772
11 ♀ 48 R -0.1 -0.1 1.57 52.16 21.032
12 ♀ 37 L 0.0 0.0 1.55 54.43 22.673
13 ♂ 25 R -0.1 -0.12 1.78 74 23.408
14 ♀ 28 R 0.0 0.0 1.70 70.76 24.433
15 ♀ 31 L 0.0 0.0 1.80 100.9 31.025
16 ♀ 29 R -0.1 -0.1 1.60 95 37.100
17 ♂ 57 L -0.06 -0.02 1.68 73.93 26.307
18 ♂ 50 R 0.0 0.0 1.78 90.71 28.694
19 ♀ 54 R -0.1 0.0 1.57 48.98 19.750
Mean with SD
35.3 ±12.3
-0.06 ±0.1
-0.08 ±0.1
1.68 ±0.09
70.79 ±17.9
24.99 ±5.5
107 108 109 3.1.1 Blind Spot Scotomas 110 111 The mean blind spot scotoma area using the faintest target I1e was recorded for the right 112 eye (RE) and left eye (LE) on two separate occasions. Eight (42.1%) out of 19 participants 113 failed to respond to the I1e target stimulus with the RE and 3 (15.8%) out of the 19 with the 114 LE. The I2e had a much better detection rate with only one participant (5.3%) failing to 115 respond to the target stimulus with the RE using the I2e target and every participant seeing 116 the I2e target with the LE. The I4e had a better detection rate again with 100% of 117 participants identifying the I4e with either eye. A summary of the blind spot scotoma areas 118 for each target size can be found in Table 2. 119 120 121
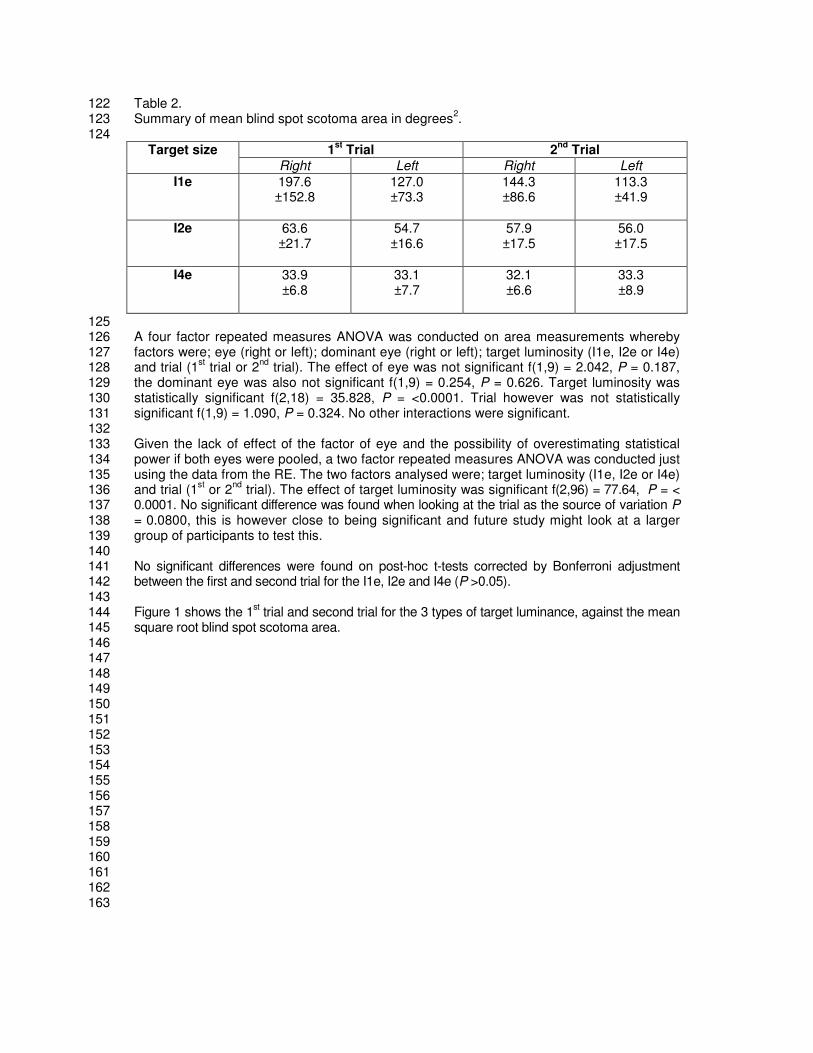
Table 2. 122 Summary of mean blind spot scotoma area in degrees
2. 123
124 Target size 1
st Trial 2
nd Trial
Right Left Right Left
I1e 197.6 ±152.8
127.0 ±73.3
144.3 ±86.6
113.3 ±41.9
I2e 63.6
±21.7 54.7 ±16.6
57.9 ±17.5
56.0 ±17.5
I4e 33.9
±6.8 33.1 ±7.7
32.1 ±6.6
33.3 ±8.9
125 A four factor repeated measures ANOVA was conducted on area measurements whereby 126 factors were; eye (right or left); dominant eye (right or left); target luminosity (I1e, I2e or I4e) 127 and trial (1
st trial or 2
nd trial). The effect of eye was not significant f(1,9) = 2.042, P = 0.187, 128
the dominant eye was also not significant f(1,9) = 0.254, P = 0.626. Target luminosity was 129 statistically significant f(2,18) = 35.828, P = <0.0001. Trial however was not statistically 130 significant f(1,9) = 1.090, P = 0.324. No other interactions were significant. 131 132 Given the lack of effect of the factor of eye and the possibility of overestimating statistical 133 power if both eyes were pooled, a two factor repeated measures ANOVA was conducted just 134 using the data from the RE. The two factors analysed were; target luminosity (I1e, I2e or I4e) 135 and trial (1
st or 2
nd trial). The effect of target luminosity was significant f(2,96) = 77.64, P = < 136
0.0001. No significant difference was found when looking at the trial as the source of variation P 137 = 0.0800, this is however close to being significant and future study might look at a larger 138 group of participants to test this. 139 140 No significant differences were found on post-hoc t-tests corrected by Bonferroni adjustment 141 between the first and second trial for the I1e, I2e and I4e (P >0.05). 142 143 Figure 1 shows the 1
st trial and second trial for the 3 types of target luminance, against the mean 144
square root blind spot scotoma area. 145 146 147 148 149 150 151 152 153 154 155 156 157 158 159 160 161 162 163

Figure 1 showing 1st trial (dark blue) and second trial (light blue) for the 3 types of target 164
luminance on the x axis, against the mean square root blind spot scotoma area on the y axis 165 166
167 168 Further post-hoc analyses were conducted to explore where significant differences occurred 169 between target luminosities. Again these were corrected using Bonferroni adjustment for 170 type I error. Figure 2 shows the square root of the blind spot scotoma in degrees for the RE, 171 significant differences occurred between all target luminosities and are illustrated with an 172 asterisk (* = Statistically significant). 173 174 175 176 177 178 179 180 181 182 183 184

Figure 2. Target size and square rooted blind spot scotoma area in deg for the RE. 185 186
187 * = Statistically significant 188 189 3.1.2 Peripheral field 190 191 The mean RE area for the peripheral visual field using the target stimulus I4e was 10446.6± 192 1058.2 deg
2, mean LE area was 10466.2±1120.7 deg
2. The mean peripheral area using the 193
target stimulus I2e was 2920.6±755.6 deg2
with the RE and 3013.7±824.3 deg2 with the LE. 194
No second trials were conducted on the peripheral field. 195 196 A two factor repeated measures ANOVA was conducted using the factors; eye (right or left) 197 and target luminosity (I2e or I4e). The effect of eye was not significant f(1,70) = 0.086, P = 198 0.770. Target luminosity proved to provide as a statistically significant factor f(1,70) = 948, P 199 = < 0.0001. The interaction of eye and target were not significant f(1,70) = 0.058, P = 0.810. 200 201 There were no significant differences between the RE and LE using the I4e and I2e 202 (P=0.160 and P=0.827 respectively), therefore post-hoc paired t-test analyses were 203 conducted between the target stimulus of the RE only. These were corrected using 204 Bonferroni adjustment for type I error. Significant differences occurred between the two 205

target stimuli (P = < 0.0001, Two-tailed, t=31.3 df=17) indicated by the asterisk on the graph 206 seen in Figure 3. 207 208 Figure 3. Visual field area for the I2e and I4e targets, right (dark blue) and left eye (light 209 blue). 210
211 212 3.1.3 Blind spot Scotoma Repeatability 213 214 Agreement between the 1
st trial and 2
nd trial for the three different forms of target luminance 215
was examined using Bland-Altman analysis. Bland-Altman plots graphically representing the 216 differences between the 1
st and 2
nd trial for each of the target stimuli, can be seen in Figure 4 217
where the difference between trials is shown on the y axis and the average of the two trials 218 is shown on the x axis for the I1e (a), I2e (b) and I4e (c). Each dot represents an individual 219 participant. Note the different scale of axis for the ordinates to give the best graphical 220 illustration of spread of variance. 221 222 223 224 225 226 227

Figure 4. Bland-Altman plots for each of the different target stimulus also demonstrating the 228 95% Limits of Agreement. 229
230

The I1e target shows the largest amount of bias (-1.764), this reduces with the I2e (-0.368) 231 and reduces still further with the I4e (-0.151). The SD of the bias follows this same pattern, 232 the I1e has a very large SD of the bias (3.852), this reduces dramatically with the I2e (0.938) 233 and then again with the I4e (0.477). Out of all the targets the I4e has the closest mean 234 difference to zero the I4e also has the highest precision as shown by the SD. 235 236 In summary the I4e target had the best detection rate followed by the I2e, then the I1e. As 237 the target luminosity increased the blind spot scotoma area decreased in size. The precision 238 of the measurements improved as the luminosity of the target increased. 239 240 An explanation for the variation found between the first and second trials especially using the 241 faintest target (I1e) can be described as multi-factoral. Primarily it has to be stated that all 242 subjective measurements are reliant on the subject’s response which may be affected by the 243 participant’s attentiveness, their prone to fatigue, and learning. It could be argued that 244 learning had an effect in reducing the blind spot scotoma area between the two trials, a trend 245 can be seen showing the second trial results measuring as slightly smaller than the previous 246 trial, however this was not calculated as being statistically significant (P = 0.0800). 247 248 The blind spot scotoma measured with the I1e showed the most variability. All tests were 249 conducted in the same order in keeping with hospital protocol. The order was; I2e, I1e and 250 then I4e, with the RE preceding the LE. To counter any fatigue or learning effects in 251 subsequent study the order in which the targets were presented to the patient should be 252 randomised. 253 254 255
256
3.2 Discussion 257 258 3.2.1 Blind spot scotoma size and target luminosity. 259 260 In this study the size of the blind spot scotoma changed depending on the luminosity of the 261 stimulus target used, this could be for a number of reasons. One explanation could be 262 related to the blind spots amblyopic zone. Traquair [6] described this blind spot amblyopic 263 zone as… 264 265
“The area of absolute blindness corresponds not to the head of the nerve (optic), but to the 266
area in which no retinal receptive elements are present, an area usually slightly larger than the nerve 267
itself. The presence of the amblyopic zone is at least partly anatomically explained by the gradual 268
rather than abrupt termination of the retinal outer layers towards the nerve. At the upper and lower 269
ends of the blind spot, narrow curve prolongations of the amblyopic zone are found which represent 270
the projections of the large retinal vessels near the optic disc, and which with care may be traced 271
some little way over the field even as far as 30°…” 272
273 The blind spot has an area of absolute blindness, and around this area is an amblyopic zone 274 that is seen to increase when plotted with smaller targets [6]. In this study the target size was 275 small and remained constant, luminosity was the factor that varied. This study shows the 276 amblyopic zone may also be extended when using fainter targets. 277 278 Bek [7] found a link between the stimulation target size and blind spot scotoma size using 279 static perimetry and interpreted this finding to be a result of “light scattering in the refractive 280 media of the eye.” Bek found that if a large target was projected within the optic nerve head 281 (an area that the target should not be seen), the target could actually be sensed by the 282 surrounding retina due to this light scattering. It could also be that target luminosity may also 283

be linked to this phenomenon, the brighter the stimulus, the more likely this scattered light is 284 to be picked up by the surrounding retina. 285 286 In summary if the target size increases (with constant luminance), or the luminosity 287 increases (with constant target size), the measurement of the scotoma reduces. This may be 288 due to light scattering around the optic nerve heads amblyopic zone with larger or brighter 289 lights being picked up by the surrounding retina. From a clinical perspective when monitoring 290 the progress of a disease through repeated measures of the blind spot scotoma it is 291 essential that the target size and luminosity remain constant or results cannot be compared. 292 293 The ability to correct the visual field for the participants reaction time (RT) is a new concept 294 in mainstream perimetry, allowing greater accuracy when assessing a participants blind spot 295 scotoma. When an RT is accounted for the size of the blind spot scotoma is reduced by an 296 amount proportional to that of the reaction time. If a participants reaction time is particularly 297 slow the blind spot is no longer exaggerated as a result of the reaction time when this 298 correction is applied. 299 300 Dolderer [8] found that correction for the subject’s RT almost halved the level of random 301 variance to allow greater repeatability of testing. Dolderer also reported high variability in 302 inter-individual response times with smaller target stimuli resulting in significantly longer RTs. 303 Each participant in this study had their RT corrected with the I2e target, the Octopus 900 304 field analyser corrects each target with one reaction time target that can be chosen by the 305 clinician. It is not possible to correct each recorded target area with its appropriate target 306 stimulus RT. For the purposes of practical application, when measuring the blind spot with a 307 single target stimulus it would be most appropriate to test the patients RTs with the target 308 corresponding to the target used to plot the blind spot scotoma. 309 310 311 3.2.2 Peripheral Field 312 313 There was no significant difference when comparing the right and the left eye with either the 314 I2e or the I4e (P=0.160 and P=0.827 respectively). However the outer peripheral field 315 measured significantly larger with the I4e than it does with the I2e (P=<0.0001). The study 316 shows that the brighter the target luminosity the wider the peripheral field becomes, this is to 317 be expected and has been found previously on the Goldmann[9]. The main purpose of 318 recording this is to establish a mean peripheral field for both targets I2e and I4e that can be 319 used as reference. 320 321 As is common to many, if not all research projects, further confidence in the outcomes of the 322 study may be gained through greater allocation of resources allowing for a larger sample 323 size and a more in depth analysis to be undertaken. The analysis of blind spot scotomas 324 may be further augmented through application of mixed methods research, bringing together 325 quantitative and qualitative elements. In particular qualitative research may aid in developing 326 effective protocol with regards to patient preference and feedback. 327 328 The pilot study identifies areas in which further research would be beneficial to gain a fuller 329 understanding of the variability in measurement of blind spot scotomas. Investigation to how 330 these targets fair with patients with Optic nerve disease needs to be conducted, specifically 331 looking for correlation between the size of the blind spot scotoma, the size of the optic nerve 332 head, and grade of papilloedema. 333 334
Visual field tests do not as a matter of course accurately measure the size of the blind spot 335 scotoma, could there be some merit in developing a programme to inform clinicians if the 336 blind spot scotoma lies outside of the normal limit? 337
338
339
4. CONCLUSION 340
341 Literature concerning the size of the normal blind spot scotoma is old and outdated. 342 Clinicians are forced to rely on information collected on instruments no longer in production 343 and with no standard unit to measure the blind spot scotoma. Additionally clinicians need to 344 have accurate information on the instruments they use to successfully monitor changes in 345 the size of the blind spot scotoma and a standardised unit of measurement needs to be 346 introduced. 347
The question that was asked by this study was “What is the normative size of the visual blind 348 spot in adults and how much do these measurements vary?” 349
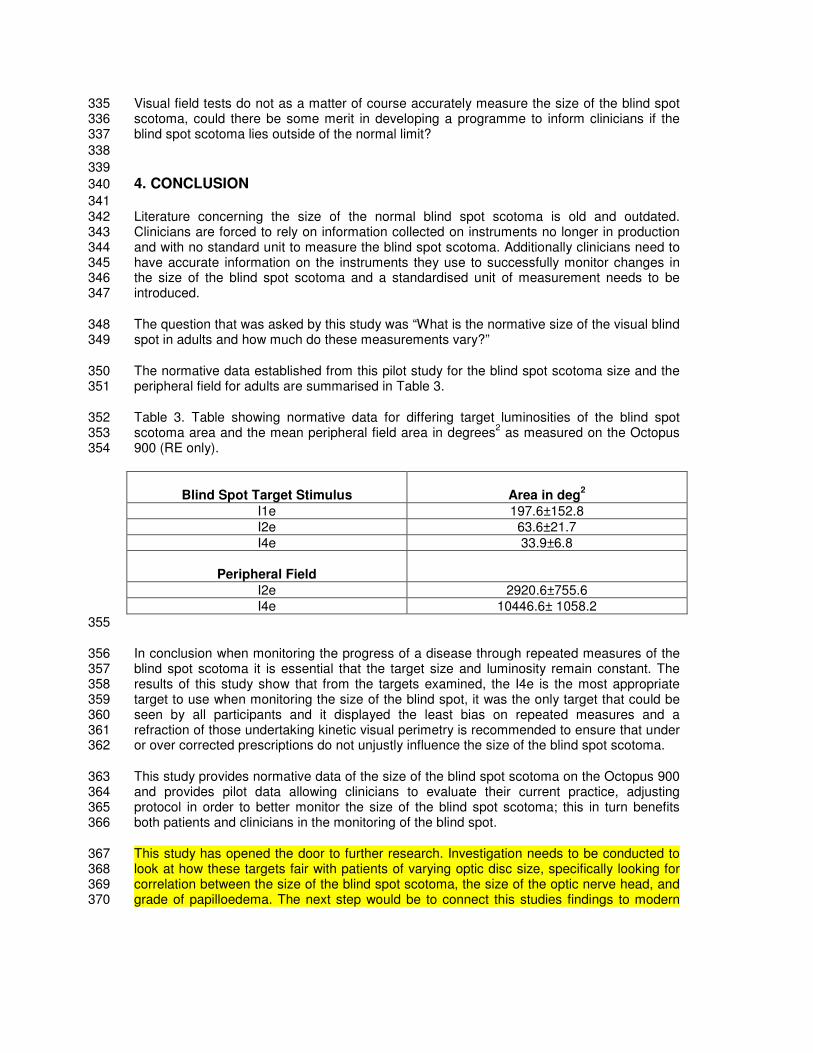
The normative data established from this pilot study for the blind spot scotoma size and the 350 peripheral field for adults are summarised in Table 3. 351
Table 3. Table showing normative data for differing target luminosities of the blind spot 352 scotoma area and the mean peripheral field area in degrees
2 as measured on the Octopus 353
900 (RE only). 354
Blind Spot Target Stimulus
Area in deg
2
I1e 197.6±152.8
I2e 63.6±21.7
I4e 33.9±6.8
Peripheral Field
I2e 2920.6±755.6
I4e 10446.6± 1058.2
355
In conclusion when monitoring the progress of a disease through repeated measures of the 356 blind spot scotoma it is essential that the target size and luminosity remain constant. The 357 results of this study show that from the targets examined, the I4e is the most appropriate 358 target to use when monitoring the size of the blind spot, it was the only target that could be 359 seen by all participants and it displayed the least bias on repeated measures and a 360 refraction of those undertaking kinetic visual perimetry is recommended to ensure that under 361 or over corrected prescriptions do not unjustly influence the size of the blind spot scotoma. 362
This study provides normative data of the size of the blind spot scotoma on the Octopus 900 363 and provides pilot data allowing clinicians to evaluate their current practice, adjusting 364 protocol in order to better monitor the size of the blind spot scotoma; this in turn benefits 365 both patients and clinicians in the monitoring of the blind spot. 366
This study has opened the door to further research. Investigation needs to be conducted to 367 look at how these targets fair with patients of varying optic disc size, specifically looking for 368 correlation between the size of the blind spot scotoma, the size of the optic nerve head, and 369 grade of papilloedema. The next step would be to connect this studies findings to modern 370

imaging data from Optical Coherence Tomography (OCT) in order to explain the variation in 371 blind spot size anatomically. It may be that a ratio of blind spot scotoma to anatomical size 372 could identify disease much more effectively. 373 374
375
ACKNOWLEDGEMENTS 376
377 The Author would like to thank Richard Wilson from the School of Health and Related 378 Research (SCHARR) for his help during the ethics process, Charlotte Codina and David 379 Buckley for their analysis and interpretation of the study data, the volunteers at the 380 Ophthalmology department from the Royal Hallamshire Hospital and finally Felicia and 381 Aurelia Rhodes for their encouragement and support in undertaking this project. No sources 382 of funding need be declared. 383 384 385
COMPETING INTERESTS 386
387 The Author declares that no competing interests exist. 388 389 390
CONSENT 391 392 The author declares that written informed consent was obtained from each study participant. 393 394
ETHICAL APPROVAL 395
396 The author hereby declares that all experiments have been examined and approved by the 397 Research Ethics Committee of SCHARR (URMS133654) and have therefore been 398 performed in accordance with the ethical standards laid down in the 1964 Declaration of 399 Helsinki. 400
401
402
REFERENCES 403
404 1 Faul, F. Statistical power analyses using G*Power 3.1: Tests for correlation and regression 405 analyses. Behavior Research Methods. 2009; 41: 1149-1160. 406
2 Haag-Streit. Octopus 900 - User Manual 2009. http://www.haag-407 streit.com/products/perimetry/octopusr-900/manuals.html . Accessed 2nd May 2012. 408
3 Corbett, JJ. Enlargement of the blind spot caused by Papilledema. American Journal of 409 Ophthalmology. 1988;105: 261-265. 410
4 Bland J,M. Statistical Methods for assessing agreement between two methods of clinical 411 measurement. Lancet. 1986;1: 307-310. 412
5 Buckley D. Action video game players and deaf observers have larger Goldmann visual 413 fields. Vision Research. 2010; 50: 548–556. 414
6 Traquair, H. The Normal Field of Vision. In: Kimpton (fifth ed). An introduction to Clinical 415 Perimetry. London, Henry Kimpton. 1948; 14-16. 416
7 Bek, T. The influence of stimulus size on perimetric detection of small scotoma. Graefe’s 417 Archive of Clinical Experimental Ophthalmology. 1989; 227: 531-534. 418
8 Dolderer, J. Scotoma mapping by semi-automated kinetic perimetry: the effects of stimulus 419 properties and the speed of subjects’ responses. Ophthalmologica Scandinavica, 2006; 84: 420 338-44. 421
9 Christoforidis, J. Volume of visual field assessed with kinetic perimetry and its application 422 to static perimetry. Clinical Ophthalmology. 2011; 5: 535–541. 423
9 Corbett, JJ. Enlargement of the blind spot caused by Papilledema. American Journal of 424 Ophthalmology. 1988;105: 261-265. 425
426
DEFINITIONS, ACRONYMS, ABBREVIATIONS 427 428 Idiopathic Intracranial Hypertension (IIH): Also known as Benign Intracranial 429 Hypertension or Psedotumor Cerebri, IIH is a neurological condition defined as an increase 430 in the intracranial pressure (ICP) around the brain, without the presence of a tumour or 431 disease. Its cause is unknown. 432
433 Perimetry: The process of using an instrument to map the extent of a persons visual field. 434 435 Scotoma: A small area of abnormally less sensitive or absent vision in the visual field, 436 surrounded by normal sight. 437 438
439