Embed Size (px)
DESCRIPTION
Â
Citation preview
Research Journal of Finance and Accounting www.iiste.org
ISSN 2222-1697 (Paper) ISSN 2222-2847 (Online) Vol 3, No 9, 2012
31
Prospect Theory: Test on Framing and Loss Aversion Effects on
Investors Decision-Making Process At the Nairobi Securities
Exchange, Kenya
Peter Mbaluka1*
, Charles Muthama2, Elizabeth Kalunda
3
1. School of Business, University of Nairobi, Kenya, P.O Box 30197, Nairobi, Kenya
2. Co-operative University College of Kenya, P. O. Box 24814-00502, Karen, Nairobi, Kenya
3. School of Business, Kimathi University College of Technology, P. O. Box 657-10100 Nyeri, Kenya
*E-mail of corresponding author [email protected]
Abstract
Twenty years of experimental and empirical research has demonstrated that markets are not as efficient as perceived
to be. Investors are not rational and risk preferences are stochastic. In addition to this, prospect theory criticized the
standard expected utility hypothesis used to describe utility and investor performance preferences. Kahneman and
Tversky in 1979 proposed a new framework to model the utility and risk preferences of investors. This study
examined investment scenarios with individual investors indicating that the process of making investment decisions
is based on the behavioral economics theory which uses the fundamental aspects of the prospect theory developed by
Kahneman and Tversky. The study tested two items: firstly framing which modifies the investment decision
depending on the perspective given to the problem and secondly loss aversion which refers to a scenario where
greater utility is lost when losing x amount of money than the utility that is gained when obtaining the exact same
amount. The study concluded that framing effects influenced the decisions made by individual investors and
individual investors had their investment decisions affected by loss aversion.
Key words: Investment decisions, prospect theory, framing effects, loss aversion, Nairobi Securities Exchange,
Kenya
Introduction
Behavioural finance is the study of the influence of psychology on the behaviour of financial practitioners and the
study of subsequent effect of markets (Aduda ,Odwour and Onwonga, 2012). Behavioral finance is focused on the
application of psychological and economic principles to investigate what happens in markets in which agents display
human limitations and complications for the improvement of financial decision-making. It is also defined as the
application of psychology in finance (Statman 2006). Behavioral finance has two building blocks namely cognitive
psychology referring to how people think and limits to arbitrage referring to predicting in what circumstances
arbitrage forces will be effective, and when they won't be (Ritter, 2003). Shefrin (2001) has a similar definition
stated as the study of how psychology affects financial decision making and financial markets.
Traditionally, finance is theorized in the notion that markets are efficient (Kalunda and Mbaluka, 2012). A market is
efficient with respect to a particular set of information if it is impossible to make abnormal profits, other than by
chance by using this set of information to formulate buying and selling decisions ( Fama, 1970). Market efficiency
means that investors cannot systematically beat the market and that security prices are rational (Kalunda and
Mbaluka, 2012). Rational prices though reflect only utilitarian characteristics, such as risk, not value-expressive
characteristics, such as sentiment (Statman 1999). The traditional finance paradigm seeks to understand financial
markets on the assumption of rationality with rationality meaning two things. First, when they receive new
information, agents update their beliefs correctly, in the manner described by Bayes’ law. Secondly, given their
beliefs, agents make choices that are normatively acceptable, as in Savage’s notion of Subjective Expected Utility
(Barberis and Thaler, 2003).
Bayesian theory argues that the probability of an event can be viewed as the degree of belief of an “ideal” person,
whose beliefs are considered efficient if they are completely subjective and are consistent and follow the basic
axioms of probability theory (Kalunda and Mbaluka, 2012). Bayesian theory provides the probabilistic framework
within which rational investment decisions should be made on the basis of all relevant information. The assumption
is that investors evaluate gambles according to the expected utility framework. Expected utility model is a highly
structured procedure for rational decision-making. Experimental work shows that people systematically violate the
Research Journal of Finance and Accounting www.iiste.org
ISSN 2222-1697 (Paper) ISSN 2222-2847 (Online) Vol 3, No 9, 2012
32
Expected utility theory when choosing among risky gambles (Barberis and Thaler, 2003). Allais (1953)
experimentally found that agents weigh outcomes and the probabilities associated with expected outcomes clearly
violating the expected utility theory which requires that expected utility functions be linear in probabilities. Rabin
and Thaler (2001), argue that expected utility takes too simplistic a view towards risk. Agents’ risk attitudes are
determined entirely by the shape, that is, concavity of the utility function.
The deficiency of expected utility theory has led to development of alternative theories by different scholars. The
non-expected utility theories include weighted expected utility theory (Chew and MacCrimmon 1979, Chew 1983),
implicit expected utility (Chew 1989, Dekel 1986), disappointment aversion (Gul 1991), regret theory (Bell 1982,
Loomes Sugden 1982), rank dependent utility theories (Quiggin 1982, Segal, 1989, Yaari 1987), and prospect theory
(Kahneman and Tversky 1979). Prospect theory contrasts the expected utility theory, which is normative rather than
descriptive.
Of the non-expected utility theories, this study used the prospect theory since it is the most promising for financial
applications (Barberis and Thaler, 2003). Tversky and Kahneman (1986) argue convincingly that normative
approaches are doomed to failure, because people routinely make choices that are simply impossible to justify on
normative grounds, in that they violate dominance and invariance. People often fail to respond rationally to new
information as they completely fail to follow the idealistic mathematical framework. Kahneman and Tversky (1979)
found that under conditions of uncertainty, human decisions depart from those predicted by standard economic
theory .Andrikopoulos, (2006) posits that behavioral finance offers alternative explanations on the key question of
why prices deviate from their fundamental values. The tendency of human beings to overreact and under-react in
certain circumstances, deviating from Bayesian optimum rational decision-making, arises from psychological biases
such as conservatism and the representativeness heuristic (Kaestner, 2005).
There is no doubt that an understanding of how investor psychology impacts on investment outcomes will generate
insights that benefit financial advisory relationship. The enhanced relationship will be a portfolio to which the
advisor can comfortably adhere while fulfilling the client’s long-term goals. The study of behavioral finance will
help understand what underlies the decisions creating investment goals by individual investors.
Statement of the Problem
Although standard finance represents a great evolution to the understanding of financial market’s mechanisms, it is
not a perfect tool. Today’s standard finance is so weighed down by anomalies that reconstructing financial theory
along behavioral lines makes sense (Statman 1999). Real financial markets are not as rational as assumed to be in
standard finance theory. Anomalies can best be wished away while heuristics are necessary shortcuts in decision
making. Harbaugh (2003) affirms that simple economic models are often poor predictors of human behavior. The
need for more detailed studies of human behavior in the process of making investment decisions cannot be
underscored in order to improve theory. Kalunda and Mbaluka (2012) in a recent study established the existence of
behavioral effects namely disposition and endowment effects pervading the investment decisions making process by
individual investors at the Nairobi Securities Exchange (NSE), Kenya. In view of this, it is necessary to establish
whether individual investors are influenced by framing and loss aversion effects as they trade at the NSE. This will
help understand investor psychology in the NSE.
Objectives of the Study
This study has two main objectives namely:
1. To test the existence of framing effects in individual investment decision-making process.
2. To identify loss aversion effects in individual investment decision-making.
This paper is organized as follows: section one is on the introduction, statement of the problem and objectives of the
study, section two holds the both theoretical and empirical literature review on prospect theory, framing and loss
aversion. Section three details the research design while section four discusses the results. Section five concludes
with the conclusion and recommendations.
Research Journal of Finance and Accounting www.iiste.org
ISSN 2222-1697 (Paper) ISSN 2222-2847 (Online) Vol 3, No 9, 2012
33
Literature Review
Prospect Theory
Prospect theory is a descriptive theory of choice under uncertainty (Ritter, 2003) .In the prospect theory preferences
of Kahneman and Tversky (1979), utility is defined not as a smoothly increasing function of the level of
consumption or wealth but in terms of changes relative to a reference level. Via a kink at the origin, the value
function also embodies loss aversion—the empirical phenomenon that losses, even small ones, are particularly
painful. Tversky and Kahneman (1986) argue convincingly that normative approaches are doomed to failure,
because people routinely make choices that are simply impossible to justify on normative grounds, in that they
violate dominance and invariance.
The value function of this theory is consistent with the way people perceive attributes such as brightness, loudness or
temperature relative to earlier levels. The interpretation of the value function allows concluding that losses hurt
more than gains satisfy, implying that decision makers will be risk averse when choosing between gains and risk
seeking when choosing between losses. Prospect theory according to Ritter (2003) focuses on changes in wealth,
whereas expected utility theory focuses on the level of wealth. Gains and losses are measured relative to a reference
point. Ritter (2003) further adds that prospect theory assumes loss aversion and incorporates framing—if two related
events occur, an individual has a choice of treating them as separate events (segregation) or as one (integration).
Kahneman and Tversky (1979) determined the weights by a function of true probabilities. People are observed to
weight an event extremely improbable as impossible to happen, and they consider the event extremely probable as
certain. Small probabilities are overweighed. People are more sensitive to differences in probabilities at higher
probability levels. A 20 percent jump in probability from 0.8 to 1 is more striking to people than a 20 percent jump
from 0.2 to 0.25. This feature has been known as the “certainty effect” While the convexity of the value function for
losses typically leads to risk seeking, the same overweighting of small probabilities introduces risk-aversion over
gambles which have a small chance of a large loss (Barberis and Thaler 2003)
Tversky and Kahneman (1974) also review the concept of anchoring. Anchoring refers to a deviation from Bayesian
beliefs, not a departure from standard preferences. In anchoring, the subject forms beliefs by adjusting from a
potentially arbitrary starting point, and the bias is that the final belief is biased toward this anchor; adjustment away
from it is insufficient. For example, Tversky and Kahneman asked subjects to guess what fraction of African
countries were members United Nations. Those who were first asked “is it more or less than 10%?” guessed a
median of 25%, while those who had been asked” is it more or less than 65%” guessed a median of 45%. Offering
payoffs for accuracy did not reduce these effects. Another example comes from Strack and Mussweiler (1997), who
asked subjects to estimate when Einstein first visited the United States. Implausible anchors like 1215 and 1992
produced effects as large as anchors of 1909 and 1939. These phenomena have been used to shed light on dividends,
earnings management, merger offer prices, equity issuance timing, hurdle rates, the cost of debt, and other patterns.
Framing
A major contribution of prospect theory is that it has helped explain why people make different choices in situations
with identical final wealth levels. The theory accommodates the effects of problem description, or of framing. Such
effects are powerful. No normative theory of choice can accommodate such behavior since a first principle of
rational choice is that choices should be independent of the problem description or representation.
Framing refers to the way a problem is posed for the decision maker. Framing posit that how a concept is presented
to individuals matters (Ritter, 2003). If information is presented positively it is received easily than negatively stated
information even if the messages have neutral effects. Ritter (2003) gives an example that restaurants may advertise
“early-bird” specials or “after-theatre” discounts, but they never use peak-period “surcharges.”
In many actual choice contexts the decision maker also has flexibility in how to think about the problem. According
to Thaler (2003) the process by which people formulate decision problems for themselves is termed as mental
accounting. This matters because in prospect theory, utility is nonlinear. One important feature of mental accounting
is narrow framing, which is the tendency to treat individual gambles separately from other portions of wealth. In
Research Journal of Finance and Accounting www.iiste.org
ISSN 2222-1697 (Paper) ISSN 2222-2847 (Online) Vol 3, No 9, 2012
34
other words, when offered a gamble, people often evaluate it as if it is the only gamble they face in the world, rather
than merging it with pre-existing bets to see if the new bet is a worthwhile addition.
Tversky and Kahneman (1986) define a frame as the form used to describe a decision problem. In traditional finance
it is assumed that the frame is irrelevant to the behavior, because it is assumed that it is transparent, but it is not
always so. Shleifer (2000) opines that when a person has difficulty seeing through an opaque frame, his decision
typically depends on the particular frame he uses.
According to Gonzalez, Dana,Koshino and Just (2004), the framing effect is observed when a decision maker’s risk
tolerance (as implied by their choices) is dependent upon how a set of options is described. Specifically, people’s
choices when faced with consequentially identical decision problems framed positively (in terms of gains) versus
negatively (in terms of losses) are often contradictory.
Loss aversion
This describes a scenario where greater utility is lost when losing x amount of money than the utility that is gained
when obtaining the exact same amount. Tversky and Kahneman (1992) suggest that in the domain of money the
people value a loss roughly twice a same size of gain. This asymmetry in the valuation is called loss aversion.
Theoretical papers such as Ang. Berkaert and Liu (2004), Barberis Huang and Thaler (2006), Berkelaar,
Kouwenberg and Post (2004), Gomes (2005), and Polkovnichenko (2005) show that if individuals are loss-averse
they either will not participate in equity markets or will allocate considerably less of their wealth to equities. If
individuals are loss-averse the potential pain from stock market declines outweighs the pleasure from gains even
with a high equity premium. As a result, loss-averse individuals choose to avoid any exposure to equity. Loss
aversion implies that individuals frame events as either gains or losses relative to a reference point. In investments,
this phenomenon is believed to manifest itself in what is known as “disposition effect”. People are observed to
realize gains too quickly in the fear that they may make a loss.
According to Prospect theory, if an individual investor is risk-averse over gains, she should sell a stock that is trading
at a gain anchored to the purchase price; and if she is risk seeking over losses she should be inclined to hold on a
stock that is trading at a loss (Kahneman and Tversky 1979). A typical explanation invokes elements of prospect
theory: the reference point is the purchase price, and the investor strains to avoid selling at a loss despite the tax
advantage to doing so. Other salient reference prices, and, importantly, ones that are common across investors, are
recent high prices, such as a stock’s all time or 52 week high, and recent low prices. Huddart, Lang, and Yetman
(2009) find that trading volume and return patterns change as recent highs are approached for seasoned issues, and
Kaustia (2004) finds that trading volume behavior changes as IPOs reach new maxima and minima.
Barberis and Thaler (2003) argue that the extent of loss aversion will influence the frequency with which investors
evaluate their portfolio and that the way investors frame gains and losses is plausibly influenced by the way
information is presented to them. Energetic investors those that evaluate their portfolio frequently say on a daily
basis are more loss averse. Consequently, they will allocate less of their wealth in equities. They call the combination
of loss aversion and frequent evaluations myopic loss aversion.
Research Methodology
The study adopted a descriptive survey design to test whether investment decisions were frame dependent and if
investors exhibited loss aversion while trading shares at the Nairobi Securities Exchange (NSE). The research was
conducted in 2008 on 100 individual investors trading shares in listed companies in the NSE. At the time of study,
there were about 750,000 account holders at the NSE (CMA, 2008) operating accounts with the Central Depository
Settlement System and 19 licensed and operational stock brokerage firms.
Five individual investors were randomly selected each from the nineteen stock brokerage firms and the public gallery
during the day’s trading. A semi structured questionnaire consisting of both open-ended and closed-ended questions
was used. The study adopted scenario analysis by simulating investment decisions to test the framing and loss
aversion effects.
Research Journal of Finance and Accounting www.iiste.org
ISSN 2222-1697 (Paper) ISSN 2222-2847 (Online) Vol 3, No 9, 2012
35
Data Analysis Procedure
The study adopted the prospect theory of Kahneman and Tversky (1979), the lead model of this study. Investment
simulations were presented to respondents to allow test if investors were affected by framing and loss aversion
effects.
The respondents were presented with two decision problems that were identical in terms of their final wealth. In the
first case, the decision problem was presented as a gain while in the second case; the problem was presented as a
loss. In each decision problem frame there were both a sure outcome and a gamble but both were identical in terms
of their final wealth. A fully rational decision maker would treat the two decision problems as identical because they
were identical when formulated in terms of states of wealth. Such a decision maker would choose either the gamble
or the sure thing in both cases. If there were inconsistent choices by the respondent, then framing effects were tested.
If respondents inconsistently choose the gamble for the negatively presented decision frame, it indicated that they
were more loss averse that is to say they weight losses more heavily than gains. Loss aversion was tested by
computing the mode of the distribution of choices made.
To verify if there were differences in the decisions made due to the differences in the framing, the chi-square Test
with alpha level=0.05 was applied.
The research analyzed the applied tests and their effect in each of the questions asked in the research as provided in
the following table.
Table 1 Framework of study activities and tests
Effect Test Objective Results indicating the existing
effect
Loss
aversion
Compare the investment decisions
under two distinct perspectives with
the same terminal wealth.
Verify if respondents
frame events as either
gains or losses and that
they weight losses more
heavily than gains
Significant number of
respondents inconsistently
choose the gamble for the
negatively presented decision
frame
(Chi square test)
Framing
Compare the investment decisions
under two distinct perspectives with
the same terminal wealth.
Verify if respondents are
influenced by the framing
of a decision problem
Significant difference among
investment decisions.
(Chi square test)
Source: Author, 2012
Data Analysis and Interpretation
The response rate was 100 % where 56% of the respondents were male and 44% were females. Majority (50%) of
the respondents had college education while 39% had university education. This suggests that many of the
respondents had a level of enlightenment that would necessary to make rational investment decisions and to respond
accordingly to changes in the market. The study revealed that majority (76%) of the respondents had been trading in
the stock market for a period of less than 5 years. This confirms that interest in stock market trading for retail
investors in Kenya is a new phenomenon.
Majority (84%) of the respondents had made share transactions not exceeding ten in the three months preceding the
study. This suggests that many of the investors did not actively trade with their stocks and 34% of the respondents
held to their stocks for a year or longer while 11.8% held on the stocks for a period between 6 months and one year.
The average stock holding period was found to be 7.81 months with a standard deviation of 6.021. this suggest that
majority of the investors are short term traders while running a risk of lost opportunities to maximize returns by
holding to shares for long without trading.
Research Journal of Finance and Accounting www.iiste.org
ISSN 2222-1697 (Paper) ISSN 2222-2847 (Online) Vol 3, No 9, 2012
36
Testing Framing Effects and Loss aversion
An hypothetical situation was posed to the respondents and they were asked to chose between A; a sure receipt of
Kshs 25,000 in addition to Kshs 100, 000 already guaranteed and B; a 50% chance to receive an extra Kshs 50,000
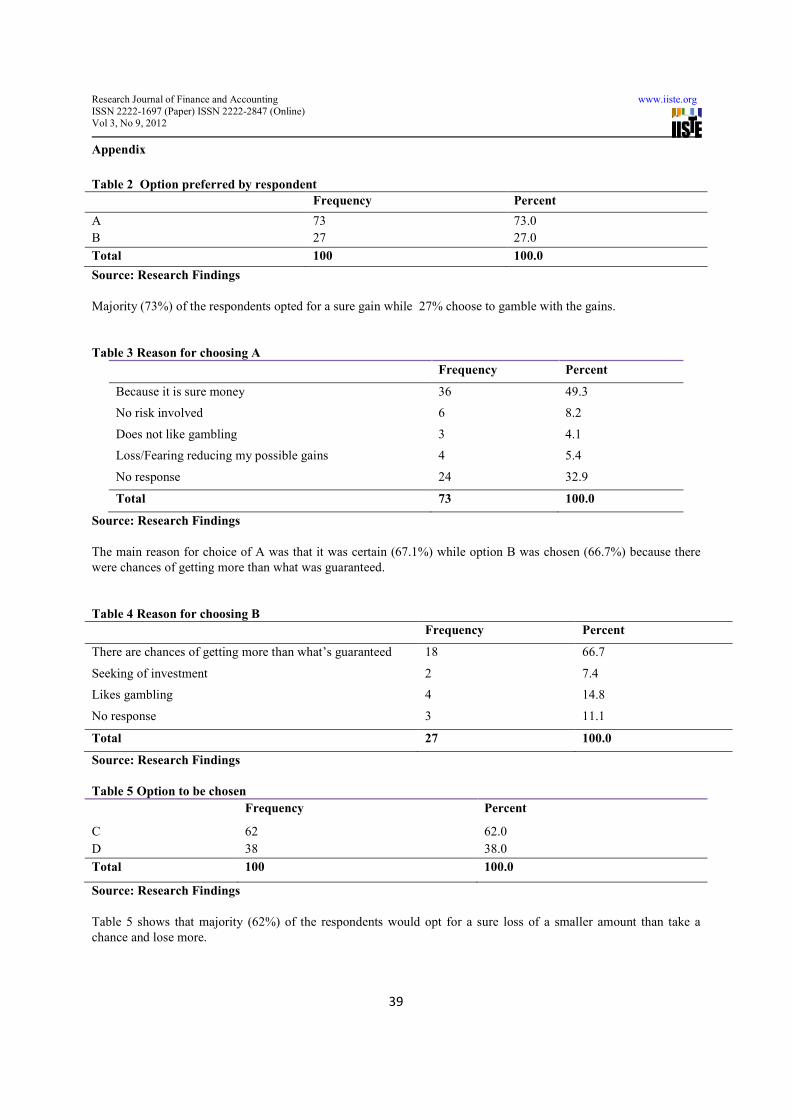
and 50% chance to receive nothing extra. The findings presented in Table 2 shows that majority (73%) of the
respondents opted for a sure gain while only 27% chose to gamble with the gains.
The respondents were tested for reasons behind their choices (Tables 3 and 4). The main reason for choice of A was
that it was certain (67.1%). This shows that many respondents would prefer sure gains rather than to gamble. This
shows that most respondents are risk averse with gains. On the contrary, the main reason given by those choosing
option B (66.7%) was that they stood chances of getting more than what was guaranteed. This is however a financial
illusion.
A similar scenario as the one above was presented but this time the choices were between C; a sure loss of Kshs
25,000 from Kshs 150, 000 already given and B; a 50% chance loss of Kshs 50,000 and 50% chance to lose nothing.
Results are as shown in Table 5. Majority (62%) of the respondents would opt for a sure loss of a smaller amount
than take a chance and lose more. This demonstrates a high degree of risk aversion among the respondents.
When tested on continuity or consistency of their choices when framing was changed (Table 6) 74.0% of
respondents who chose option A continued to select the sure loss choice, option C while a minority 26.0% reversed
their choices and chose option D. Similarly,70.4% of respondents who selected option B, the uncertain gain, also
selected option D , the uncertain losses while 29.6% reversed their choices and selected the sure loss, option C.
To test whether the shifting of choices is statistically significant, a chi-square test was run .The chi-square test results
(table 7) revealed that the differences between the two decision frames were significant at p<0.05. This shows that
the respondents would reverse their decisions when the decision problems are presented differently. These
inconsistent choices are statistically significant. This is consistent with the findings of Kahneman and Tversky
(1986) that decisions may vary according to framing, Gonzalez, et al. (2004), that people’s choices when faced with
consequentially identical decision problems framed positively (in terms of gains) versus negatively (in terms of
losses) are often contradictory.
Analysis on respondents changing combination by preferred choice revealed that 82.2% of the respondents that
would choose option A compared to 63% that would choose option B would not change the portfolio combination.
The chi-square (table 8) results indicate that the differences were statistically significant at p<0.05. The results
clearly show that respondents that were risk averse over gains were less likely to make changes in their investment
portfolio in the stock market..The findings generally show that respondents that would opt for a sure loss were less
likely to change the combination compared to those that would gamble with the loss. It reiterates the finding that the
risk-averse investors were more likely to hold on to their badly performing investment at the stock market rather than
make changes they are not sure would reverse the trend.
However, the findings do not directly show that investors as risk seeking over losses since choice D (uncertain loss)
was observed to be less popular than choice C (sure loss). But, the findings in Table 8, that respondents made
statistically significant inconsistent choices between the decision problems framed positively (in terms of gains) and
negatively (in terms of losses) points to two interesting concepts. First, investors’ decisions are frame dependent and
secondly that investors weight losses more heavily than gains. This is framing and loss aversion effects respectively.
These findings are consistent with the findings of Kahneman and Tversky (1979) that loss-averse individuals frame
events as either gains or losses relative to a reference point, and weight losses more heavily than gains.
Summary, Conclusion and Recommendations.
The study findings show that investors’ decision making is not as rational as envisaged under standard finance
theory. The study established that investors’ decisions are influenced frame dependent and that investors are loss-
averse.
The study found framing effects as playing a significant part in investment decision making process by individual
investors at the NSE. The study found out that 26.0% of respondents who choose the sure gain reversed their choices
and gambled with losses whereas 29.6% of respondents, who gambled with gains, reversed their choices and selected
the sure loss. These inconsistent choices are statistically significant at p<0.05. The findings show that the
respondents would reverse their decisions when the decision problems are presented differently.
Research Journal of Finance and Accounting www.iiste.org
ISSN 2222-1697 (Paper) ISSN 2222-2847 (Online) Vol 3, No 9, 2012
37
Further comparison with volume of funds invested in assets shows that respondents who were risk averse over gains
were less likely to make changes in their investment portfolio in the stock market. It also shows that respondents who
would opt for a sure loss were less likely to change the combination compared to those that would gamble with the
loss.
A closely tied behavioral effect to framing effects is loss aversion .The study found loss aversion as respondents
made statistically significant inconsistent choices between the decision problems framed positively (in terms of
gains) and negatively (in terms of losses). They were found to weight losses more heavily than gains.
References
Aduda J, Odera , E.R. and Onwonga M, 2012,The Behaviour and Financial Performance of Individual Investors in
the Trading Shares of Companies Listed At the Nairobi Stock Exchange, Kenya. Journal of Finance and
Investment Analysis, vol.1, no.3, 2012, 33-60.
Andrikopoulos, P. (2006) “Modern finance vs. Behavioural finance: An Overview of Key Concepts and Major
Arguments”, Working Paper, Leicester Business, De Montfort University
Barberis, N. and Thaler R.H., (2003) “A Survey of Behavioral Finance” “A Handbook of the Economics of
Finance” edited by G.M. Constantinides, M. Harris and R. Stulz, Elsevier Science B.V. Amsterdam, North
Holland.
Bell D. (1982), “Regret in Decision Making Under Uncertainty,” Operations Research 60 961-981
Berkelaar, A., Kouwenberg, R., and Post, T., 2004. “Optimal Portfolio Choice Under Loss Aversion”, Review of
Economics and Statistics, 86, 973-987.
Chew S. (1983), “A Generalization of Quasilinear Mean with applications to the Measurement of Income Inequality
and Decision Theory Resolving the Allias Paradox,” Econometrica 51 1065-1092
Chew S. (1989), “Axiomatic Utility Theories with Betweenness Property” Annals of operations Research 19 273-98
Chew S. and MacCrimmon (1979), “Alpha-nu Choice Theory. An Axiomatization of Expected Utility,” Working
Paper. University of British Columbia
Dekel (1986), “Axiomatic Characterization of Preferences Under Uncertainty: Weakening the Independence
Axiom,” Journal of Economic Theory 40 304-318
Fama, E. F. (1970): “Efficient Capital Markets: A review of Theory and Empirical Work”, Journal of
Finance 25, 2: 383-417, May.
Gomes, F.J., 2005. Portfolio Choice and Trading Volume with Loss-Averse Investors, Journal of Business 78, 675-
706.
Gonzalez, C., Dana J., Koshino H. and Just M. (2005): “The framing effect and risky decisions: Examining
cognitive functions with fMRI”. Journal of Economic Psychology, Vol.26, No. 1, pp.1
Gul F. (1991), “A Theory of Disappointment in Decision Making Under Uncertainty,” Econometrica 59 667-686
Harbaugh R. (2003). “Skill signaling, prospect theory, and regret theory”.Claremont, CA: Claremont Colleges,
(Working Papers; 03).
Research Journal of Finance and Accounting www.iiste.org
ISSN 2222-1697 (Paper) ISSN 2222-2847 (Online) Vol 3, No 9, 2012
38
Huddart, Steven J., Mark H. Lang, and Michelle Yetman (2009), “Volume and Price Patterns around a Stock’s 52-
Week Highs and Lows,” Management Science, 55 (January), 16-31
Kaestner, M. (2005) ‘Anomalous Price Behavior Following Earnings Surprises: Does Representativeness Cause
Overreaction?’, Working Paper, CEROM, University of Montpellier, March.
Kahneman, D., Tversky A. (1979): “Prospect Theory: An analysis of decision under risk”. Econometrics, Vol. 47,
pp. 263-292.
Kalunda,E.N and Mbaluka P.K, 2012, Test of Endowment and Disposition Effects under Prospect Theory on
Decision-Making Process of Individual Investors at the Nairobi Securities Exchange, Kenya. Research
Journal of Finance and Accounting Vol. 3, No 6, 2012,pp 157-171.
Kaustia, Markku, (2004) “Market –wide Impact of the Disposition Effect: Evidence from IPO Trading Volumes,
Journal of Financial markets”, 7: 2, 207-35
Loomes G. Sugden R. (1982), “Regret Theory. An Alternative Theory to Rational choice Under Uncertainty,” The
Economic Journal 92 805-824
Polkovnichenko, V., 2005, “Household Portfolio Diversification: A Case for Rank- Dependent Preferences”, Review
of Financial Studies 18, 1467-1501.
Quiggin J. (1982), “A Theory of Anticipated Utility,” Journal of Economic Behavior and Organization 3 323-43
Ritter, J. (2003), Behavioral Finance, Pacific-Basin Finance Journal Vol. 11, No. 4, pp. 429-437.
Segal U. (1987), “Some Remarks on Quiggin Anticipated Utility,” Journal of Economic Behavior and Organization
3 145-54
Segal U. (1989), “Anticipated Utility. A Measure Representation Approach,” Annals of operations Research 19 359-
73
Shefrin, H. (2000). Beyond Greed and Fear: Understanding Behavioral Finance and the Psychology of Investing,
Boston MA: Harvard Business School Press.
Shleifer, A. (2000): Inefficient Markets, Oxford: Oxford University Press
Statman, M. (1999): “Behavioural Finance: Past Battles And Future Engagements”
Strack, F., & Mussweiler, T. (1997). Explaining the enigmatic anchoring effect: Mechanisms Of Selective
Accessibility. Journal of Personality and Social Psychology, 73, 437–446.
Thaler, R. (2003): Advances in Behavioral Finance II, New York: Russell Sage.
Tversky A. and Kahneman D.(1986). “Rational choice and the framing of decisions” Journal of Business, Vol. 59 pp
251-278
Yaari M, (1987), “The Dual Theory of Choice Under Risk,” Econometrica 5 95 115.
Research Journal of Finance and Accounting www.iiste.org
ISSN 2222-1697 (Paper) ISSN 2222-2847 (Online) Vol 3, No 9, 2012
39
Appendix
Table 2 Option preferred by respondent
Frequency Percent
A 73 73.0
B 27 27.0
Total 100 100.0
Source: Research Findings
Majority (73%) of the respondents opted for a sure gain while 27% choose to gamble with the gains.
Table 3 Reason for choosing A
Frequency Percent
Because it is sure money 36 49.3
No risk involved 6 8.2
Does not like gambling 3 4.1
Loss/Fearing reducing my possible gains 4 5.4
No response 24 32.9
Total 73 100.0
Source: Research Findings
The main reason for choice of A was that it was certain (67.1%) while option B was chosen (66.7%) because there
were chances of getting more than what was guaranteed.
Table 4 Reason for choosing B
Frequency Percent
There are chances of getting more than what’s guaranteed 18 66.7
Seeking of investment 2 7.4
Likes gambling 4 14.8
No response 3 11.1
Total 27 100.0
Source: Research Findings
Table 5 Option to be chosen
Frequency Percent
C 62 62.0
D 38 38.0
Total 100 100.0
Source: Research Findings
Table 5 shows that majority (62%) of the respondents would opt for a sure loss of a smaller amount than take a
chance and lose more.
Research Journal of Finance and Accounting www.iiste.org
ISSN 2222-1697 (Paper) ISSN 2222-2847 (Online) Vol 3, No 9, 2012
40
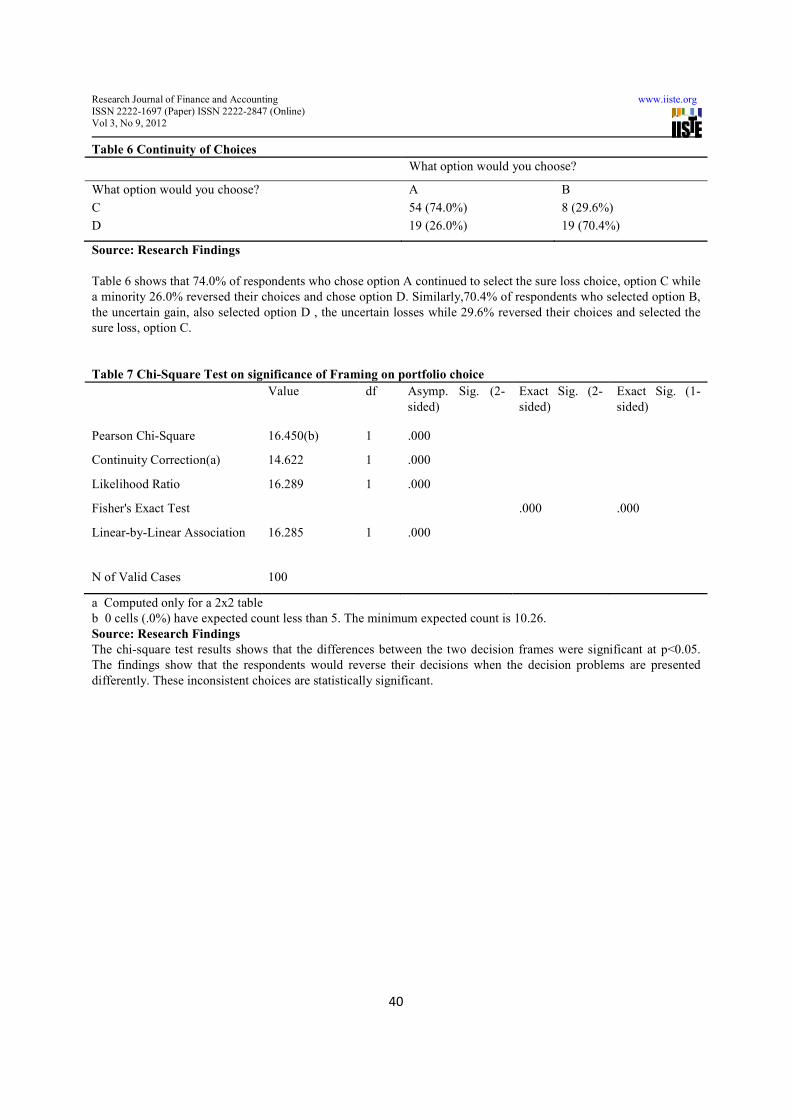
Table 6 Continuity of Choices
What option would you choose?
What option would you choose? A B
C 54 (74.0%) 8 (29.6%)
D 19 (26.0%) 19 (70.4%)
Source: Research Findings
Table 6 shows that 74.0% of respondents who chose option A continued to select the sure loss choice, option C while
a minority 26.0% reversed their choices and chose option D. Similarly,70.4% of respondents who selected option B,
the uncertain gain, also selected option D , the uncertain losses while 29.6% reversed their choices and selected the
sure loss, option C.
Table 7 Chi-Square Test on significance of Framing on portfolio choice
Value df Asymp. Sig. (2-
sided)
Exact Sig. (2-
sided)
Exact Sig. (1-
sided)
Pearson Chi-Square 16.450(b) 1 .000
Continuity Correction(a) 14.622 1 .000
Likelihood Ratio 16.289 1 .000
Fisher's Exact Test .000 .000
Linear-by-Linear Association 16.285 1 .000
N of Valid Cases 100
a Computed only for a 2x2 table
b 0 cells (.0%) have expected count less than 5. The minimum expected count is 10.26.
Source: Research Findings
The chi-square test results shows that the differences between the two decision frames were significant at p<0.05.
The findings show that the respondents would reverse their decisions when the decision problems are presented
differently. These inconsistent choices are statistically significant.

Research Journal of Finance and Accounting www.iiste.org
ISSN 2222-1697 (Paper) ISSN 2222-2847 (Online) Vol 3, No 9, 2012
41
Table 8 Chi-Square Test on significance of Risk aversion on portfolio choice
Value df
Asymp. Sig. (2-
sided)
Exact Sig. (2-
sided)
Exact Sig. (1-
sided)
Pearson Chi-Square 4.115(b) 1 .043
Continuity Correction(a) 3.101 1 .078
Likelihood Ratio 3.864 1 .049
Fisher's Exact Test .060 .042
Linear-by-Linear
Association 4.074 1 .044
N of Valid Cases 100
a. Computed only for a 2x2 table
b. 0 cells (.0%) have expected count less than 5. The minimum expected count is 6.21.
Source: Research Findings
The chi-square results (Table 8) indicate that the differences in choice change were statistically significant at p<0.05.
The results clearly show that respondents that were risk averse over gains were less likely to make changes in their
investment portfolio in the stock market.
This academic article was published by The International Institute for Science,
Technology and Education (IISTE). The IISTE is a pioneer in the Open Access
Publishing service based in the U.S. and Europe. The aim of the institute is
Accelerating Global Knowledge Sharing.
More information about the publisher can be found in the IISTE’s homepage:
http://www.iiste.org
CALL FOR PAPERS
The IISTE is currently hosting more than 30 peer-reviewed academic journals and
collaborating with academic institutions around the world. There’s no deadline for
submission. Prospective authors of IISTE journals can find the submission
instruction on the following page: http://www.iiste.org/Journals/
The IISTE editorial team promises to the review and publish all the qualified
submissions in a fast manner. All the journals articles are available online to the
readers all over the world without financial, legal, or technical barriers other than
those inseparable from gaining access to the internet itself. Printed version of the
journals is also available upon request of readers and authors.
IISTE Knowledge Sharing Partners
EBSCO, Index Copernicus, Ulrich's Periodicals Directory, JournalTOCS, PKP Open
Archives Harvester, Bielefeld Academic Search Engine, Elektronische
Zeitschriftenbibliothek EZB, Open J-Gate, OCLC WorldCat, Universe Digtial
Library , NewJour, Google Scholar