Embed Size (px)
Citation preview

PROPULSION PERFORMANCE OF A MICROCAVITY DISCHARGE DEVICE
BY
MARK LAWRENCE DE CHADENEDES
THESIS
Submitted in partial fulfillment of the requirements
for the degree of Master of Science in Aerospace Engineering
in the Graduate College of the
University of Illinois at Urbana-Champaign, 2011
Urbana, Illinois
Adviser:
Professor Rodney L. Burton

ii
Abstract
This work explores the requirements for an effective nanosatellite propulsion system. A
candidate system is proposed in the form of a microcavity discharge device modified for use as
an electrothermal thruster, called a MCD thruster. Development of the MCD thruster was
primarily experimental in nature, although computational modeling provided validation and
suggested future development paths. Three types of tests were performed to validate the
performance of the MCD thruster. Thrust measurements validated the performance of an
integral supersonic nozzle and provided an estimate of the thrust coefficient obtainable in a fully
developed system. Paschen minimum breakdown measurements provided insight into the
fundamental physics of the MCD thruster and suggested an optimal voltage amplitude. Heating
and thermal efficiency tests indicated the MCD thruster is capable of meeting the performance
requirements for a nanosatellite propulsion system.

iii
Acknowledgements
I would like to thank my advisor, Dr. Rodney Burton, for his support and instruction over the
past two years. Additionally, thanks and recognition are due to Dr. Gary Eden and Dr. Sung-Jin
Park, whose years of research into Microcavity Discharge devices have made this project
possible. I would also like to thank all those who have assisted in the testing, fabrication, and
modeling of the thruster: Julia Laystrom-Woodard, Drew Ahern, Steven Garrett, Gabe
Benavides, John Alaimo, Vicky Shikova, Dr. David Carroll, Dr. Jin-Hoon Cho, Je Kwon Yoon,
Hariswaran Sitaraman, and Dr. Laxminarayan Raja. Finally I would like to thank my parents
who have been supportive all throughout the process of researching and writing this thesis.
This work has been sponsored by the United States Air Force Office of Scientific Research,
Grant AF FA9550-09-1-0161. Dr. Mitat Birkan is the Program Manager.

iv
Table of Contents
Nomenclature .................................................................................................................................. v
Chapter 1 Introduction ............................................................................................................... 1
1.1 Requirement for a Compact and Efficient Thruster ......................................................... 1
1.2 Development Effort ........................................................................................................ 14
Chapter 2 Theory of Operation ................................................................................................ 18
2.1 Physics of Microcavity Discharges ................................................................................ 18
2.2 Thrust Equations ............................................................................................................ 20
Chapter 3 Technical Approach ................................................................................................ 27
3.1 Experimental Setup ........................................................................................................ 27
3.2 Experimental Procedure ................................................................................................. 35
Chapter 4 Experimental Results .............................................................................................. 46
4.1 Thrust Measurements ..................................................................................................... 46
4.2 Paschen Breakdown Testing .......................................................................................... 49
4.3 Heating and Thermal Efficiency Measurements ............................................................ 54
Chapter 5 Conclusion .............................................................................................................. 63
5.1 Summary ........................................................................................................................ 63
5.2 Recommendations and Future Work .............................................................................. 65
References ..................................................................................................................................... 67
Appendix A- Thruster and Electrode Fabrication ......................................................................... 70
Appendix B- Computational Modeling ........................................................................................ 72

v
Nomenclature
Efficiency
Specific impulse
Watts
Velocity
Change in velocity
Thrust
Time
Mass or meters
Power
Propulsive Power
Velocity
Exhaust velocity
Power fraction
Cold exhaust velocity

vi
Mass flow rate
Isobaric specific heat
Temperature
Stagnation temperature
Local wall heat losses
Local wall shear stress
Friction coefficient
Density
Acceleration due to gravity
Total heat losses
Specific heat ratio
Gas constant
Reynolds number
Diameter or separation distance
Thrust Coefficient
1
Chapter 1 Introduction
1.1 Requirement for a Compact and Efficient Thruster
A continuing problem in the utilization and development of space-based technologies remains
the high costs of launching a payload into orbit. While the commonly accepted figure of
approximately $10,000 per pound to Low Earth Orbit (LEO) is not entirely accurate, costs still
remain in the range of $2000-$5000/lb [1] with increasing costs for Geosynchronous Earth Orbit
(GEO), Geosynchronous Transfer Orbits (GTO), and High Earth Orbit (HEO). Although recent
developments in launch vehicle technology have the potential to greatly decrease the cost of
delivering a significant payload to orbit, for any small to medium sized institution such costs are
still prohibitively high. One way to reduce these costs is simply to launch a very small payload,
often in the form of satellites massing less than 10 kg. With the development of the Cube Sat
specification [2] and other similar micro-, nano-, and picosatellite standards (indicating satellites
of mass < 100 kg, 10 kg, and 1 kg respectively) new options have emerged for small scale
satellite missions. The main advantage of these small satellites is the fact that their low mass
allows them to “piggy back” on the launch vehicle of a larger payload, greatly reducing launch
costs. In addition, because of their mass and volume restrictions nanosatellites have a relatively
simple design, and they can be and often are designed and assembled by teams of university
students. Unfortunately while nanosatellites are effective tools for teaching and performing
limited-scale science missions, the unavailability of a suitable thruster remains an impediment.
A common limitation encountered in mission planning for nanosatellites is the lack of an
efficient and compact propulsion system. Usually, nanosatellites are deployed in LEO or near-
LEO and tend to be jettisoned while the launch vehicle transitions to the deployment orbit for its
2
main payload. [3] This can lead to problems with attitude control, orbit stabilization, and even
orbit degeneration if the initial deployment goes wrong (for the CubeSat specification, the
satellites are launched out of the carrier pod by a compressed spring). Any one of these
problems can irreversibly harm a nanosatellite mission if there is no way to correct the situation,
which can make satellite deployment a “do-or-die” proposition. In order to fully utilize the
potential of and to prolong the usable mission time of a nanosatellite a propulsion system is a
necessary component. However, since the size and system capacity of nanosatellites are
extremely limited, any propulsion system employed by nanosatellites must be both extremely
compact and highly efficient.
1.1.1 Nanosatellite Application
The intended primary application for the MCD thruster is nanosatellites (satellites of mass < 10
kg), such as those designed to the Cube Sat specification. The MCD thruster is especially suited
for operation on small satellites for several reasons which will be described later in this section.
As with the development of any propulsion system, the performance requirements must first be
established.
The question at issue is what range of efficiency and specific impulse are appropriate for a
nanosatellite electric micropropulsion system. Currently a number of EP systems have been
successfully deployed including the pulsed plasma thruster (10% η, 1000 s Isp); the resistojet
(50%, 300 s); the Hall thruster (50%, 2000 s); and the ion thruster (70%, 3000 s). Other EP
systems in advanced development are the colloid thruster (30%, 700 s); and the FEEP thruster
(95%, 6000 s). One important note is that since available space and power is extremely limited
onboard, nanosatellite propulsion systems have different requirements than the systems typically
installed on conventional satellites or spacecraft. This limited power situation is a critical

3
component of nanosatellite propulsion, since it restricts the types of thrusters that may be
selected. Due to scaling factors, both electrostatic- and electromagnetic-type thrusters require
either much higher constant power levels (ion, Hall effect) than a nanosatellite is capable of
providing, or a power storage array, often in the form of capacitors (MPD‟s), that dwarfs the size
never mind the capacity of a nanosatellite. Examples include Warner and Martinez-Sanchez‟s [4]
miniature Hall effect thruster design with a nominal power of 200 W, far in excess of the 5-25 W
available on a nanosatellite bus or a power storage array and the gallium electromagnetic (GEM)
thruster developed by Thomas at UIUC [5] which has a capacitor array weighing some 500 lbs.
Therefore, the available power supply of a nanosatellite necessarily restricts the choice of an
electric propulsion system to electrothermal-type thrusters. A brief summary of currently
available small-scale electrothermal thrusters can be seen in Table 1.1.
As noted previously, propulsion selection for nanosatellites depends on the propulsion capability
as expressed in terms of the maneuver time and the required orbital maneuver ∆V, as well as on
the mass and volume available for the propulsion system on the nanosatellite. Since
nanosatellite mass and volume requirements are usually strictly specified, a 1U CubeSat for
example has dimensions of 10 x 10 x 10 cm with a mass of 1 kg, they are often inflexible design
parameters when dealing with nanosatellite development. Thus the maneuver capability
requirements are necessarily the only flexible values in the system design parameter space. The
maneuver time requirement is due to the limited lifetime of nanosatellites, and the factors that
determine a suitable maneuver time will be dealt with in subsequent sections. The ∆V
requirement is conventional in nature, and the necessary magnitude can be found without
difficulty.

4
Table 1.1: Comparison of Electrothermal Thrusters
Thruster Type Propellant Efficiency Isp [s] Comment
High Power
Arcjet
Ammonia 28% 780 26 kW AF ESEX in-space [6]
Low Power
Arcjet
Hydrazine 36% 435 500 W. Discharge is unstable,
inefficient at low power levels
[7]
Low Power
Microwave
Helium 5% 180 14 W, large wall loss [8]
Microwave
Microthruster
Argon 9% 80 10 W, large wall loss [9]
High Power
Resistojet
N2, Helium 84% 100-200 300 W, long warm-up [10]
Microresistojet N2, Helium 20-40% 100-200 1 W, large heat loss, long
warm-up [11]
Microcavity
Discharge
Ne, N2, Ar 50-70% 100-400 1 W per cavity, small wall
loss [12]
5
The approximate range of specific impulse appropriate for nanosatellite microthrusters is found
by writing a simplified version of the equation describing the maneuver time t required to
achieve a velocity change ∆V, where:
⁄ (1.1)
The ∆V equation is approximate because, for simplicity, the satellite mass is taken as constant
during the maneuver, i.e. only a small mass fraction of fuel is consumed.
The exhaust energy equation is used to define the thrust efficiency as the ratio of net thrust
power to propulsive power :
(
)
(1.2)
Here the cold thrust power (
)
is the exhaust power without thruster heating.
For many electrostatic or electromagnetic propulsions systems including ion thrusters, Hall-
effect thrusters, and PPTs the cold thrust power is small or negligible, but for electrothermal
thrusters it is approximately independent of thruster heating. The thrust efficiency is then:
(
)
(
)
(1.3)
where is the power fraction ⁄ , defined in terms of the propulsive power , and the
maximum nanosatellite bus power produced by the solar panels. Typically, , but
is possible with batteries and deployable solar panels.

6
For a typical electrothermal case where [11] the maneuver time becomes:
⁄ (1.4)
This equation for maneuver time shows that for a given , reduced maneuver time requires
low specific impulse, high efficiency, high power fraction, and high specific power ⁄ . For a
typical rapid response system we have and ⁄ . [13] To summarize:
1. For maximum nanosatellite mission capability, it is always desirable to maximize
efficiency η, power fraction , and specific power P⁄m, recognizing that η, , and P⁄m
have limited range.
2. For a desired maneuvering capability ∆V, and thrust time t, the specific impulse is
determined.
To find the maneuver capability in terms of specific impulse and maneuver time, the
maneuver time equation is rewritten:
⁄
(1.5)
This equation, showing that the introduction of a constrained maneuver time gives varying
inversely with Isp is counterintuitive, in that high interplanetary missions are high specific
impulse. The conclusion is that, in order to minimize orbit transfer times, more maneuver
capability is available for propulsion systems with low exhaust velocity and specific impulse.
Insisting incorrectly on a high Isp incurs either a large maneuver time or a limited nanosatellite
capability.

7
The next logical question is the appropriate maneuver time for a nanosatellite. Since low-cost
nanosatellites have a limited design life (~1 year) in a rapid response environment, it is not
useful for maneuver times to be on the order of weeks or months given the delayed response,
high mission control support costs and long satellite downtimes associated with such durations.
It is more reasonable that the time to perform a maneuver should be measured in days. Table 1.2
gives some typical values of per day as a function of Isp for a maneuverable nanosatellite. It is
assumed that , ⁄ , , and that the desired time for a single
maneuver is 1.0 days. The results of Table 1.2 are also plotted in Figure 1.1
8
Table 1.2: NanosatellitePropulsion Capability for ηϕ = 0.50 and P/m = 1 W/kg.
Thruster Type Propellant Efficiency Isp [s] Comment
High Power
Arcjet
Ammonia 28% 780 26 kW AF ESEX in-space [6]
Low Power
Arcjet
Hydrazine 36% 435 500 W. Discharge is unstable,
inefficient at low power levels
[7]
Low Power
Microwave
He 5% 180 14 W, large wall loss [8]
Microwave
Microthruster
Ar 9% 80 10 W, large wall loss [9]
High Power
Resistojet
N2, He 84% 100-200 300 W, high h, long warm-up
[10]
Microresistojet N2, He 20-40% 100-200 1 W, large heat loss, long
warm-up [11]
Microcavity
Discharge
Ne, N2, Ar 50-70% 100-400 1 W per cavity, small wall
loss [12]

9
Figure 1.1: Operating envelope for nanosatellite propulsion. Maneuver time is one day, requiring high thrust and reducing specific impulse to the electrothermal range.
From Table 1.2 and Figure 1.1, the “sweet spot” for nanosatellite orbital maneuvers (shaded
region) is in the Isp range of 100 – 400 s, where is relatively large, but the fuel fraction is
reasonably small. For an Isp of 50 s, typical of cold gas thrusters, is high but the fuel fraction
is too large. For Isp > 2000 s, the per day is too small to be useful in time-constrained
maneuvers. The colloid thruster at 700 s and 30% efficiency [14] could eventually be considered
assuming significant improvements in efficiency and system volume, but is presently not
competitive. Furthermore, it was noted that a nanosatellite propulsion system could operate from
batteries. For a 5 kg, 5 W nanosatellite operating for one day, the required energy is 432 kJ =
120 W-hr. Lithium-ion batteries of this size would have a mass of about 1 kg, or 20% of the
10
satellite mass, making battery operation possible. Batteries could be used in conjunction with
photovoltaic cells to increase power and decrease maneuver time, effectively providing .
Electrothermal thrusters can in principle operate at high efficiency at low Isp. They have no
inherent requirement for highly ionized propellant, which can be made sufficiently conductive
with an ionization fraction of 10-3
– 10-6
and are easily designed with nozzles having Reynolds
numbers of sufficient magnitudes to avoid excessive wall losses. Additionally, in their powered
state they offer sufficient thrust and Isp gains to compensate for the additional mass and power
requirements over traditional cold-gas thrusters (it should also be noted that conventional
electrothermal thrusters can serve as cold-gas thrusters should the need arise). Finally,
electrothermal thrusters are simple in nature with few complex parts, thus eliminating the need
for redundant or over-designed components thereby saving valuable system mass. The
combination of these features makes them ideal propulsion systems for nanosatellites: compact,
efficient, robust, and with high relative thrust. The study by A. Baker et al [3] gives a number of
different mission profiles for low-cost nanosatellites utilizing either cold-gas or low power
electrothermal thrusters, giving a good indication of the feasibility of such a mission and
confirming electric propulsion as a viable option for nanosatellites.
1.1.1.1 The Microcavity Discharge Thruster
The results of Table 1.1, Table 1.2 and equation (1.3) demonstrate that a low power, low Isp
electrothermal thruster capable of a relatively high level of thrust can be used to maximize the
usable deployment time of a typical nanosatellite. Recent advances in microcavity discharge
(MCD) technology have provided a possible candidate for this role in the form of the
Microcavity Discharge thruster. [3] The MCD thruster (see Figure 1.2) is an extremely small-
11
scale electrothermal thruster which utilizes a capacitively coupled dielectric barrier plasma
discharge as the primary heating mechanism. The fundamental structure of the MCD thruster is
two aluminum foils coated in a nanoporous aluminum dioxide dielectric layer, where the
nanoporous Al2O3 layer has a honeycomb-like composition. A microcavity of approximately
100-300 μm diameter is drilled through each foil, see Figure 1.3. The foils are aligned with
concentric cavities, creating a single cavity between the two foils. Applying an AC waveform to
the foils causes the configuration to act as a capacitor. The microcavity between the two foils
concentrates the fringe electric field effects of the capacitor, resulting in an electric field of
approximately 107 V/m. [15] A high pressure feed source supplies a propellant gas to the
thruster, and as it enters the cavity the electric field initiates a Paschen-type breakdown of the gas
into a plasma, which in turn increases the bulk temperature of the propellant. The specific
mechanism by which the plasma is created and the propellant gas temperature is increased are
discussed in Section 2.1. The high-temperature gas is then exhausted through a moderate
Reynolds number nozzle producing thrust levels in the range of 1-5 mN.

12
Figure 1.2: Schematic of the MCD thruster.
13
Figure 1.3: A 150 μm diameter, Al/Al2O3 system, microcavity.
Since the physical dimensions of the MCD thruster are extremely compact they are easily
incorporated into nanosatellites. In addition, the high efficiency and low power of the MCD
thruster means it does not require a large
power supply or energy storage bank, and
requires less propellant, reducing its overall
system footprint. Finally, MCD devices
have a positive V-I characteristic, see Figure
1.4. This allows for the parallel operation of
multiple cavities in an array and enables the
thrust level of an MCD thruster to be
precisely tailored to mission requirements.
In order to simplify fabrication, the majority of thrusters used during testing, the majority of
thrusters used during testing are single cavity devices, although multiple cavity devices were
Figure 1.4: Positive V-I characteristic of a 3x3 array MCD device. Device geometry is shown on the inset.

14
used for several thrust measurements. Several studies of nanosatellite missions for which the
MCD thruster would be uniquely suited have been developed, such as the station keeping,
formation flying, and drag compensation maneuvers given in Ghosh. [13] Therefore, from a
theoretical standpoint the MCD thruster is a viable option for nanosatellite propulsion and a
sound basis for development is established.
1.2 Development Effort
Development of the MCD thruster is proceeding through two concurrent efforts: an experimental
effort conducted at the Electric Propulsion and Optical Physics Laboratories at the University of
Illinois, and a computational modeling effort at the University of Texas at Austin. This thesis
will primarily focus on developments in the experimental effort, while a brief discussion
regarding computational modeling can be found in Appendix B.
The experimental development of the MCD thruster centers around three types of testing: thrust
measurements, Paschen breakdown minimum measurements, and thermal efficiency
measurements. Thrust measurements of the MCD thruster are concerned with measuring the
capabilities of the integral supersonic nozzle and validating its inclusion from an efficiency basis.
Work by Bayt [16] provides solid experimental data on of μm-scale supersonic nozzles for
electrothermal thrusters as well as an exploration of their performance capabilities. There is little
need to replicate his results and once the capabilities of the nozzles are verified, our treatment of
them will be solely theoretical in nature. Overall this thesis deals primarily with the
experimental measurements of the thermal efficiency of the MCD thruster as it is the largest
factor with regards to thruster efficiency, although determination of the Paschen breakdown
curve remains an important secondary objective.

15
1.2.1 Thermal Efficiency
As noted previously, the MCD thruster is an electrothermal type thruster in which the propellant
gas is heated by a plasma breakdown and then ejected out a supersonic micronozzle. Since the
MCD thruster is intended for use on power-limited nanosatellites, it must be highly efficient at
converting stored electrical energy into increased thrust performance (the MCD thruster is
capable of operating as an unpowered cold-gas thruster, so there will always be a base thrust
level available to the satellite). While the overall thruster efficiency as described in equation
(1.3) is dependent upon a number of parameters [17], the largest contributing factor to the total
thruster efficiency is how effectively electrical energy is converted to thermal energy, denoted by
the thermal efficiency:
(1.6)
This equation demonstrates that for a fixed efficiency and mass flow rate the relationship
between an increase in stagnation temperature and input power is linear. The relationship
between increased temperature and increased thrust will be discussed in Section 2.2. The MCD
thruster is an electrothermal thruster and so it is preferable to deposit as much heat into the
propellant gas with as little applied power as possible. The primary consideration in maximizing
the thermal efficiency is the ratio between the increase in the propellant gas temperature and the
power required to achieve the increased temperature, note that the mechanism by which applied
the waveform increases the propellant gas temperature will be discussed in Section 2.1. In
general it is preferable to have the propellant gas heated to a significant degree in order to
provide a thrust increase of between 1.5:1 to 3:1 over the unpowered cold gas case. There are
however several issues associated with increasing the temperature of the propellant gas, with the
16
most critical being wall heat losses. Additional factors include the reduced density and hence
reduced Reynolds number that is a result of an increased .
The principal concern behind the factor is that increased propellant gas temperature leads to
increased heat losses to the cavity walls. In fact, computational modeling suggests that wall heat
loss is the single greatest energy sink in a microcavity discharge. In order to maximize the
thermal efficiency of the MCD thruster, wall heat losses clearly must be minimized. An
approximate calculation of the magnitude of wall heat losses and the key dependent parameters
can be made with several basic assumptions. For the sake of simplicity a Reynolds number
analogy will be used assuming an average value for the viscosity instead of a temperature
dependent one. [18] The localized wall losses are given by:
(1.7)
Where is the local wall shear stress, related to the friction coefficient and the fluid dynamic
pressure ⁄ by
. For low Reynolds number (laminar) flows the
friction coefficient is given by ⁄ and the total wall heat loss can then be expressed as:
(1.8)
Since the mass flow rate remains approximately constant during a test, it can be treated as a
set parameter and has no further effect on the efficiency, while the wall length is dependent on
fabrication procedures and system footprint. The two variable parameters in the total heat loss
equation are thus the specific heat , which is dependent on the propellant gas mixture used and
the parameter required to obtain a given level of thrust. The effects of the propellant gas

17
mixture on performance are examined in section 4.3 while the effect of the parameter is
explored in section 2.2.

18
Chapter 2 Theory of Operation
2.1 Physics of Microcavity Discharges
The physics behind microcavity discharges originally stems from work performed on plasma
display panels. [15] [19] [20] The Laboratory for Optical Physics and Engineering at the
University of Illinois has since developed a wide variety of devices based on MCD technology,
primarily for use in various types of displays. The MCD thruster is an adaptation of existing
MCD technology originally developed for plasma lighting, although several major changes were
made to the technology for use in plasma thruster applications.
The process by which an MCD thruster operates is relatively straight forward and is similar in
nature to the MCD process that occurs in other lower power devices, such as those used for
illumination. In order to produce a thrust level greater than that of cold gas thrusters, an
electrothermal thruster must heat the propellant gas, thereby increasing the energy of the flow
which in turn increases the momentum of the propellant when expelled through a contoured
nozzle. The mechanisms by which the MCD thruster adds energy to the flow will be explained
in this section.
To understand the plasma formation and heating process that occurs in the MCD thruster, we
begin with the basic structure of the MCD thruster: the electrode foils. Each foil consists of a
pure aluminum substrate in which a cavity is drilled. An aluminum oxide dielectric layer is then
grown on the surface of the aluminum substrate, including on the inner wall of the microcavity.
Two (or more) foils are stacked on top of each other with the cavities in concentric alignment.

19
The separation between metal substrates is equal to the thickness of each dielectric layer plus the
thickness of any additional insulation material, such as a polyimide sheet. The sandwich of pure
metal foil, aluminum oxide dielectric layer, insulation material if applicable, aluminum oxide
dielectric layer, and pure metal foil comprises a capacitor where boundary effects are present
both on the external edges and, critically, the internal microcavity.
Initiation of the plasma breakdown process begins when a propellant gas mixture is supplied to
the thruster and an AC voltage of sufficient amplitude is applied to the electrodes. The
propellant gas is driven through the microcavity by a pressure gradient, as the upstream pressure
is normally 20-60 kPa while the downstream pressure is ~0 kPa. The flow reaches Mach 1 at the
cavity exit, which is designed to have the minimum flow area. This converging design ensures
the heating will take place in the subsonic region of the flow. The AC voltage is applied to the
foils at 25-150 kHz, with the upstream electrode „hot,‟ and the downstream electrode grounded.
Since the electrodes are in a capacitive configuration, as the voltage waveform rises the strength
of the electric field between the two foils increases. The electric field fringe effects present at
the capacitor boundary are concentrated in the small diameter of the microcavity. This leads to a
much higher electric field inside the cavity, on the order of 107 V/m, than between the flat
surfaces of the foils. As the voltage continues to rise and the electric field in the cavity continues
to increase, ionized particles naturally present in the propellant gas gain energy, acting as a seed
for a breakdown. These natural ions and electrons are accelerated by the electric field gaining
velocity until they collide with unexcited atoms. The impact with an unexcited particle has a
several possible outcomes, depending on a variety of factors including the particle mobility, the
density of the propellant gas, and the collision parameters including its elastic or inelastic nature
and the cross section of the particles involved. There are three possible outcomes that lead to

20
increased bulk energy term and hence increased propellant gas temperature. The first case is that
as a result of the collision the unionized particle simply gains momentum from the impact, but is
neither excited nor ionized. In the second case the unexcited particle gains enough energy to
become excited but remains unionized, although particles in the excited state are a significant
contribution to the energy of the gas. In the third case the impact imparts enough energy to the
unionized particle to cause it to become ionized, releasing an electron in the process. According
to computational modeling performed by Sitaraman and Raja [21] these ionized particles are the
largest contributors of energy to the flow.
The multiple impacts create a wave of excited particles resulting in the creation of an ionized
(ionization fraction ~10-5
with respect to neutral) gas, or plasma. Since the excited and ionized
particles have a higher energy than the surrounding unionized particles, collisions with these
neutral particles increases the energy level of the bulk gas, which is manifested on a macro scale
as an increase in temperature. The increased flow temperature leads to a greater sonic velocity
and depending on the flow configuration either a reduction in density and mass flow rate or an
increase in pressure (and hence an increase in thrust). On a flight thruster an appropriately
contoured supersonic nozzle would be added downstream of the throat increasing the velocity of
the propellant exhaust beyond Mach 1, providing an additional boost to the thrust and Isp.
2.2 Thrust Equations
Although propellant heating in the MCD thruster occurs through a different process than in a
traditional jet or rocket engine, the equations that govern the flow of the heated propellant are the
same. The flow inside the MCD thruster can be approximated as Rayleigh heating followed by
isentropic acceleration through a converging nozzle, and finally acceleration through a

21
supersonic diverging nozzle. Since the primary test configuration of the MCD thruster does not
include a supersonic nozzle, the following discussion will be limited to the subsonic regime only.
Discussion of supersonic nozzle parameters can be found in section 2.2.2.
As is the case with virtually all thermal-fluid aerospace propulsion systems, flow inside the
MCD thruster is driven by a pressure gradient. At the nozzle throat, located at the exit plane in
test configuration, the flow reaches the sonic condition. Therefore the thrust equation can be
expressed as a function of the flow conditions at the throat:
(2.1)
Although equation (2.1) is the primary form of the thrust equation, thrust can also be expressed
as:
(2.2)
Equation (2.2) defines the relationship between thrust and the propellant mass flow rate. The
mass flow rate can further be expressed as a function of the flow conditions at the throat:
(2.3)

22
Finally, in order to express the mass flow in terms of the other measureable parameters the
addition of common isentropic flow relations result in the following expression for mass flow in
terms of the Mach number:
√ √
(
)
⁄
(2.4)
Equation (2.4) is a critical governing equation for the flow conditions that occur inside an MCD
thruster during discharge, as the parameter √ ⁄ can be directly related to the stagnation
temperature and pressure ratios as determined by the Rayleigh equations.
2.2.1 Rayleigh Equations
Since the MCD thruster operates as an electrothermal device, the dominant regime is Rayleigh
flow, or flow with heat additions. Since equation (2.1) is ultimately dependent on the throat
pressure, a relationship between the increase in temperature and the corresponding increase in
thrust must be developed. The relevant forms of the necessary equations can be derived from the
energy equation [22]:
(2.5)
For (adiabatic) we can rewrite the energy equation as:
(2.6)

23
and
(
)
⁄
(2.7)
and
(
)
⁄
(2.8)
Then, from equation (2.5):
(2.9)
We can rewrite in terms of the Mach number:
(2.10)
Additionally, a similar relation can be written for the temperature ratio using equations (2.6) and
(2.10):
(
)
(
)
(2.11)
24
Combining equations (2.7) and (2.10) we obtain:
(
)
⁄
(2.12)
Combining equations (2.6) and (2.12) we obtain:
(
)
(
)
(
) (2.13)
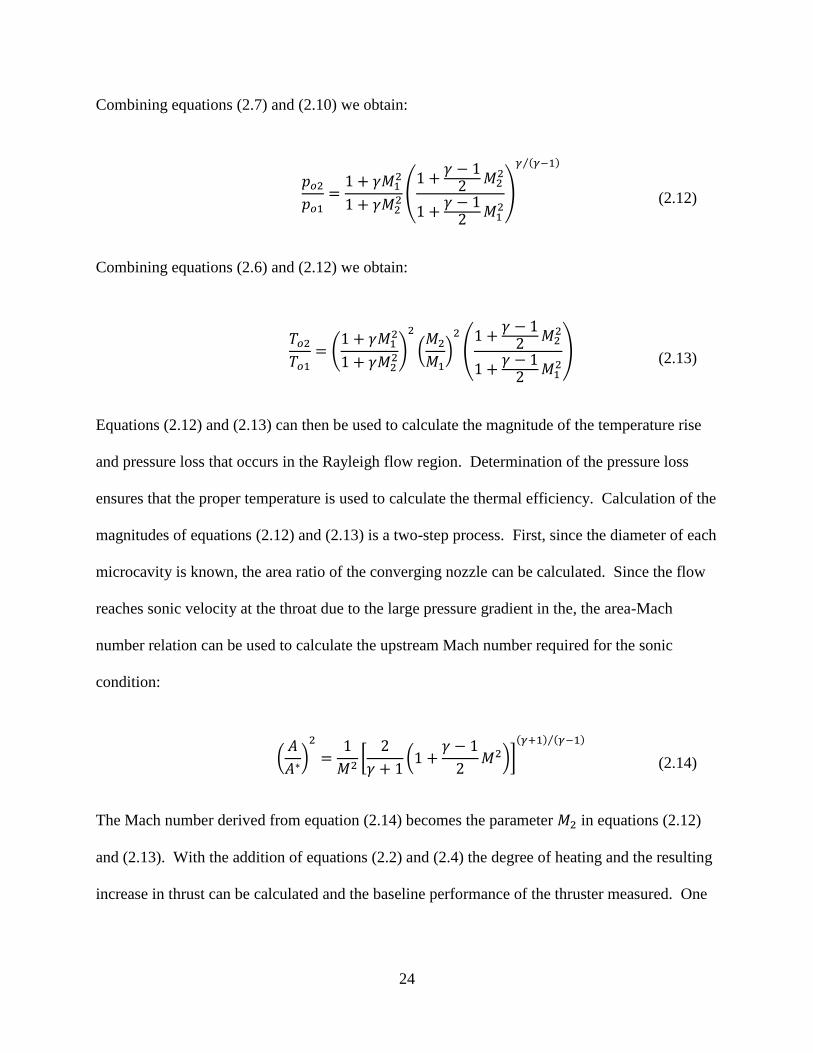
Equations (2.12) and (2.13) can then be used to calculate the magnitude of the temperature rise
and pressure loss that occurs in the Rayleigh flow region. Determination of the pressure loss
ensures that the proper temperature is used to calculate the thermal efficiency. Calculation of the
magnitudes of equations (2.12) and (2.13) is a two-step process. First, since the diameter of each
microcavity is known, the area ratio of the converging nozzle can be calculated. Since the flow
reaches sonic velocity at the throat due to the large pressure gradient in the, the area-Mach
number relation can be used to calculate the upstream Mach number required for the sonic
condition:
(
)
[
(
)]
⁄
(2.14)
The Mach number derived from equation (2.14) becomes the parameter in equations (2.12)
and (2.13). With the addition of equations (2.2) and (2.4) the degree of heating and the resulting
increase in thrust can be calculated and the baseline performance of the thruster measured. One

25
additional factor is the calculation of the nozzle efficiency and thrust coefficient of the integral
supersonic micronozzle.
2.2.2 Micronozzle Performance
A second factor of importance in determining the overall thruster efficiency is the nozzle
efficiency, given by:
(2.15)
Bayt [16] discovered that the key parameter in determining the efficiency of a micronozzle is the
throat Reynolds number since it is a first order factor in both the viscous losses and wall heat
losses of the nozzle. Ultimately Bayt determines that in order for a μm-scale supersonic nozzle
to be effective, a thrust coefficient of > 1.2 must be obtained; a thrust coefficient lower than this
incurs unacceptable viscous losses and a simple near-isentropic subsonic nozzle is preferable.
Although there are a number of factors that determine the thrust coefficient, in general for μm-
scale nozzles if the throat Reynolds number exceeds 1000 then the addition of a supersonic
nozzle is worthwhile from an efficiency standpoint.
26
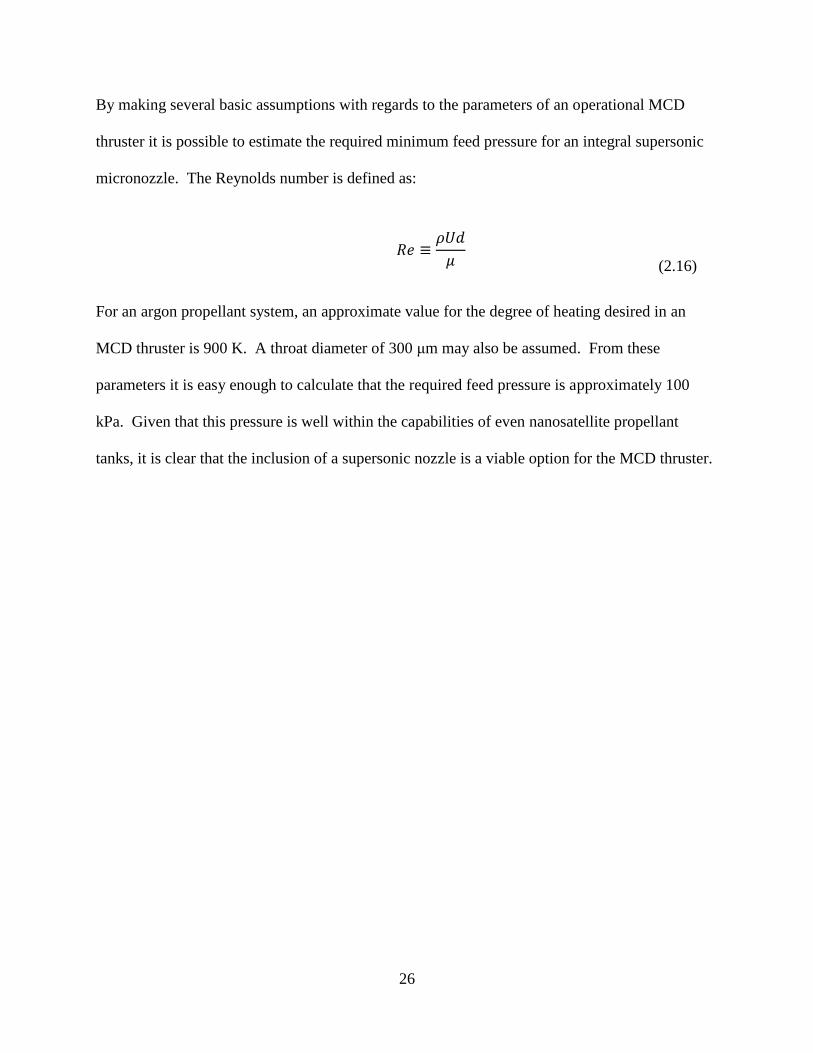
By making several basic assumptions with regards to the parameters of an operational MCD
thruster it is possible to estimate the required minimum feed pressure for an integral supersonic
micronozzle. The Reynolds number is defined as:
(2.16)
For an argon propellant system, an approximate value for the degree of heating desired in an
MCD thruster is 900 K. A throat diameter of 300 μm may also be assumed. From these
parameters it is easy enough to calculate that the required feed pressure is approximately 100
kPa. Given that this pressure is well within the capabilities of even nanosatellite propellant
tanks, it is clear that the inclusion of a supersonic nozzle is a viable option for the MCD thruster.
27
Chapter 3 Technical Approach
3.1 Experimental Setup
3.1.1 Overview
As discussed in section 1.2, the primary performance parameter being investigated is the
thermals efficiency. The thermal efficiency test results given in this document are obtained from
a single test configuration, but the MCD thruster has been run in two different configurations: the
first to measure micronozzle performance and the second to measure the Paschen breakdown
minimum and thermal efficiency. The two general test configurations used for performance
measurements directly correspond to the vacuum tank in which the testing is performed. During
the initial stages of testing the MCD thruster was placed on a compact thrust stand inside a 1.2
m3 capacity vacuum tank in order to determine the nozzle efficiency of the device. For the
thermal efficiency testing phase the thruster was moved to a smaller 0.15 m3 capacity vacuum
tank to alleviate external plasma glow phenomenon.
3.1.2 Test Facilities and Equipment
3.1.2.1 Vacuum Tanks
Experimental testing of the MCD thruster was undertaken in the Electric Propulsion Laboratory
(EP Lab) at the University of Illinois. The EP Lab is equipped with two vacuum tanks: a large
1.2 m3 tank in which a Watt‟s pendulum-type thrust stand is installed, see Figure 3.1, and a
smaller 0.15 m3 vacuum tank which has a transparent front face for observing test runs, see
Figure 3.2.

28
Figure 3.1: Compact thrust stand installed in the 1.2 m3 vacuum tank in the EP Lab at UIUC

29
Use of the 1.2 m3 vacuum tank has a number of advantages and disadvantages with regards to
testing, the most notable of which is that the compact thrust stand (described in Wilson and
Burton [23]) was built specifically to fit snugly inside the tank, restricting thrust measurements
to the large tank only. The 1.2 m3 tank utilizes a three stage pump-down system to achieve
vacuum; the first stage is comprised of a mechanical displacement pump which can achieve a
minimum pressure of approximately 5 Torr after approximately 2 hours. The second stage
consists of two sequential roots-type pumps which can achieve a minimum background pressure
of approximately 100 mTorr, which requires approximately 1.5 hours. The third stage consists
of an axial nanomolecular turbopump, capable of achieving minimum background pressures of
10-5
Torr after approximately 2 hours. The internal capacity of the 1.2 m3 vacuum tank is
divided into two sections: a larger barrel section which houses the thrust stand and the wiring for
the MCD experiments, and a smaller cross-junction section which houses a gallium
Figure 3.2: 0.15 m3 vacuum tank in the EP Lab at UIUC.

30
electromagnetic thruster. Although the two sections on the tank share a common depressurized
volume, an internal baffle prevents direct contact between them.
The 0.15 m3 vacuum tank was originally built to test the deployment of a solar sail material
between two Cube Sat 10 cm units and is sized appropriately. The 0.15 m3 vacuum tank utilizes
a two stage pump down system. The first stage consists of a mechanical displacement pump
which is capable of achieving a minimum background pressure of approximately 1.5 Torr in 45
minutes. The second stage consists of an axial nanomolecular turbopump, capable of achieving
pressures of approximately 10 mTorr after an additional 45 minutes. In the initial stage of
testing the entire thruster was placed inside the tank, but glowing on the external surfaces of the
electrode foils hampered power measurements. The thruster was then moved to the outside of
the tank, with only the microcavity exposed to the vacuum (see Figure 3.10), solving the glowing
problem.
3.1.2.2 Power Supply
The voltage waveform is supplied to the MCD thruster through a 3-stage process. The initial
signal is generated by a Victor VC2002 function generator. A Mackie FR800 800 W 2-channel
amplifier was originally used to boost the signal to higher voltage levels, in later tests it was
replaced by a QSC RMX 1450 1400 W two-channel amplifier. In the final stage the voltage of
the waveform is further boosted by a 1:100 turn ratio custom built solid core transformer. The
power supply is shown in Figure 3.3, and a connection diagram is shown in Figure 3.4.

31
Figure 3.3: MCD Thruster power supply. Top left: Victor VC2002 Function Generator. Top Right: Custom 100:1 Solid Core Transformer. Center: QSC Audio RMX 1450 1400 W 2 Channel Amplifier. Center Low: Mackie FR800 800 W 2 Channel Amplifier

32
Figure 3.4: Connection diagram for the MCD thruster power supply and instrumentation.
3.1.2.3 Instrumentation
The same instrumentation is used in both MCD thruster test configurations: mass flow and
pressure measurements are made by two mass flow sensors and a pressure transducer while
power measurements are made by a voltage probe and a current monitor connected to an
oscilloscope. The thrust stand is also used for thrust measurements. In order to facilitate data
collection, a computer running National Instruments LabVIEW and Mathworks MATLAB is
used to record all measureable parameters during testing. The LabVIEW interface can display
the real time values of all connected instrumentation and record it for later analysis while
MATLAB is used to record „snapshot‟ measurements. The majority of the instrumentation is
connected to the computer by means of a National Instruments data acquisition card, although

33
Figure 3.5: National Instruments SCXI-1000 Data Acquisition Box
the oscilloscope is connected
through the standard local-area
network. A National Instruments
SCXI-1000 Data Acquisition Box
serves as an interconnect between
the data acquisition card and the
instrumentation, see Figure 3.5.
The mass flow rates of the
propellant gases are measured using
two Omega Engineering mass flow
sensors: a FMA3107 sensor with a flow rate of 0-2000 Standard Cubic Centimeters per Minute
(SCCM) calibrated for helium, and a FMA3104 sensor with a flow rate of 0-200 SCCM
calibrated for air, see Figure 3.6. The mass flow sensors are connected to the LabVIEW
interface through the SCXI-1000 Data Acquisition Box. There are two important notes with
respect to the mass flow sensors. The first is that the mass flow sensors have needle valves
which induce a sonic throat condition (two of four such points in the propellant feed system, the
other two are at the metering valves) and since the pressure supplied from the gas bottles remains
constant, then once the downstream pressure has been set by the position of a metering valve the
mass flow through the flow meters remains constant. A second note is that although every effort
has been taken to ensure the integrity of the propellant feed system, the propellant gasses are
supplied at below-atmospheric pressure and it is likely that some small amount of laboratory air
seeps into the propellant flow and is not detected by the mass flow sensors.

34
Figure 3.7: Power Measurement Instrumentation. Top: Tektronix TDS 3034B. Bottom Left: Tektronix P5100 Voltage Probe. Bottom Right: Pearson Electronics 1:1 Current Monitor.
Line pressure measurements are conducted with a
Cole-Parmer 68072-52 type piezoelectric pressure
transducer. The transducer has an effective range
of 0-50 psia (0-345 kPa), with a resolution of 0.1
kPa, see Figure 3.6. The transducer is also
connected to the SCXI-1000 Data Acquisition
Box and in turn to LabVIEW. Measurements
made by the pressure transducer are displayed in
real time on the LabVIEW interface and are also
used to determine the extent of the pressure
rise observed during operation of the
thruster.
Voltage and current measurements are
performed by a Tektronix P5100 100x
voltage probe and a Pearson Electronics 1:1
V/A current monitor connected to a
Tektronix TDS3034B oscilloscope, see
Figure 3.7. The voltage and current
measurements are taken at the points shown
in Figure 3.4. The voltage and current measurements can be displayed in real time and recorded
by LabVIEW, or a „snapshot‟ of the waveforms can be made using MATLAB. During testing it
Figure 3.6: Flow sensors. Top Left: Omega Engineering FMA3104 series MFM. Top Right: Omega Engineering FMA3107 series MFM. Center Bottom: Cole-Parmer 68072-52 Type Pressure Transducer.

35
was discovered that although LabVIEW has the advantage of displaying real time values, it is
unable to resolve the waveform twitho a sufficient degree of accuracy to perform measurements,
and thus power measurements are taken with MATLAB.
3.2 Experimental Procedure
3.2.1 Thrust Measurements
In order to validate the performance of the integral supersonic nozzle thrust measurements are
taken using a compact thrust stand. The thrust stand functions as an inverted pendulum where
the deflection of the main platform is measured by a linear variable differential transformer
(LVDT). The deflection of the thrust stand during thruster operation is compared to the
deflection produced by a set of calibration weights to obtain a thrust measurement. The
procedure for performing a thrust measurement is described below.
During the initial stage of a test run, a set of five calibration weights with known mass (34.5 mg)
are sequentially applied to the main platform by means of small pulley fixed to the stand frame.
During this process the deflection of the main platform is measured in the form of increased
voltage from the LVDT and recorded by LabVIEW. An exemplary plot of the deflection can be
seen in Figure 3.8. Since each calibration weight is of known mass, and the monofilament that
connects them is of negligibly small mass the step in the deflection that occurs as each weight
comes to bear on the platform can thus be equated to a known force. Each weight is applied in
sequence, and then the process is reversed producing the two-way stepped plot seen in Figure
3.8.

36
Figure 3.8: A typical calibration curve for the compact thrust stand at UIUC. Each step corresponds to a force of approximately 0.338 mN.
Once the calibration plot has been produced, it is a simple matter to find a slope and thus a linear
calibration fit. After the calibration fit has been obtained, flow of the propellant gas to the
thruster is initiated, with adjustments to flow rates made as necessary in order to achieve the
desired pressure and propellant gas mixture. An initial discharge coefficient is obtained in order
to determine both the degree of concentricity of the cavity alignment and to serve as a baseline
for later cavity damage comparisons. The discharge coefficient is an experimentally determined
parameter defined as:
(3.1)

37
As defined in equation (3.1), the discharge coefficient functions as a correction factor for various
losses encountered in fluid flow through an area reduction or orifice. [24] In the ideal case the
mass flow rate would simply be a function of the cross-sectional area, the flow velocity, and the
fluid density. Due to viscous and friction effects the actual mass flow is always less than the
ideal case, and thus is always less than 1.
The discharge coefficient is calculated numerically from a comparison between the actual throat
temperature and the ideal throat temperature. Initially, the throat pressure is calculated by:
(
) ⁄
(3.2)
where is the calculated specific heat ratio for the mixture as a whole. The measured throat
stagnation temperature is then calculated by:
(
)
(3.3)
where the effective throat area is calculated by . Since all parameters other than are
fixed, the measured throat stagnation temperature is then compared to the ideal throat stagnation
temperature, given by:
(3.4)
By setting
it is possible to solve for the discharge coefficient. For a properly
aligned and undamaged thruster typical values are in the range of 0.85-0.98.

38
After the discharge coefficient is established and the desired flow parameters are reached, the
propellant flow is temporarily shut off, although the metering valves retain their previous
positions. Once the thrust stand has settled back to the neutral position, the flow is initiated
again, with the same line pressure and propellant gas composition as before. The deflection of
the thrust stand between the neutral and the cold flow states gives the cold thrust value, which
indicates the base performance level of the MCD thruster. An example of typical cold thrust
results can be seen in Figure 3.9.
Figure 3.9: A typical cold thrust displacement plot. The ‘ringing’ sections are due to the long-period oscillations resulting from the displacement overshooting the equilibrium point. This plot is from a 4 cavity, 120 μm throat diameter, supersonic nozzle electrode running pure neon at 240 kPa. The average thrust value is 2.7 mN. Due to thruster orientation, positive thrust corresponds to negative displacement.

39
In addition to the cold thrust level, the baseline thrust measurement also makes it possible to
calculate the thrust coefficient, , for a supersonic nozzle. The thrust coefficient is defined as:
(3.5)
Following the determination of the baseline cold thrust value and the thrust coefficient, power is
supplied to the thruster and a discharge is initiated. An increase in the displacement of the thrust
stand and the line pressure are both indications of an increased thrust level, since the thrust is
given by equation (2.1). Additionally, depending on configuration, the thrust may remain
constant while the mass flow rate drops, indicating an increased Isp. The increase in thrust stand
displacement or decrease in in contrast to the cold case is measured and the hot thrust value
determined. From these measurements it is possible to determine the thrust coefficient using
equations (2.1) and (3.5).
3.2.2 Paschen Breakdown Minimum Measurements
The second type of measurements made during testing of the MCD thruster are related to the
determination of the minimum voltage required to initiate a breakdown of the propellant gas for
any given flow conditions. Since the plasma formation inside the microcavity is initiated by an
electric field, MCD devices follow the general principles of a Paschen-type breakdown. [25]
Briefly, this means that once the electric field inside the microcavity that results from the
capacitor fringe effects reaches a certain limit the propellant gas breaks down into plasma. The
parameters that determine the point at which breakdown occurs are the pressure of the gas, the
electrode separation distance, and the voltage applied to the two plates of the electrode. For the
40
purposes of gaseous electronics such as the MCD thruster it is convenient to denote the product
of the electrode separation distance and the gas pressure as the parameter . [25]
A concern with many micrometer scale electronic devices is the voltage levels that are required
for operation, and the MCD thruster is no exception. Since the aluminum oxide layer has a
nominal thickness of only 10-20 μm, any cracks or other flaws can lead to arcing between the
electrode foils and the rapid destruction of the thruster. In addition, higher voltage levels carry
various system penalties such as requiring more robust transformers and increased insulation;
therefore it is beneficial to accurately determine the minimum voltage necessary for optimal
thruster operation. The most important task in this regard is the determination of the voltage
required to initiate breakdown of the propellant gas, known as the Paschen breakdown minimum.
Testing for the Paschen breakdown minimum serves several purposes: it allows for the creation
of a Paschen curve which can be used to predict the voltage required for breakdown at numerous
values; it gives a good estimate of the voltage range required for optimal thruster operation;
and it gives insights into the basic physics of the MCD process. In regards to the last purpose,
one key purpose of Paschen breakdown testing is to determine the correct value to use for the
electrode separation distance. Earlier work by Park et al. [15] suggested that in static (no flow)
devices the cavity diameter was the dominant term in the characteristic. Subsequent testing
of the MCD thruster revealed that in a flowing system the distance between pure metal substrates
is the dominant term.
The process by which the Paschen breakdown minimum of the MCD thruster is determined for a
given value is straightforward. Testing is performed in the 0.15 m3 vacuum tank. The
thruster is mounted so that only the microcavity and the discharge shroud are exposed to the
41
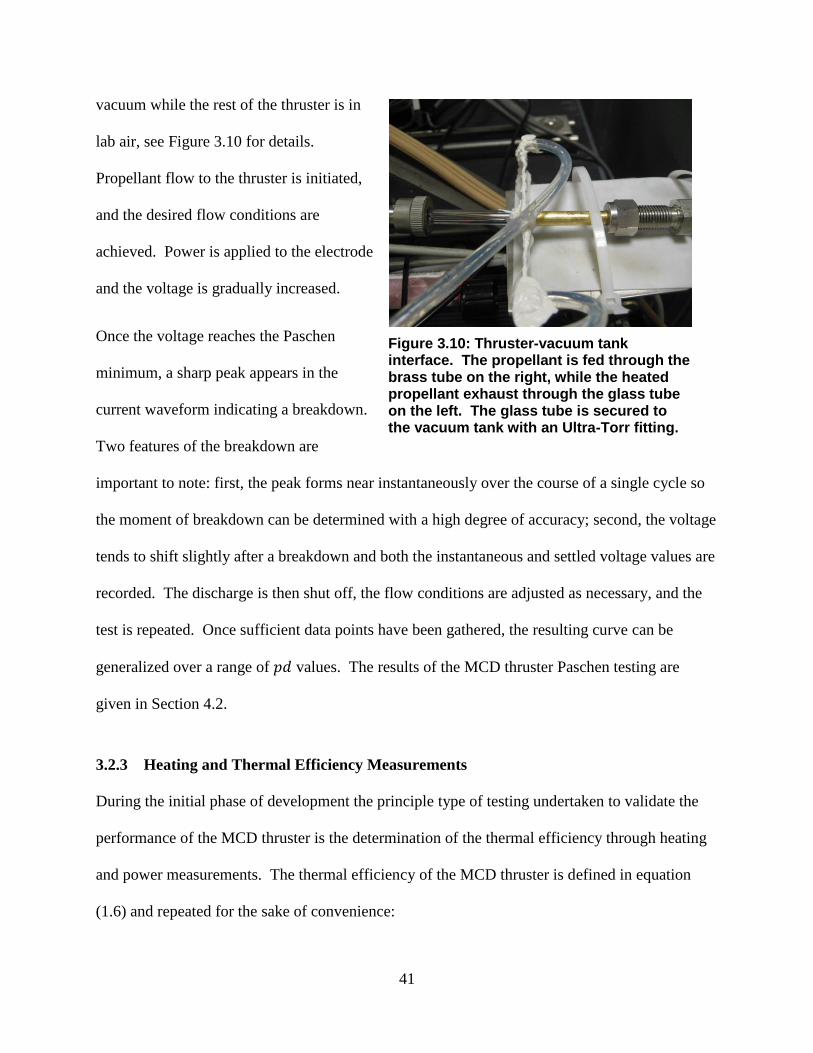
vacuum while the rest of the thruster is in
lab air, see Figure 3.10 for details.
Propellant flow to the thruster is initiated,
and the desired flow conditions are
achieved. Power is applied to the electrode
and the voltage is gradually increased.
Once the voltage reaches the Paschen
minimum, a sharp peak appears in the
current waveform indicating a breakdown.
Two features of the breakdown are
important to note: first, the peak forms near instantaneously over the course of a single cycle so
the moment of breakdown can be determined with a high degree of accuracy; second, the voltage
tends to shift slightly after a breakdown and both the instantaneous and settled voltage values are
recorded. The discharge is then shut off, the flow conditions are adjusted as necessary, and the
test is repeated. Once sufficient data points have been gathered, the resulting curve can be
generalized over a range of values. The results of the MCD thruster Paschen testing are
given in Section 4.2.
3.2.3 Heating and Thermal Efficiency Measurements
During the initial phase of development the principle type of testing undertaken to validate the
performance of the MCD thruster is the determination of the thermal efficiency through heating
and power measurements. The thermal efficiency of the MCD thruster is defined in equation
(1.6) and repeated for the sake of convenience:
Figure 3.10: Thruster-vacuum tank interface. The propellant is fed through the brass tube on the right, while the heated propellant exhaust through the glass tube on the left. The glass tube is secured to the vacuum tank with an Ultra-Torr fitting.
42
(3.6)
Since both the mass flow rate and the specific heat of propellant gas mixture are set by the initial
flow conditions, the two variable parameters remaining are the input power and the
change in temperature over the cold thrust case. In order to perform a thermal efficiency test
the desired flow conditions are first set and an initial discharge coefficient is taken. Voltage is
then applied to the electrode and the initial and settled voltages are recorded to establish a
Paschen minimum curve. The voltage is then increased until a visible stable discharge with a
bright core and a pronounced exhaust plume is observed or when voltage amplitude reaches a
value 1.2 kV peak-peak, as higher values are harmful to the electrodes. Once one of these
conditions is met, the amplitude of the voltage is held steady, indicating an approximately
constant level of power is being supplied to the thruster. Since the mass flow rate is constant, the
increased temperature of the propellant gas results in an increase in the stagnation pressure, as
measured by the pressure transducer.
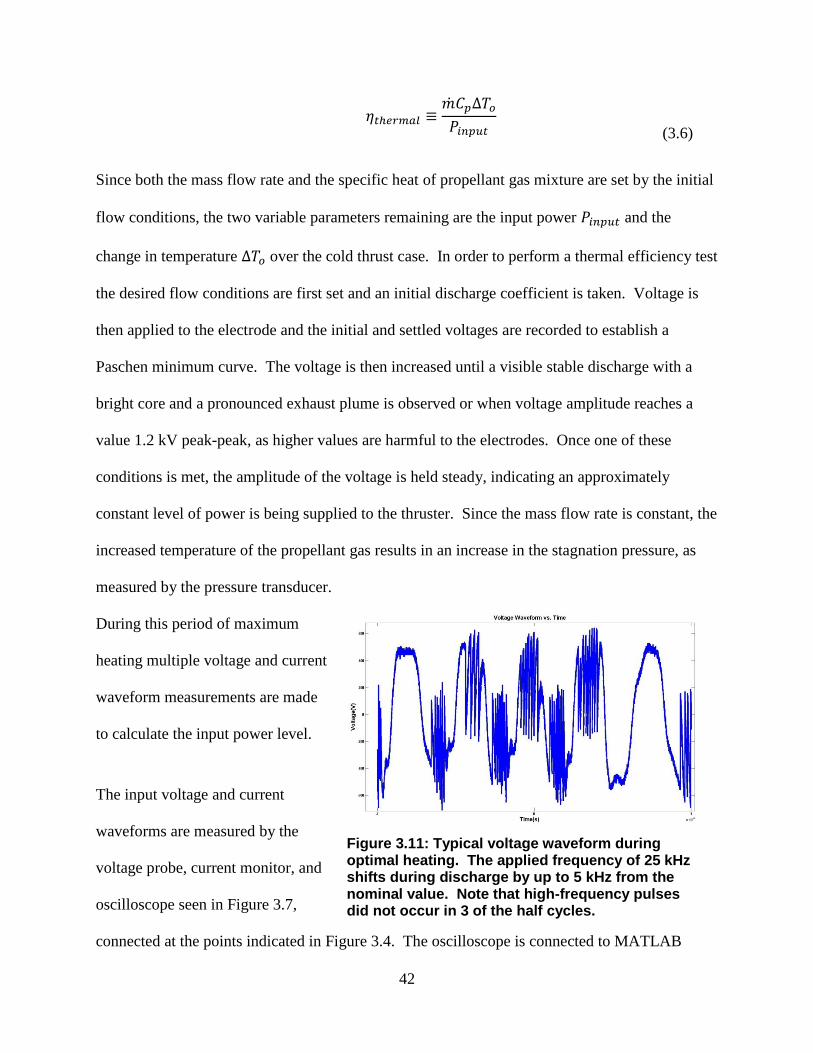
During this period of maximum
heating multiple voltage and current
waveform measurements are made
to calculate the input power level.
The input voltage and current
waveforms are measured by the
voltage probe, current monitor, and
oscilloscope seen in Figure 3.7,
connected at the points indicated in Figure 3.4. The oscilloscope is connected to MATLAB
Figure 3.11: Typical voltage waveform during optimal heating. The applied frequency of 25 kHz shifts during discharge by up to 5 kHz from the nominal value. Note that high-frequency pulses did not occur in 3 of the half cycles.

43
which enables precise determination of the input power. The most desirable power measurement
is the mean cycle power of the waveform, as this gives the best estimate of the power required by
the thruster. Due to variations in the frequency, amplitude, and peak location precise automated
power measurements are difficult to make, especially with regards to the mean cycle power.
Additionally, during optimal heating a number of high-frequency pulses occur in the current and
voltage waveforms, as seen in Figure 3.11. These pulses have a frequency of approximately 1
MHz, the pulse width is approximately 250-500 ns, and the amplitude of the pulses is
approximately equal to the sinusoidal amplitude of the base waveform. Accordingly, the final
process for power measurement involves the manual determination of the period of the
waveform as earlier efforts at using Fourier analysis to determine the period were unsuccessful.
Determination of the mean cycle power is made through the following steps:
Once the initial discharge has been achieved the voltage supplied to the electrode is
increased to the desired value. Over the course of the test run the supplied voltage is kept
steady resulting in an approximately constant power level. A power measurement is also
made at the initial breakdown point.
During a test run a MATLAB subroutine is used to record a „snapshot‟ of the waveform.
The oscilloscope is capable of recording 10,000 data points per sample, with two
channels in use both the voltage and current samples are composed of 5,000 data points.
The MATLAB function takes three separate samples of the waveform, at 10 second
intervals.
Four separate measurements are taken resulting in a total of 12 samples.
44
The waveforms collected in each sample are plotted and the data cursor function in
MATLAB is used to manually pick out an integral number of cycles over which the mean
cycle power calculation will be performed.
For each sample the instantaneous current and voltage values are multiplied, summed
over the cycle or cycles, and then multiplied by the cycle period, resulting in the mean
cycle power. Typical deviation of input power between sample measurements is less
than 15% for 12 samples.
The 12 samples are averaged to obtain the mean cycle power for the run.
Once the necessary power measurements have been made, the line pressure is allowed to
settle to a steady state value so that a maximum value may be obtained. The applied
power is then shut off and the flow is allowed to settle so that a final discharge coefficient
can be taken in order to detect any damage to the microcavity.
There are two possible ways to determine the heating that occurs during the discharge. The
first is a simple isentropic pressure ratio calculation, which yields the heating in the ideal
case. Since the initial temperature and the initial and peak pressures are known, and for an
isentropic flow the change in temperature changes with the square of the change in pressure,
the peak discharge temperature can be calculated by:
(
)
(3.7)
Equation (3.7) holds when M2 << 1, i.e. when there is a large convergence area ratio,
although the MCD thruster is more accurately modeled as flow through a heated duct

45
(Rayleigh flow) followed by flow into a converging nozzle. As a result, knowledge of the
peak initial stagnation pressure, the initial stagnation temperature, and the mass flow rate
allows for calculation of the heated stagnation temperature. For a converging nozzle, the
incoming Mach number required to drive a constant mass flow can be determined from
equation (2.14). The Mach number extracted from equation (2.14) becomes in equations
(2.12) and (2.13). Then the final necessary equation is the choked mass flow equation, given
in equation (2.4). Since the converging nozzle portion of the MCD thruster is assumed to be
isentropic, the values and which result from the Rayleigh heating may also be used in
the above mass flow equation. Therefore using equations (2.4), (2.12) , and (2.13) both the
degree of heating and the corresponding stagnation pressure loss resulting from the Rayleigh
flow section can be calculated. Once the peak discharge temperature has been calculated the
thermal efficiency is determined using equation (1.6). Heating and thermal efficiency results
are given in section 4.3.

46
Figure 4.1: LVDT calibration curve for MCD thrust test runs. The correlation coefficient value (R2) indicates a highly linear system.
Chapter 4 Experimental Results
4.1 Thrust Measurements
Thrust measurements were performed on the compact thrust stand following the procedure
described in section 3.2.1. Since the initial set of thrusters had an integral supersonic nozzle, the
initial measurements were
focused on establishing the
thrust coefficient of the
nozzle. Before measurements
could be taken, the linearity
of the thrust stand first had to
be confirmed. As detailed in
Wilson and Burton [23], the
compact thrust stand makes
use of a precision jack-screw
to produce precisely
controlled small displacements. This known displacement value is used to generate a calibration
curve, as seen in Figure 4.1. Following calibration of the LVDT, thrust coefficient
measurements were obtained.

47
The thrust coefficient of the integral supersonic nozzle is defined in equation (3.5) and repeated
for convenience:
(4.1)
As noted in section 3.2.1, the effective throat area is dependent on, among other factors,
accurate knowledge of the mass flow rate. Early test runs with the MCD thruster were made
with mass flow meters that were later found to be defective, which prohibited an accurate
determination of the thrust coefficient. The decision was made to rely on the theoretical
concepts and experimental results provided in Bayt [16] and the one set of accurate data
available. The accurate results obtained with the MCD thruster are shown below in Table 4.1
and Figure 4.2.
Table 4.1: Thrust Coefficient Testing Results
Line Pressure [kPa] Mass Flow Rate [mg/s] Thrust [mN] Cf
120 0.99 0.60 1.26
240 5.22 2.70 1.07
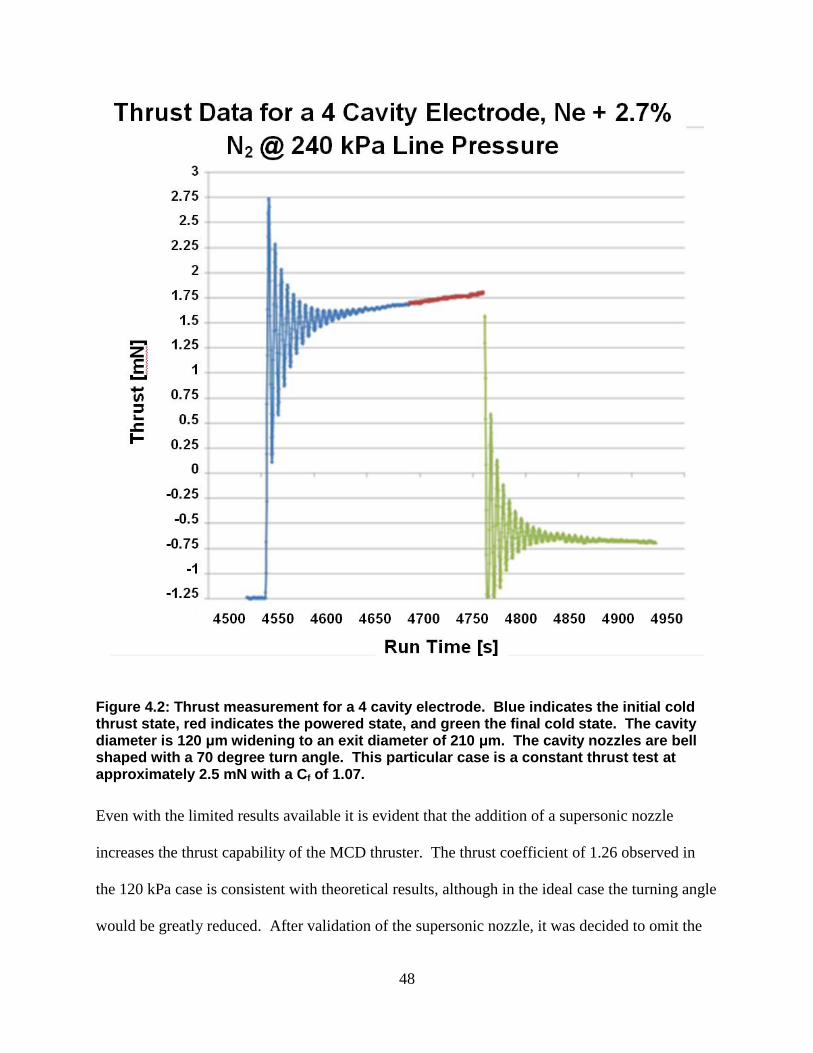
48
Figure 4.2: Thrust measurement for a 4 cavity electrode. Blue indicates the initial cold thrust state, red indicates the powered state, and green the final cold state. The cavity diameter is 120 μm widening to an exit diameter of 210 μm. The cavity nozzles are bell shaped with a 70 degree turn angle. This particular case is a constant thrust test at approximately 2.5 mN with a Cf of 1.07.
Even with the limited results available it is evident that the addition of a supersonic nozzle
increases the thrust capability of the MCD thruster. The thrust coefficient of 1.26 observed in
the 120 kPa case is consistent with theoretical results, although in the ideal case the turning angle
would be greatly reduced. After validation of the supersonic nozzle, it was decided to omit the
49
diverging nozzle from future thrusters for the sake of simplifying fabrication, although future
operation thrusters will include contoured nozzles. For the sake of convenience the MCD
thruster was moved to the smaller 0.15 m3 vacuum tank for Paschen breakdown and thermal
efficiency testing.
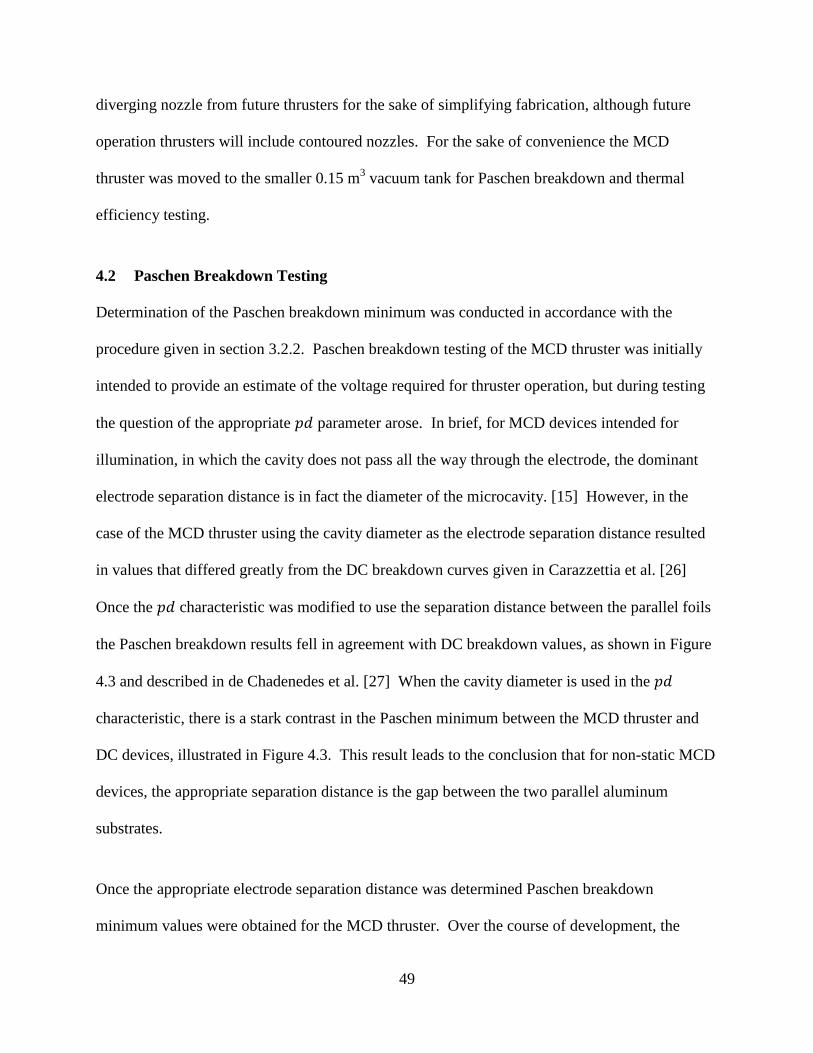
4.2 Paschen Breakdown Testing
Determination of the Paschen breakdown minimum was conducted in accordance with the
procedure given in section 3.2.2. Paschen breakdown testing of the MCD thruster was initially
intended to provide an estimate of the voltage required for thruster operation, but during testing
the question of the appropriate parameter arose. In brief, for MCD devices intended for
illumination, in which the cavity does not pass all the way through the electrode, the dominant
electrode separation distance is in fact the diameter of the microcavity. [15] However, in the
case of the MCD thruster using the cavity diameter as the electrode separation distance resulted
in values that differed greatly from the DC breakdown curves given in Carazzettia et al. [26]
Once the characteristic was modified to use the separation distance between the parallel foils
the Paschen breakdown results fell in agreement with DC breakdown values, as shown in Figure
4.3 and described in de Chadenedes et al. [27] When the cavity diameter is used in the
characteristic, there is a stark contrast in the Paschen minimum between the MCD thruster and
DC devices, illustrated in Figure 4.3. This result leads to the conclusion that for non-static MCD
devices, the appropriate separation distance is the gap between the two parallel aluminum
substrates.
Once the appropriate electrode separation distance was determined Paschen breakdown
minimum values were obtained for the MCD thruster. Over the course of development, the

50
thickness of the dielectric material has increased from 10 μm to 20 μm, and Paschen curves were
obtained for both electrode configurations. The results for the 10 μm thick oxide layer (20 μm
electrode separation distance) are seen in Figure 4.4 while those for the 20 μm thick oxide layer
are seen in Figure 4.5. In order to run at optimal conditions, electrodes with the 20 μm thick
oxide layer were all run at the same line pressure of 40 kPa, while the nitrogen content was
varied. Thus Figure 4.5 describes the effect of nitrogen content on the Paschen minimum, while
the shape of the Paschen curve remains the same as that described in Figure 4.4.
51
Figure 4.3: Paschen minimum breakdown characteristics of an MCD thruster (green and purple) and a DC device (red and blue). [26] Using the 20 μm separation distance, the AC MCD thruster has a Paschen minimum at the same pd characteristic as the DC device, with a minor offset resulting from the addition of a dielectric layer to the MCD thruster. In the case of a 200 μm gap, the Paschen minimum of the MCD thruster occurs off the scale while the minimum of the DC device occurs at approximately 0.40 Pa m. Furthermore, the slope for the MCD thruster in the 200 μm case has a negative value as opposed to the DC device’s positive value.

52
Figure 4.4: The Paschen breakdown minimum curve for a 20 μm electrode separation distance thruster. The red curve is quasi-stagnant, or near stationary flow, and the blue curve is choked flow. The Paschen minimum occurs at approximately the same pd characteristic as in the DC case, but the described curve is steeper and there is a voltage offset at the minimum due to the dielectric barrier effect of the aluminum oxide layer.

53
Figure 4.5: Paschen breakdown minimum voltage vs. N2 content (as a molar ratio, not a mass ratio) for two thrusters with 40 μm electrode separation distance. The nominal pd characteristic is 1.6 Pa m.
From Figure 4.3 and Figure 4.4 it is clear that the MCD thruster exhibits Paschen minimum
breakdown characteristics similar to those of a DC device. Since a new breakdown is initiated
with each half-cycle in an approximately equivalent manner to a rising DC voltage, this result
agrees with the theoretical expectations of the plasma formation mechanics occurring inside the
microcavity. Additionally, Figure 4.5 illustrates the effect of an increased N2 content on the
breakdown voltage. As the Paschen minimum for Ar is lower than that of N2 [25], this result
also agrees with theory. Therefore, although correction factors must be introduced for the
54
dielectric barrier, it is acceptable to perform system-level calculations using DC Paschen
breakdown minimum values.
4.3 Heating and Thermal Efficiency Measurements
Heating and thermal efficiency measurements were performed in accordance with the procedure
detailed in section 3.2.3. During early phases of testing the input power was measured using the
instantaneous values computed by the oscilloscope and transmitted to LabVIEW. It was later
determined that due to instabilities in the waveform during discharge this method was unable to
accurately resolve the actual input power which lead to inaccurate thermal efficiency values.
This section will focus on later results made with the more accurate power measurement
procedure detailed in section 3.2.3.
The Paschen minimum breakdown testing detail in section 3.2.2 gives an accurate picture of the
voltages required for thruster operation. It was determined that the optimal voltage setting for
the MCD thruster was between 150% and 200% of the Paschen minimum for a given
characteristic. Early testing revealed that the maximum peak to peak voltage that can be applied
to the electrodes without arcing is approximately 1.2 kV. Examination of Figure 4.4 reveals that
this restriction limits heating testing of the MCD thruster to a base line pressure of 40 kPa in
order to avoid arcing at optimal heating conditions. Although lower line pressures would result
in less strain on the electrode, this in turn reduces the throat Reynolds number to unacceptable
levels. Therefore it is desirable to operate at the maximum characteristic that can be endured
by the electrode, which is approximately 40 kPa in the current configuration.

55
With a suitable line pressure determined, the primary issue under investigation with regards to
heating and thermal efficiency measurements is the determination of the optimal nitrogen content
for the propellant gas mixture. An additional concern is ensuring that the thruster has the heating
capability to offer improved thrust over the cold gas case, and so a target of 300 K for the
difference between and was set. The test conditions are shown in Table 4.2. Three
electrodes were used for testing, the geometry of the test electrodes is listed in Table 4.3.
Table 4.2: Heating and Thermal Efficiency Test Conditions
Line Pressure [kPa] Nominal p d Characteristic [Pa m] N2 Content [%]
40 1.6 0, 10, 20
Table 4.3: Thruster geometries.
Thruster Upstream Cavity
Diameter [μm]
Throat Diameter
[μm] Area Ratio
MCD-121 365 300 1.48
MCD-122 350 280 1.56
MCD-124 340 290 1.37
Each thruster was tested with 0, 10, and 20% N2 propellant gas. In order to limit the effects of
electrode fatigue on the data, the order in which each propellant gas composition is tested is

56
varied with each thruster. MCD-121 ran 20%, 10%, then 0%; MCD-122 ran 0%, 10%, then
20%; MCD-124 ran 10%, 20%, then 0%. The degree of heating was calculated both by the
pressure ratio method (ideal flow) given in equation (3.7) and the Rayleigh flow method
described in section 2.2.1. Results for the heating and thermal efficiency runs are given in Table
4.4, Figure 4.7, and Figure 4.8.
Table 4.4: Heating and Thermal Efficiency Testing Results. Tests conducted @ 25 kHz
Thruster
Propellant
N2 Content
[%]
Ideal Flow
∆To2 [K]
Rayleigh
Flow ∆To2
[K]
Ideal Flow
ηth [%]
Rayleigh
Flow ηth
[%]
MCD-121 0 58.9 46.3 8.9 6.1
10 124.6 96.8 14.8 11.5
20 181.8 142.1 12.8 10.0
MCD-122 0 89.6 76.2 9.2 7.8
10 121.0 103.3 10.7 9.1
20 159.0 136.7 11.4 9.8
MCD-124 0 99.5 73.4 14.7 10.8
10 94.5 63.6 7.5 5.5
20 244.0 135.3 17.8 9.9

57
Figure 4.6: Pth as a function of Pinput for the three test thrusters. Tests were conducted at 25 kHz.

58
Figure 4.7: ∆To as a function of N2 content for the three test thrusters. Tests were conducted at 25 kHz.

59
Figure 4.8: ηth as a function of N2 content for the three test thrusters. Tests were conducted at 25 kHz.
60
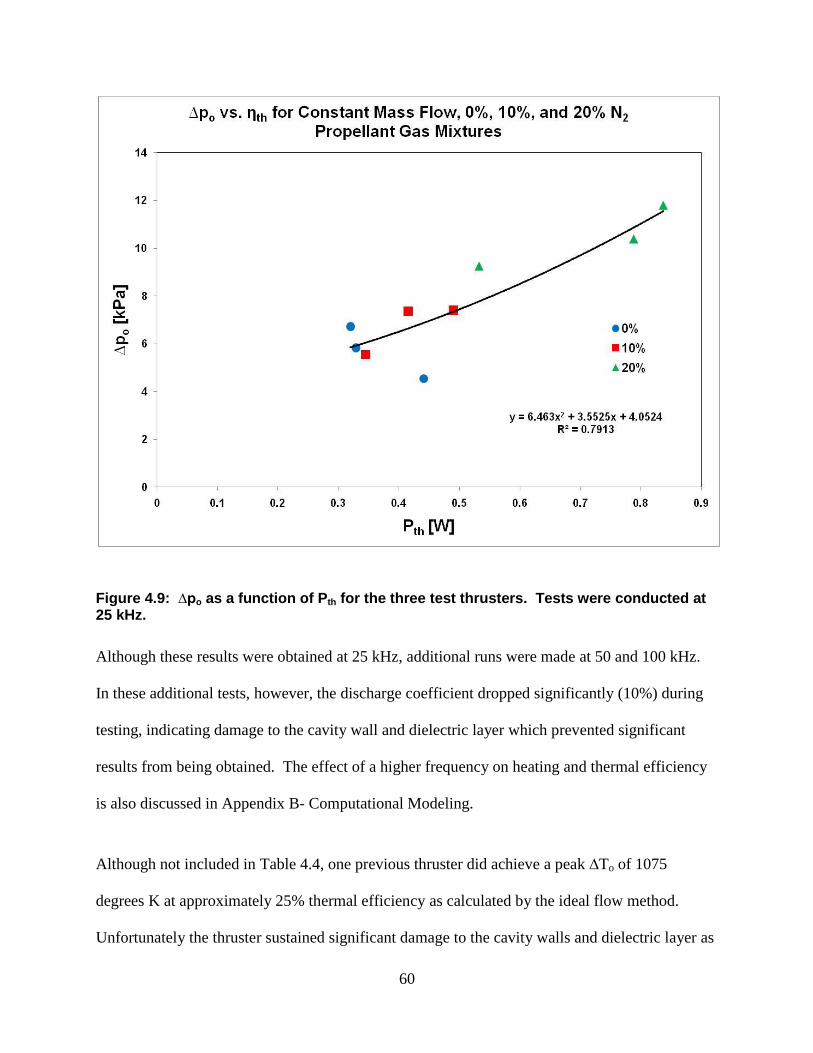
Figure 4.9: ∆po as a function of Pth for the three test thrusters. Tests were conducted at 25 kHz.
Although these results were obtained at 25 kHz, additional runs were made at 50 and 100 kHz.
In these additional tests, however, the discharge coefficient dropped significantly (10%) during
testing, indicating damage to the cavity wall and dielectric layer which prevented significant
results from being obtained. The effect of a higher frequency on heating and thermal efficiency
is also discussed in Appendix B- Computational Modeling.
Although not included in Table 4.4, one previous thruster did achieve a peak ∆To of 1075
degrees K at approximately 25% thermal efficiency as calculated by the ideal flow method.
Unfortunately the thruster sustained significant damage to the cavity walls and dielectric layer as

61
a result of the high temperatures (see Figure 4.10). Despite the failure of the electrode, this
example does serve as an indication of the potential of the MCD thruster.
Figure 4.10: The effects of 1000 K ∆To bulk gas heating. The nanoporous alumina structure does not appear to be present.
62
4.3.1 Error Analysis
The error in the efficiency measurements can be determined by an analysis of the efficiency
equation, repeated below:
(4.2)
It is already known that the deviation of an input power measurement is 15% over 12 samples.
The parameter is a quadratic function of the mass flow rate and cavity diameter, and a linear
function of the pressure and discharge coefficient. The uncertainty of the mass flow sensors is ±
1.5%, the uncertainty of the pressure transducer is ± 0.25%, and the uncertainty of the cavity
diameter is ± 0.8%. The additional mass flow parameter makes it a third order term in the
calculation, while the specific heat is assumed to be constant. Since the discharge coefficient is a
quadratic function of the pressure and a linear function of the mass flow rate, the overall
uncertainty of the discharge coefficient is 1.5% by a propagation of errors calculation.
Therefore, by a propagation of errors calculation the overall uncertainty in the thermal efficiency
power measurement is 3.1%. When combined with the power measurement this results in a total
uncertainty of 15.6%, indicating that the uncertainty in the power measurement is by far the
dominant term.
63
Chapter 5 Conclusion
5.1 Summary
A new trend in space exploration is the deployment of small-scale satellites known as
nanosatellites. Nanosatellites have the potential to be an effective means of performing low-cost
research and observation missions, but the lack of an effective, compact, and efficient propulsion
system remains an obstacle. This work has focused on the exploration of the potential of
microcavity discharge devices to serve in an electrothermal thruster role, especially in the case of
nanosatellite propulsion. Microcavity discharge devices represent a new type of electronic
device that was originally developed for use in plasma displays. An MCD device is a modified
capacitor where one or more microcavities have been formed within each plate and then
concentrically aligned to concentrate the capacitive fringe effects and magnify the electric field
inside the cavity. MCD devices can be adapted to serve as thrusters by applying an AC voltage,
causing the strong electric field inside the cavity to initiate a plasma breakdown, increasing the
propellant gas temperature. Development of this electrothermal thruster, named the MCD
thruster, has been conducted primarily on an experimental basis with computational modeling
support. In order to validate the performance of the MCD thruster three sets of tests have been
performed: thrust tests, Paschen minimum breakdown tests, and thermal efficiency tests.
Thrust tests were performed on a compact thrust stand and indicated that an integral micronozzle
produced a thrust coefficient large enough to be effective from an efficiency standpoint. Paschen
minimum breakdown tests determined that the correct term to use in the parameter was the
linear separation distance between the aluminum substrates of the two electrode foils. This
finding differs from MCD devices used for illumination where the cavity diameter is the

64
dominant term. Paschen testing also provided a practical limit on the line pressure used in
testing and a rough system-level estimate of the voltages required to make optimal use of the
thruster. Heating and thermal efficiency testing indicated the MCD thruster was capable of a
high degree of heating and moderate thermal efficiency, up to 280 K and 22%. Increased
nitrogen content in the propellant gas generally increased the degree of heating and efficiency
observed, this increase is due to several factors. First, in the MCD process nitrogen is a more
effective energy absorbing agent, as the energy imparted by a collision is stored in the rotational
and vibrational excited states in addition to the electronic excited state, and as a result greater
energy is deposited in the propellant gas. Second, as shown in Appendix B, the addition of
nitrogen to the propellant gas results in the majority of the heating occurring away from the
cavity walls, reducing wall heat losses and increasing the thermal efficiency.
Although the current generation of MCD thrusters is limited due to material choices and
fabrication processes, they are still capable of a relatively high level of performance. The
estimated optimal operating conditions, as determined by the maximum thermal efficiency and
the resulting heating and efficiency are given for two states in Table 5.1.
Table 5.1: Estimated optimal operating conditions and performance figures for a single cavity thruster with Ar-N2 propellant gas.
Line Pressure
[kPa] N2 Content [%] ∆po [kPa] ∆To [K] ηth [%]
40 15 30 500 25
100 15 50 300 35

65
5.2 Recommendations and Future Work
This work covered the earliest stages of development of the MCD thruster. The possibilities for
future work are vast. Two additional projects utilizing MCD thruster technology are underway.
The first is an improved CFD model of the MCD discharge process being undertaken at the
University of Texas at Austin. The second effort is the use of a modified MCD thruster as a
means of dissociating gaseous iodine for a gas-dynamic laser being undertaken at the High
Energy Laser Lab at the University of Illinois. Further development of MCD devices for use as
spacecraft thrusters can proceed in many directions. From both a system and an efficiency
standpoint the argon-nitrogen mixture currently used as a propellant is non-optimal and a number
of different substances are candidates for further exploration. Initial studies of storable liquid
propellants such as nitrous oxide and various refrigerants have been performed. From a systems
perspective liquid propellants are a more attractive option than pressurized gasses, as they have a
higher storage density and a smaller tankage fraction. Within the Ar-N2 system currently in use
the optimal propellant mixture remains to be determined and efforts to maximize efficiency
simply by altering the nitrogen content would be of great benefit to the overall system integration
of the thruster. Perhaps the most immediate concern is the improvement of the materials used in
fabrication of the electrode foils, as the current aluminum/aluminum oxide system has several
limitations with respect to system robustness.
The ultimate goal of any thruster project is of course operational deployment on a spacecraft, and
the MCD thruster is no exception. Since the MCD thruster has a number of advantages with
respect to nanosatellite use, it remains a candidate for use on several proposed Cube Sat
missions. As with any propulsion system, the thruster configuration would have to be modified

66
to meet system parameters, but it is likely that such efforts would show that the MCD thruster
will be ideally suited for the role of nanosatellite propulsion.

67
References
[1] Barry D. Watts, "The Military Use of Space: A Diagnostic Assessment," The Center for
Strategic and Budgetary Assessments, Washington, D.C., 2001.
[2] California Polytechnic State University Cubesat Program. (2009, August) Cubesat Design
Specification Rev. 12. [Online].
http://cubesat.atl.calpoly.edu/images/developers/cds_rev12.pdf
[3] Adam M. Baker, Curiel A. Da Silva, J. Schaffner, and M. Sweeting, "You Can Get There
From Here: Advanced Low Cost Propulsion concepts for Small Satellites Beyond LEO,"
Acta Astronautica, vol. 57, no. 2-8, pp. 288-301, 2005.
[4] N. Z. Warner and M. Martinez-Sanchez, "Design and Preliminary Testing of a Miniaturized
TAL Hall Thruster," in Collection of Technical Papers- Proceedings of the
AIAA/ASME/SAE/ASEE 42nd Joint Propulsion Conference, 2006, pp. v. 8, p. 6422-6435.
[5] R. Thomas, "Development and Testing of a Gallium Electromagnetic (GEM) Thruster,"
University of Illinois at Urbana-Champaign, Urbana, IL, PhD Thesis 2010.
[6] J. M. Fife et al., "Orbital Performance Measurements of Air Force Electric Propulsion Space
Experimental Ammonia Arcjet," Journal of Propulsion and Power, vol. 18, no. 4, pp. 749-
753, 2002.
[7] P. G. Lichon, D. L. Tilley, R. Anderson, and J. M. Sankovic, "500 W Arcjet System
Development and Demonstration," in Proceedings of the 26th International Electric
Propulsion Conference, 1997.
[8] K. M. Goovaerts, S. G. Bilen, and M. M. Micci, "Design and Initial Testing of Miniature
Microwave Electrothermal Thruster (MiniMET)," no. AIAA Paper 2007-5293, 2007.
[9] Y. Takao, K. Eriguchi, and K. Ono, "A Miniature Electrothermal Thruster Using
Microwave-excited Microplasmas: Thrust Measurement and its Comparison With
Numerical Analysis," Journal of Applied Physics, vol. 101, pp. 123307-123316, 2007.
[10] W. E. Morren, S. S. Hay, T. W. Haag, and J. S. Sovey, "Performance Characterizations of
an Engineering Model Multipropellant Resistojet," Journal of Propulsion and Power, vol. 5,
no. 2, pp. 197-213, 1989.
[11] R. G. Jahn, Physics of Electric Propulsion. New York: McGraw-Hill, 1968, ch. 6.
[12] K. H. Becker, Schoenbach, and J. G. Eden, "Microplasmas and Applications," Journal of
Physics D: Applied Physics, vol. 39, no. 3, pp. R55-R70, 2006.

68
[13] Alexander M. Ghosh, "Study of Atmospheric Drag Recovery Trajectories of Low-thrust
Cubesats," University of Illinois at Urbana Champaign, Urbana, IL, Masters Thesis 2009.
[14] D. Spence, N. Demmons, and T. Roy, "A Compact Low-Power High-Isp Thruster for
Microsatellites," Busek, Airforce Research Laboratory, AFRL-RZ-ED-TP-2008-233, 2008.
[15] S-. J. Park et al., "Microdischarge Arrays: A New Family of Photonic Devices (Revised),"
IEEE Journal on Selected Topics in Quantum Electronics, vol. 8, no. 2, pp. 387-394,
March/April 2002.
[16] Robert L. Bayt, "Analysis, Fabrication, and Testing of a MEMS-based Micropropulsion
System," Massachusetts Institute of Technology, Cambridge, MA, PhD Thesis 1999.
[17] R. L. Burton et al., "Initial Development of the Microcavity Discharge Thruster," in
Proceeding of the 31st Internation Electric Propulsion Conference, Ann Arbor, Michigan,
2009.
[18] R. L. Burton et al., "Development of the MCD Thruster for Nanosat Propulsion," in
Proceedings of the 57th Joint Army Navy NASA Air Force Propulsion Meeting, Colorado
Springs, Colorado, 2010.
[19] D. L. Bitzer and H. G. Slottow, "The Plasma Display Panel- A Digitally Addressable
Display With Inherent Memory," in Proceedings of the American Federation of Information
Processing Societies, Washington, D.C., 1966, p. 541.
[20] H. G. Slottow, "Plasma Displays," IEEE Transactions on Electron Devices, vol. 23, pp.
760-722, 1976.
[21] H. Sitaraman and L. Raja, "Simulation Studies of Alternating-Current Microdischarges for
Microthruster Applications," in Proceedings of the 48th AIAA Aerospace Sciences Meeting,
AIAA-2010-231, 2010.
[22] J. D. Anderson, Modern Compressible Flow With Historical Perspective, Third Edition.
New York: McGraw-Hill, 2004, ch. 3.
[23] M. J. Wilson, S. S. Bushman, and R. L Burton, "A Compact Thrust Stand for Pulsed Plasma
Thrusters," in Proceedings of the 26th International Electric Propulsion Conference, 1997,
pp. 765-772.
[24] Y. A. Cengel and J. M. Cimbala, Fluid Mechanics: Fundamentals and Applications. New
York: McGraw-Hill, 2004, ch. 8.
[25] J. D. Cobine, Gaseous Conductors: Theory and Engineering Applications, 1st ed. New
York: Dover Publications, 1958.

69
[26] P. Carazzettia, Ph. Renaudb, and H. R. Shea, "Experimental Study of Electrical Breakdown
in MEMS Devices With Micrometer Scale Gaps," Proceedings of SPIE (International
Society for Optics and Photonics), vol. 6884, pp. 688404-1-11, 2009.
[27] M. de Chadenedes et al., "Advances in Microcavity Discharge Thruster Technology," in
Proceedings of the 46th AIAA/ASME/SAE/ASEE Joint Propulsion Conference, Nashville,
TN, 2010.

70
Appendix A- Thruster and Electrode Fabrication
All MCD thrusters tested were fabricated at the Laboratory for Optical Physics and Engineering
at the University of Illinois. At the current level of technology the MCD thruster is assembled
almost entirely by hand. Although there are several additional pieces involved, the key
components of the MCD thruster are the two aluminum/aluminum oxide electrodes which form
the plates of the capacitor. Fabrication of the electrodes is an involved process which will be
described in brief below. Note that in order to protect intellectual property several steps have
been omitted or edited.
1. The base material for the electrode is a 0.75” x 3” foil cut from 127 μm thick, 99% pure
Aluminum (Al 1100) sheet.
2. The cavities are drilled into the base foil using a 100-300 μm diameter drill bit.
3. Burrs and deformations in the cavity are removed using an electro-polishing process with
a perchloric acid and ethyl alcohol mixture.
4. The aluminum oxide dielectric layer is grown on the aluminum substrate via an 8-12 hour
anodization process in an oxalic acid solution.
5. One of two cavity insulation material is added to block arcing between any cracks in the
oxide layer that may form. Depending on the insulation material, different curing
temperatures are used.
a. Liquid polyimide is applied to the cavity via a spin-coating process and cured at
250 °C for 1 hour.

71
b. A glass paste coating is applied to the cavity via a spin coating process and cured
at a maximum temperature of 560 °C.
6. Once the insulation material has cured the electrodes are ready for assembly.
Following fabrication of the electrodes the two foils are aligned under a microscope, with the
addition of a 25 μm thick polyimide insulation sheet if necessary. The electrode alignment is
then secured with Loctite Hysol 1-C epoxy resin. The power wires are secured to an exposed
portion of the aluminum substrate with conductive epoxy. A boron nitride discharge shroud is
placed around the cavity exit to prevent arcing between the exhaust plume and the small exposed
area of the downstream foil. A ¼” diameter glass tube is fitted over the discharge shroud so that
the thruster can be connected to the Ultra Torr fitting on the vacuum tank. Finally, a ¼”
diameter propellant feed tube is connected to the upstream side of the thruster and the whole
assembly is covered in more Hysol 1-C resin to provide insulation.

72
Appendix B- Computational Modeling
The experimental development effort of the MCD thruster is supported by a computational
modeling program undertaken at the University of Texas at Austin. As the experimental and
computational sciences involve entirely different principles, the methodology is not discussed
here. Further reading regarding the computational models used for simulating the MCD thruster
can be found in Sitaraman and Raja. [21]
With regards to thruster performance the computational results have provided a number of
insights with regards to the physics of thruster operation. The first conclusion is that power is
supplied to the discharge in narrow (short duration) pulses rather than in a uniform fashion.
Thus increasing the frequency of the voltage waveform increases the power delivered to the
flow, a result which agrees with both theory and experimental results. The second conclusion is
that the primary heating mechanism present in the discharge is ion joule heating rather than the
electron heating that was originally expected to be the dominant mechanism. Finally,
computational modeling revealed that the addition of nitrogen to the propellant gas mixture
increases both the temperature of the discharge, illustrated in Figure B.1, and the thermal
efficiency. The increased heating is a result of the greater energy absorption capabilities of
nitrogen in an MCD, while the increase in efficiency is a result of the heating region being
moved towards the center of the flow, illustrated in Figure B.2. It should also be noted that
while the nitrogen molecules undergo vibrational excitation during the discharge, the vibrational
relaxation time is several orders of magnitude greater than the residence time of the flow, and
thus any vibrational energy deposited is lost as frozen flow. These results agree with
experimental conclusions and provide further justification for optimizing the propellant gas.

73
Figure B.1: Computational model bulk gas temperature plot for Ar and Ar + 20% N2 propellant gasses.
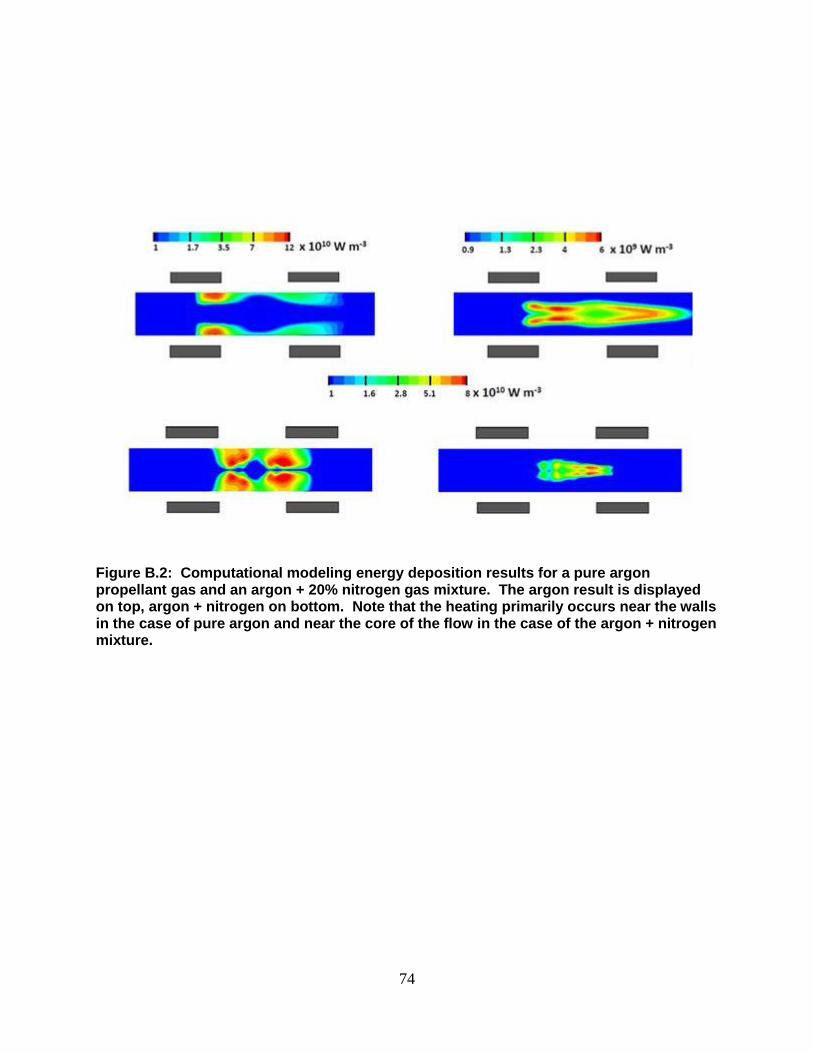
74
Figure B.2: Computational modeling energy deposition results for a pure argon propellant gas and an argon + 20% nitrogen gas mixture. The argon result is displayed on top, argon + nitrogen on bottom. Note that the heating primarily occurs near the walls in the case of pure argon and near the core of the flow in the case of the argon + nitrogen mixture.