Embed Size (px)
Citation preview
1
Advanced Fault Analysis System Advanced Fault Analysis System (or AFAS) for Distribution Power (or AFAS) for Distribution Power
SystemsSystems
Third Annual Electricity Conference at Carnegie Mellon, March 13Third Annual Electricity Conference at Carnegie Mellon, March 13, 2007, 2007
© Concurrent Technologies Corporation 2007
Proprietary
Laurentiu NastacLaurentiu Nastac11, Paul Wang, Paul Wang11, Om Nayak, Om Nayak22, Raluca Lascu, Raluca Lascu33, , Thomas WalkerThomas Walker44, Douglas Fitchett, Douglas Fitchett44,, and Soorya Kuloorand Soorya Kuloor55
11Concurrent Technologies Corporation, Pittsburgh, PA 15219, USAConcurrent Technologies Corporation, Pittsburgh, PA 15219, USA22Nayak Corporation, Princeton, NJ 08540 USA Nayak Corporation, Princeton, NJ 08540 USA
33DTE Energy, Detroit, MI 48226 USDTE Energy, Detroit, MI 48226 US44American Electric Power, Groveport, OH 43125, USAAmerican Electric Power, Groveport, OH 43125, USA
55Optimal Technologies Inc., Calgary, T2P 3P8, Alberta, CanadaOptimal Technologies Inc., Calgary, T2P 3P8, Alberta, Canada

2
Outline
• Objective• Background• Introduction• Methodology Description
– AFAS GUI Development and Software Integration– AFAS PSCAD Custom Simulation Set-up– AFAS PSCAD Implementation and Validation (DTE’s Orion
Circuit)• AFAS PSCAD Fault Prediction Capabilities (DTE’s Jewel Circuit) • Technical and Economic Benefits• Conclusions and Future Work• Acknowledgements• Live Demo of AFAS
© Concurrent Technologies Corporation 2007
Proprietary

3
Objective
• Development of an intelligent, operational, decision-support fault analysis tool (e.g., AFAS) for automatic detection and location of low and high impedance, momentary and permanent faults in distribution power systems
© Concurrent Technologies Corporation 2007
Proprietary

4
Background: Utility Needs• Detecting and locating momentary and permanent faults are
crucial to the planning and operation activities of utilities (DTE, AEP , Progress Energy, PG&E, etc.) – AEP (6230 circuits, a lot of underground cables): Very
useful to predict location of low and high impedance faults
• Detecting quickly and accurately temporary and high impedance faults/failures including voltage dips/sags, distortions, will help utilities increasing the reliability of their distribution systems at a lower cost – Waveform distortions cause problems to:
– Capacitor banks (maltrip of capacitor fuse);– Overheating of transformers and neutral conductors;– Inadvertent trip of circuit breaker or fuse; – Customer devices:
– Malfunctioning of electronic equipment; – Digital clocks running fast
© Concurrent Technologies Corporation 2007
Proprietary

5
Introduction: CTC’s DFSL• CTC’s Distribution Systems Fault locator (DFSL) tool [1]:
– Developed under the DOE-EI program (Fault location project)
– Capable of quickly and accurately predicting the location of permanent faults in distribution power systems
– Validated with fault data from DTE circuits– Hybrid evolutionary Approach consists of 3 main steps:
1. Fault Analysis: Calculate short-circuit currents using fault analysis routine of commercially available modeling and simulation packages
2. Heuristic Rules: A set of rules based on operator experience to predict fault locations
- Compare measured and calculated fault current at substation - Use recloser information (open/closed status and currents)- Use location of customer phone calls to locate outages
3. Optimization using Genetic Algorithm: Objective function optimizes for currents, distance and voltage sags; also minimizes the errors between measured and expected parameters
© Concurrent Technologies Corporation 2007
Proprietary
[1] L. Nastac and A. Thatte, A Heuristic Approach for Predicting Fault Locations in Distribution Power Systems, Proceedings of IEEE NAPS2006, SIU Carbondale, IL, September 15-17, 2006.

6
Introduction : DSFL PredictionsPredictionsPotential Fault Locations Predicted by DSFL tool
(Assuming 10% Difference in Currents) [2]
*DTE’s Orion circuit – Two different faults that occurred in different times at the same locationDTE’s Jewel circuit – Real test performed at DTE on October 15, 2006
Number of potential fault locations
DTE
Circuit Name*
Distance from fault location
to substation
[ft]
Number of
systemCompo-nents
Fault Type
Number of
selectedCompo-nents
Rule #1
Fault Current
Rule #2
Recloser Status –RecloserCurrent
Rule #3
Customer phone
call
GA
Clark 6900 2300 A-C 188 12 8 – N/A 3 3
Orion #1 6900 1078 B-G 125 21 17 – N/A 6 6
Orion #2 6900 1078 C-G 125 21 19 – N/A 12 7
Mac 19,100 2401 C-G 169 23 8 – N/A 4 4
Jewel 26,700 1762 A-G 98 16 15 – 8 NA 4
[2] L. Nastac et al., Methodology and Implementation Strategy for Predicting the Location of Permanent Faults in Distribution Power Systems, Proceedings of IASTED2007, January 3-5, 2007
© Concurrent Technologies Corporation 2007
Proprietary
7
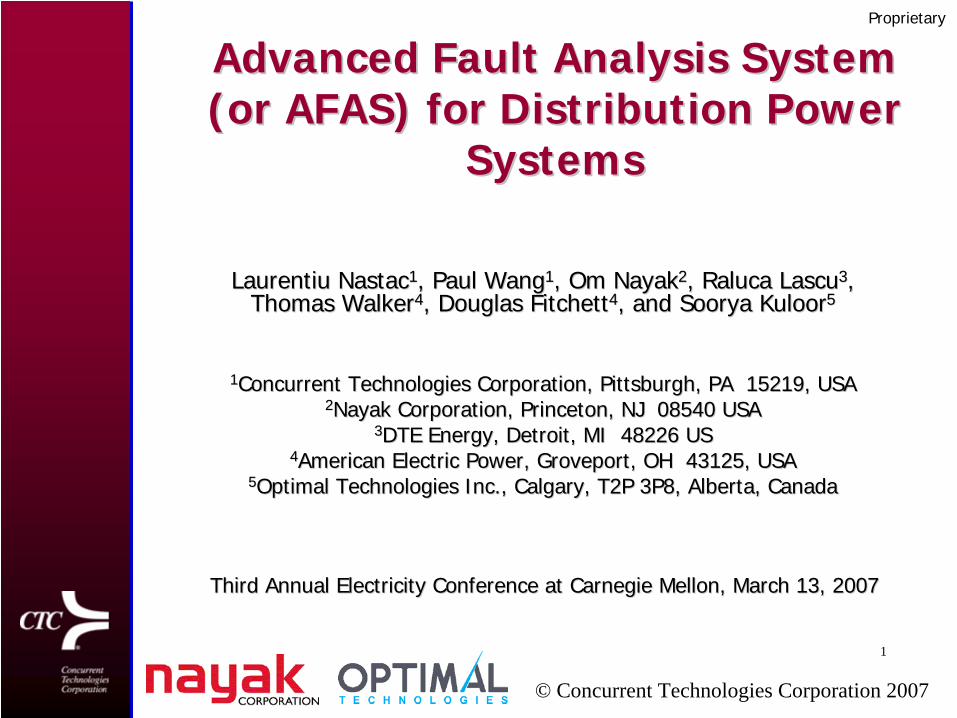
AFAS GUI Screen Design
• Desktop based application: Graphical User Interface (GUI) + Console Based Simulation Engine (e.g., Console)
– GUI has a logon form– GUI can let user enter
simulation parameters, choose input data files, simulation initialization file and output file.
– GUI can communicate with Console seamlessly.
– GUI can let user view the output data file.
– GUI can let user access DEW, PSCAD, and DFSL software tools
© Concurrent Technologies Corporation 2007
Proprietary
8
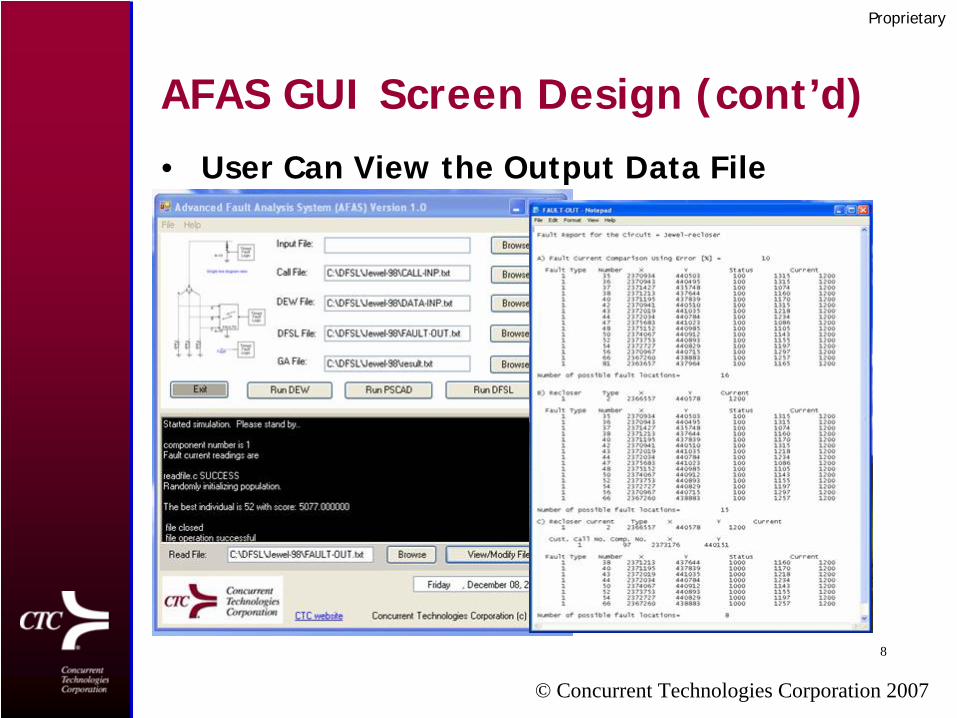
AFAS GUI Screen Design (cont’d)
• User Can View the Output Data File
© Concurrent Technologies Corporation 2007
Proprietary

9
AFAS Screen Design (Version 2.0)• User can view and save/extract the Outage Call
(Microsoft Access/Oracle/SQL/ODBC Database formats) and PQNode data (Comtrade format) Files specific to an outage event
© Concurrent Technologies Corporation 2007
Proprietary

10
PSCAD Custom Simulation Setup• DTE’s Orion circuit in PSCAD
R1
R2 R3 R4
D1R6
R5
© Concurrent Technologies Corporation 2007
Proprietary
11
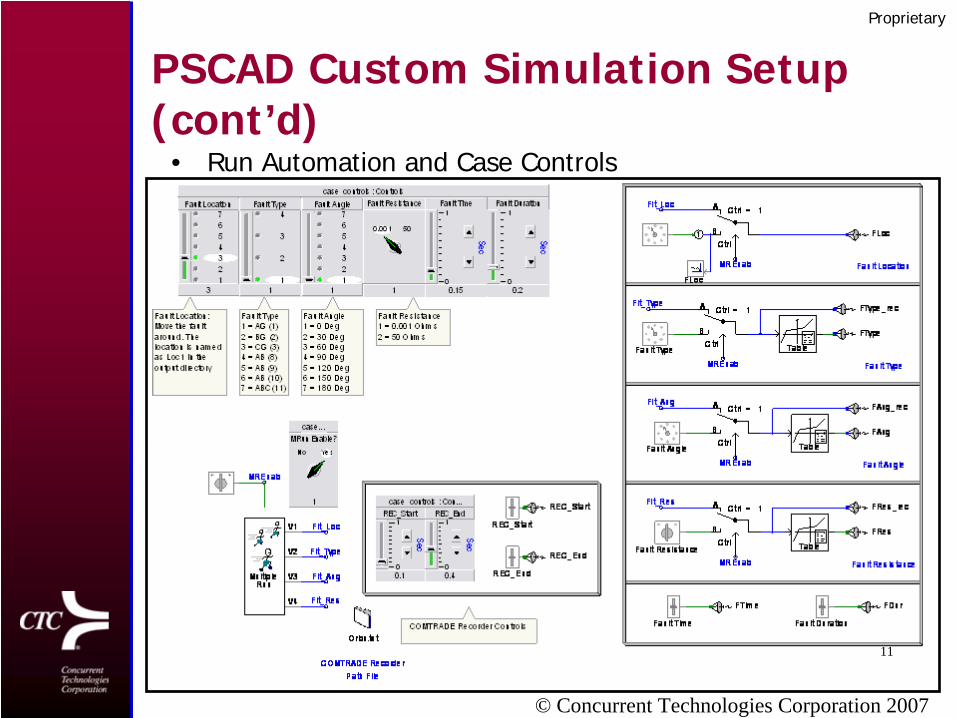
PSCAD Custom Simulation Setup (cont’d)
• Run Automation and Case Controls
© Concurrent Technologies Corporation 2007
Proprietary
12
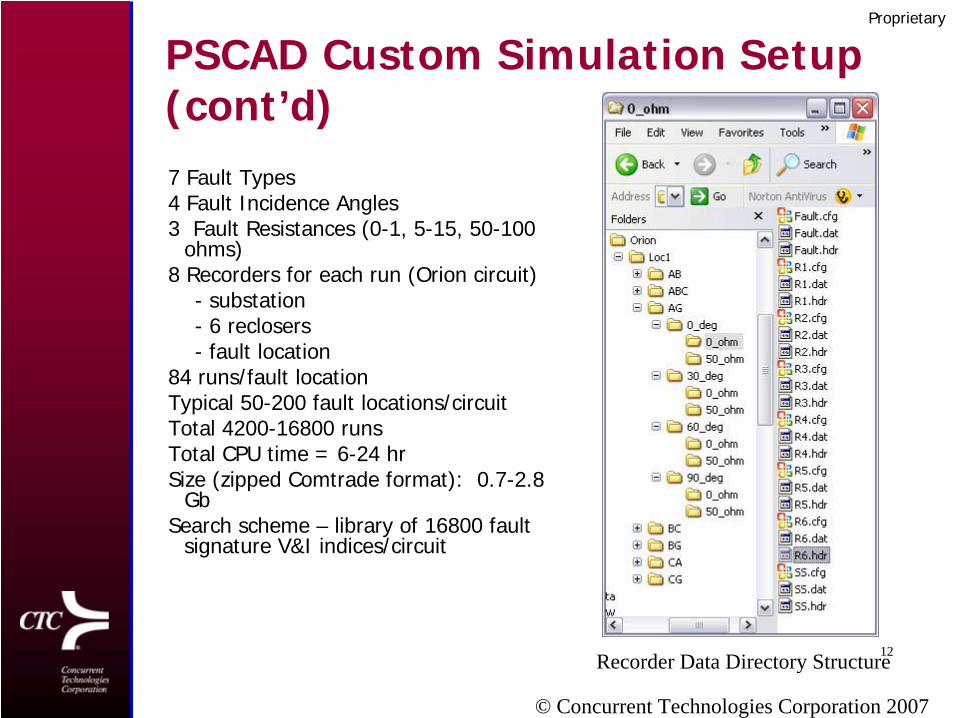
PSCAD Custom Simulation Setup (cont’d)7 Fault Types 4 Fault Incidence Angles 3 Fault Resistances (0-1, 5-15, 50-100
ohms)8 Recorders for each run (Orion circuit)
- substation- 6 reclosers- fault location
84 runs/fault locationTypical 50-200 fault locations/circuitTotal 4200-16800 runs Total CPU time = 6-24 hrSize (zipped Comtrade format): 0.7-2.8
GbSearch scheme – library of 16800 fault
signature V&I indices/circuit
Recorder Data Directory Structure
© Concurrent Technologies Corporation 2007
Proprietary

13
PSCAD Custom Simulation Setup (cont’d)• Plots
© Concurrent Technologies Corporation 2007
Proprietary
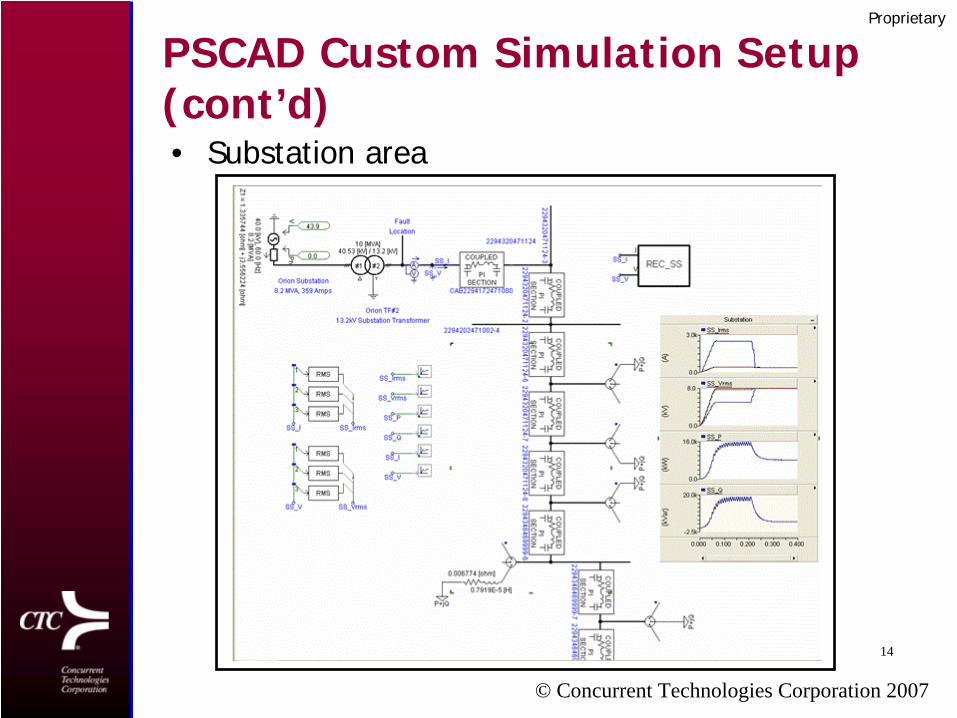
14
PSCAD Custom Simulation Setup (cont’d)• Substation area
© Concurrent Technologies Corporation 2007
Proprietary

15
PSCAD Custom Simulation Setup (cont’d)• Fault location (automatic setting for n number of fault locations)
© Concurrent Technologies Corporation 2007
Proprietary
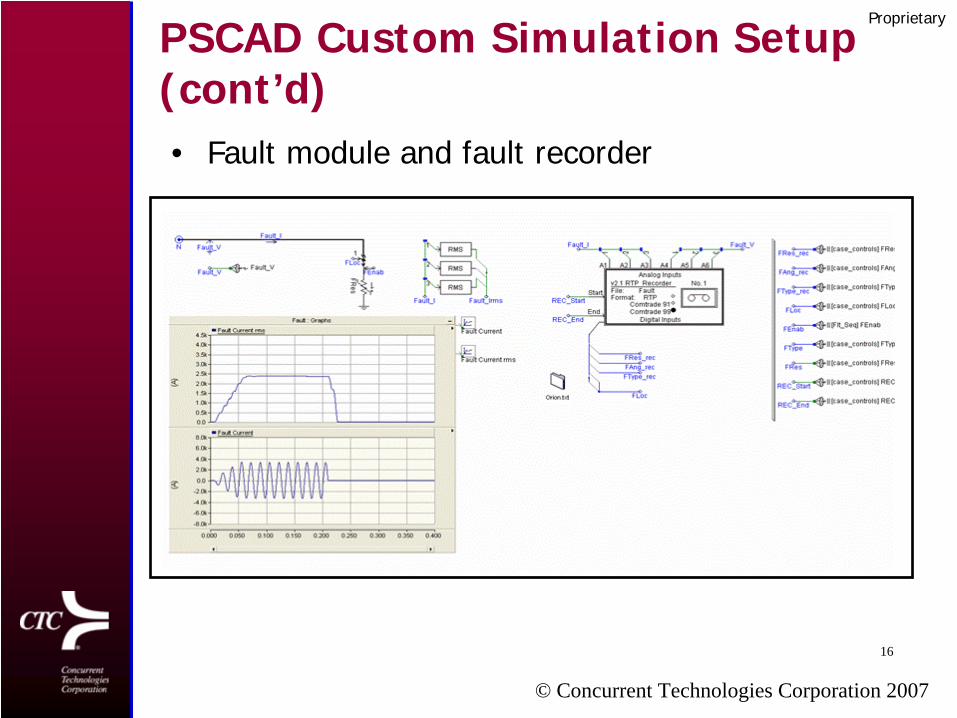
16
PSCAD Custom Simulation Setup (cont’d)• Fault module and fault recorder
© Concurrent Technologies Corporation 2007
Proprietary

17
DTE’s Orion Circuit Validation
• Load Flow Validation (DEW vs. PSCAD)Orion Load-Flow Validation
Voltage
(kV) Current (A) P (kW) Q (kVar) DEW PSC DEW PSC DEW PSC DEW PSC Station A 7.90 7.90 359 370 2633 1049 B 7.90 7.90 359 370 2633 1049 C 7.90 7.90 359 373 2633 1049 3Ph 7.90 7.90 359 371 7899 8091 3147 3480R1 A 7.69 7.70 64 66 429 238 B 7.77 7.71 45 46 313 161 C 7.76 7.73 65 67 441 247 3Ph 7.74 7.71 58 60 1182 1205 646 690R2 0.00 0.00 0 0 0 0 0 0R3 A 7.58 7.60 163 166 1211 230 B 7.68 7.61 172 176 1295 266 C 7.73 7.69 137 143 1055 112 3Ph 7.66 7.63 157 162 3561 3635 608 752R4 A 7.58 7.60 27 28 175 111 B 7.68 7.61 35 36 228 144 C 7.73 7.69 12 13 81 52 3Ph 7.66 7.63 25 26 485 485 306 320R5 A 7.50 7.52 57 61 362 229 B 7.63 7.55 10 15 66 39 C 7.71 7.56 20 25 128 80 3Ph 7.61 7.54 29 34 556 647 348 405D1 A 7.49 7.52 40 40 266 135 B 7.62 7.53 75 75 497 279 C 7.71 7.66 33 33 226 109 3Ph 7.61 7.57 49 49 990 975 522 545R6 A 7.49 7.51 32 32 214 105 B 7.62 7.53 27 27 186 86 C 7.71 7.55 30 30 205 99 3Ph 7.61 7.53 29 30 605 601 290 302
© Concurrent Technologies Corporation 2007
Proprietary

18
Orion Circuit Validation (cont’d)• Fault Current Validation (DTE’s measurement: 2291 A Phase AG at
Recloser 1; predictions within 10% from measurements)
© Concurrent Technologies Corporation 2007
Proprietary

19
Example of PSCAD Predictions• Voltage Sags/Dips (Orion circuit)• Voltage-dip energy Index (Edip ) specific to a fault (defined as
the integral of the drop in signal energy over the duration of the event)
Edip = 0.556
© Concurrent Technologies Corporation 2007
Proprietary
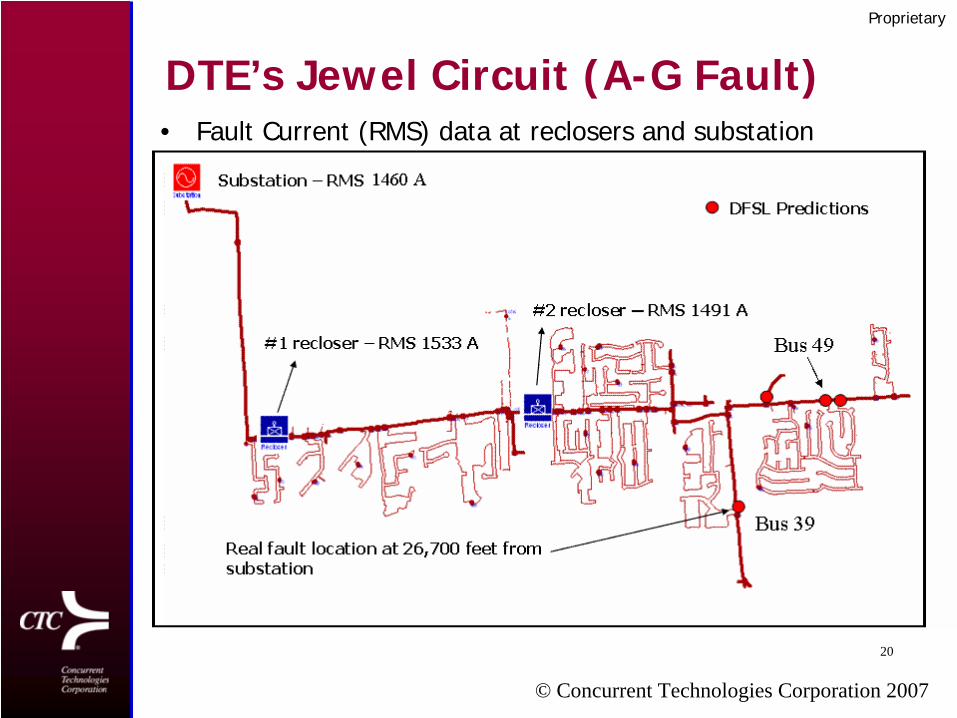
20
DTE’s Jewel Circuit (A-G Fault)• Fault Current (RMS) data at reclosers and substation
© Concurrent Technologies Corporation 2007
Proprietary
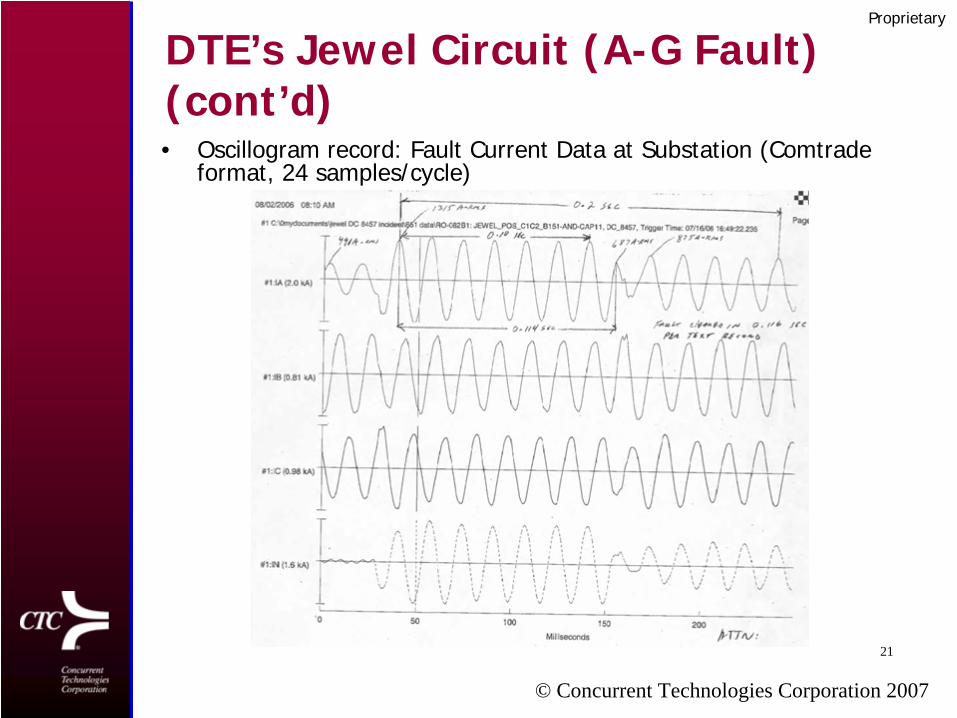
21
DTE’s Jewel Circuit (A-G Fault) (cont’d)• Oscillogram record: Fault Current Data at Substation (Comtrade
format, 24 samples/cycle)
© Concurrent Technologies Corporation 2007
Proprietary

22
© Concurrent Technologies Corporation 2007
Proprietary
DTE’s Jewel Circuit (A-G Fault)
PSCAD Custom Simulation
23
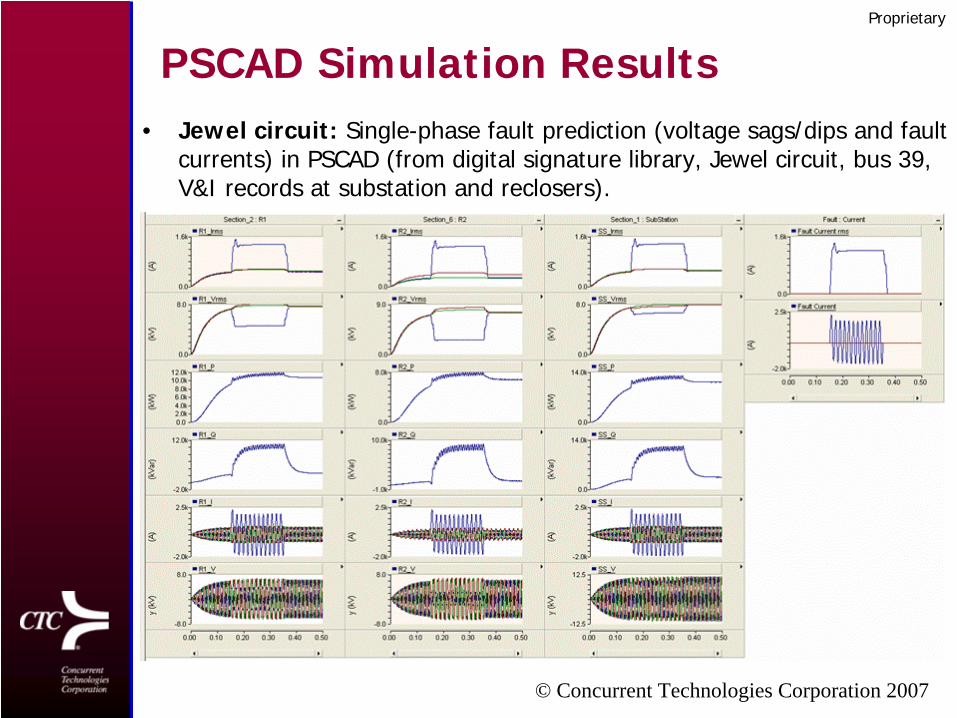
PSCAD Simulation Results• Jewel circuit: Single-phase fault prediction (voltage sags/dips and fault
currents) in PSCAD (from digital signature library, Jewel circuit, bus 39, V&I records at substation and reclosers).
© Concurrent Technologies Corporation 2007
Proprietary
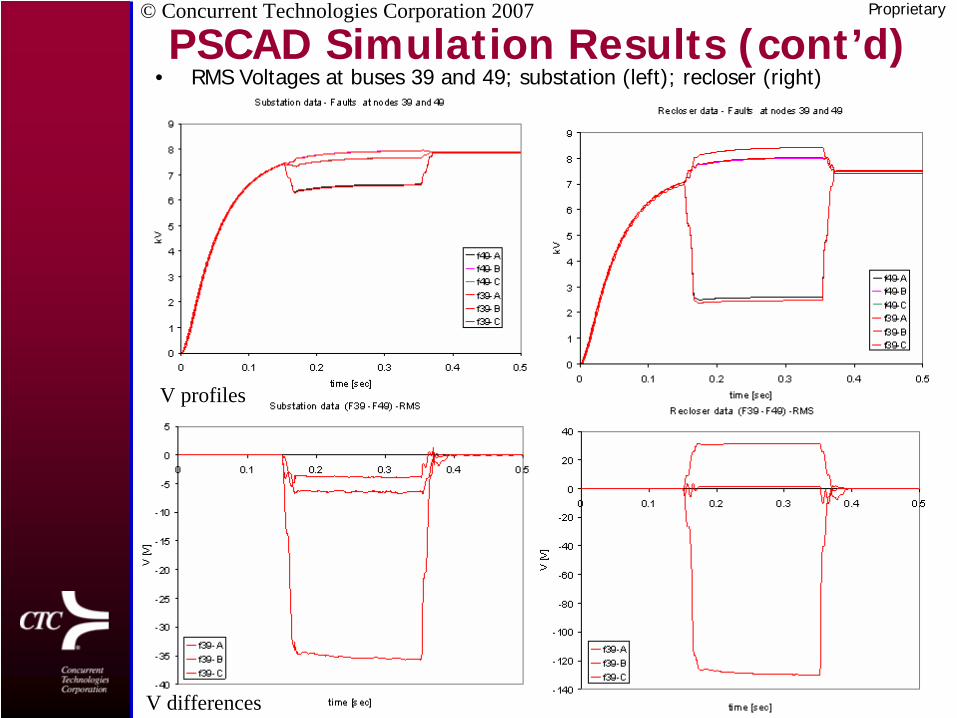
24
PSCAD Simulation Results (cont’d)• RMS Voltages at buses 39 and 49; substation (left); recloser (right)
© Concurrent Technologies Corporation 2007 Proprietary
V profiles
V differences
25
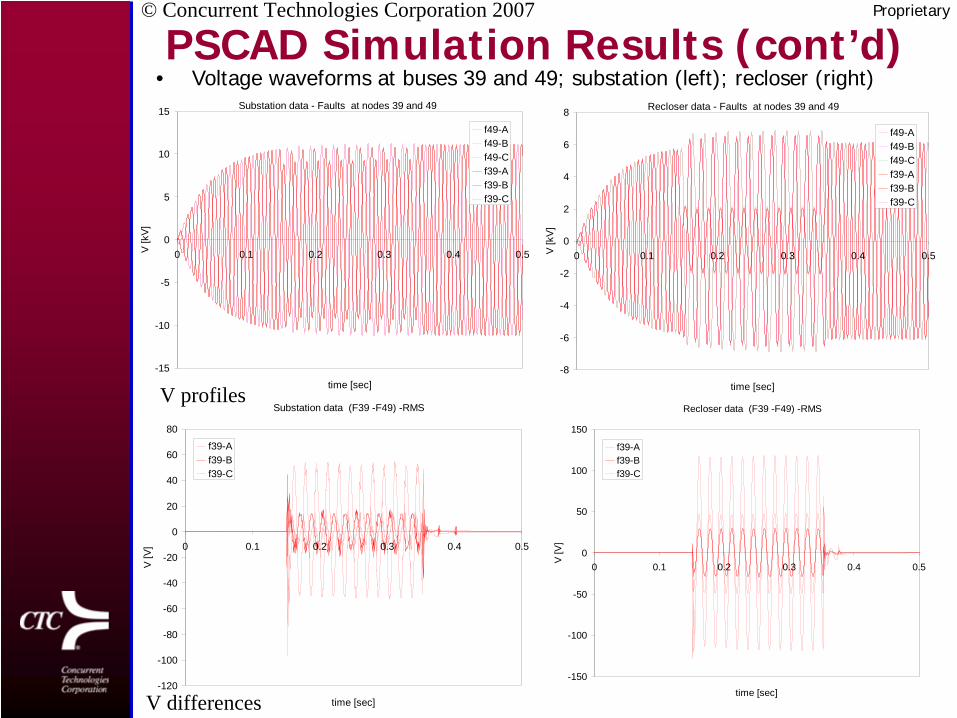
PSCAD Simulation Results (cont’d)• Voltage waveforms at buses 39 and 49; substation (left); recloser (right)
Substation data - Faults at nodes 39 and 49
-15
-10
-5
0
5
10
15
0 0.1 0.2 0.3 0.4 0.5
time [sec]
V [k
V]f49-Af49-Bf49-Cf39-Af39-Bf39-C
Recloser data - Faults at nodes 39 and 49
-8
-6
-4
-2
0
2
4
6
8
0 0.1 0.2 0.3 0.4 0.5
time [sec]
V [k
V]
f49-Af49-Bf49-Cf39-Af39-Bf39-C
© Concurrent Technologies Corporation 2007 Proprietary
Substation data (F39 -F49) -RMS
-120
-100
-80
-60
-40
-20
0
20
40
60
80
0 0.1 0.2 0.3 0.4 0.5
time [sec]
V [V
]
f39-Af39-Bf39-C
Recloser data (F39 -F49) -RMS
-150
-100
-50
0
50
100
150
0 0.1 0.2 0.3 0.4 0.5
time [sec]
V [V
]
f39-Af39-Bf39-C
V profiles
V differences
26
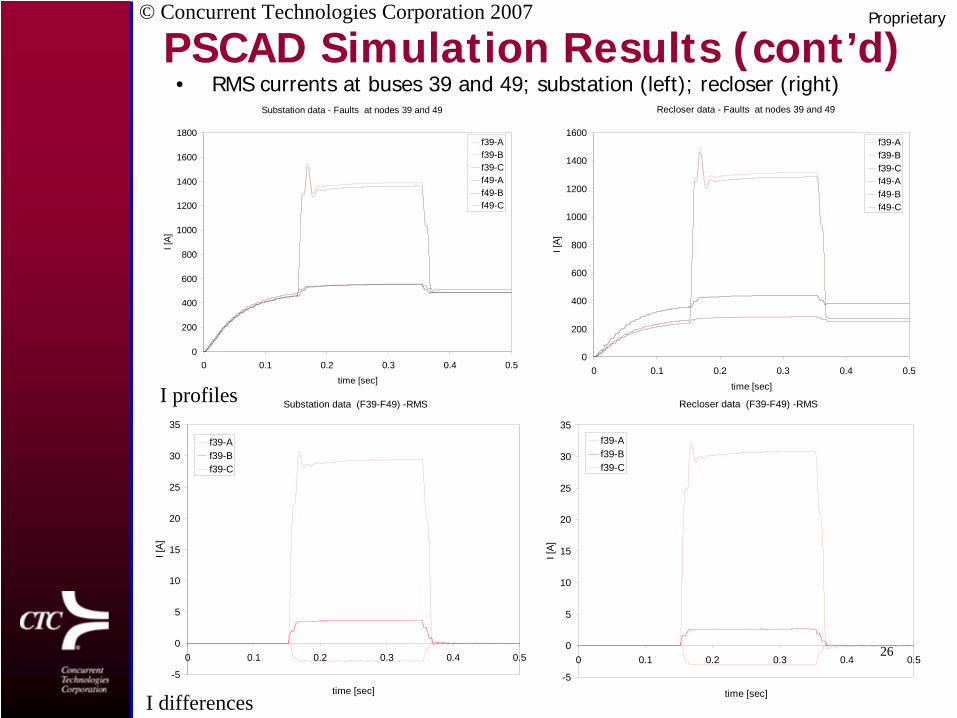
PSCAD Simulation Results (cont’d)• RMS currents at buses 39 and 49; substation (left); recloser (right)
Substation data - Faults at nodes 39 and 49
0
200
400
600
800
1000
1200
1400
1600
1800
0 0.1 0.2 0.3 0.4 0.5time [sec]
I [A]
f39-Af39-Bf39-Cf49-Af49-Bf49-C
Recloser data - Faults at nodes 39 and 49
0
200
400
600
800
1000
1200
1400
1600
0 0.1 0.2 0.3 0.4 0.5time [sec]
I [A]
f39-Af39-Bf39-Cf49-Af49-Bf49-C
© Concurrent Technologies Corporation 2007 Proprietary
Substation data (F39-F49) -RMS
-5
0
5
10
15
20
25
30
35
0 0.1 0.2 0.3 0.4 0.5
time [sec]
I [A]
f39-Af39-Bf39-C
Recloser data (F39-F49) -RMS
-5
0
5
10
15
20
25
30
35
0 0.1 0.2 0.3 0.4 0.5
time [sec]
I [A]
f39-Af39-Bf39-C
I profiles
I differences

27
PSCAD Simulation Results (cont’d)• Current waveforms at buses 39 and 49; substation (left); recloser (right)
© Concurrent Technologies Corporation 2007 Proprietary
I profiles
I differences

28
Jewel circuit: Comparison of Predictions and Measurements at Node 39• RMS Currents (no smoothing): (left) Waveforms; (right) RMS
Sampling rate:Experimental: 1.440 kHzPSCAD = 4 kHz
Imax =1460 A
© Concurrent Technologies Corporation 2007
Proprietary

29
Characterization of DTE’s Jewel Outage Event on July 17, 2006 • Average of RMS Currents ( ): Comparison between
measurements and predictions at buses 39, 43, 49, 51 (locations predicted by DSFL (see page 6)
• Minimum Iindex is at bus 39 (real fault location)
rmsI
© Concurrent Technologies Corporation 2007
Proprietary
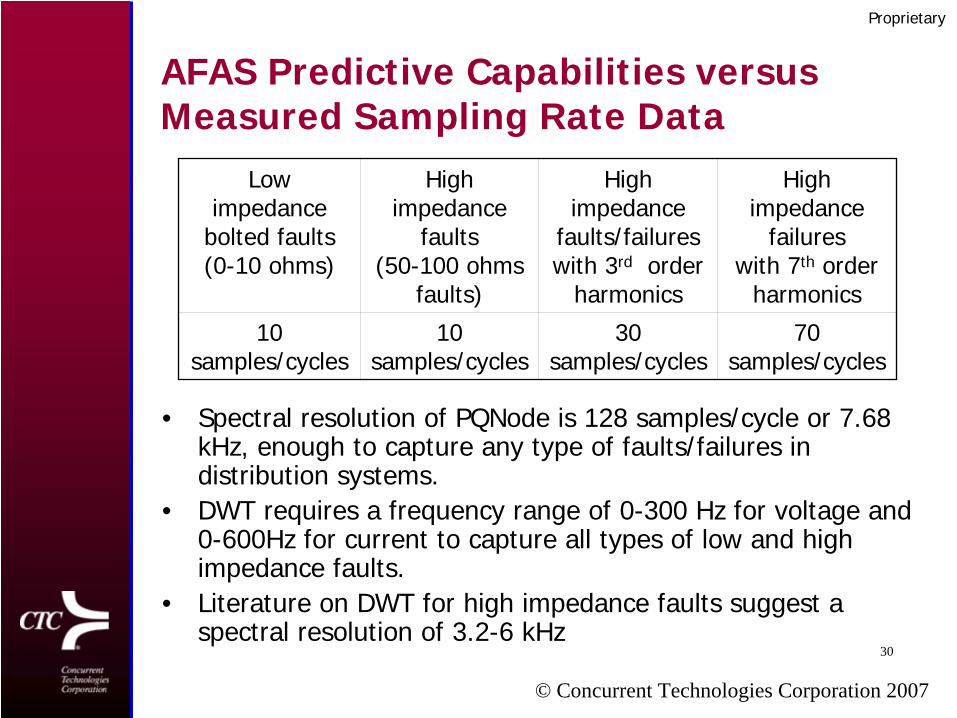
30
AFAS Predictive Capabilities versus Measured Sampling Rate Data
Low impedance
bolted faults (0-10 ohms)
High impedance
faults(50-100 ohms
faults)
High impedance
faults/failures with 3rd order
harmonics
High impedance
failureswith 7th order
harmonics
10 samples/cycles
10 samples/cycles
30 samples/cycles
70 samples/cycles
© Concurrent Technologies Corporation 2007
Proprietary
• Spectral resolution of PQNode is 128 samples/cycle or 7.68 kHz, enough to capture any type of faults/failures in distribution systems.
• DWT requires a frequency range of 0-300 Hz for voltage and 0-600Hz for current to capture all types of low and high impedance faults.
• Literature on DWT for high impedance faults suggest a spectral resolution of 3.2-6 kHz

31
Technical and Economic Benefits
• AFAS software will significantly enhance ability of distribution utilities to provide protection, operational and planning personnel with– Improved fault diagnosis technologies that enable anticipating,
locating, isolating and restoring faults/failures with minimum human input and fast response time
• Specific benefits, unique to the current approach, not easily addressed with current technologies:– Location of “nagging” temporary faults causing momentary
outages– Detection of high impedance faults– Reduced patrol time to locate faults on inaccessible facilities
(including rural and underground) – Improved system analysis (protection, planning and
operational)– Reduced the overall outage time (improved restoration time)– Increased service and component reliability
© Concurrent Technologies Corporation 2007
Proprietary

32
Integration Challenges at Utilities• Interface to existing software systems and need for
communications– AFAS GUI used for software integration and easy
communication/integration with utility databases– Some specific software adaptations will be required at each
utility• Utilization of PQ monitoring devices for waveform
capture– PQNode, transportable Dranetz-BMI 7100’s and Dranetz PP1’s,
Oscillographs, Cooper’s Nova reclosers, etc.– Voltage information recorded at both substation and reclosers is
useful• Integration into the current outage analysis
process– AFAS will plot the fault locations/characteristics in OMS, PQView,
etc., based on utility desires/needs– Faults will also be graphically shown in PSCAD/DEW/etc. or a
simple visualization module will be developed under AFAS platform
© Concurrent Technologies Corporation 2007
Proprietary

33
Integration Challenges at Utilities (cont’d)• Keeping circuit models up-to-date• Pre- and post-processing with the following
attributes– Custom simulation set up that allows for full automation (fault
location module is moved automatically based on a predetermined list of fault locations (selected/all circuit components))
– Search scheme is quick/efficient based on V&I indices (typically less than 20,000 indices/circuit)
– Time-normalized indices; fault duration not an issue; indices account for initial transient behavior of faults; valid for both momentary and permanent faults
– Measured waveforms are processed in real time; their calculated V&I indices are then compared with pre-processed ones from fault library
© Concurrent Technologies Corporation 2007
Proprietary

34
Conclusions• AFAS software is a powerful transient software
tool– It can be used for both planning and operational needs
to study, detect and locate faults/failures in distribution power systems
– V&I fault signature indices can be used to help to determine the location of low impedance momentary and permanent faults
• A great feature of the AFAS is its ability to use:– Only substation (PQNode) and perhaps recloser
recordings (Nova recloser from Cooper that can record waveform V&I values)
– No additional sensors are needed to detect faults and anticipate problems in distribution power systems
– Smart switches may only be needed for restoration purposes
© Concurrent Technologies Corporation 2007
Proprietary

35
• AFAS Predictive capabilities will be significantly enhanced in the next phase:
– Develop filters between PSCAD and DEW/CymDist/PSS- E/AEMPFAST) to ease software communication and speed- up and decrease cost of AFAS implementation at utilities
– PQ and remote (Cooper’s Nova reclosers) monitoring over 3- 6 months of low and high impedance momentary faults at AEP and DTE on several of their worst performing circuits
– Develop an Automatic Disturbance Recognition System:– Heuristic rules to match simulation waveform records from the digital
signature library in Comtrade format, extract waveform distortions, develop RMS records, etc.
– Discrete Wavelet transform (DWT) for feature extraction to be used in a pre-processing mode; an index search scheme will be used
– NN multi-layered perceptron for pattern recognition– Fuzzy logic/heuristic rules for decision making on the
disturbance/transient category
– Develop a specialized post-processing software tool to detect, localize and graphically alarm the user about any kind of faults
Future Work
© Concurrent Technologies Corporation 2007

36
Automatic Disturbance Recognition System
Digital Signature Library
DWT Feature Extraction
Decision Making
Fuzzy LogicHeuristic rules
00 0.10 0.20 0.30
Disturbance waveforms
Artificial Neural Networks
Pattern Recognition
DisturbanceClassification
© Concurrent Technologies Corporation 2007
Proprietary

37
Literature Examples of Wave-fault Disturbance Detection using Daubichies mother wavelet of order 4 (Db4)
High Impedance Fault (time = 0.17 s) Bolted Fault (time =0.2 s)
distortion
© Concurrent Technologies Corporation 2007
Proprietary

38
• Concurrent Technologies Corporation conducted this work under DOE cooperative agreement DE- FC02-04CH11241. Such support does not constitute an endorsement by DOE of the views expressed in this presentation. Approved for public dissemination; distribution is unlimited.
• DTE Energy (Nick Carlson) and AEP (Eric Morris)
Acknowledgements

39
Contact InformationContact Information
• Principle Investigator:• Dr. Laurentiu Nastac• Concurrent Technologies Corporation,• 425 Sixth Avenue, Regional Enterprise Tower• Pittsburgh, PA 15219• Email: [email protected]• Phone: 412-992-5361

40
Backup slides
41
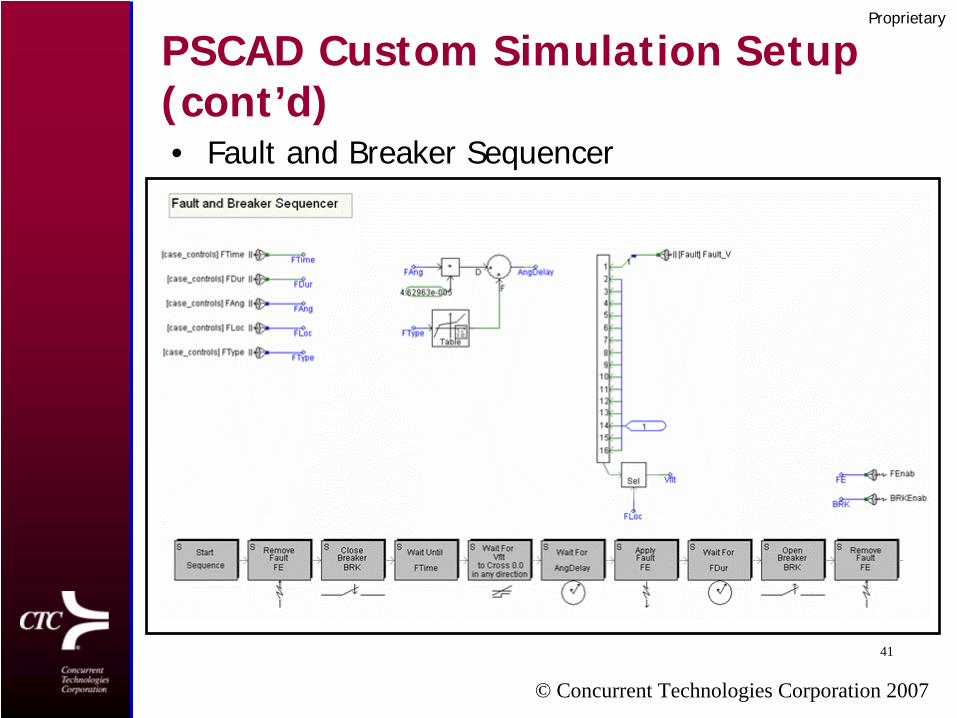
PSCAD Custom Simulation Setup (cont’d)• Fault and Breaker Sequencer
© Concurrent Technologies Corporation 2007
Proprietary

42
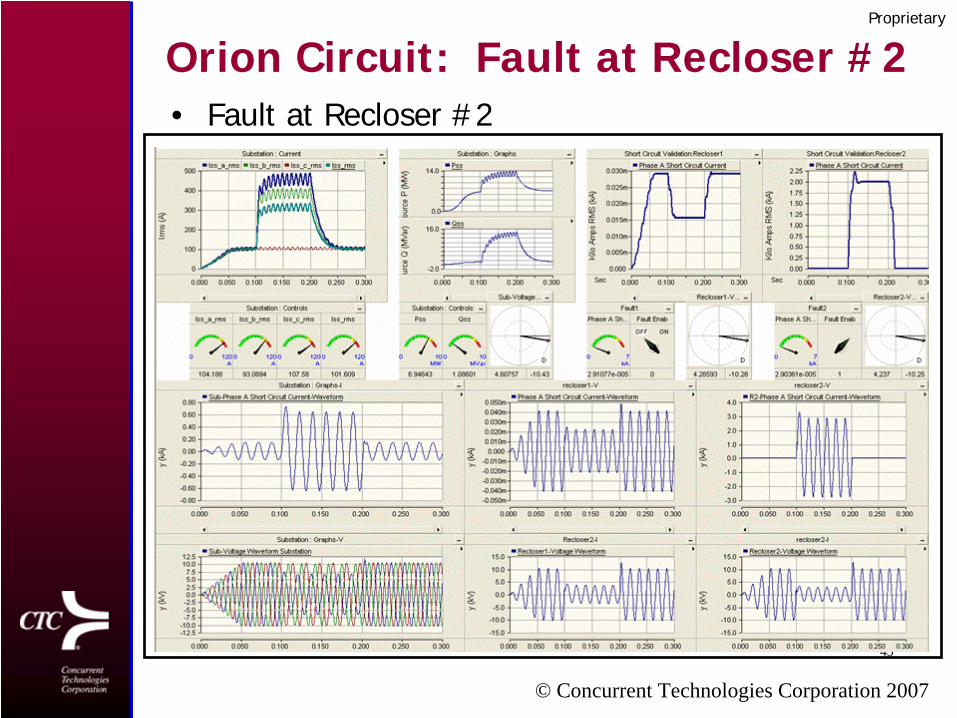
Orion Circuit: Fault at Recloser #2• Recloser #2 area
© Concurrent Technologies Corporation 2007
Proprietary
43
Orion Circuit: Fault at Recloser #2• Fault at Recloser #2
© Concurrent Technologies Corporation 2007
Proprietary
44
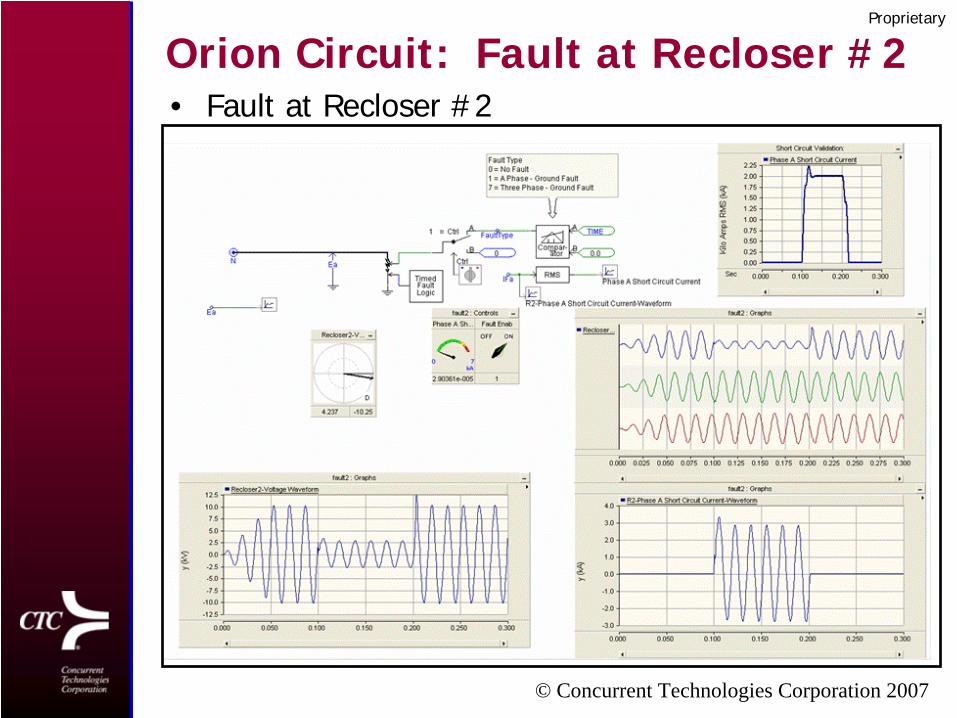
Orion Circuit: Fault at Recloser #2• Fault at Recloser #2
© Concurrent Technologies Corporation 2007
Proprietary

45
Example of PSCAD Predictions• Jewel circuit: Single-phase fault prediction (voltage dips and fault
currents) in PSCAD (From signature library of faults, Jewel circuit, bus 49, V&I records at substation and reclosers).
© Concurrent Technologies Corporation 2007
Proprietary

46
AEP’s Walton Circuit (Clenderin Station)
© Concurrent Technologies Corporation 2007
Proprietary
47
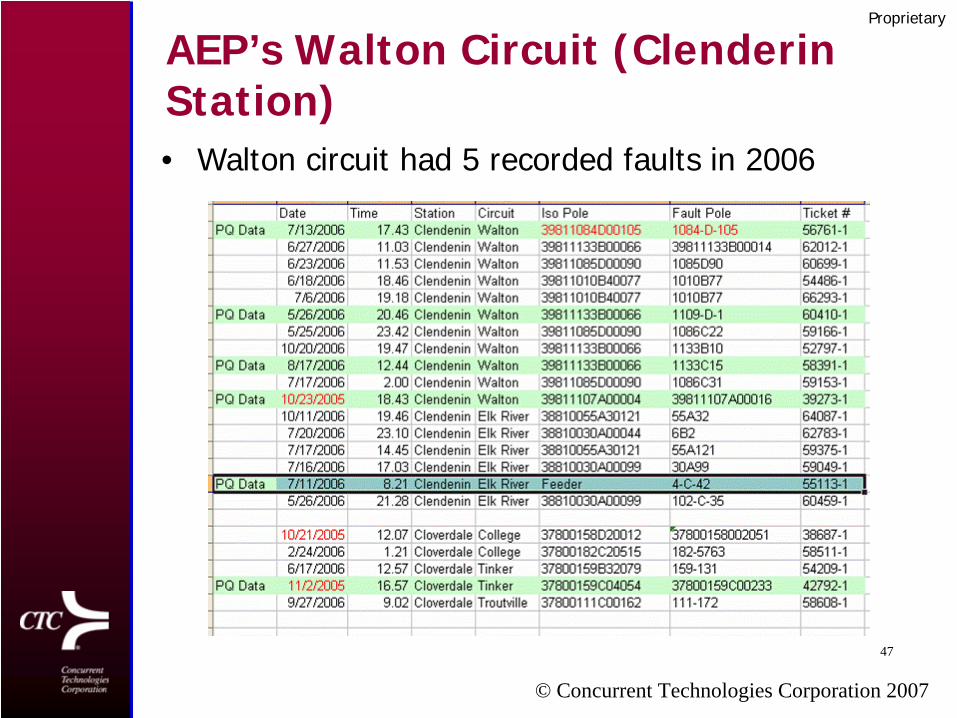
AEP’s Walton Circuit (Clenderin Station)• Walton circuit had 5 recorded faults in 2006
© Concurrent Technologies Corporation 2007
Proprietary

48
AEP’s Walton Circuit (Clendenin Station) (cont’d)• Typical PQNode Fault Current Data at Clendenin Station,
128 samples/cycle)
© Concurrent Technologies Corporation 2007
Proprietary