Embed Size (px)
Citation preview

Proposal for Mongolian Power Stationp gusing Joint Operation System(JOS)
Dec., 2013
© 2013 MITSUBISHI HEAVY INDUSTRIES, LTD. All Rights Reserved.

◆Contents
(1) What’s Joint Operation System (JOS) Actual Performance Functions and Features of JOS Functions and Features of JOS JOS for Paper manufacturing System Configuration Example S i C fi i System Function Configuration How to calculate optimization Calculation Examplep
(2) Proposal for Ulaanbaatar No. 3 and 4 Power Station using JOS Optimizing item ALR & MW Optimizing ALR & MW Optimizing Turbine Optimizing Boiler Demand & Optimizing Boiler Master Controller & Optimizing Boiler Feed Pump Inverter control & Optimizing Conclusions
1© 2013 MITSUBISHI HEAVY INDUSTRIES, LTD. All Rights Reserved.
Conclusions

(1) What’s Joint Operation system(JOS)
What’s JOS ?JOS optimizes the plant status for a minimization of total energy.
H ?How ? • Each boiler, turbine and equipment has a high efficiency
operation band.operation band.• As a practical matter, all equipment can not be operated
on the high efficiency area in the plant.
JOS can coordinate the operation point both the boiler and turbine The operator can lead the plant to the minimizationturbine. The operator can lead the plant to the minimization of total energy using JOS.
2© 2013 MITSUBISHI HEAVY INDUSTRIES, LTD. All Rights Reserved.

◆Actual performance of JOS
T t f JOS ?Target of JOS ?The plant has a number of boiler and turbine with common header.Boiler uses some fuel for combustion.Turbine has some extraction line for process steam.
W h d li d JOS tWe have delivered JOS tothe following plant,• Paper manufacturing
for 3 companiesfor 3 companies = 3Bx7T+16Bx9T, 3T, 6Bx7T
• Iron manufacturingfor 2 companiesp
= 3Bx4T, 5Bx5T• Joint Thermal Power Plant
for 1 company = 3Bx3T
3© 2013 MITSUBISHI HEAVY INDUSTRIES, LTD. All Rights Reserved.
Figure 1. System diagram of paper manufacturing plant.

◆Functions and Features of JOS
Online real-time optimizationJOS calculates the optimal operation demand according to the mass balance of the steam and the power balance when the plant status changed.
Offli ti i tiOffline optimizationJOS can simulate the future plan to determine the running number of boilers and turbines.
Calculation of equipment operation characteristics modelJOS uses the model of boilers and turbines with the actual characteristicsJOS uses the model of boilers and turbines with the actual characteristics .Economical operation demandJOS calculates the total generating cost using nonlinear optimizing solver.Automatic update the nonlinear model using identificationp g fThe model is corrected using the present plant condition.Pattern setting of the utility power and its calendarThe operator can define when the utility power cost is decided and/or renewed by contract .Estimation of the statusJOS estimates the actual value using mass balance because the flow sensor has an error under low flow status.
D d t lDemand controlJOS can selectively warn the operator operating the shutdown of auxiliary machine before the utility power reaches the limit of its contract at the end of a demand cycle.
4© 2013 MITSUBISHI HEAVY INDUSTRIES, LTD. All Rights Reserved.

◆JOS for Paper manufacturing
JOS
( Economical load dispatch )Boiler Input Demand
JOS Input Signals JOS Output Signals
Set point of Extraction Steam Flow
S t i t f M i St Fl
Plant Optimization Function ( p )
Monitoring whole plant status FunctionDemand monitoring /control Function
Main Steam FlowMW Demand
Set point of Main Steam Flow
ControllerController
(DCS)
発電機発電機タービンタービンTurbine G
GOV
GOV
GOV
(DCS)(DCS)
発電機発電機タービンタービンTurbine G
発電機発電機タービンタービンTurbine G
GOV
Boiler
Boiler
Boiler
Boiler
Figure 2. Ex. of JOS for Paper manufacturing Plant
5© 2013 MITSUBISHI HEAVY INDUSTRIES, LTD. All Rights Reserved.
出典: 火原協入門講座 「計測と制御」
Plant.

◆System Configuration Example
Operation Schedule (Daily,
Weekly)
Operation Plan (Power generation, Air supply)
Case studiesCurrent demand setting
OperationOperator
Optimal operation balance display
Offline Real-time JOS instructionsOffline optimization calculation
Real time optimization calculation
Controller(DCS)
JOS instructions
Current values
Status assumption
Economical operation
model
Logs
GOV
Control & Monitoring
Model d
Equipment operation Operation
発電機発電機タービンタービンTurbine G
発電機発電機タービンタービンTurbine G
発電機発電機タービンタービンTurbine G
GOV
GOV
JOS consists of latest personal computer.
updatecharacteristics modelOperationdatabase
BoilerBoiler
6© 2013 MITSUBISHI HEAVY INDUSTRIES, LTD. All Rights Reserved.
BoilerFigure 3. Ex. of system configuration.

◆System Function Configuration
Statistical Data•MW•Steam flow
Cost Data•Power Cost•Fuel Cost
Demand Data•MW•Steam flow
OperationGuidance
OperationCondition
OperatorSteam flow
OptimizationpSystem
CostCost Data Cost CalculationDatabase
OperationSchedule
Optimization
C t i tInstrumentDatabase
Cost
ConstraintCondition
DatabaseP&I
Database
7© 2013 MITSUBISHI HEAVY INDUSTRIES, LTD. All Rights Reserved.
Figure 4. System function configuration.
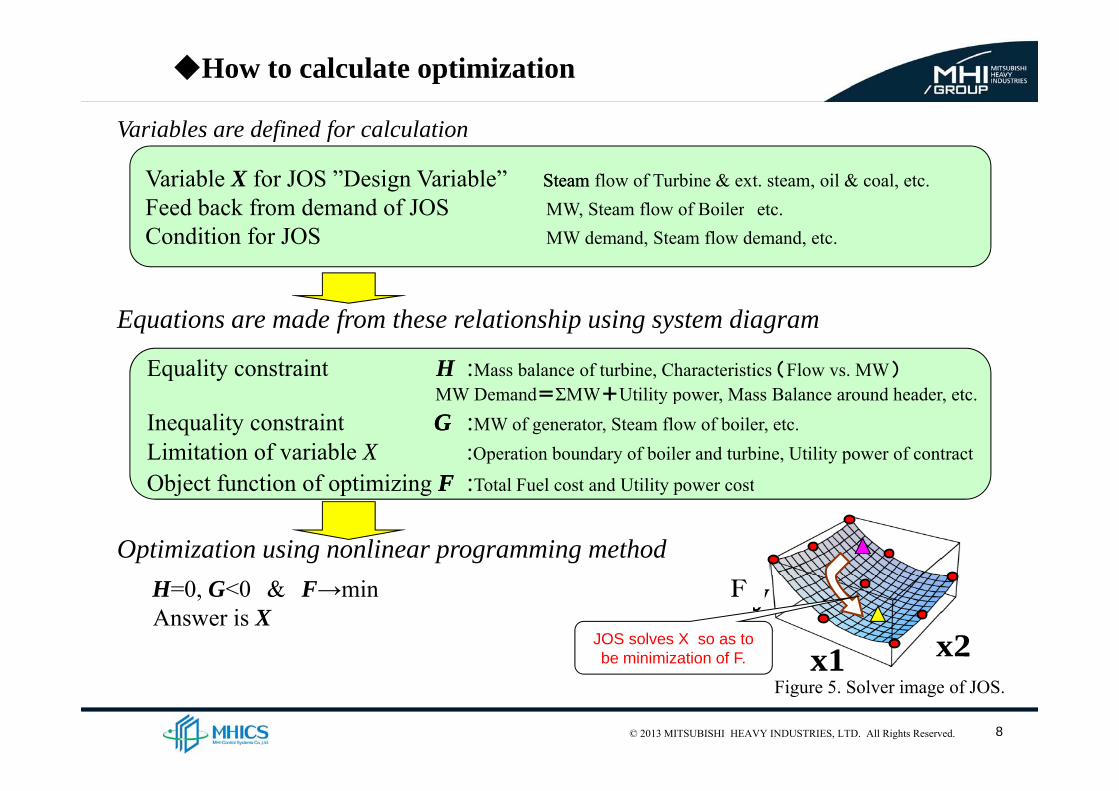
◆How to calculate optimization
V i bl d fi d f l l tiVariables are defined for calculation
Variable X for JOS ”Design Variable” Steam Steam flow of Turbine & ext. steam, oil & coal, etc.Feed back from demand of JOS MW, Steam flow of Boiler etc.,Condition for JOS MW demand, Steam flow demand, etc.
Equations are made from these relationship using system diagram
Equality constraint H :Mass balance of turbine, Characteristics (Flow vs. MW)
MW Demand=ΣMW+Utility power Mass Balance around header etcMW Demand=ΣMW+Utility power, Mass Balance around header, etc.Inequality constraint GG :MW of generator, Steam flow of boiler, etc.Limitation of variable X :Operation boundary of boiler and turbine, Utility power of contract
Object function of optimizing FF :Total Fuel cost and Utility power cost
Optimization using nonlinear programming method
Object function of optimizing FF :Total Fuel cost and Utility power cost
H=0, G<0 & F→minAnswer is X
x1 x2y
x1 x2yF
JOS solves X so as to be minimization of F.
8© 2013 MITSUBISHI HEAVY INDUSTRIES, LTD. All Rights Reserved.
x1x1Figure 5. Solver image of JOS.

◆ Calculation Example
Characteristics of 1T Demand
Minimization for Steam flow
Characteristics of 1T
35MW
10t/h
Ext. Steam0t/h X3(t/h)X1(MW)
Demand
MW = 65MWProc. Steam = 20t/h
● 20t/h
17MW
25MW 30t/h Initial balance●Necessary Steam
= 390t/h
▲
■
HP Header
Boiler150t/h 200t/h
X4( /h)
390t/h
∥
Ext. Steam0 /h
Optimizing
S1(t/h)
Optimizing Characteristics of 2T
~ ~1T 2TX1 X2
48MW40MW
10t/h
20t/h
X4(t/h)
MW after optimizing ■Necessary Steam
= 380t/h■
●
▲
30MW
0t/hX2(MW)
LP HeaderProc. Steam
Cond. Cond.X3
X4
30t/h = 380t/h
Ext. steam aft. opt.▲Necessary Steam
= 378t/h
●30MW
demand
MWDemand
378t/h
∥190t/h 230t/h
228t/h
whereDesign variable is X1~X4Obj t f ti S1+S2
S2 (t/h)
9© 2013 MITSUBISHI HEAVY INDUSTRIES, LTD. All Rights Reserved.
Object function S1+S2Figure 6. Calculation example of JOS.

(2) Proposal for Ulaanbaatar Power Station using JOS
National Dispatching Center
No. 3 Power Station
148MW
No. 4 Power Station
580MWRussia
Boiler
1〜 6B= 75t/h
7〜13B=220t/h
Turbine/Generator
1〜4T=12MW
5〜8T=25MW
Boiler
1,3〜8B=420t/h
2B =500t/h
Turbine/Generator1T = 80MW
2〜6T=100MW
•Problem(1)The operation is manual for Turbine/generator.→ The generating response is delay for the grid.
Figure 7. Ulaanbaatar power station.
(2)The boiler and turbine are not coordinated. → The plant is not stable by the mutual interference.• Improvement
In order to stabilize steam pressure/temperature, improvement of boiler control itself should be required.(1)Stable and optimizing → (2)Reducing an over fuel → (3)Reducing the fuel cost and CO2 emission(1)Stable and optimizing → (2)Reducing an over fuel → (3)Reducing the fuel cost and CO2 emission
•Action(1)The controller of Boilers and turbines should be improved using a proposed control method and a
optimizing solver.(2)The power plant shall be optimized to minimization of total energy using JOS.
10© 2013 MITSUBISHI HEAVY INDUSTRIES, LTD. All Rights Reserved.
(2)The power plant shall be optimized to minimization of total energy using JOS.
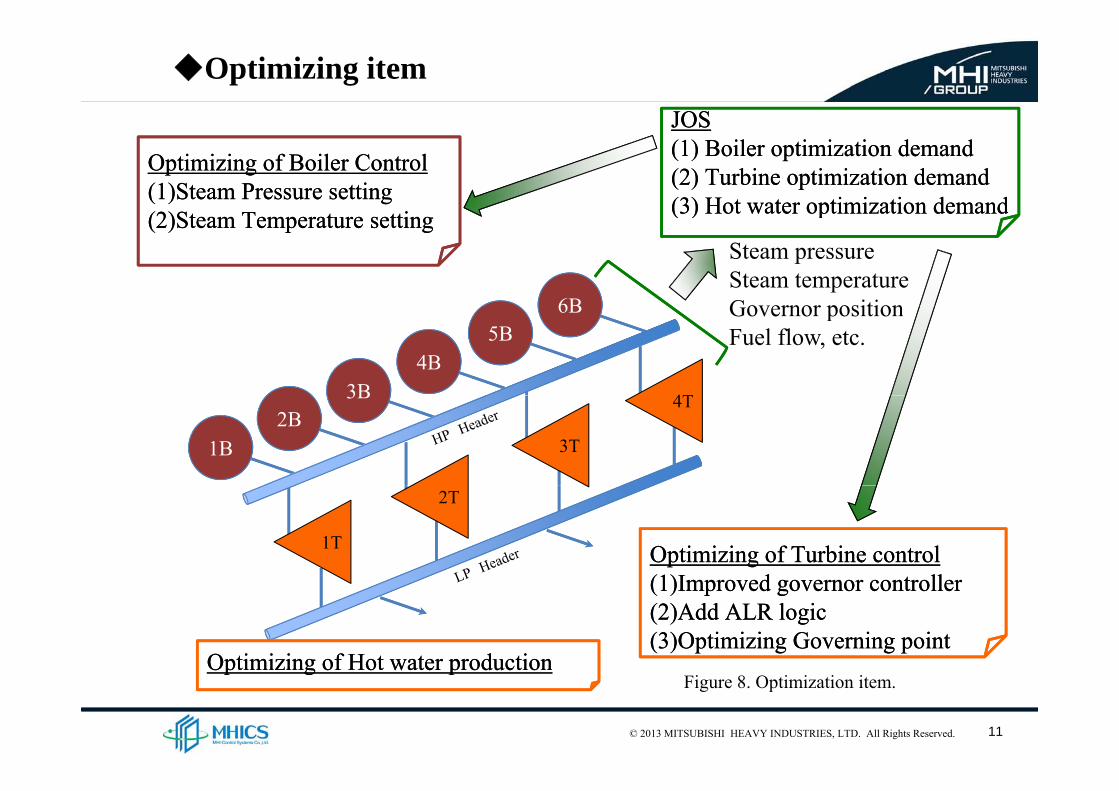
◆Optimizing itemJOSJOS
Optimizing of Boiler Control(1)Steam Pressure setting(2)St T t tti
Optimizing of Boiler Control(1)Steam Pressure setting(2)St T t tti
JOS(1) Boiler optimization demand(2) Turbine optimization demand(3) Hot water optimization demand
JOS(1) Boiler optimization demand(2) Turbine optimization demand(3) Hot water optimization demand
6B
(2)Steam Temperature setting(2)Steam Temperature setting ( ) p( ) p
Steam pressureSteam temperatureGovernor position
4T3B4B
5B6B Governor position
Fuel flow, etc.
3T
4T
1B2B
3B
1T
2T
Optimizing of Turbine control(1)I d llOptimizing of Turbine control(1)I d ll(1)Improved governor controller(2)Add ALR logic(3)Optimizing Governing point
(1)Improved governor controller(2)Add ALR logic(3)Optimizing Governing point
Optimizing of Hot water productionOptimizing of Hot water production
11© 2013 MITSUBISHI HEAVY INDUSTRIES, LTD. All Rights Reserved.
Optimizing of Hot water productionOptimizing of Hot water productionFigure 8. Optimization item.
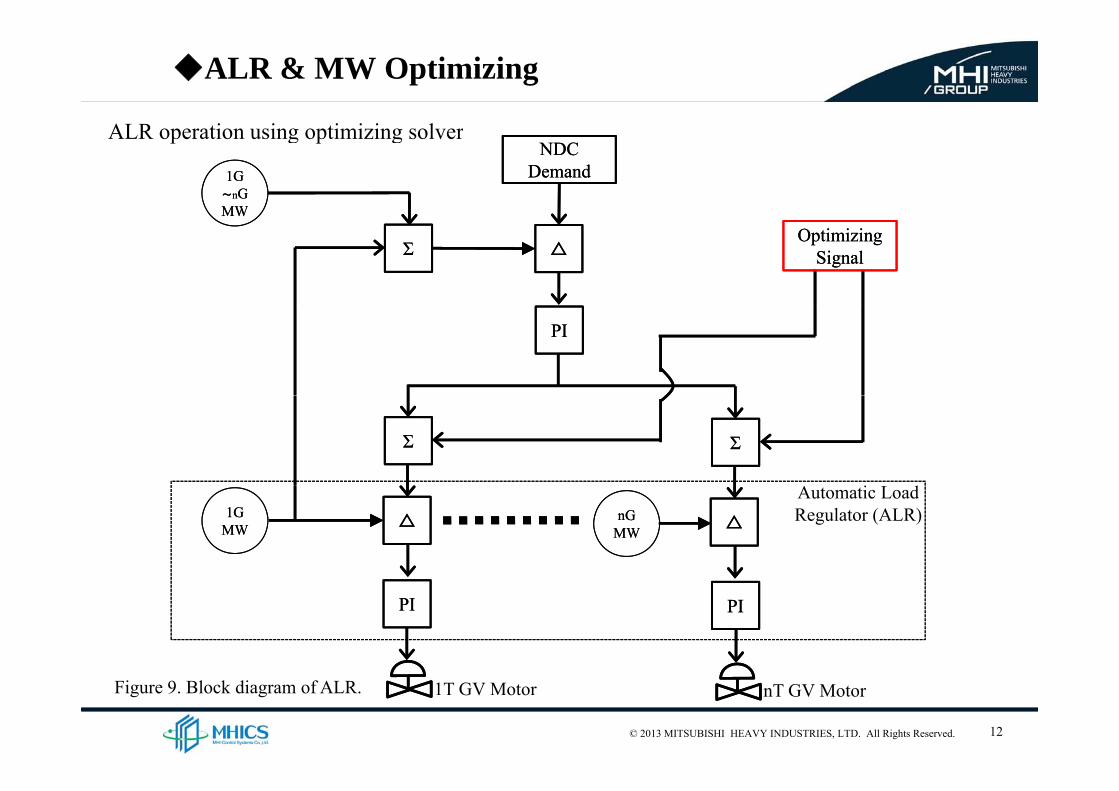
◆ALR & MW Optimizing
ALR ti i ti i i lALR operation using optimizing solverNDC
DemandNDC
Demand1G〜nGMW
1G〜nGMW
△△ΣΣ
WW
OptimizingSignal
OptimizingSignal
PIPI
ΣΣ ΣΣ
△△1G
MW1G
MW △△nGMWnG
MW
Automatic Load Regulator (ALR)
PIPI PIPI
12© 2013 MITSUBISHI HEAVY INDUSTRIES, LTD. All Rights Reserved.
1T GV Motor nT GV MotorFigure 9. Block diagram of ALR.

◆Turbine Optimizing(1/3)
Specifications of Turbine governor Case Study 1Specifications of Turbine governor
60
80
100ift
(%)
100
If Total output=200MW by 3 generatorsCase Study 1
20
40
60
Val
ve L
i
20406080
60
80
100
w (%
)
0020
0 20 40 60 80 100Optimizing
0
20
40
60
Ste
am F
low
2 Generators output=50MWx2
1 Generator output=100MW
p g
0
6080100
oss
of G
V
)
Good operating point 6080100
02040
Pres
sure
Lo
(%
02040
0 20 40 60 80 100
13© 2013 MITSUBISHI HEAVY INDUSTRIES, LTD. All Rights Reserved.
0 20 40 60 80 100Turbine GV Demand(%)
P 0 20 40 60 80 100Turbine GV Demand(%)
Figure 10. Turbine optimizing.

◆Turbine Optimizing(2/3)
Specifications of Turbine governor Case Study 2Specifications of Turbine governor
60
80
100ift
(%)
80100
If Total output=200MW by 3 generatorsCase Study 2
20
40
60
Val
ve L
i
20406080
60
80
100
w (%
)
0020
0 20 40 60 80 100Optimizing
0
20
40
60
Ste
am F
low
Reducing turbines inlet pressure set point
p g
0
6080100
oss
of G
V
)
Good operating point 6080100
02040
Pres
sure
Lo
(%
02040
0 20 40 60 80 100
14© 2013 MITSUBISHI HEAVY INDUSTRIES, LTD. All Rights Reserved.
0 20 40 60 80 100Turbine GV Demand(%)
P 0 20 40 60 80 100Turbine GV Demand(%)

◆Turbine Optimizing(3/3)
Specifications of Turbine governor Case Study 3Specifications of Turbine governor
60
80
100ift
(%)
80100
If Total output=200MW by 3 generatorsCase Study 3
20
40
60
Val
ve L
i
20406080
60
80
100
w (%
)
0020
0 20 40 60 80 100Optimizing
0
20
40
60
Ste
am F
low
Increase turbines inlet temperature set point
p g
0
6080100
oss
of G
V
)
Good operating point 6080100
02040
Pres
sure
Lo
(%
02040
0 20 40 60 80 100
15© 2013 MITSUBISHI HEAVY INDUSTRIES, LTD. All Rights Reserved.
0 20 40 60 80 100Turbine GV Demand(%)
P 0 20 40 60 80 100Turbine GV Demand(%)

◆Boiler Demand & OptimizingTurbine inlet Turbine 1st stage
Target Valve Lift (GV)
Target Valve Lift (GV)
P1P1PTPT
steam pressureg
steam pressure
△△÷÷ KK
PIPIKK
> <> <
PI controllerwith limit (High, Low)
△△
Target pressure> <> <
PIDPIDΣΣOptimizing
SignalOptimizing
SignalBoiler master
controller
※Ex. Turbine Optimizing(2/3)ΣΣ
16© 2013 MITSUBISHI HEAVY INDUSTRIES, LTD. All Rights Reserved.
Boiler DemandFigure 11. Block diagram of boiler demand.

◆Boiler Master Controller & Optimizing
OptimizingOptimizingSteam header
Set point bySet point by
PPOptimizing
SignalOptimizing
SignalSteam header pressure
△△
Set point by manual
Set point by manual
ΣΣ
Steam Header
PP1B 5B
△△
PIPI1T 5T
FF FF
1B fuel flow 5B fuel flow
PIPI
※
ΣΣ △△ ΣΣ △△
※Steam header pressure can be stable because each fuel controller of boiler receives from one Boiler master controller.
PIPI PIPIOptimizingSignal
OptimizingSignal
OptimizingSignal
OptimizingSignal
17© 2013 MITSUBISHI HEAVY INDUSTRIES, LTD. All Rights Reserved.
1B Fuel 5B Fuel Figure 12. Block diagram of boiler master.

◆Boiler Feed Pump Inverter control & Optimizing
OptimizingOptimizing
BFP outlet feed water pressure
SPBPPBP
OptimizingSignal
OptimizingSignalSuper
HeaterTo Steam Header
Set point by manual
Set point by manual
ΣΣSteam Drum
△△
Speed demand to
PIPI
Feed water control valve(FWC)
※Differential pressure between FWC inlet and outlet shall be controlled by BFP speed .
FWC l b il d l l b i 1 l 3 l
pInverter
18© 2013 MITSUBISHI HEAVY INDUSTRIES, LTD. All Rights Reserved.
FWC controls boiler drum level by using 1 element or 3elements signal . Figure 13. Block diagram of BFP inverter
control.

◆Conclusions
The Plant shall be optimized to minimization of total energy using JOS.The manager can predict total cost using offline mode.The operator can get the most economical and safety operation
using online mode.
Investigation of the following characteristics,(1)Turbine mass/heat balance(2)Characteristics of Turbine GV (3)Boiler mass/heat balance(4)Fuel consumptions and cost(4)BFP Q−H characteristics
19© 2013 MITSUBISHI HEAVY INDUSTRIES, LTD. All Rights Reserved.
(5)FW CV, flow, diff. Press., position, etc.

Thank you for your attention.
20© 2013 MITSUBISHI HEAVY INDUSTRIES, LTD. All Rights Reserved.