Embed Size (px)
Citation preview

1
Introduction
Regional disparity is a ubiquitous phenomenon in both
developed and developing economies. But in the lat ter i t is more acute
and glaring. When economic development occurs unequally across a
country, regional differences in the levels of l iving become an important
poli t ical issue. State economies are often composed of sets of smaller
and localized economies. If the national economy is to prosper then i ts
consti tuent regional economies must be brought into some sort of
harmony. Any attempt to implement regional balanced -growth strategy,
i t is necessary to identify nature and pattern of regional development ,
the availabil i ty of basic amenities and the quali ty of infrastructure
available . In Uttar Pradesh too, area disparit ies in the level of poverty,
unemployment, income, infrastructure , agriculture, industry and above
all the level of l iving of people exist substantially across the regions.
Numerous measures have been undertaken in the last sixty years of
planning to achieve balanced regional development of the State, yet wide
disparit ies in area development continues in this state.
In the regional analysis of development one comes
across regions which are well developed and the peopl e in such region
enjoy reasonable standard of living while in others, resource utilization
and development is low owing to historical circumstances or other wise,
resulting in the underdeveloped of the region whereby people have a poor

2
standard of living. The problem of imbalance in regional development
thus assumes a great significance. Regional development, therefore, is
interpreted as intra-regional development design to solve the problems of
regions lagging behind. The first connotation of regional is e conomic in
which the differences in growth, in volume and structure of production,
income, and employment are taken as the measure of economic progress.
However, recently it has been argued that merely economic cri teria cannot
explain the level of development, which is multidimensional concept.
Therefore, such variables or criteria should also be employed which
indicate progress on technological , social and cultural fronts. Thus
development means progress throughout the society. However, at the base
of development process lies the progress in different sectors of the
economy.
Developing agriculture and reducing gaps between regions with
regard to the efficiency of the agricultural system can only achieve
regional development in an overwhelming agricultural si tuation. Progress
in agriculture releases resources, labour as well as capital for use in
industry and services. Progress in agriculture also leads to the
modernization and social development and better level of living through
education and generating propensity other than agricultural goods.
OVERVIEW OF LITERATURE
The earliest study in the level of development was made by
Schwartzberg (1962). The use of a composite index of development brought
out areal differences in the levels of development, althoug h these differences
3
could not be further put rigorous regional analysis as the data were on the
basis of states (prior to 1956) which are not ideally suited to reveal regional
differences.
Pal (1965) put a more systematic attempt in the construction of a
composite index of selected variables, which permits several stages of
analysis in relation to the group of variables contributing to overall
development; with a study of All India level it may be regarded essentially as
a contribution to methodology in areal differentiation by factor analysis.
Mitra
(1965) has grouped 324 districts of India into four levels of
development. For this study he has selected 63 variables and these variables
were grouped into six convenient blocks. The variables pertain to natural
factors, agricultural infrastructure, traditional economy, human resources,
organized industry etc. This study is unique for its simplicity and systematic
approach.
Nath (1970) on the basis of state and district level data worked
out the regional patterns of economic development and economic growth
within India. Analysis of the level of economic development has been made
only for the states. The level of economic development of states has been
measured in two ways: (i) on the basis of per cap ita income, and (ii) through
the use of a composite index of economic development based on four
indicators. Analysis of economic growth has been made with the help of data
on growth rates of population, agricultural output, and per capita value added
in the industry, and per capita income. He mapped the states of India into
two categories of relatively developed and less developed.
Prakash (1977) assessed the regional inequalities and economic
development in relation to infrastructural facili ties in Indi a. He selected
several infrastructural factors: the various population characterist ics that
reflect the development of infrastructure determinants of industrialization, the
development of power, irrigation and agricultural implements and road
transportation, communication and banking services. He obtained two
important conclusions from the analysis of development of individual regions

4
in various fields: (i) there is no region, which is equally developed or
underdeveloped in all fields. (ii) the other impo rtant result is that the some
region/regions come under the category of underdeveloped region if some
other indicator relating to the same field is used for classification. It implies
that an appropriate indicator should be chosen to determine the stage o f
development of the regions.
Hemlata Rao (1984) while studying the regional disparit ies, dimensions
and typology of backwardness in Karnataka applied the technique of factor
analysis in delineating the regions. The study covers 175 talukas (villages) of
Karnataka and examines inter taluka diversities in the land uti lization pattern,
cropping pattern, agricultural development, pattern of industrial spread, and
industrial developments, level of development of education, health, transport,
communication, power, banking and cooperative sectors and overall
development level during period between 1975 -76 and 1979-80. The study
concludes that in Karnataka there is not only wide diversity in natural
endowments but also wide disparities in the levels of secto ral and aggregate
development. All backward regions are not the same rather they have
different dimensions and typology of backwardness. The causes of
backwardness also vary from region to region.
Levels of socioeconomic development and regional development
may show many dimensions of progress and backwardness. Therefore, the
present study may found similarities and differences among different areas of
Uttar Pradesh in respect of socioeconomic development.
The most accepted and yet the most complex task of regional planning
is to prepare a comprehensive regional development plan. The present study
will help to prepare an integrated plan between the economic and social
components in a given region and interregional, that is between different
levels of regions. Regional planning is strongly advocated where there are
conflicts arising out of administrative jurisdiction, resource patterns and
sharp contrasts in the levels of development between regions of an Uttar
Pradesh, which is in the process of development.

5
Hence, the researchers of the present investigation have made a
humble attempt to find out the causes and consequences of regional
disparity in socio-economic development of Uttar Pradesh.
OBJECTIVES OF THE STUDY
The present study attempts to assess the existing level of socio-
economic development in Uttar Pradesh, leading to the identification of
regions having unequal share of socio -economic development.
The specific objectives are as follows:
1. To analyze the existing levels of socio-economic development in the
region.
2. To examine spatial distribution of socio-economic development in relation
to their correlates.
3. Determination of levels of development at district levels on the basis of
socio-economic development of the region.
4. To suggest a suitable strategy for accelerating the overall development of
the region.
HYPOTHESIS
Corresponding to the objectives of the present research, the
following null hypotheses have been framed for empirical verification and it
has been verified:
H.01: There would be no significant regional disparity in socio -economic
development of Uttar Pradesh (District wise and Region wise)
H.02: There would be no significant relationship between socio-economic development and
regional disparity in Uttar Pradesh.
METHODOLOGY:
Data Collection:
The study pertains to 70 distri cts of Uttar Pradesh. The secondary
data is collected from the published and unpublished records, viz. census
6
reports, and revenue records, district statistical year books, the data kept at
the state, district, tehsil and block headquarters. The data, which are not
available through secondary sources, is collected through field surveys.
The data is collected from National Information Centre (NIC) and
Statist ical Division, Department of Planni ng, Niyojan Bhavan, Lucknow,
Uttar Pradesh. As the district is a unit of analysis in this study, the data will
also procure at the district level from district Statistical Division.
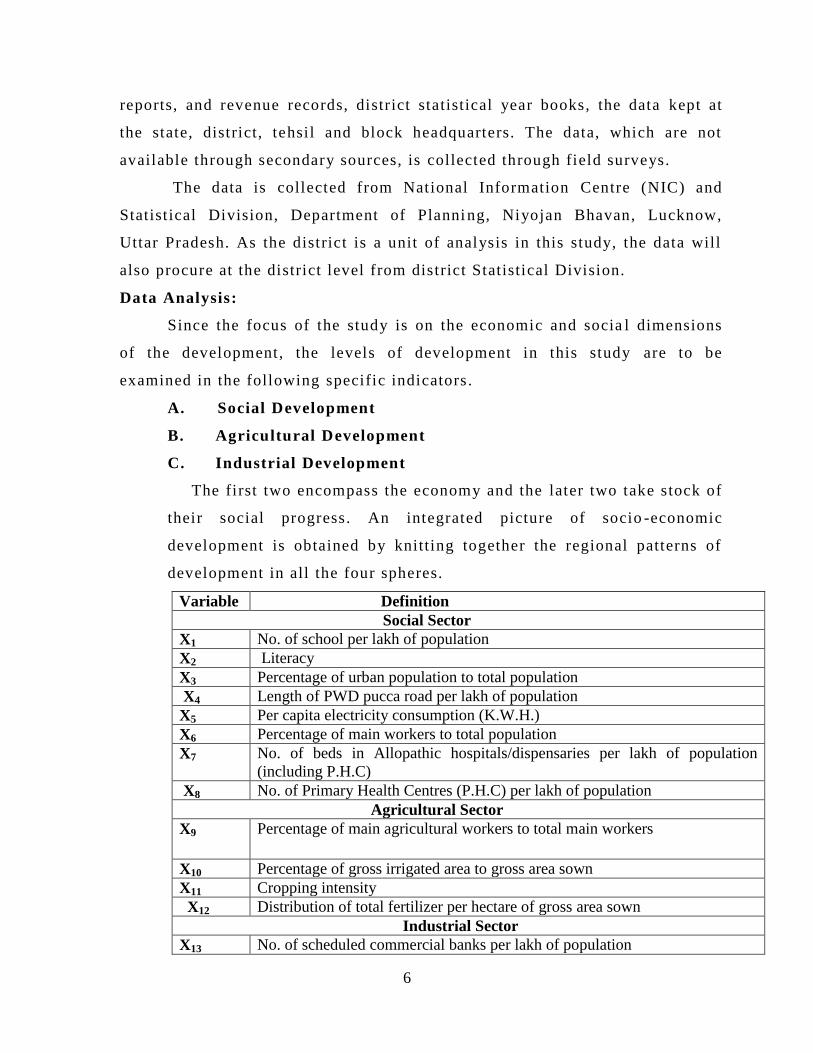
Data Analysis:
Since the focus of the study is on the economic and socia l dimensions
of the development, the levels of development in this study are to be
examined in the following specific indicators .
A. Social Development
B. Agricultural Development
C. Industrial Development
The first two encompass the economy and the later two take stock of
their social progress. An integrated picture of socio -economic
development is obtained by knitting together the regional patterns of
development in all the four spheres.
Variable Definition
Social Sector
X1 No. of school per lakh of population
X2 Literacy
X3 Percentage of urban population to total population
X4 Length of PWD pucca road per lakh of population
X5 Per capita electricity consumption (K.W.H.)
X6 Percentage of main workers to total population
X7 No. of beds in Allopathic hospitals/dispensaries per lakh of population
(including P.H.C)
X8 No. of Primary Health Centres (P.H.C) per lakh of population
Agricultural Sector
X9 Percentage of main agricultural workers to total main workers
X10 Percentage of gross irrigated area to gross area sown
X11 Cropping intensity
X12 Distribution of total fertilizer per hectare of gross area sown
Industrial Sector
X13 No. of scheduled commercial banks per lakh of population

7
X14 No. of small scale industries per lakh of population
X15 No. of employees in registered factories per lakh of population
X16 No. of working factories per lakh of population
The data for the study is analyzed and tabulated with the help of
statistical Z-score technique of each items of the district. The technique
reads as fallows:
Z-score = X-X/
Where X - individual value
X - Mean value of the given indicator
- Standard deviation
Z-score value of each variable will be aggregated to find out the
composite score for the assessment of the level of socio economic
development at district level.

8
Chapter 1
Geographical Profile of the Study Area
Physical Background
Uttar Pradesh; the most populous state of the country, has a geographical area of 240928 km2
which constitute7.3 % of the total area of the country. Uttar Pradesh is situated between 23˚52΄N -
30˚24΄N latitude and 77˚05΄E -84˚38΄E longitude. It is bounded by Uttaranchal and Nepal on the
north, by Madhya Pradesh and Chhattisgarh on the south, Rajasthan, Haryana and Delhi on the west,
and Bihar and Jharkhand on the east. Despite its bifurcation in November 2000 into Uttaranchal and
Uttar Pradesh, it is still one of the largest and most densely populated states in India. It has been
divided into 70 administrative districts.
Uttar Pradesh comprises three physiographic regions namely, the submontane region lying
between the Himalayas and the plains, the vast alluvial Gangetic plains and the southern hills and
plateau. All the rivers except the Gomati and the Chambal emerge from the Himalayas. The State is
fed by five major rivers, the Ganga, the Yamuna, the Ramganga, the Gomati and the Ghaghra which
drain into the Bay of Bengal. More than one-fourth of Uttar Pradesh lies within the Gangetic plains
consisting of alluvial deposits brought down from the Himalayas by the Ganga, Yamuna and their
tributaries. The southern hills form part of the Vindhya range whose elevation rarely exceeds 300 m.
Uttar Pradesh is one of the poorest states in India. It has low income and low productivity levels, low
degree of urbanization, widespread illiteracy, high birth and death rates, and low levels of investment.
It is one of the most populous State, supporting 16.2% of India’s population. The total population is
166.05 million (2001 census) of which 79.2% is rural and 20.8% urban. The population density is
689 persons per sq. km.

9
Uttar Pradesh is the largest producer of foodgrains and oilseeds in the country. The State leads
in the production of wheat, maize, barley, grain, sugercane and potatoes. It has world famous cities
and sites such as Agra (Taj Mahal, Sikandara, Agra Fort, Fatehpur Sikri), Varanasi and Mathura
(Hindu pilgrimage centers), and Allahabad (where the Ganga and Yamuna rivers meet). The Dudwa
National Park is a famous IBA site in the State.
The State has a diverse range of habitats for birds and other biodiversity which include forest
areas in the sub-Himalayan terai and also the Dry Deciduous Forests of the Bundelkhand regions
bordering Madhya Pradesh and Chhatisgarh. According to the Forest Survey of India report of 2001,
the recorded forest area in the State is 16,826,000 ha, about 2.2% of Indias forest and 7% of the
States geographical area. The State has a tropical climate with a wide temperature fluctuation from
2°C to 48°C. There are three main seasons: summer from March to mid-June; the rainy season from
mid-June to September; and, winter from October to February. There is a great variation in rainfall.
The bhabhar area has an average rainfall from 1300 to 1900 mm, whereas in the terai it varies from
1200 to 2500 mm. In the Gangetic plains the rainfall varies from 600 to 1200 mm.
Drainage
The state is well drained by a number of rivers originating in either the Himalayas to the north or
the Vindhya Range to the south. The Ganges and its main tributaries-the Yamuna, the
Ramganga, the Gomati, the Ghaghara, and the Gandak- are fed by the perpetual snows of the
Himalayas. The Chambal, the Betwa, and the Ken, originating from the Vindhya Range, drain
the southwestern part of the state before joining the Yamuna. The Son, also originating in the
Vindhya Range, drains the southeastern part of the state and joins the Ganges beyond the state
borders (in Bihar).
In India agriculture without irrigation is a gamble. In many areas cultivation is not

10
possible without irrigation and in other areas supplemented irrigation makes it possible to
maintain production at reasonable level and helps to avoid crop failure. So the drainage
system of any region has played an important role in the process of agricultural development.
Rivers are beneficial in two ways. Firstly, they provide water for irrigation purpose and
secondly, rivers bring yearly enormous loads of alluvial deposits from the mountains and
deposit it on their beds and sides. These deposits help in the formation of rich and fertile soils.
Rivers help in the process of renewing the fertility of the land with their yearly fresh deposits.
The drainage in Uttar Pradesh with the exception of low lying parts is well developed.
The courses of rivers and streams follow the general gradient of the plain, i.e. from north to
south and south-east. The Ganga and the Yamuna are the two principal rivers of this region,,
the remaining streams are minor and seasonal in nature. The discharge of the seasonal streams
varies from nothing in the hot season to hundred of cubic metre per second during the rainy
season.
The Ganga, having its source in the snowy caps of the Himalayas, enters the Upper
Ganga-Yamuna doab at Haridwar. The bed of the Ganga in the south of the Haridwar town is
composed of boulders and calcareous rocks. The loss of percolation is very marked in this
portion of its course. The boulders disappear and are gradually replaced by sand and flowing
southwards, the river starts meandering. In the plain, the banks of the river are slightly defined
on one side and abrupt on the other, according to the position of the mainstream. The volume
of water in the river increases by the middle of March due to the melting of snow and in the
months of July and August due to monsoons. The width of the current normally varies from
half kilometer in the dry season to five kilometers in the rainy season. In parts where the bank
of the river consists of sandy undulation, the width of the stream increases up to seven

11
kilometers. The Ganga in the southern part makes meanders, loops and ox-bow lakes owing to
the uniform gradient of the plain. From time to time the Ganga has changed its course.
The Yamuna is one of the most important tributaries of the Ganga. Its source lies very
close to that of the Ganga. It enters the plain at ‘khara’ in the extreme north-west corner of the
Saharanpur district. The deep channel of river separates the plain of Upper Ganga-Yamuna
doab from Delhi and Haryana. In the plain Yamuna flows into several channels and its course
becomes broad. In the middle part of the district of Muzaffarnagar, it makes loops and sharp
bends. Passing along the western border of Meerut, Ghaziabad and Bulandshahar districts it
enters in the district of Aligarh.
The Yamuna receives a number of torrents and minor stream. The important
tributaries are Badshahi bagh rao, Raipur rao, Punjna rao, Markera rao, Saindhi nadi, Bhuria
nadi, Katha nala and Hindon. The Hindon rises in the form of torrent from Siwaliks. It is
joined by many torrents like Nagadeo Dhamola and Dhanda, etc. and its course becomes well
defined. Later it is joined by Kali nadi and Kirsani. The east Kali nadi is the main stream of
the eastern part of the study region. It emerges from the low-lying depressions in the south-
eastern part of the Muzaffarnagar district and flows in an ill defined channel until it enters
Meerut district. Further south in Bulandshahr districtit is joined by Abu nala. Another stream,
the Nim nadi flows in between the Ganga and the east Kali nadi in Bulandshahar district.
Lakes are not important features in the study region. However, some lakes originate
due to the meandering action of rivers. These lakes are small in size and remain connected
with these rivers by small channels. Lakes of bhangar consist of those depressions which are
not connected with the rivers and in which water collects during the rains and often floods the
surrounding areas.
12
Climate
The general climate of the study region is hot with ample of sunshine. The maximum
summer temperature varies between 40˚C to 42˚C during the summer months of May and
June, while the minimum temperature during the winter ranges between 3˚C to 4˚C. The
region receives rainfall between 70 to 140 centimeters and 90 per cent of the total rainfalls
during the rainy season.
Climatologically, the year of this region could be divided into three seasons: the cold
weather season from October to the end of February the hot weather season from the
beginning of March to mid June and the rainy season from mid June to the end of September.
The cold weather season is characterized by cold and dry air clear skies; fall in
temperature, high pressure, mist and fog. December and January are the coldest months, when
the maximum and minimum temperatures are 21˚C and 6˚C respectively. The cold waves
coming from the Himalayas also bring a fall in the temperature for short period. In February
the temperature rises slightly. In these months heavy mist and fog locally known as kohra
which often occurs at right and lasts until the sun rises. Occasionally the fog becomes so
intensive and prolonged- that it damages the rabi crop (winter crop). During the months of
December, January and February a few depressions accompanied by moderate rainfall pass
through this area. The rainfall decreases from north to south and the total amount of rainfall
during the cold weather season nowhere exceeds ten centimeters. This rainfall, though small
in quantity is highly helpful to the winter crops as it comes at a time when plants are
flowering, the effectiveness of the rainfall is further increased by the prevailing low
temperatures. Occasionally at the flowering and temperatures, rabi crops, the occurrence of
hailstorms causes damage to them.
13
The hot weather season is characterized by rising temperature and falling pressure. At
the advent of March, temperature rises abruptly and continues rising till the month of May
and June. The maximum and minimum temperatures for April are 38˚C and 21˚C
respectively. The month of May and June record exceptionally high temperature, as high as
44˚C and even more 46˚C for a few days. The days are characterized by intensive heat, dry air
and low relative humidity. Regular phenomena of this season is the flowering of hot and dry
winds locally called as loo and the occurrence of dust and thunderstorm which are locally
known as andhi. They usually occur in the afternoon and are accompanied by squally winds,
thunder, blinding dust and sometimes rains. The amount of rainfall during this period is very
low and is not very important for agriculture.
The monsoon normally commences in the third week of June. The advent of the
monsoon brings a complete change in the weather. There is fall in the day temperature. The
maximum and the minimum temperature gradually fall from 44˚C and 27˚C respectively in
June to about 30˚C and 25˚C in July. The relative humidity remains over aa70 Percent
throughout the rainy season. There are burst of rain alternating with rainless intervals which
lasts for three to five days. The months of July and August are the rainiest months and receive
more than 50 per cent of the total rainfall. The relative humidity increases and is about 85 per
cent in August. In September the rains normally slacken and rainless intervals become longer.
The relative humidity remains high. The rainfall decreases from north to south in the region.
Soils
The soils of the study region are so much uniform and similar in their character that it
is difficult to make distinctions. Nevertheless several varieties of soils are generally

14
recognized by the people, though not any hard and fast line of demarcation can be drawn
between one soil to another.
The soils are alluvial and on geological basis classified into two categories: the new
alluvium and the old alluvium also known as khaddar and bhangar respectively. The khadar
lands are found in the valleys of the Ganga Yamuna, Hindon and their tributaries. The
bhangar soil which covers the major part of the region varies from gray brown to dark in
colour and sandy-loam to stiff clay depending upon the topography and drainage. The
occurrence of nodules locally known as kankar which are found at various depths is
significant characteristic feature of these soils.
1. Khadar Soils or Sandy Soils: The study region nearly thirty per cent of soil consists of the
new alluvial deposits of the rivers, locally known as raitily. Away from the banks in the
valleys of the rivers it is sandy silt and becomes silty clay in the depressions. The relatively
elevated sandy parts are devoted to maize, millets and sugarcane, while silty clay is devoted to
coarse varieties of rice, wheat, barley, lentil and peas mixed with gram. Agriculture in this
area is precarious due to water loggings.
2. Bhangar Soils: On the basis of texture the bhangar soils are further subdivided into:
(i) Dark loam: The land between the torrents of the submontane tract consists of the
dark loamy soil. The thin layer of the soil resting on a substratum of stones and
boulders are mostly covered by grass and shrubs. There are, however numerous
torrents in this area which quickly drain off the rain water and lead to soil erosion. In
many parts the under-neath structure has been exposed by the erosion are, however,
very productive, Maize, millets, rice, cotton and sugarcane and barley in the rabi
season are generally grown.

15
(ii) In the Ganga-Kali interfluves, the dominant soil is sandy-loam. The surface soil is
yellow to brown in colour with a sub-soil which is brownish yellow. The sub-soil is
locally known as sankrail. Owing to the coarse ans light texture of the soil, its water
retention capacity is low, but the irrigation facilities by the Upper Ganga Canal and
tube wells have made it capable of producing good crops of sugarcane in the kharif
and wheat in the rabi season.
(iii) Clayey-loam: The well drained Hindon-Yamuna interfluves are covered by
clayey-loam soil. Its water retention capacity is quite high. The surface soil is brown
in colour, while dark grey in the lower horizon. Salt contents in this soil are low. This
soil is agriculturally very fertile. In fact highest crop yields in the region are found in
this type of soil. The clayey loam tract is extensively irrigated by the eastern Yamuna
canal, Upper Ganga Canal and by tube wells. Sugarcane, rice, maize and fodder in
kharif season and wheat, gram, peas and barley are mainly cultivated in the rabi-
season.
(iv) Clayey soil: The Yamuna-Hindon interfluves are covered by soils varying from
sandy-clay to clay. The surface soil is grey to dark grey in colour, with a sub-soil
which is dark brown. These soils are hard and very difficult to plough, especially
when dry. At that stage they acquire a bad cloddy structure. When wet, it gets puddle
up and becomes sticky. It is often characterized by salt efflorescence, which redress
then useless for agricultural purposes. In the years of exceptionally heavy rainfall, soil
show stunted growth. The relatively elevated parts are devoted to maize, millets while
in the low lying parts rice is the main crop in kharif while wheat, gram and peas in
rabi season.
16
Cultural Background
Uttar Pradesh is the most populous state in India. In the early 21st century it had an
overall population density of more than twice the national average. The Gangetic Plain supports
the overwhelming majority of the state’s population.
Population composition
Roughly one-fifth of the state’s people belong to groups known as Scheduled
Castes (formerly called “untouchables”; groups that officially occupy a low position within
the caste system). A tiny percentage of the people belong to Scheduled Tribes (a term generally
applied to indigenous peoples who fall outside the predominant Indian social hierarchy). The
vast majority of the people, including members of all levels of the caste hierarchy, are Hindus.
Muslims are the largest religious minority. There also are relatively small groups of Sikhs,
Christians, Jains, and Buddhists. Hindi is an official language of the state and the mother tongue
of most of the people. Urdu, additionally an official language, is primarily spoken by Muslims.
The vernacular Hindustani is widely understood.
Most urban inhabitants live in cities with populations of more than 100,000. Among the
largest cities of Uttar Pradesh are Kanpur, Lucknow, Agra, Varanasi, Meerut,
and Allahabad. Kanpur, located in the central portion of the state, is the premier industrial city of
Uttar Pradesh. Lucknow, the state capital, is about 30 miles (48 km) northeast of Kanpur. Agra,
in the western part of the state, is the site of the Taj Mahal, a mausoleum built by the Mughal
emperor Shah Jahān (ruled 1628–58) in memory of his wife; it is the most famous tourist
attraction in India. Varanasi, the city most sacred to Hindus, is one of the world’s oldest
continuously inhabited cities. Meerut, northeast of Delhi, is an important centre of

17
transportation, trade and industry. Allahabad (on the site of the ancient holy city of Prayag),
located at the confluence of the Ganges and the Yamuna River, is another city sacred to Hindus.
Demographic Trends
The population of Uttar Pradesh continues to grow at a high rate. Because of this high
growth rate and a substantial reduction in infant mortality in the 20th century, there has been a
significant increase in the proportion of young adults and children. The sex ratio also has
improved; in 2001 there were 898 females per 1,000 males, up from 876 per 1,000 in 1991.
Toward the end of the 19th century, dire poverty and the promise of better opportunities forced
many people of the region to migrate to distant lands, such as South Africa, Mauritius, Fiji, and
the West Indies. In more recent years, migration from Uttar Pradesh has been mainly to other
parts of India, particularly to large cities such as Kolkata (Calcutta), Mumbai (Bombay),
and Delhi.
Economy
Agriculture:
Agriculture is the mainstay of the state’s economy. The chief crops are rice, wheat, and
sugarcane. Since the late 1960s, with the introduction of high-yielding varieties of seed for wheat
and rice, greater availability of fertilizers, and increased use of irrigation, the state has become a
major producer of food grains in the country. Many of its farmers, however, still suffer from two
major constraints: small landholdings and insufficient resources to invest in the technology
required for improved production. Livestock and dairy farming often provide a supplementary
source of income.
18
Resources and power:
Silica, limestone, and coal are found in considerable quantities in Uttar Pradesh. There
also are small reserves of gypsum, magnesite, phosphorite, and bauxite. The national government
has supported the development of coal fields in the southeastern area around Mirzapur.
The state often suffers from shortages of power. Installed capacity has greatly increased
since Indian independence, but the gap between supply and demand remains wide. Power is
generated at the Obra-Rihand complex (in southeastern Uttar Pradesh), one of India’s biggest
thermal stations; at a number of hydroelectric power plants in various parts of the state; and at a
nuclear power station in the western district of Bulandshahr (near Delhi).
Manufacturing
Textiles and sugar refining, both long-standing industries in Uttar Pradesh, employ an
important percentage of the state’s total factory labour. Other resource-based industries in Uttar
Pradesh produce vegetable oil, jute, and cement. The Indian government established a number of
large factories that manufacture heavy equipment, machinery, steel, aircraft, telephone and
electronics equipment, and fertilizers. The national government has funded an oil refinery
at Mathura. The state government has promoted medium- and small-scale industries.
The state’s exports include such products as footwear, leather goods, and sporting gear.
Handicrafts constitute a significant portion of exports as well. Carpets from Bhadohi
and Mirzapur, for example, are prized worldwide. Among other local specialities are the silks
and brocades of Varanasi, ornamental brass ware from Moradabad, chikan embroidery
from Lucknow, ebony work from Nagina, glassware from Firozabad, and carved woodwork
from Saharanpur.

19
Tourism:
Tourism in the state is of growing economic importance. Many visitors flock to Hindu
centres such as Varanasi, Allahabad, Ayodhya, and the Mathura-Vrindavan area; Buddhist
centres such as Sarnath, Kasia (site of Kushinagara, where the Buddha died), and Shravasti; and
other historic places such as Agra, Lucknow, and Kannauj.
Transportation:
The state’s cities and towns are connected by a vast network of roads, including a number
of national highways, and railways. Major cities in Uttar Pradesh are connected by air
to Delhi and other large cities of India. The three inland waterways of the Ganges, Yamuna, and
Ghaghara rivers also are an integral part of the state’s transportation system
**************
20
Chapter 2
Social Development
Social development has been defined as a macro strategy of planned intervention to
improve the capacity of existing social systems to cope with the demand of change and growth.
Social development is at best a short form of social aspects of dimensions of development entity.
Social development has also been used as synonymous to institutional development which refers
to the process of institutional change to bring about a better condition between human needs,
social policies and programmes.
Social development of an area is best reflected in the quality of life of its people. The
quality is dependent, among other things, on the infrastructural facilities. These facilities include
educational institutions, health centers, transport and communications, banking services,
electrification and housing. The dual nature of infrastructure may also be noted. It is not merely
a component of development but also a factor of development. The infrastructural facilities, on
the one hand, indicate the level of social development in an area and, on the other hand, these
points to the likely trends in its future progress.
In the present study, eight indicators have been examined pertaining to education,
health and urban population to find out the levels of social development of the study area. The
selection of indicators is based on the availability of data, importance, accuracy and suitability of
the indicators in the study region.
Variable Definition
X1 No. of school per lakh of population
X2 Literacy
X3 Percentage of urban population to total population
X4 Length of PWD pucca road per lakh of population
21
X5 Per capita electricity consumption (K.W.H.)
X6 Percentage of main workers to total population
X7 No. of beds in Allopathic hospitals/dispensaries per lakh of population
(including P.H.C)
X8 No. of Primary Health Centres (P.H.C) per lakh of population
No. of school per lakh of population (JBS+SBS+HSS)
There are 71 schools (Junior Basic School + Senior Basic School+ Higher Secondary
School) per lakh of population in Uttar Pradesh. Etawah (148) has the highest number of
school per and Ambedkarnagar (39) schools per lakh of population. At district level there is
wide variation in the distribution of schools per lakh of population in the study region. The
distribution of primary schools per lakh of population has been shown in table 2.1 and
Fig.2.1
Very High Concentration: (1.35-2.56)
There are five districts in this category which account for 7.1 percent of the total districts.
Out of these five districts four districts Auraiya, Etawah, Mainpuri and Hathras namely lies in
Western Uttar Pradesh and one district namely Kanpur Dehat lie in Central Uttar Pradesh.
High Concentration:- (0.43-1.35)
There are twenty districts in this category which account for 28.57 percent of the total
districts. Out of these twenty districts eleven districts namely Moradabad, Rampur, J.P.Nagar,
Aligarh, Mathura, Agra, Etah, Pilibhit, Shahjahanpur, Farrukhabad and Kannauj are in western Uttar
Pradesh; four districts namely Hardoi, Fatehpur, Unnao and Barabanki are in Central Uttar Pradesh;
four districts namely Jalaun, Chitrakoot, Mahoba and Lalitpur are in Bundelkhand region and only
one district namely Kaushambi lie in Eastern Uttar Pradesh.

22
Medium Concentration:- (48.27-65.37)
There are seventeen districts in this category which account for 24.29 percent of the total
districts. Out of these seventeen, six districts namely Bulandshahr, Muzaffarnagar, Firozabad,
Bareilly, Bijnor and Budaun lies in Western Uttar Pradesh; three districts namely Sitapur, Kheri
and Raebareli lies in Central Uttar Pradesh; three districts namely Banda, Jhansi and Hamirpur
lies in Bundelkhand region and five districts namely Sonbhadra, Pratapgarh, Faizabad Sharawasti
and Balrampur lies in Eastern Uttar Pradesh.
Table 2.1
No. of school per lakh of population 2001 (JBS+SBS+HSS)
Category Index Name of the District No. of
Districts
Very High 1.35-2.56 Hathras, Mainpuri, Etawah, Auraiya, Kanpur Dehat 05
High 0.43-1.35 Moradabad, Rampur, J.P.Nagar, Aligarh, Mathura,
Agra, Fatehpur, Etah, Pilibhit, Shahjahanpur,
Farrukhabad, Kannauj, Hardoi, Unnao, Barabanki,
Jalaun, Chitrakoot, Kaushambi, Mahoba, Lalitpur
20
Medium -0.32-0.44 Bulandshahr, Sonbhadra, Banda, Pratapgarh,
Faizabad, Muzaffarnagar, Firozabad, Sharawasti,
Balrampur, Jhansi, Hamirpur, Raebareli, Sitapur,
Kheri, Barielly, Budaun, Bijnor
17
Low -1.07- -0.32 G.B.Nagar, Varanasi, Jaunpur, Ghazipur, Chandauli,
Sant Kabirnagar, Saharanpur, Meerut, Baghpat,
Ballia, Mau, Deoria, Gorakhpur, Sidharthnagar, Basti,
Sultanpur, Kanpur Nagar, Lucknow,
18

23
Low Concentration: - (-1.07- -0.32)
There are eighteen districts in this category which account for 25.71 percent of the total
districts. Out of these eighteen districts four districts namely G.B.Nagar, Saharanpur, Meerut and
Baghpat lies in Western Uttar Pradesh; Kanpur Nagar and Lucknow in Central Uttar Pradesh;
and twelve districts namely Varanasi, Jaunpur, Ghazipur, Chandauli, Sant Kabirnagar, Ballia, Mau,
Deoria, Gorakhpur, Sidharthnagar, Basti and Sultanpur are lies in Eastern Uttar Pradesh.
Very Low Concentration:- (-1.98- -1.07)
There are ten districts in this category which account for 14.29 percent of the total
districts. Out of these ten districts Ghaziabad is the only district lie in Western Uttar Pradesh and
rest nine districts namely Mirzapur, Sant Ravidasnagar, Azamgarh, Kushinagar, Maharajganj,
Gonda, Bahraich, Ambedkarnagar and Allahabad lies in Eastern Uttar Pradesh.
Literacy
Literacy rate of Uttar Praesh is 56.27 % whereas at the district level Kanpur Nagar
(74.37%) has the highest literacy and Sharawasti has the lowest (33.82%) literacy rate. But
at district level there is wide variation in the literacy rate in the study region. The
distribution of literacy rate in the study area has been shown in table 2.2 and Fig.2.2
Very High Concentration: - (0.74-2.08)
There are fifteen districts in this category which account for 21.43 percent of the total
districts. Out of these fifteen districts seven districts namely Meerut, Baghpat, Ghaziabad,
G.B.Nagar, Firozabad, Mainpuri, Etawah and Auraiya lies in Western Uttar Pradesh; three
Very Low -1.98- -1.07 Ghaziabad, Mirzapur, Sant Ravidasnagar, Azamgarh,
Kushinagar, Maharajganj, Gonda, Bahraich,
Ambedkarnagar, Allahabad
10

24
districts namely Lucknow, Kanpur Dehat, Kanpur Nagar lies in Central Uttar Pradesh; three
districts namely Jhansi, Chitrakoot, and Jalaun lies in Bundelkhand region and Varanasi district
lies in Eastern Uttar Pradesh.
High Concentration: - (0.29-0.74)
There are thirteen districts in this category which account for 30.61 percent of the total
districts. Out of these thirteen district eight districts Hathras, Saharanpur, Muzaffarnagar,
Bulandshahr, Mathura, Agra, Farrukhabad, Kannauj namely lies in Western Uttar Pradesh and five
districts namely Allahabadm Mau, Jaunpur, Ghazipur, and Chandauli lies in Eastern Uttar
Pradesh.
Table 2.2
Literacy
Category Index Name of the District No. of
Districts
Very High 0.74-2.08 Meerut, Baghpat, Ghaziabad, G.B.Nagar, Jhansi, Firozabad,
Mainpuri, Etawah, Auraiya, Chitrakoot, Varanasi, Lucknow,
Kanpur Dehat, Kanpur Nagar, Jalaun
15
High 0.29-0.74 Hathras, Saharanpur, Muzaffarnagar, Bulandshahr, Mathura,
Agra, Farrukhabad, Kannauj, Allahabad, Mau, Jaunpur,
Ghazipur, Chandauli,
13
Medium -0.40-0.29 Bijnor, Aligarh, Etah, Unnao, Raebareli, Fatehpur, Mirzapur,
Ambedkarnagr, Sultanpur, Hamirpur, Mahoba, Banda,
Pratapgarh, Faizabad, Gorakhpur, Azamgarh, Ballia, Deoria,
Sant Ravidasnagar,
19
Low -1.53- -
0.40
Maharajganj, Basti, Moradabad, J.P.Nagar, Sitapur,
Kushinagar, Barabanki, Lalitpur, Sonbhadra, Chitrakoot,
Barielly, Pilibhit, Shahjahanpur, Kheri, Hardoi, Sant
Kabirnagar,
16
Very Low -2.53- -
1.53
Rampur, Budaun, Bahraich, Sharawasti, Balrampur, Gonda,
Sidharthnagar
07

25
Medium Concentration: - (-0.40-0.29)
There are nineteen districts in this category which account for 27.14 percent of the
total districts. Out of these nineteen districts, three districts namely Bijnor, Aligarh and Etah lies
in Western Uttar Pradesh; three districts namely Unnao, Raebareli and Fatehpur lies in Centrral
Uttar Pradesh; three districts namely Hamirpur, Mahoba and Banda lies in Bundelkhand region
whrereas whereas ten districts namely Mirzapur, Ambedkarnagr, Sultanpur, Pratapgarh, Faizabad,
Gorakhpur, Azamgarh, Ballia, Deoria and Sant Ravidasnagar lies in Eastern Uttar Pradesh.
Low Concentration: - (-1.53- -0.40)
There are sixteen districts in this category which account for 18.37 percent of the total
districts. Out of sixteen districts five districts namely Moradabad, J.P. Nagar, Bareilly, Pilibit
and Shahjahanpur lies in Western Uttar Pradesh; four districts namely Kheri, Sitapur, Barabanki
and Hardoi lies in Central Uttar Pradesh; two districts namely Lalitpur and Chitrakoot lies in
26
Bundelkhand region and five districts namely Maharajganj, Basti, Kushinagar, Sant
Ravidasnagar and Sonbhadra lies in Eastern Uttar Pradesh.
Very Low Concentration: - (-2.53- -1.53)
There are seven districts in this category which accounts for 10 percent of the total
districts. Out of these seven districts Rampur and Budaun lies in Western Uttar Pradesh and five
districts namely Bahraich, Sharawasti, Balrampur, Gonda and Sidharthnagar lies in Eastern Uttar
Pradesh.
Percentage of urban population to total population
Urban population of Uttar Pradesh is 20.8 percent. Kanpur Nagaar (67.1%) has the
highest urban population whereas the district of Sharawasti (2.8 %) has the lowest urban
population in the State.But at district level there is wide variation in the distribution of urban
population in the study region. The distribution of urban population in the study region has been
shown in table 2.3 and Fig.2.3
Very High Concentration: - (1.79-3.58)
There are four districts in this category which accounts for 5.71 percent of the total
districts. Out of these four districts two districts namely Meerut and Ghaziabad lies in Western
Uttar Pradesh and two districts namely Kanpur Nagar and Lucknow lies in Central Uttar
Pradesh.
High Concentration: - (0.48-1.79)
There are also nine districts in this category which account for 12.86 percent of the total
districts. Out of these nine districts six districts namely Moradabad, G.B.Nagar, Aligarh,
Mathura, Agra, Firozabad and Bareilly lies in Western Uttar Pradesh and one districts of Jhansi
and one district of Varanasi lies in Bundelkhand and Eastern Uttar Pradesh respectively.

27
Medium Concentration: - (-0.26-0.48)
There are twenty three districts in this category which account for 32.86 percent of the total
districts. Out of these twenty three districts sixteen districts namely Saharanpur, Muzaffarnagar,
Bijnor, Rampur, J.P.Nagar, Kannauj, Etah, Budaun, Pilibhit, Etawah, Baghpat, Bulandshahr, Hathras,
Firozabad, Shahjahanpur and Farrukhabad lies in Western Uttar Pradesh; four districts namely
Mahoba, Banda, Jalaun and Hamirpur lies in Central Uttar Pradesh and three districts namely
Allahabad, Gorakhpur and Mau lies in Eastern Uttar Pradesh.
Table 2.3
Percentage of urban population to total population
Category Index Name of the District No. of
Districts
Very High 1.79-3.58 Meerut, Ghaziabad, Lucknow, Kanpur Nagar 04
High 0.48-1.79 Moradabad, G.B.Nagar, Aligarh, Mathura, Agra,
Bareilly, Jhansi, Varanasi, Firozabad
09
Medium -0.26-0.48 Saharanpur, Mahoba, Banda, Allahabad, Gorakhpur,
Mau, Jalaun, Muzaffarnagar, Bijnor, Rampur, J.P.Nagar,
Kannauj, Hamirpur, Etah, Budaun, Pilibhit, Etawah,
Baghpat, Bulandshahr, Hathras, Firozabad,
Shahjahanpur, Farrukhabad
23
Low -0.78- -0.26 Mirzapur, Ballia, Sant Ravidasnagar, Mainpuri, Auraiya,
Kheri, Raebareli, Barabanki, Chandauli, Sonbhadra,
Faizabad, Chitrakoot, Deoria, Sitapur, Hardoi, Unnao,
Fatehpur, Lalitpur, Bahraich
18
Very Low -1.24 - -0.78 Kanpur Dehat, Pratapgarh, Kaushambi, Sidharthnagar,
Ambedkarnagar, Sultanpur, Sharawasti, Balrampur,
Gonda, Sant Kabirnagar, Maharajganj, Kushinagar,
Azamgarh, Jaunpur, Ghazipur, Basti
16
Low Concentration:- (-0.78- -0.26)
There are eighteen districts in this category which account for 25.71 percent of the total
districts. Out of these eighteen districts two districts namely Mainpuri and Auraiya lies in
Western Uttar Pradesh; six districts namely Barabanki, Sitapur, Hardoi, Unnao, Fatehpur and
Kheri lies in Central Uttar Pradesh; two districts namely Chitrakoot and Lalitpur lies in

28
Bundelkhand region and eight districts namely Mirzapur, Ballia, Sant Ravidasnagar, Chandauli,
Sonbhadra, Faizabad, Deoria and Bahraich lies in Eastern Uttar Pradesh.
Very low Concentration:- (-1.24 - -0.78)
There sixteen districts in this category which account for 22.86 percent of the total districts. Out
of these sixteen one district namely Kanpur Dehat lies in Central Uttar Pradesh and fifteen districts
namely Pratapgarh, Kaushambi, Sidharthnagar, Ambedkarnagar, Sultanpur, Sharawasti, Balrampur,
Gonda, Sant Kabirnagar, Maharajganj, Kushinagar, Azamgarh, Jaunpur, Ghazipur, Basti lies in
Eastern Uttar Pradesh.
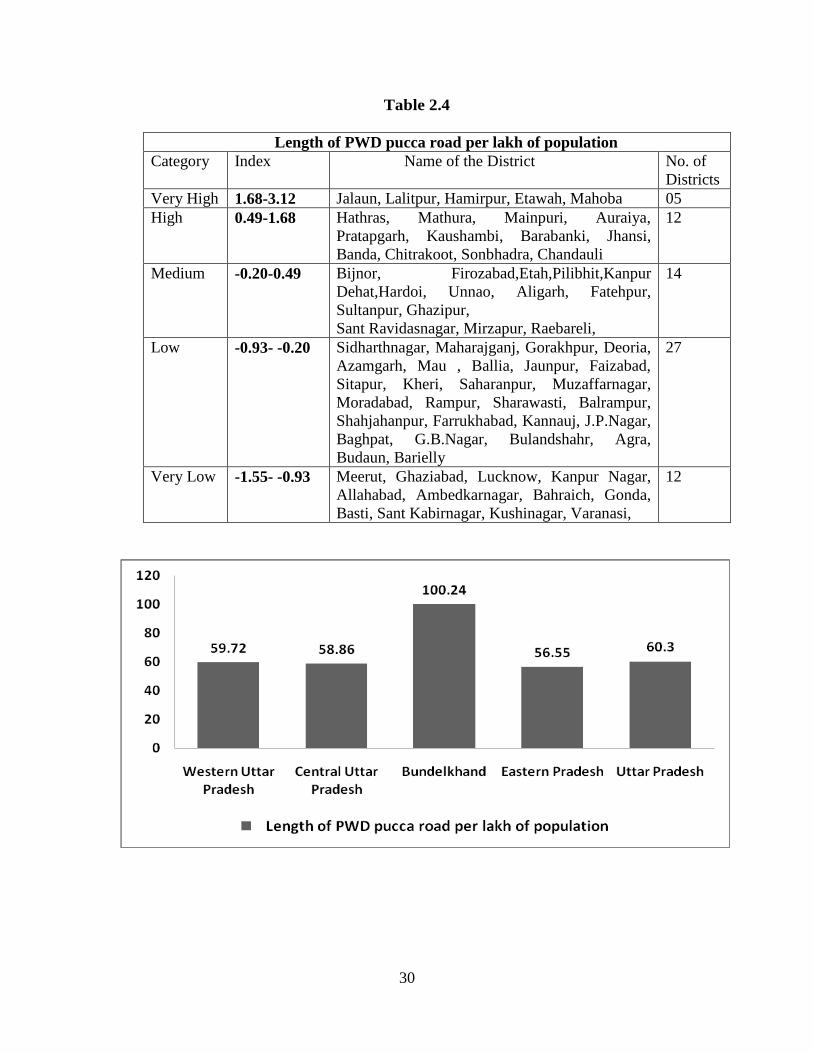
Length of PWD Pucca road per lakh of population
There is 60.3 km of PWD Pucca road per lakh of population in Uttar Pradesh. Lalitpur
(123.95 Km.) has the highest length of Pucca road and Meerut (34.88 Km.) has the lowest length
of pucca road in the State.But at district level there is wide variation in the distribution of pucca
road in the State. The distribution of Pucca road per lakh of population in the study area has been
shown in table 2.4 and Fig.2.4.

29
Very High Concentration:- (1.68-3.12)
There are five districts in this category which account for 7.14 percent of the total districts.
Out of these five districts Etawah is the only districts which lie in the Western Uttar Pradesh;
and four districts namely Jalaun, Lalitpur, Hamirpur and Mahoba lies in the Bundelkhand region.
High Concentration:- (0.49-1.68)
There are twelve districts in this category which account for 17.14 percent of the total
districts. Out of these twelve districts, four districts namely Hathras, Mathura, Mainpuri, Auraiya
lies in Western Uttar; Barabanki districts lies in Central Uttar Pradesh; three districts namely
Banda, Chitrakoot and Banda lies in Bundelkhand region and four districts namely Pratapgarh,
Kaushambi, Sonbhadra and Chandauli lies in Eastern Uttar
Medium Concentration:- (11.28-16.08)
There are fourteen districts in this category which account for 20 percent of the total
districts. Out of these fourteen districts five districts namely Bijnor, Aligarh, Firozabad, Etah,
and Pilibhit lies in Western Uttar Pradesh; five districts namely Kannpur Dehat, Hardoi, Unnao,
Raebareli and Fatehpur lies in Central Uttar Pradesh; four districts namely Sultanpur, Ghazipur,
Snat Ravidasnagar and Mirzapur lies in Eastern Uttar Pradesh.
Low Concentration:- (-0.93- -0.20)
There are twenty seven districts in this category which account for 38.57 percent of the
total districts. Out of these twenty seven districts sixteen districts Saharanpur, Muzaffarnagar,
Moradabad, Rampur, Sharawasti, Balrampur, Shahjahanpur, Farrukhabad, Kannauj, J.P.Nagar,
Baghpat, G.B.Nagar, Bulandshahr, Agra, Budaun and Barielly lies in Western Uttar Pradesh; two
districts namely Sitapur and Kheri lies in Central Uttar Pradesh and nine districts namely
Sidharthnagar, Maharajganj, Gorakhpur, Deoria, Azamgarh, Mau ,Ballia, Jaunpur and Faizabad
30
Table 2.4
Length of PWD pucca road per lakh of population
Category Index Name of the District No. of
Districts
Very High 1.68-3.12 Jalaun, Lalitpur, Hamirpur, Etawah, Mahoba 05
High 0.49-1.68 Hathras, Mathura, Mainpuri, Auraiya,
Pratapgarh, Kaushambi, Barabanki, Jhansi,
Banda, Chitrakoot, Sonbhadra, Chandauli
12
Medium -0.20-0.49 Bijnor, Firozabad,Etah,Pilibhit,Kanpur
Dehat,Hardoi, Unnao, Aligarh, Fatehpur,
Sultanpur, Ghazipur,
Sant Ravidasnagar, Mirzapur, Raebareli,
14
Low -0.93- -0.20 Sidharthnagar, Maharajganj, Gorakhpur, Deoria,
Azamgarh, Mau , Ballia, Jaunpur, Faizabad,
Sitapur, Kheri, Saharanpur, Muzaffarnagar,
Moradabad, Rampur, Sharawasti, Balrampur,
Shahjahanpur, Farrukhabad, Kannauj, J.P.Nagar,
Baghpat, G.B.Nagar, Bulandshahr, Agra,
Budaun, Barielly
27
Very Low -1.55- -0.93 Meerut, Ghaziabad, Lucknow, Kanpur Nagar,
Allahabad, Ambedkarnagar, Bahraich, Gonda,
Basti, Sant Kabirnagar, Kushinagar, Varanasi,
12
31
Very Low Concentration:- (-1.55- -0.93)
There are twelve districts in this category which account for 17.14 percent of the total
districts. Out of twelve districts two districts namely Meerut and Ghaziabad lies in Western Uttar
Pradesh; Lucknow, and Kanpur Nagar lies in Central Uttar Pradesh and eight districts namely
Allahabad, Ambedkarnagar, Bahraich, Gonda, Basti, Sant Kabirnagar, Kushinagar and Varanasi lies
in Eastern Uttar Pradesh.
Per capita electricity consumption (K.W.H.)
Per capita electricity consumption in Uttar Pradesh is (174.8 KWH). Sonbhadra district
has the highest per capita electricity consumption of (2888.6 KWH) and Sharawasti (30.8 KWH)
has the lowest consumption of per capita electricity. At the district level there is wide variation
in the consumption of electricity in the State.The distribution of electricity consumption in study
area has been shown in table 2.5 and Fig.2.5
Very High Concentration:- (4.47-19.31)
There are two districts in this category which account for 2.86 percent of the total districts.
Out of these two districts G.B.Nagar lies in Western Uttar Pradesh and Sonbhadra district is lie
in Eastern Uttar Pradesh.
High Concentration:- (0.49-4.47)
There seven districts in this category which account for 10 percent of the total districts. Out of
these ten districts three districts namely Meerut, Ghaziabad and Agra lies in Western Uttar Pradesh;
two districts namely Kanpur Nagar and Lucknow lies in Central Uttar Pradesh and two districts
namely Allahabad and Varanasi lies in Eastern Uttar Pradesh.

32
Table 2.5
Per capita electricity consumption(K.W.H.)
Category Index Name of the District No. of
Districts
Very
High 4.47-19.31 G.B.Nagar, Sonbhadra 02
High 0.49-4.47 Meerut, Ghaziabad, Agra, Lucknow, Kanpur Nagar,
Allahabad, Varanasi,
07
Medium -1.28-0.49 Saharanpur, Muzaffarnagar, Bijnor, Sant
Ravidasnagar, Mirzapur, Moradabad, Rampur,
J.P.Nagar, Baghpat, Bulandshahr, Aligarh, Hathras,
Mathura, Firozabad, Etah, Mainpuri, Barielly,
Chandauli, Jaunpur, Ghazipur, Pilibhit,
Shahjahanpur, Etawah, Sitapur, Raebareli, Kanpur
Dehat, Fatehpur, Barabanki, Jalaun, Jhansi, Lalitpur,
Hamirpur, Sultanpur, Deoria, Mahoba, Banda,
Kaushambi, Faizabad, Ambedkarnagar, Mau,
40
Low -3.37- -
1.28
Basti, Budaun, Farrukhabad, Kannauj, Balrampur,
Bahraich, Sharawasti, Auraiya, Kheri, Hardoi,
Unnao, Chitrakoot, Pratapgarh, Maharajganj,
Gorakhpur, Azamgarh, Ballia
17
Very
Low -4.32- -
3.37
Gonda, Sidharthnagar, Sant Kabirnagar, Kushinagar 04
33
Medium Concentration:- (-1.28-0.49)
There are forty districts in this category which account for 57.14 percent of the total
districts. Out of these forty districts, eighteen districts namely Saharanpur, Muzaffarnagar, Bijnor,
Moradabad, Rampur, J.P.Nagar, Baghpat, Bulandshahr, Aligarh, Hathras, Mathura, Firozabad, Etah,
Mainpuri, Barielly, Pilibhit, Shahjahanpur and Etawah lies in Western Uttar Pradesh; five districts
namely Sitapur, Raebareli, Kanpur Dehat, Fatehpur and Barabanki lies in Central Uttar Pradesh; six
districts namely Jalaun, Jhansi, Lalitpur, Hamirpur, Mahoba and Banda lies in Bundelkhand region
and eleven districts namely Sant Ravidasnagar, Mirzapur, , Chandauli, Jaunpur, Ghazipur, ,
Sultanpur, Deoria, Kaushambi, Faizabad, Ambedkarnagar and Mau lies in Eastern Uttar Pradesh.
Low Concentration:- (-3.37- -1.28)
There are seventeen districts in this category which account for 24.29 percent of the total
districts. Out of these seventeen districts, four districts namely Budaun, Farrukhabad, Kannauj and
Auraiya lies in Western Uttar Pradesh; three districts namely Kheri, Hardoi and Unnao lies in Central
Uttar Pradesh; Chitrakoot lies in Bundelkhand region and eight districts namely Basti, Balrampur,
Bahraich, Sharawasti, Pratapgarh, Maharajganj, Gorakhpur, Azamgarh and Ballia lies in Eastern
Uttar Pradesh.
Very Low Concentration:- (-4.32- -3.37)
There are four districts in this category which account for 5.71 percent of the total
districts. All the four districts in this category namely Gonda, Sidharthnagar, Sant Kabirnagar and
Kushinagar lie in Eastern Uttar Pradesh.
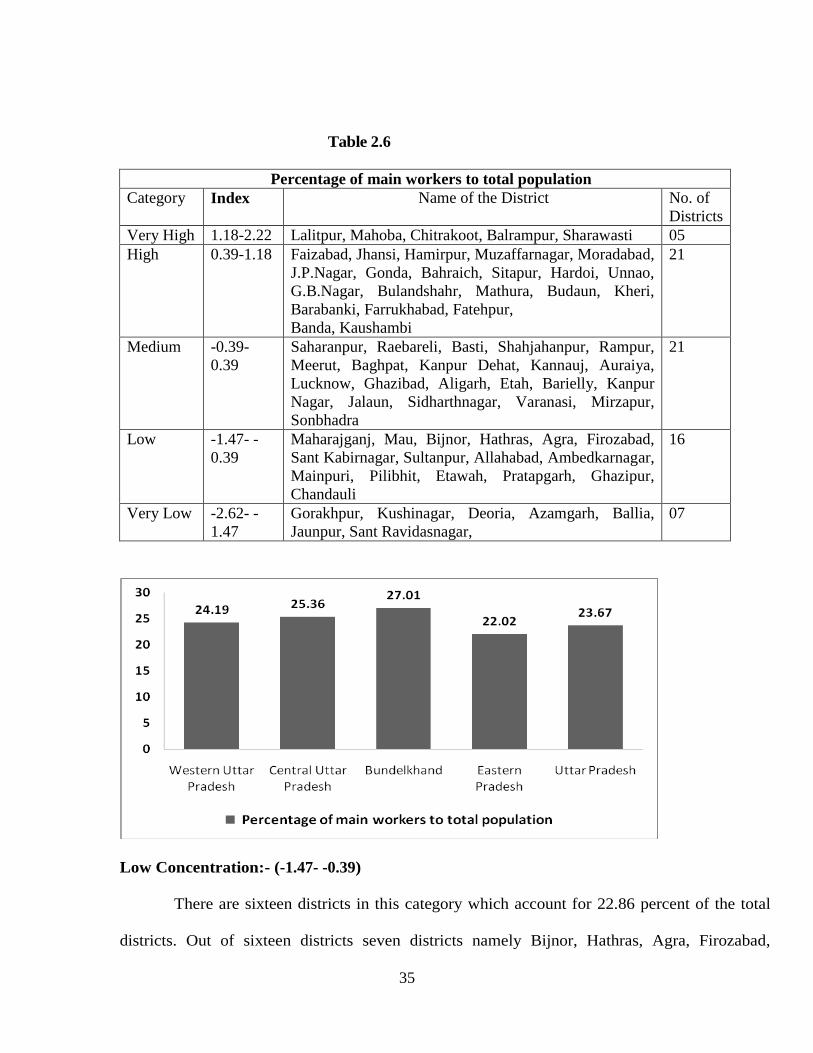
Percentage of main workers to total population
In Uttar Pradesh there is 23.67 percent of main worker to total population. Balrampur
(29.82 %) has the highest percentage of main worker and Deoria (17.16 %) has the lowest

34
percentage of main workers. At the district level there is wide variation in the distribution of
main workers to total population of the State. The distribution of main workers to total
population has been shown in table 2.6 and Fig.2.6
Very High Concentration:- (1.18-2.22)
There are five districts in this category which account for 7.14 percent of the total districts.
Out of these five districts three districts namely Lalitpur, Mahoba and Chitrakoot lies in
Bundelkhand region and two districts namely Balrampur and Sharawasti lies in Eastern Uttar
Pradesh.
High Concentration:- (0.39-1.18)
There are twenty one districts in this category which account for the 30 percent of the
total districts. Out of twenty one districts, eight districts namely Muzaffarnagar, Moradabad,
J.P.Nagar, G.B Nagar, Bulandshahr, Mathura, Budaun and Farrukhabad lies in Western Uttar
Pradesh; six districts namely Sitapur, Hardoi, Unnao, Barabanki and Fatehpur lies in Central
Uttar Pradesh; three districts namely Jhansi, Hamirpur and Banda lies in Bundelkhand region
and four district namely Faizabad, Bahraich, Gonda and Kaushambi lies in Eastern Uttar
Pradesh.
Medium Concentration:- (-0.39-0.39)
There are twenty one districts in this category which account for 30 percent of the total districts.
Out of twenty districts eleven districts namely Saharanpur, Shahjahanpur, Rampur, Meerut, Baghpat,
Kannauj, Auraiya, Ghaziabad, Aligarh, Etah and Bareilly lies in Western Uttar Pradesh; four districts
namely Raebareli, Kanpur Dehat, Kanpur Nagar and Lucknow lies in Central Uttar Pradesh; district of
Jalaun lies in Bundelkhand region and five districts namely Basti, Sidharthnagar, Varanasi, Mirzapur
and Sonbhadra lies in Eastern Uttar Pradesh.
35
Table 2.6
Percentage of main workers to total population
Category Index Name of the District No. of
Districts
Very High 1.18-2.22 Lalitpur, Mahoba, Chitrakoot, Balrampur, Sharawasti 05
High 0.39-1.18 Faizabad, Jhansi, Hamirpur, Muzaffarnagar, Moradabad,
J.P.Nagar, Gonda, Bahraich, Sitapur, Hardoi, Unnao,
G.B.Nagar, Bulandshahr, Mathura, Budaun, Kheri,
Barabanki, Farrukhabad, Fatehpur,
Banda, Kaushambi
21
Medium -0.39-
0.39
Saharanpur, Raebareli, Basti, Shahjahanpur, Rampur,
Meerut, Baghpat, Kanpur Dehat, Kannauj, Auraiya,
Lucknow, Ghazibad, Aligarh, Etah, Barielly, Kanpur
Nagar, Jalaun, Sidharthnagar, Varanasi, Mirzapur,
Sonbhadra
21
Low -1.47- -
0.39
Maharajganj, Mau, Bijnor, Hathras, Agra, Firozabad,
Sant Kabirnagar, Sultanpur, Allahabad, Ambedkarnagar,
Mainpuri, Pilibhit, Etawah, Pratapgarh, Ghazipur,
Chandauli
16
Very Low -2.62- -
1.47
Gorakhpur, Kushinagar, Deoria, Azamgarh, Ballia,
Jaunpur, Sant Ravidasnagar,
07
Low Concentration:- (-1.47- -0.39)
There are sixteen districts in this category which account for 22.86 percent of the total
districts. Out of sixteen districts seven districts namely Bijnor, Hathras, Agra, Firozabad,
36
Mainpuri, Pilibhit and Etawah lies in Western Uttar Pradesh and nine districts namely
Maharajganj, Mau, Sant Kabirnagar, Sultanpur, Allahabad, Ambedkarnagar, Pratapgarh,
Ghazipur and Chandauli lies in Eastern Uttar Pradesh.
Very Low Concentration:- (-2.62- -1.47)
There are seven districts in this category which account for 10 percent of the total districts. All
the seven districts in this category namely Gorakhpur, Kushinagar, Deoria, Azamgarh, Ballia, Jaunpur
and Sant Ravidasnagar lies in Eastern Uttar Pradesh.
No. of beds in Allopathic hospitals/dispensaries per lakh of population
(including P.H.C) There are 40.17 beds in Allopathic hospital/ dispensaries per lakh of population in Uttar
Pradesh. Lucknow (126.16) has the highest number of bed and Ambednagar (10.37) has the
lowest number of bed per lakh of population. At the district level there is wide variation in the
distribution of number of beds per lakh of population in the study region. The distribution of
beds per lakh of population has been shown in table 2.7 and Fig.2.7
Very High Concentration:- (0.08-0.12)
There are seven districts in this category which account for 10 percent of the total districts.
Out of these seven districts, two districts namely Agra and Aligarh lies in Western Uttar Pradesh;
two districts namely Kanpur Nagar and Lucknow lies in Central Uttar Pradesh; district of Jhansi lie
in Bundelkhand region and Gorakhpur and Varanasi district lies in Eastern Uttar Pradesh.
High Concentration:- (0.05-0.08)
There are seven districts in this category which account for 10 percent of the total districts. Out of
these seven districts, four districts namely Meerut, Mathura, Farrukhabad and Etawah lies in Western
Uttar Pradesh; Sitapur, Lalitpur and Allahabad lies in Central Uttar Pradesh, Bundelkhand region and
Eastern Uttar Pradesh respectively.

37
Table 2.7
No. of beds in Allopathic hospitals/dispensaries per lakh of population (including
P.H.C)
Category Index Name of the District No. of
Districts
Very High 0.08-0.12 Lucknow, Aligarh, Agra, Kanpur Nagar, Jhansi,
Gorakhpur, Varanasi
07
High 0.05-0.08 Meerut, Mathura, Farrukhabad, Etawah, Sitapur,
Lalitpur, Allahabad,
07
Medium 0.03-0.05 Gonda, Bahraich, Saharanpur, Rampur, Bulandshahr,
Barielly, Faizabad, Mirzapur, Basti, Banda, Pratapgarh,
Sultanpur, Shahjahanpur, Pilibhit, Raebareli, Jaluan,
Sharawasti, Hamirpur, Deoria
19
Low 0.02-0.03 Jaunpur, Bijnor, Moradabad,Ghaziabad, Firozabad,
Etah, Buduan, Kannauj, Hardoi, Ghazipur, Unnao,
Fatehpur, Mahoba, Chitrakoot, Kaushambi, Balrampur,
Sidharthnagar, Azamgarh, Ballia, Sonbhadra
20
Very Low 0.01-0.02 Muzaffarnagar, J.P.Nagar, Baghpat, G.B.Nagar,
Hathras, Mainpuri, Auraiya, Kheri, Kanpur Dehat,
Barabanki, Ambedkarnagar, Sant Kabirnagar,
Kushinagar, Chandauli, Sant Ravidasnagar, Mau,
Maharajganj
18
38
Medium Concentration:- (0.03-0.05)
There are nineteen districts in this category which account for 27.14 percent of the total
districts. Out of nineteen districts six districts namely Saharanpur, Shahjahanpur, Rampur,
Bulandshahr, Pilibhit and Bareilly lies in Western Uttar Pradesh; one district namely Raebareli
lies in Central Uttar Pradesh; three districts namely Banda, Jalaun and Hamirpur lies in
Bundelkhand region and nine districts namely Gonda, Bahraich, Faizabad, Mirzapur, Basti
Pratapgarh, Sultanpur, Sharawasti,and Deoria lies in Eastern Uttar Pradesh
Low Concentration:- (0.02-0.03)
There are twenty districts in this category which account for 28.57 percent of the total
districts. Out of twenty districts seven districts namely Bijnor, Hathras, Agra, Firozabad,
Mainpuri, Pilibhit and Etawah lies in Western Uttar Pradesh and nine districts namely
Maharajganj, Mau, Sant Kabirnagar, Sultanpur, Allahabad, Ambedkarnagar, Pratapgarh,
Ghazipur and Chandauli lies in Eastern Uttar Pradesh.
Very Low Concentration:- (-2.62- -1.47)
There are seven districts in this category which account for 10 percent of the total districts. All
the seven districts in this category namely Gorakhpur, Kushinagar, Deoria, Azamgarh, Ballia, Jaunpur
and Sant Ravidasnagar lies in Eastern Uttar Pradesh.
No. of Primary Health Centres (P.H.C) per lakh of population
There are 2.05 primary health centres per lakh of population in Uttar Pradesh. The district
of Azamgarh (4.43) has the highest and Ambedkarnagar (0.44) has the lowest number of
primary health centres per lakh of population. But at district level there is wide variation in the
distribution of primary health centres per lakh of population in the study region. The distribution
of primary health centres per lakh of population has been shown in table 2.8 and Fig.2.8

39
Very High Concentration:- (1.32-3.27)
There are four districts in this category which account for 5.71 percent of the total districts.
Out of these four districts, three districts namely Hamirpur, Banda and Chitrakoot lies in
Bundelkhand region and one district of Azamgarh lies Eastern Uttar Pradesh.
High Concentration:- (0.36-1.32)
There are fifteen districts in this category which accounts for 21.43 percent of the total districts.
Out of these fifteen districts, two districts namely Agra and Kannauj lies in Western Uttar Pradesh; two
districts namely Raebareli and Fatehpur lies in Central Uttar Pradesh; three districts namely Jalaun,
Jhansi and Lalitpur lies Bundelkhand region and eight districts namely Ballia, Deoria, Sidharthnagar,
Basti, Pratapgarh, Kaushambi, Sultanpur and Gonda lies in Eastern Uttar Pradesh.
Medium Concentration:- (-0.46-0.36)
There are thirty one districts in this category which account for 44.29 percent of the total
districts. Out of thirty one district thirteen districts namely Muzaffarnagar, Moradabad, Rampur,
J.P.Nagar, Meerut, Bulandshahr, Aligarh, Hathras, Mathura, Etah, Mainpuri, Shahjahanpur, and
Bareilly lies in Western Uttar Pradesh; six districts namely Kheri, Sitapur, Hardoi, Unnao,
Kanpur Dehat and Barabanki lies in Central Uttar Pradesh; one district namely Mahoba lies i n
Bundelkhand region and eleven districts namely Bahraich, Sharawasti, Balrampur, Gorakhpur,
Kusinagar, Mirzapur, Mau, Jaunpur, Ghazipur, Chandauli and Sonbhadra lies in Eastern Uttar
Pradesh
Table 2.8
No. of P.H.Cs. per lakh of population
Category Index Name of the District No. of
Districts
Very High 1.32-3.27 Hamirpur, Banda, Chitrakoot, Azamgarh 04
High 0.36-1.32 Agra, Kannauj, Raebareli, Fatehpur, Jalaun, Ballia,
Deoria, Sidharthnagar, Basti, Jhansi, Lalitpur, Pratapgarh,
15

40
Kaushambi, Sultanpur, Gonda,
Medium -0.46-0.36 Muzaffarnagar, Moradabad, Rampur, J.P.Nagar, Meerut,
Bulandshahr, Aligarh, Hathras, Mathura, Etah, Mainpuri,
Bariely, Shahjahanpur, Kheri, Sitapur, Hardoi, Unnao,
Kanpur Dehat, Barabanki, Mahoba, Bahraich, Sharawasti,
Balrampur, Gorakhpur, Kusinagar, Mirzapur, Mau,
Jaunpur, Ghazipur, Chandauli, Sonbhadra,
31
Low -1.62- -
0.46
Varanasi, Firozabad, Saharanpur, Bjnor, Baghpat,
Ghaziabad, G.B.Nagar, Sant Kabirnagar, Sant
Ravidasnagar, Budaun, Pilibhit, Farrukhabad, Kanpur
Nagar, Allahabad, Faizabad, Maharajganj
16
Very Low -2.44- -
1.62
Etawah, Auraiya, Lucknow, Ambedkarnagar 04
Low Concentration:- (-1.62- -0.46)
There are sixteen districts in this category which account for 22.86 percent of the total
districts. Out of these sixteen districts nine districts namely Firozabad, Saharanpur, Bjnor,
Baghpat, Pilibhit, Budaun, Farrukhabad, Ghaziabad and G.B.Nagar lies in Western Uttar Pradesh;
district of Kanpur Nagar lies in Central Uttar Pradesh and six districts namely Maharajgan, Sant
Kabirnagar, Allahabad, Faizabad, Varanasi and Sant Ravidas Nagar lies in Eastern Uttar
Pradesh.

41
Very Low Concentration:- (-2.44- -1.62)
There are four districts in this category which account for 5.71 percent of the total districts. Out
of these four districts two districts namely Etawah and Auraiya lies in Western Uttar Pradeesh and the
districts of Lucknow and Ambedkarnagar lies in Central Uttar Pradesh and Eastern Uttar Pradesh
respectively.
Composite Index
To find out the over all levels of social development, the composite indices have been
worked out for each districts by adding the z-score values of all the variables. The index value is
then divided into five grades of very high, high, medium, low and very low. The Composite
Index has been given in table appendix A.
Levels of Social Development
The levels of social development in the study region has been shown in table 4.11 and
Fig.4.10
Very High Social Development:- (4.61-18.88)
There are nine districts in this category which account for 12.86 percent of the total
districts.G.B.Nagar and Agra are the district which lies in Western Uttar Pradesh; Kanpur Nagar
lies in Central Uttar Praesh; five districts namely Jalaun, Lalitpur, Hamirpur, Jhansi and
Chitrakoot lies in Bundelkhand region and the district of Sonbhadra lie in Eatern Uttar Pradesh.
High Social Development:- (0.45-4.61)
There are nineteen districts in this category which account for 27.14 percent of the total
districts.Out of these nineteen districts thirteen district namely Mathura, Mainpuri, Firozabad,
Etawah, Hathras, Meerut, Ghaziabad, Bulandshahr, Aligarh, Auraiya, Muzaffarnagar, J.P.Nagar
and Etah lies in Western Uttar Pradesh; three districts namely Lucknow, Barabanki and Kanpur
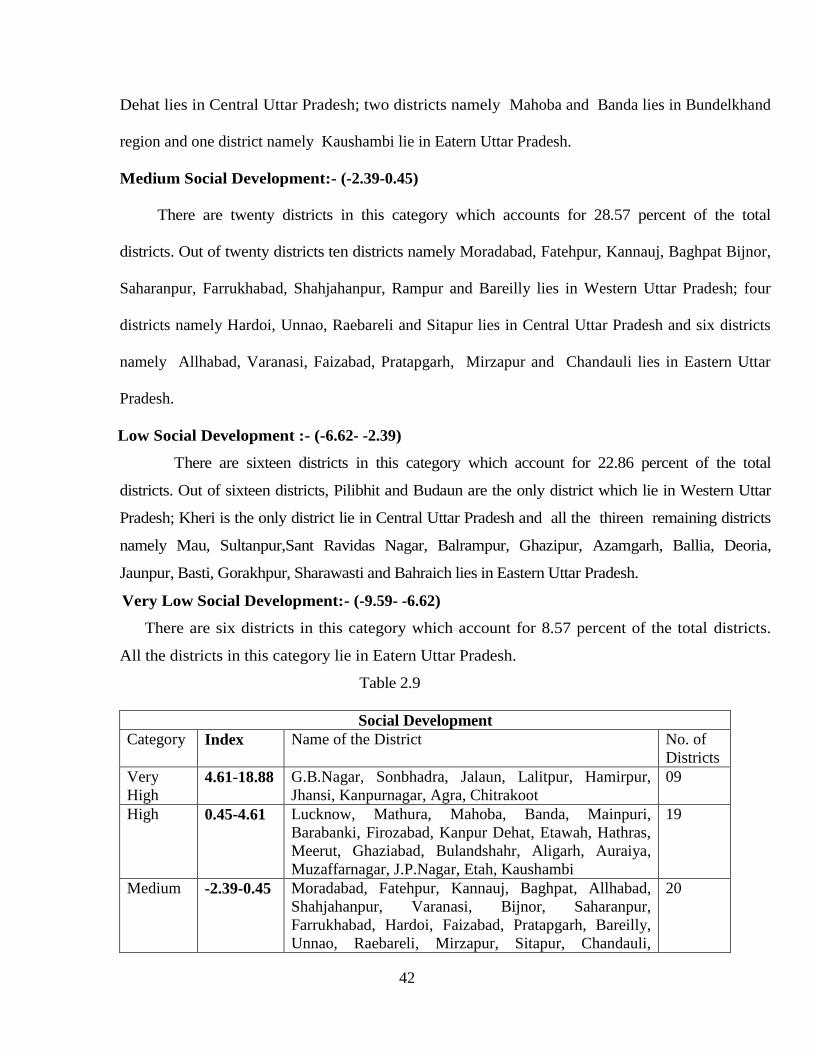
42
Dehat lies in Central Uttar Pradesh; two districts namely Mahoba and Banda lies in Bundelkhand
region and one district namely Kaushambi lie in Eatern Uttar Pradesh.
Medium Social Development:- (-2.39-0.45)
There are twenty districts in this category which accounts for 28.57 percent of the total
districts. Out of twenty districts ten districts namely Moradabad, Fatehpur, Kannauj, Baghpat Bijnor,
Saharanpur, Farrukhabad, Shahjahanpur, Rampur and Bareilly lies in Western Uttar Pradesh; four
districts namely Hardoi, Unnao, Raebareli and Sitapur lies in Central Uttar Pradesh and six districts
namely Allhabad, Varanasi, Faizabad, Pratapgarh, Mirzapur and Chandauli lies in Eastern Uttar
Pradesh.
Low Social Development :- (-6.62- -2.39)
There are sixteen districts in this category which account for 22.86 percent of the total
districts. Out of sixteen districts, Pilibhit and Budaun are the only district which lie in Western Uttar
Pradesh; Kheri is the only district lie in Central Uttar Pradesh and all the thireen remaining districts
namely Mau, Sultanpur,Sant Ravidas Nagar, Balrampur, Ghazipur, Azamgarh, Ballia, Deoria,
Jaunpur, Basti, Gorakhpur, Sharawasti and Bahraich lies in Eastern Uttar Pradesh.
Very Low Social Development:- (-9.59- -6.62)
There are six districts in this category which account for 8.57 percent of the total districts.
All the districts in this category lie in Eatern Uttar Pradesh.
Table 2.9
Social Development
Category Index Name of the District No. of
Districts
Very
High 4.61-18.88 G.B.Nagar, Sonbhadra, Jalaun, Lalitpur, Hamirpur,
Jhansi, Kanpurnagar, Agra, Chitrakoot
09
High 0.45-4.61 Lucknow, Mathura, Mahoba, Banda, Mainpuri,
Barabanki, Firozabad, Kanpur Dehat, Etawah, Hathras,
Meerut, Ghaziabad, Bulandshahr, Aligarh, Auraiya,
Muzaffarnagar, J.P.Nagar, Etah, Kaushambi
19
Medium -2.39-0.45 Moradabad, Fatehpur, Kannauj, Baghpat, Allhabad,
Shahjahanpur, Varanasi, Bijnor, Saharanpur,
Farrukhabad, Hardoi, Faizabad, Pratapgarh, Bareilly,
Unnao, Raebareli, Mirzapur, Sitapur, Chandauli,
20

43
Rampur
Low -6.62- -
2.39
Mau, Sultanpur, Pilibhit, Kheri, Sant Ravidasnagar,
Balrampur, Ghazipur, Azamgarh, Ballia, Deoria,
Jaunpur, Basti, Gorakhpur, Sharawasti, Bahraich,
Budaun
16
Very
Low -9.59- -
6.62
Ambedkarnagar, Gonda, Sidharthnagar, Sant
Kabirnagar, Maharajganj, Kushinagar
06
References :
1 Attane, Isabelle (2002).“China's Family Planning Policy: An Overview of
Its Past and Future.” Studies in Family Planning, Vol. 33(1), pp. 103-113.
2 Acharya, Shankar (2004). “India’s Growth Prospects Revisited”.
Economic and Political Weekly, Vol. 39, No. 41 (Oct. 9-15), 4537-4542.
3 Aghion, Philippe, Peter Howitt, and Fabrice Murtin (2010). “The
Relationship Between Health and Growth: When Lucas Meets Nelson-
Phelps.” NBER Working Paper, 15813.
4 Barro, Robert, and X. Sala-i-Martin (1995). Economic Growth, New York:McGraw-Hill.
5 Bhargava, Alok, Dean T. Jamison, Lawrence J. Lau, and Christopher J. L. Murray
(2001). “Modeling the Effects of Health on Economic Growth.” Journal of Health
Economics, Vol. 20, 423–440.
44
6 Bloom, David E., David Canning, and Pia Malaney (2000).“Demographic Change and
Economic Growth in Asia.” Population and Development
Review, Vol. 26, pp. 257–290.
7 Bloom, David E., David Canning, and Jaypee Sevilla (2004). “The Effect
of Health on Economic Growth: A Production Function Approach.” World
Development, Vol. 32, No. 1, pp. 1–13.
8 Bosworth, Barry and Susan M. Collins (2008). "Accounting for Growth:
Comparing China and India," Journal of Economic Perspectives, American
Economic Association, vol. 22(1), pages 45-66.
9 Crenshaw, Edward M., Ansari Z. Ameen, and Matthew Christenson
(1997). “Population dynamics and economic development: Age-specific
population growth rates and economic growth in developing countries,
1965to1990”. American Sociological Review, Vol.62. December.974-984.
10 Duraisamy, P., and A. Mahal (2005). “Health, poverty and economic
growth in India”. In Health Systems in India: Delivery and Financing of
Services, National Commission on Macroeconomics and Health, Ministry
of Health and Family Welfare, Government of India, New Delhi, pp. 1-14,
2005.
11 Government of India, Ministry of Health and Family Welfare. National
Family Health Survey, 2005-2006. Fact sheet available at
http://hetv.org/india/nfhs/nfhs3/NFHS-3-IN.pdf
12 Kurian, N.J. (2007). “Widening economic & social disparities:
Implications for India”. Indian Journal of Medical Research, October.
374-380.
13 Ahluwalia, Montek S. (2000), “Economic Performance of States in Post- Reforms
Period”, Economic and Political Weekly, May 6, pp. 1637-1648.
14 Bhattacharya, B.B. and Arup Mitra (1990), “Excess Growth of Tertiary Sector in Indian
Economy: Issues and Implications”, Economic and Political Weekly, Nov. 3.
15 Deaton, Angus and Dreze, Jean (2002), “Poverty and Inequality in India – A Re-
Examination”, Economic and Political Weekly, September 7, pp. 3729-3748.

45
16 Dreze, Jean and Sen, Amartya (2002), India: Development and Participation, Oxford
University Press, New Delhi.
17 Nagaraj, R, Aristomene Varoudakis and Marie-Ange Veganzones (1998), “Long-Run
Growth Trends and Convergence Across Indian States”, OECD Technical Papers, No.
131, January, pp. 1-58.
18 Rao, C.H. Hanumantha and S. Mahendra Dev (2003), “Economic Reforms and
Challenges Ahead – An Overview”, Economic and Political Weekly, Special Issue on
Andhra Pradesh, March 22-29, pp. 1130-41.
19 Rao, M. Govinda, R.T. Shand and K.P. Kalirajan (1999), “Convergence of Incomes
Across Indian States – A Divergent View”, Economic and Political Weekly, March 27.
20 Gang, Ira, Kunal Sen and Myeong-Su Yun (2002): ‘Caste, Ethnicity and Poverty in Rural
India’, IZA Discussion Paper No. 629, Bonn.
21 Government of India (2001): National Human Development Report,
Oxford University Press, New Delhi.
*********************************
46
Chapter 3
Agricultural Development
Agricultural development means, by and large an improvement of land productivity with
the application of higher degree of Inputs. The main aim of the agricultural development is to achieve
the increased amount of agricultural production and a high rate of economic growth in order to bring
about an improvement in the standard of living of the people. The development of this sector of
economy therefore is a prime concern of planners, economists and geographers and offers, a
challenge for them to find ways and means to bring about its overall reforms.
Agriculture is the mainstay of the people of Uttar Pradesh. The agricultural landscape in the
study region is very complex because of the difference in soil fertility and other resource endowment
such as irrigation facilities, relief and climatic conditions. There is no clear demarcation of various
agricultural regions in the study area as factors that contribute to the regional differences in
agriculture are varied. The great regional variation in agricultural resource base is primarily due to
varying physio-ecological conditions, level of socio-economic development, demographic and
cultural pattern.
The most difficult task in the construction of general index is the selection of variables,
by which the levels of development are measured for the purpose of identification, classification
and regionalization. In the selection process, aspect of accuracy, variability, measurability and
stability are given due consideration. For the present study, four indicators have been selected to
find out the levels of agricultural development.
Variable Definition
X9 Percentage of main agricultural workers to total main workers
X10 Percentage of gross irrigated area to gross area sown
X11 Cropping intensity
X12 Distribution of total fertilizer per hectare of gross area sown

47
Percentage of main agricultural workers to total main workers
The expression 'agricultural workers' denotes those rural workers who are employed
on wages in agricultural occupations. In Uttar Pradesh there are 62.12 percent agricultural
workers to total workers as compared to Bundelkhand region where it is 70.08 percent. In
Western Uttar Pradesh the agricultural workers are 56.08 percent of total main workers. At
district level there is wide variation in the distribution of agricultural workers to total
workers in the study region. The distribution of agricultural workers to total workers has
been shown in table 3.1and Fig.3.1
Very High Concentration: (0.90-1.55)
There are twelve districts which have very high concentration of agricultural workers to total
population, which accounts for 17.14 percent of the total districts. Out of twelve districts, two
districts namely Mainpuri and Budaun lies in Western Uttar Pradesh; three districts namely Kheri,
Sitapur and Hardoi lies in Central Uttar Pradesh; Chitrakoot district lies in Bundelkhand region and
Six districts namely lies Bahraich, Sharawasti, Balrampur, Gonda, Sidhartnagar and Maharajganj
lies in Eastern Uttar Pradesh.
High Concentration: (0.43-0.90)
There are twenty one districts in this category which account for 30 percent of the total
districts of the study area Out of these five districts namely Pilibhit, Auraiya, Shahjahanpur, Etah and
Kannauj lies in Western Uttar Pradesh; five districts namely Raebareli, Unnao, Fatehpur, Barabanki
and Kanpur Dehat lies in Central Uttar Pradesh; four districts namely Hamirpur, Mahoba, Banda and
Lalitpur lies Bundelkhand region and seven districts namely Faizabad, Sultanpur, Paratapgarh,
Kushinagar, Basti, Sant Kabirnagar and Kaushambi lies in Eastern Uttar Pradesh.
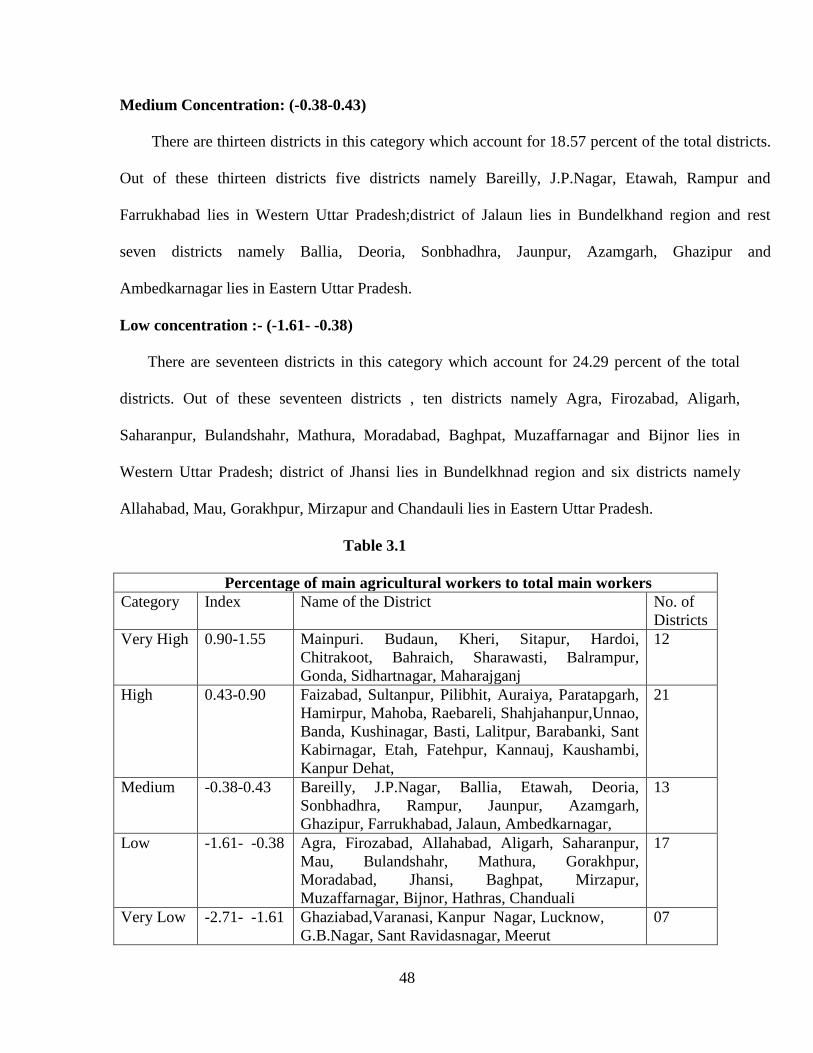
48
Medium Concentration: (-0.38-0.43)
There are thirteen districts in this category which account for 18.57 percent of the total districts.
Out of these thirteen districts five districts namely Bareilly, J.P.Nagar, Etawah, Rampur and
Farrukhabad lies in Western Uttar Pradesh;district of Jalaun lies in Bundelkhand region and rest
seven districts namely Ballia, Deoria, Sonbhadhra, Jaunpur, Azamgarh, Ghazipur and
Ambedkarnagar lies in Eastern Uttar Pradesh.
Low concentration :- (-1.61- -0.38)
There are seventeen districts in this category which account for 24.29 percent of the total
districts. Out of these seventeen districts , ten districts namely Agra, Firozabad, Aligarh,
Saharanpur, Bulandshahr, Mathura, Moradabad, Baghpat, Muzaffarnagar and Bijnor lies in
Western Uttar Pradesh; district of Jhansi lies in Bundelkhnad region and six districts namely
Allahabad, Mau, Gorakhpur, Mirzapur and Chandauli lies in Eastern Uttar Pradesh.
Table 3.1
Percentage of main agricultural workers to total main workers
Category Index Name of the District No. of
Districts
Very High 0.90-1.55 Mainpuri. Budaun, Kheri, Sitapur, Hardoi,
Chitrakoot, Bahraich, Sharawasti, Balrampur,
Gonda, Sidhartnagar, Maharajganj
12
High 0.43-0.90 Faizabad, Sultanpur, Pilibhit, Auraiya, Paratapgarh,
Hamirpur, Mahoba, Raebareli, Shahjahanpur,Unnao,
Banda, Kushinagar, Basti, Lalitpur, Barabanki, Sant
Kabirnagar, Etah, Fatehpur, Kannauj, Kaushambi,
Kanpur Dehat,
21
Medium -0.38-0.43 Bareilly, J.P.Nagar, Ballia, Etawah, Deoria,
Sonbhadhra, Rampur, Jaunpur, Azamgarh,
Ghazipur, Farrukhabad, Jalaun, Ambedkarnagar,
13
Low -1.61- -0.38 Agra, Firozabad, Allahabad, Aligarh, Saharanpur,
Mau, Bulandshahr, Mathura, Gorakhpur,
Moradabad, Jhansi, Baghpat, Mirzapur,
Muzaffarnagar, Bijnor, Hathras, Chanduali
17
Very Low -2.71- -1.61 Ghaziabad,Varanasi, Kanpur Nagar, Lucknow,
G.B.Nagar, Sant Ravidasnagar, Meerut
07
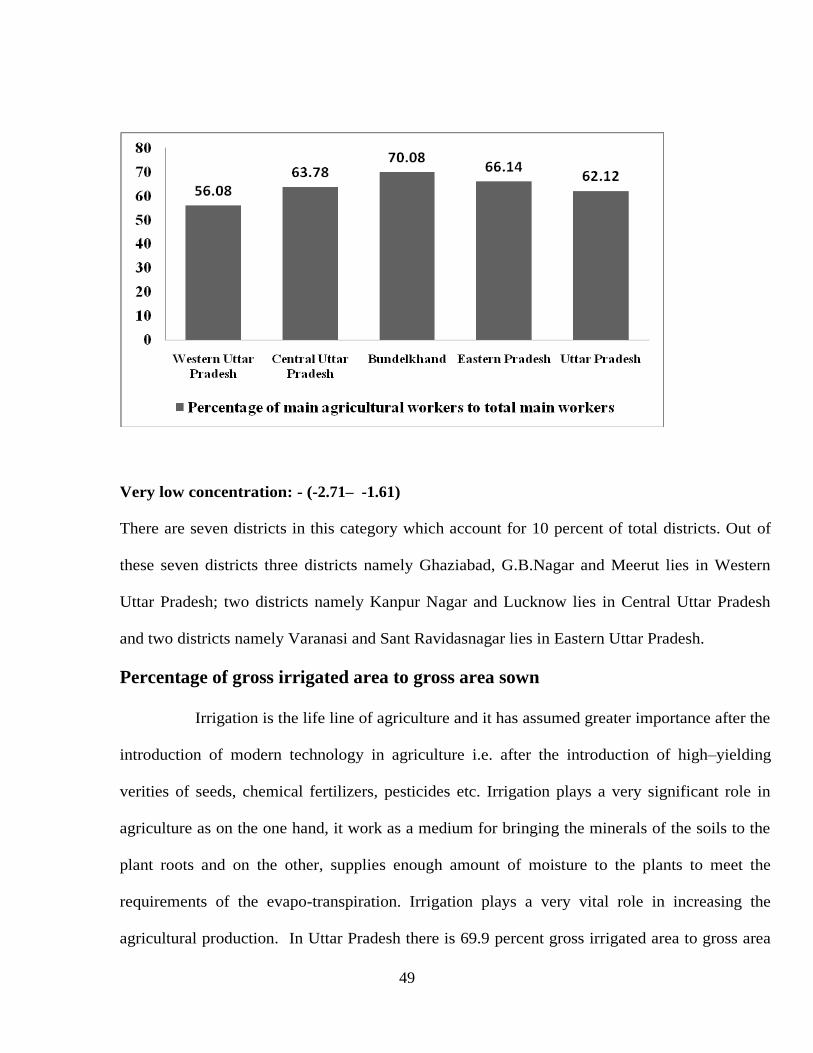
49
Very low concentration: - (-2.71– -1.61)
There are seven districts in this category which account for 10 percent of total districts. Out of
these seven districts three districts namely Ghaziabad, G.B.Nagar and Meerut lies in Western
Uttar Pradesh; two districts namely Kanpur Nagar and Lucknow lies in Central Uttar Pradesh
and two districts namely Varanasi and Sant Ravidasnagar lies in Eastern Uttar Pradesh.
Percentage of gross irrigated area to gross area sown
Irrigation is the life line of agriculture and it has assumed greater importance after the
introduction of modern technology in agriculture i.e. after the introduction of high–yielding
verities of seeds, chemical fertilizers, pesticides etc. Irrigation plays a very significant role in
agriculture as on the one hand, it work as a medium for bringing the minerals of the soils to the
plant roots and on the other, supplies enough amount of moisture to the plants to meet the
requirements of the evapo-transpiration. Irrigation plays a very vital role in increasing the
agricultural production. In Uttar Pradesh there is 69.9 percent gross irrigated area to gross area

50
sown. The least gross irrigated area is in Bundelkhand (36.3%) region and Western Uttar
Pradesh (84.9%) has the largest gross irrigated area in State. At district level there is wide
variation in gross irrigated area to gross area sown in the study region. The distribution of gross
irrigated area has been shown in table 3.2 and Fig.3.2
Very High Concentration: (0.89-1.49)
There are thirteen districts in this category which accounts for 18.57 percent of the total
districts. Out of these thirteen districts, twelve districts namely Meerut, Bulandshahr, Baghpat,
G.B.Nagar, Ghaziabad, Muzaffarnagar, Pilibhit, Rampur, Bareilly, Shahjahanpur, Mainpuri and
Moradabad lies in Western Uttar Pradesh and district of Ambedkarnagar lies in Eastern Uttar
Pradesh.
High Concentration: (0.27-0.89)
There are twenty districts in this category, which account for 28.57 percent of the total
districts of the study region. In this category nine districts namely Saharanpur, J.P.Nagar, Aligarh,
Hathras, Mathura, Etah, Bijnor, Budaun and Auraiya lies in Western Uttar Pradesh; four districts
namely Unnao, Lucknow, Barabanki and Raebareli lies in Central Uttar Pradesh and seven districts
namely Pratapgarh, Faizabad, Jaunpur, Ghazipur, Chandauli, Varanasi and Sant Ravidasnagar lies in
Eastern Uttar Pradesh.
Medium Concentration: (-0.52-0.27)
There are seventeen districts in this category which accounts for 24.29 percent of the total
districts of the study region. Out of these seventeen districts, four districts namely Firozabad,
Farrukhabad, Kannauj and Etawah lies in Western Uttar Pradesh; six districts namely Kheri,
Sitapur, Hardoi, Kanpur Dehat, Kanpur Nagar and Fatehpur lies in Central Uttar Pradesh and

51
seven districts namely Allahabad, Sultanpur, Kushinagar, Azamgarh, Mau, Ballia and Mirzapur lies
in Eastern Uttar Pradesh.
Low Concentration: (-1.54- -0.52)
There are thirteen districts in this category, which accounts for 18.57 percent of the total
districts of the study region. Out of thirteen districts only Agra districts lies in Western Uttar
Pradesh; four districts namely Jalaun, Jhansi, Lalitpur and Mahoba lies in Bundelkhand region
and rest twelve districts namely Kaushambi, Gonda, Sidharthnagar, Basti, Sant Kabir Nagar,
Maharajganj, Gorakhpur and Deoria lies in Eastern Uttar Pradesh.
Table 3.2
Very Low Concentration: (-2.22- -1.54)
Percentage of gross irrigated area to gross area sown
Category Index Name of the District No. of
Districts
Very High 0.89-1.49 Meerut, Bulandshahr, Baghpat, G.B.Nagar,
Ghaziabad, Muzaffarnagar, Pilibhit,
Ambedkarnagar, Rampur, Bareilly, Shahjahanpur,
Mainpuri, Moradabad
13
High 0.27-0.89 Saharanpur, J.P.Nagar, Aligarh, Hathras, Mathura,
Etah, Budaun, Auraiya, Unnao, Lucknow,
Raebareli, Bijnor, Barabanki, Pratapgarh, Faizabad,
Jaunpur, Ghazipur, Chandauli, Varanasi, Sant
Ravidasnagar
20
Medium -0.52-0.27 Firozabad, Farrukhabad, Kannauj, Etawah, Kheri,
Sitapur, Hardoi, Kanpur Dehat, Kanpur Nagar,
Fatehpur, Allahabad, Sultanpur, Kushinagar,
Azamgarh, Mau, Ballia, Mirzapur,
17
Low -1.54- -0.52 Agra, Jalaun, Jhansi, Lalitpur, Mahoba,
Kaushambi, Gonda, Sidharthnagar, Basti, Sant
Kabir Nagar, Maharajganj, Gorakhpur, Deoria,
13
Very Low -2.22- -1.54 Hamirpur, Banda, Chitrakoot, Bahraich,
Sharawasti, Balrampur, Sonbhadra
07
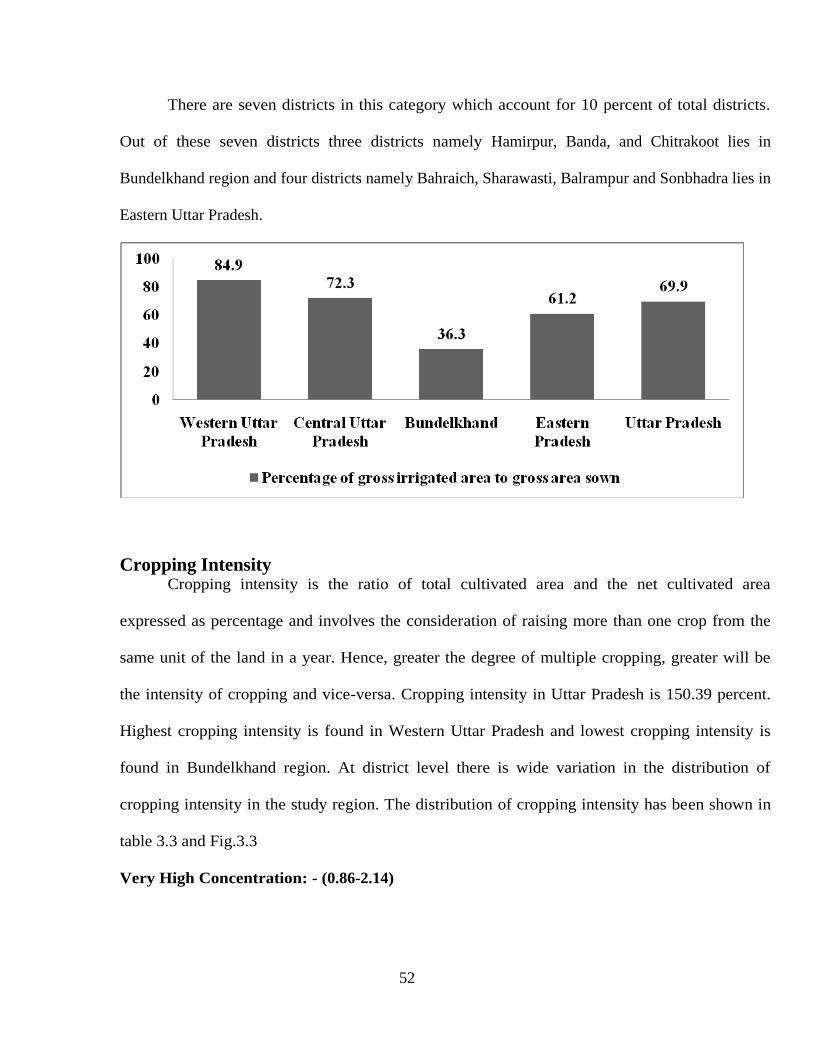
52
There are seven districts in this category which account for 10 percent of total districts.
Out of these seven districts three districts namely Hamirpur, Banda, and Chitrakoot lies in
Bundelkhand region and four districts namely Bahraich, Sharawasti, Balrampur and Sonbhadra lies in
Eastern Uttar Pradesh.
Cropping Intensity Cropping intensity is the ratio of total cultivated area and the net cultivated area
expressed as percentage and involves the consideration of raising more than one crop from the
same unit of the land in a year. Hence, greater the degree of multiple cropping, greater will be
the intensity of cropping and vice-versa. Cropping intensity in Uttar Pradesh is 150.39 percent.
Highest cropping intensity is found in Western Uttar Pradesh and lowest cropping intensity is
found in Bundelkhand region. At district level there is wide variation in the distribution of
cropping intensity in the study region. The distribution of cropping intensity has been shown in
table 3.3 and Fig.3.3
Very High Concentration: - (0.86-2.14)

53
There are twelve districts in this category which account for 17.14 percent of the total
districts. All the twelve districts namely Muzaffarnagar, Moradabad, Rampur, Meerut, Barielly,
Shahjahanpur, Baghpat, Ghaziabad, G.B.Nagar, Bulandshar, Mainpuri and Pilibhit in this category
lies in Western Uttar Pradesh.
High Concentration: - (0.26-0.86)
There are twenty one districts in this category which accounts for 30 percent of the total
district. Out of twenty one districts, nine districts namely Saharanpur, Bijnor, J.P.Nagar, Aligarh,
Hathras, Mathura, Etah, Budaun and Auraiya lies in Western Uttar Pradesh; three districts namely
Lucknow, Unnao and Raebareli lies in Central Uttar Pradesh and nine districts namely
Ambedkarnagar, Faizabad, Jaunpur, Ghazipur, Varanasi, Chandauli, Barabanki, Pratapgarh and Sant
Ravidasnagar lies in Eastern Uttar Pradesh.
Medium Concentration: - (-0.39-0.26)
There are seventeen districts in this category which account for 24.29 percent of the total
districts. Out of these districts four districts namely Firozabad, Farrukhabad, Kannauj and
Etawah lies in Western Uttar Pradesh; six districts namely Kheri, Sitapur, Fatehpur, Hardoi,
Kanpur Nagar and Kanpur Dehat lies in Central Uttar Pradesh and seven districts namely Ballia,
Mau, Kushinagar, Sultanpur, Mirzapur, Allahabad and Azamgarh lies in Eastern Uttar Pradesh.
Table 3.3
Cropping intensity
Category Index Name of the District No. of
Districts
Very High 0.86-2.14 Muzaffarnagar, Moradabad, Rampur, Meerut,
Barielly, Shahjahanpur, Baghpat, Ghaziabad,
G.B.Nagar, Bulandshar, Mainpuri, Pilibhit
12
High 0.26-0.86 Saharanpur, Bijnor, J.P.Nagar, Aligarh, Hathras,
Mathura, Etah, Budaun, Auraiya, Lucknow, Unnao,
21

54
Ambedkarnagar, Faizabad, Raebareli, Jaunpur,
Ghazipur, Varanasi, Chandauli, Barabanki,
Pratapgarh, Sant Ravidasnagar,
Medium -0.39-0.26 Ballia, Mau, Kushinagar, Firozabad, Farrukhabad,
Kannauj, Etawah, Sultanpur, Mirzapur, Allahabad,
Fatehpur, Azamgarh, Kheri, Sitapur, Hardoi, Kanpur
Dehat, Kanpur Nagar
17
Low -1.56- -0.39 Gorakhpur, Agra, Jalaun, Jhansi, Lalitpur, Deoria,
Maharajganj, Sant Kabirnagar, Mahoba, Kaushambi,
Gonda, Sidharthnagar, Basti
13
Very Low -2.61- -1.56 Hamirpur, Banda, Chitrakoot, Bahraich, Sharawasti,
Balrampur, Sonbhadra
07
Low Concentration: - (-1.56- -0.39)
There are thirteen districts in this category which account for 18.57 percent of the total
districts. Agra is the only district in this category which lie in Western Uttar Pradesh Jalaun,
Jhansi, Lalitpur and Mahoba lies in Bundelkhand region and Gorakhpur, Deoria, Maharajganj,
Sant Kabirnagar, Kaushambi, Gonda, Sidharthnagar and Basti lies in Eastern Uttar Pradesh.
Very Low Concentration: - (-2.61- -1.56)
55
There are seven districts in this category which account for 10 percent of the total
districts. Out of these seven districts Hamirpur, Banda and Chitrakoot lies in Bundelkhand
region and four districts namely Bahraich, Sharawasti, Balrampur, and Sonbhadra lies in Eastern
Uttar Pradesh.
Fertilizer
Next to water, fertilizers constitute the second vital bio-chemical input contributing
to the agricultural productivity. The increase in the consumption of fertilizers stimulates the
productivity, leading to agricultural development. The distribution of fertilizer per hectare
of gross area in Uttar Pradesh is 117.05 Kg. The distribution of fertilizer has been shown in
table 3.4 and Fig.3.4
Very High Concentration:- (1.03-2.88)
There are ten districts in this category which accounts for 14.29 percent of the total
districts. Out of ten districts six districts namely Muzaffarnagar, J.P.Nagar, Meerut, Ghaziabad,
Pilibhit and Farrukhabad lies in Western Uttar Pradesh and four districts namely Faizabad, Basti,
Deoria and Varanasi Eastern Uttar Pradesh.
High Concentration:- (0.18-1.03)
There are twenty districts in this category which account for 28.57 percent of the
total districts. Out of these districts, ten districts namely Saharanpur, Baghpat, Bijnor, Moradabad,
Shahjahanpur, Bulandshahr, Firozabad, Mainpuri, Barielly and Kannauj lies in Western Uttar
Pradesh; three districts namely Lucknow, Barabanki and Kannpur Nagar lies in Central Uttar Pradesh
and seven districts namely Allhahabad, Kaushambi, Ambedkarnagar, Gorakhpur, Kushinagar,
Chandauli and Sant Ravidasnagar lies in Eastern Uttar Pradesh.
Medium Concentration;(-0.31-0.18)

56
There are twelve districts in this category which account for 17.14 percent of the total
districts. Out of these twelve districts four districts namely Rampur, Hathras, Agra and Budaun
lies in Western Uttar Pradesh; four districts namely Kheri, Sitapur, Fatehpur and Kanpur Dehat lies in
Central Uttar Pradesh and four districts namely Mau, Jaunpur, Ghazipur and Maharajganj lies in
Eastern Uttar Pradesh.
Low Concentration:- (-1.29- -0.31)
There are seventeen districts in this category which account for 24.29 percent of the total
districts. Out of these districts six districts namely G.B.Nagar, Aligarh, Mathura, Auraiya, Etah
and Etawah lies in Western Uttar Pradesh; three districts namely Hardoi, Raebareli and Unnao lies in
Central Uttar Pradesh and eight districts namely Ballia, Azamgarh, Sant Kabirnagar, Pratapgarh,
Sultanpur, Bahraich, Sidharthnagar and Gonda lies in Eastern Uttar Pradesh.
Table 3.4
Distribution of total fertilizer per hectare of gross area sown
Category Index Name of the District No. of
Districts
Very High 1.03-2.88 Muzaffarnagar, J.P.Nagar, Meerut, Ghaziabad,
Pilibhit, Farrukhabad, Faizabad, Basti, Deoria,
Varanasi
10
High 0.18-1.03 Saharanpur, Baghpat, Bijnor, Moradabad,
Shahjahanpur, Bulandshahr, Firozabad, Mainpuri,
Barielly, Kannauj, Lucknow, Allhahabad,
Kaushambi, Barabanki, Kanpur Nagar,
Ambedkarnagar, Gorakhpur, Kushinagar,
Chandauli, Sant Ravidasnagar,
20
Medium -0.31-0.18 Rampur, Hathras, Agra, Budaun, Kheri, Sitapur,
Fatehpur, Kanpur Dehat, Mau, Jaunpur,
Ghazipur, Maharajganj
12
Low -1.29- -0.31 Hardoi, Ballia, G.B.Nagar, Aligarh, Mathura,
Etah, Etawah, Azamgarh, Raebareli, Unnao, Sant
Kabir Nagar, Auraiya, Pratapgarh, Sultanpur,
Bahraich, Sidharthnagar,Gonda
17
Very Low -1.95- -1.29 Jalaun, Jhansi, Lalitpur, Hamirpur, Mirzapur,
Sonbhadra, Mahoba, Banda, Chitrakoot,
Sharawasti, Balrampur
11

57
Very Low Concentration: - (-1.95- -1.29)
There are eleven districts in this category which account for 15.71 percent of the total
districts. Out of eleven districts, seven districts namely Jalaun, Jhansi, Lalitpur, Hamirpur,
Mahoba, Banda and Chitrakoot lies in Bundelkhand region and four districts namely Mirzapur,
Sonbhadra, , Sharawasti and Balrampur lies in Eastern Uttar Pradesh.
Composite Index
To find out the over all levels of agricultural development, the composite indices have
been worked out for each district by adding the index values of all the variables. The index value
is then divided into five grades of very high, high, medium, low and very low The Composite
Index has been given appendix B.
Levels of Agricultural Development
The levels of agricultural development has been depicted in Fig.3.5 and shown in table 3.6
Very High Development:- (2.10-3.71)
There are eleven districts which come under very high level of agricultural development.
These districts account for only 15.71 percent of total districts. Out of these eleven districts eight
districts namely Pilibhit, Rampur, Mainpuri, Muzaffarnagar, J.P. Nagar, Bulandshahr, Baghpat,
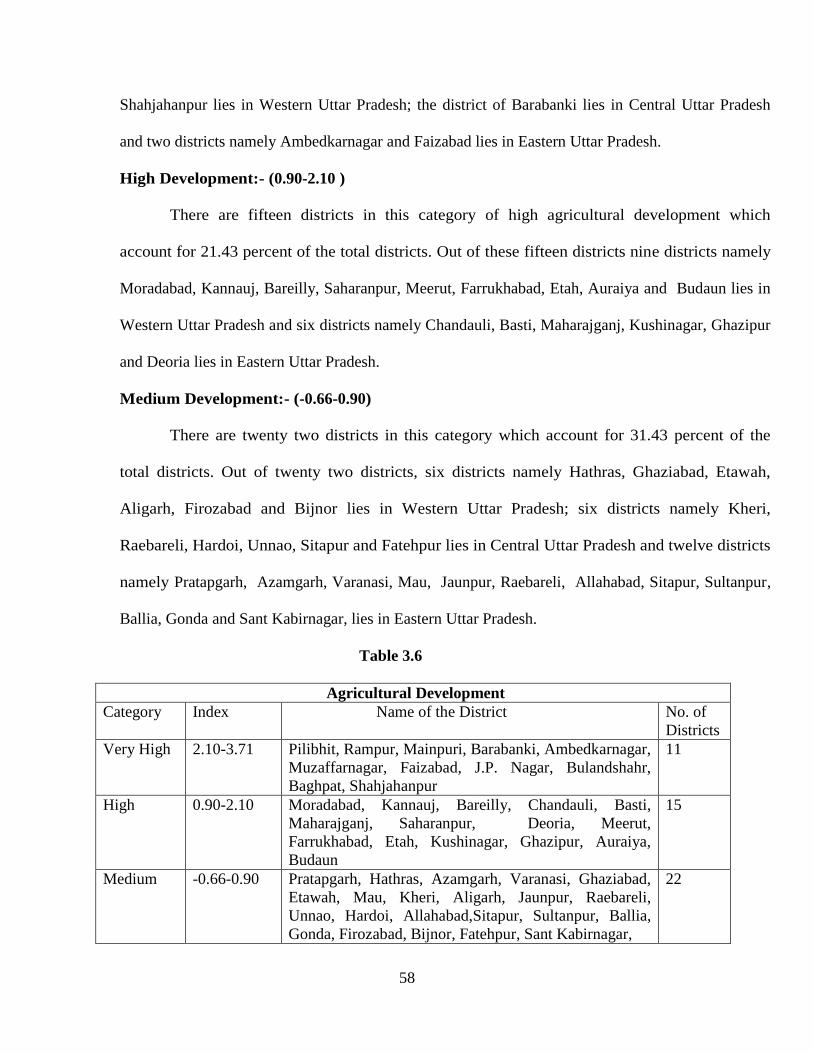
58
Shahjahanpur lies in Western Uttar Pradesh; the district of Barabanki lies in Central Uttar Pradesh
and two districts namely Ambedkarnagar and Faizabad lies in Eastern Uttar Pradesh.
High Development:- (0.90-2.10 )
There are fifteen districts in this category of high agricultural development which
account for 21.43 percent of the total districts. Out of these fifteen districts nine districts namely
Moradabad, Kannauj, Bareilly, Saharanpur, Meerut, Farrukhabad, Etah, Auraiya and Budaun lies in
Western Uttar Pradesh and six districts namely Chandauli, Basti, Maharajganj, Kushinagar, Ghazipur
and Deoria lies in Eastern Uttar Pradesh.
Medium Development:- (-0.66-0.90)
There are twenty two districts in this category which account for 31.43 percent of the
total districts. Out of twenty two districts, six districts namely Hathras, Ghaziabad, Etawah,
Aligarh, Firozabad and Bijnor lies in Western Uttar Pradesh; six districts namely Kheri,
Raebareli, Hardoi, Unnao, Sitapur and Fatehpur lies in Central Uttar Pradesh and twelve districts
namely Pratapgarh, Azamgarh, Varanasi, Mau, Jaunpur, Raebareli, Allahabad, Sitapur, Sultanpur,
Ballia, Gonda and Sant Kabirnagar, lies in Eastern Uttar Pradesh.
Table 3.6
Agricultural Development
Category Index Name of the District No. of
Districts
Very High 2.10-3.71 Pilibhit, Rampur, Mainpuri, Barabanki, Ambedkarnagar,
Muzaffarnagar, Faizabad, J.P. Nagar, Bulandshahr,
Baghpat, Shahjahanpur
11
High 0.90-2.10 Moradabad, Kannauj, Bareilly, Chandauli, Basti,
Maharajganj, Saharanpur, Deoria, Meerut,
Farrukhabad, Etah, Kushinagar, Ghazipur, Auraiya,
Budaun
15
Medium -0.66-0.90 Pratapgarh, Hathras, Azamgarh, Varanasi, Ghaziabad,
Etawah, Mau, Kheri, Aligarh, Jaunpur, Raebareli,
Unnao, Hardoi, Allahabad,Sitapur, Sultanpur, Ballia,
Gonda, Firozabad, Bijnor, Fatehpur, Sant Kabirnagar,
22

59
Low -4.30- -0.66 Mathura,Kanpur Dehat, Kaushambi, Lucknow,
Sidharthnagar, Gorakhpur, Sant Ravidasnagar,
Balrampur, Bahraich, Sharawasti, Kanpurnagar,
Mirzapur, Agra, Lalitpur, G.B.Nagar
15
Very Low -5.96- -4.30 Sonbhadra, Jhansi, Banda, Jalaun, Chitrakoot, Mahoba,
Hamirpur
07
Low Development:- (-4.30- -0.66)
There are fifteen districts in this category which accounts for 21.43 percent of the total
districts. Out of fifteen districts Mathura, G.B.Nagar and Agra lies in Western Uttar Pradesh;
Kanpur Dehat, Lucknow and Kanpur Nagar lies in Central Uttar Pradesh; Lalitpur lies in
Bundelkhand region and eight districts namely Kaushambi, Sidharthnagar, Gorakhpur, Sant
Ravidasnagar, Balrampur, Bahraich, Sharawasti and Mirzapur lies in Eastern Uttar Pradesh.
Very Low Development:- (-5.96- -4.30)
There are seven districts in this category which accounts for 10 percent of total districts.
Out of these ten districts six districts lies in Bundelkhand region and district of Sonbhadra lies in
Eastern Uttar Pradesh.

60
Reference s:
1- Acharya, S.S. and Agarwal, N.L. (1987), Agricultural Marketing in
India, Oxford and IBH Publishing Company, New Delhi.
2- Agarwal, R.R. and Mehrotra, C.L., (1952), Soil Survey and Soil Work in Uttar Pradesh,
Vol. I & II, Allahabad.
3- Ayyar, N.P. (1969), Crop Regions of Madhya Pradesh; A Study of Methodology,
Geographical Review of India, March, 1969.
4- Bapan, S.L. (1980), Aggregsate Suply Response of Crops, in a Developing Region,
S.chand and Sons, New Delhi.
5- Batra, M.M. (1978), Agricultural Production: Prices and
Technology, Allied Publishers, Delhi.
6- Banerji, H. (1974), Supply and Demand for Agricultural Production in India,
Progressive Publishers.
7- Chandresh, K. (1970), Farmers Response to Price Changes of
Sugarcane in U.P. 1951-52 to 1966-67, Economic and Political
Weekly, Vol. 5, No. 18.
8- Cumming, R.E., (1969), Pricing Efficiency in the Indian Wheat
Market, Impex India, New Delhi.
9- Director of Census Operastion, (1961, 1971, 1981, 1991) District Census Handbook of
Uttar Pradesh, Lucknow, U.P.
10- Directorate of Economics and Statistics, (1965-66 to1989-90), Farm Harvest Prices of
Principal Crops in India, Ministry of Agriculture, New Delhi.
11- Economics and Statistics Department (1965-66 to 1990-91),
Statistical Abstracts of Districts of Upper Ganga-Yamuna Doab,
Lucknow, U.P.
12- Found, W.C. (1971), A Theoretical Approach of Rural Land – Use
Patterns, Edward Arnold (Publishers) Ltd., London.
13- Gupta, A.P. (1975), Marketing of Agricultural Produce in India,
Vora & Co. Publishers, Bombay.
61
14- Indian Council of Agricultural Research (1972), Proceedings of the Symposium on
Cropping Patterns in India, New Delhi.
15- Iqbal, B.A. (1989), Indian Agriculture in the last 35 years, Yojna,
Vol. 53, No. 12.
16- Jain, S.C. (1971), Principles and Practices of Agricultural Marketing and Prices,
Vora & Co. Publishers, Bombay.
17- Jha, Dayanand and Maji, C.C., (1971), Cobweb Phenomenon and
Fluctuations in Sugarcane Acreage in North Bihar, Indian Journal of Agricultural
Economics, Vol. XXVI, No. 4.
18- Kohl, R.L. and Uhl, J.L., (1980), Marketing of Agricultural Products, MacMillan
Publishing Company Inc., New York.
19- Krishnan, M.S. (1982), Geology of Burma and India, Madras.
20- Pandit, S.N. (1983), Critical Study of Agricultural Productivity in
Uttar Pradesh, Concept Publication, New Delhi.
21- Rao, M.S. and Jai Krishna, (1965), Price Expectation and Acreage Response for Wheat in
Uttar Pradesh, Indian Journal of Agricultural Economics, Vol. XX, No. 1.
22- Shafi, M. (1984), Agricultural Productivity and Regional
Imbalances, Concept Publishing Company, New Delhi.
23- Singh, A.L. and Fazal, S. (1990), Impact of Price fluctuations on
Sugarcane Area in Saharanpur District, U.P., National Geographer, Vol. 25, No. 1.
24- Singh, A.L. and Fazal, S. (1992), Changes in Cropping Pattern Due to Variation in Prices
in Upper Ganga-Yamuna Doab, The Geographer Vol. XXXIX NO. 1
25- Singh J. and Dhillon, S.S. (1984), Agricultural Geography, Tata McGraw Hill Publishers,
New Delhi.
26- Stanislaus, S.J.M. (1985), Farmers Response to Price Changes in a Developing Economy,
Ashish Publishers, New Delhi.
27- Wadia, D.N. (1981), Geology of India, Tata McGraw-Hill Publishing Co., New Delhi.
***************************

62
Chapter 4
Industrial Development
The degree of industrialization attained by any economy is often considered as an
important indicator of development. Most of the infrastructural facilities such as power, banking
etc. expand along with the industrial development while their availability in any region causes
the concentration of industries.
Industrialization is vital to the development process in several ways. It is primarily,
through industrialization that traditional societies are transformed into modern ones. Rise in
standard of living is also associated with industrialization which allows more intensive use of
available resources. Industrialization is crucial to agricultural development by way of
mechanization of agriculture, creating a demand for agricultural raw materials and reducing
pressure on agricultural land resources through a gradual shift of population from agriculture to
industry. It has indeed a great employment generation capacity. Industrialization also brings in a
revolution in the social life of the people. It breeds new production processes, new socio-
economic structures and new mental attitudes. Industrialization is indispensable for the uplift of
developing societies.
Rondinelli (1979) holds that it is ironical that the industrial activities till recently have
remained, for obvious reasons, confined to urban areas and that too in large and selected cities. It
is not conducive to balanced economic growth and must be counteracted by establishing cottage
and small scale industries based on local resources at small and medium sized centres in rural
areas.

63
Roy (1977) holds that Indian villages are predominantly agricultural. In most of them,
however, agricultural is supporting and supported by industry. There are artisans and craftsmen,
household and cottage industries and sometimes small and medium size industries. They take the
inputs from other sectors such as agriculture, forestry, mining and fisheries, etc. and in turn, sell
the processed and semi-processed outputs to the local and other communities.
Keeping in view the limitations of resources and organization in the area, small scale
industries, based on available raw materials, are encouraged in the region. At present, there are
6470 small scale units which are widely distributed in different parts of the area. Small scale
industries play a vital role for the development of the people of Central Uttar Pradesh
particularly. Thus researcher has selected four variables to measure the levels of industrial
development in study area.
Variable Definition
X13 No. of scheduled commercial banks per lakh of population
X14 No. of small scale industries per lakh of population
X15 No. of employees in registered factories per lakh of population
X16 No. of working factories per lakh of population
No. of scheduled Commercial Banks per lakh of population
There are 4.9 scheduled commercial banks per lakh of population in Uttar Pradesh, the
study area. But at the district level, there is a high degree of variation in the number of scheduled
commercial banks per lakh of population. District of Lucknow has the highest (8.1) and
Kushinagaar (3.3) schedule commercial banks per lakh of population. The distribution schedule
commercial bank in the region is given in table 4.1 and Fig.4.1

64
Very High Concentration:- (0.80-3.35)
There are eleven districts in this category which account for 15.71 percent of the total
districts. Out of eleven five districts namely Meerut, Ghaziabad, G.B.Nagar, Mathura and Agra
lies in Western Uttar Pradesh; three districts namely Kanpur Nagar, Kanpur Dehat and Lucknow
lies in Central Uttar Pradesh; two districts namely Jalaun and Jhansi lies in Bundelkhand region
and one district of Varanasi lies in Eastern Uttar Pradesh.
High Concentration:- (0.09-0.80)
There are thirteen districts in this category which account for 18.57 percent of the total
districts. Out of these thirteen districts, seven districts namely Saharanpur, Muzaffarnagar,
Moradabad, Rampur, Aligarh, Hathras and Bareilly lies in Western Uttar Pradesh; districts of
Barabanki lies in Central Uttar Pradesh; there districts namely Hamirpur, Banda and Chitrakoot
lies in Bundelkhand region and districts of Ballia and Allahabad lies in Eastern Uttar Pradesh.
Table 4.1
No. of scheduled commercial banks per lakh of population
Category Index Name of the District No. of
Districts
Very High 0.80-3.35 Meerut, Ghaziabad, G.B.Nagar, Jalaun, Jhansi,
Mathura, Agra, Lucknow, Kanpur Dehat, Kanpur
Nagar, Varanasi,
11
High 0.09-0.80 Saharanpur, Muzaffarnagar, Moradabad, Rampur,
Allahabad, Aligarh, Hathras, Barielly, Barabanki,
Hamirpur, Banda, Chitrakoot, Ballia,
13
Medium -0.52-0.09 Bulandshahr, Mainpuri, Pilibhit, Shahjahanpur,
Mahoba, Pratapgarh, Farrukhabad, Etawah, Sitapur,,
Raebareli, Fatehpur, Lalitpur, Sultanpur, Sharawasti,
Gorakhpur, Azamgarh, Jaunpur, Ghazipur, Mirzapur,
Sonbhadra
20
Low -1.03- -0.52 Bijnor, J.P.Nagar, Baghpat, Firozabad, Etah, Budaun,
Kannauj, Auraiya, Kheri, Unnao, Faizabad, Bahraich,
Balrampur, Gonda, Sidharthnagar, Basti, Deoria, Mau,
Sant Ravidasnagar
19
Very Low -1.50- -1.03 Hardoi, Kushambi, Ambedkarnagar, Sant Kabirnagar.
Maharajganj, Kushinagar, Chandauli
07

65
Medium Concentration:- (-0.52-0.09)
There are twenty districts in this category which account for 28.57 percent of the total
districts. Out of these twenty districts six districts namely Bulandshahr, Mainpuri, Pilibhit,
Shahjahanpur, Farrukhabad and Etawah lies in Western Uttar Pradesh; three districts namely
Sitapur, Raebareli and Fatehpur lies Central Uttar Pradesh; two districts namely Mahoba and
Lalitpur lies in Bundelkhand region and Pratapgarh, Sultanpur, Sharawasti, Gorakhpur,
Azamgarh, Jaunpur, Ghazipur, Mirzapur and Sonbhadra lies in Eastern Uttar Pradesh.
Low Concentration: ( -1.03- -0.52 )
There are nineteen districts in this category which account for 27.14 percent of
the total districts. Out of nineteen districts eight districts namely Bijnor, J.P.Nagar,
Baghpat, Firozabad, Etah, Budaun, Kannauj and Auraiya lies in Western Uttar Pradesh;
two districts namely Kheri and Unnao lies in Central Uttar Pradesh and nine districts

66
namely Faizabad, Bahraich, Balrampur, Gonda, Sidharthnagar, Basti, Deoria, Mau and
Sant Ravidasnagar lies in Eastern Uttar Pradesh.
Very Low Concentration:- (-1.50- -1.03)
There are seven districts in this category which account for 10 percent of total
districts. Out of ten districts Hardoi is the only district which lie in Central Uttar Pradesh and
rest six districts namely Kushambi, Ambedkarnagar, Sant Kabirnagar. Maharajganj, Kushinagar and
Chandauli lies in Eastern Uttar Pradesh.
No. of Small Scale Industries per lakh of population
In Uttar Pradesh there are 1.47 small scale industries per lakh of population. But at the
district level, there is a high degree of variation in the number of small scale industries per lakh
of population. District of Meerut (46.4) has highest and district of Balrampur (3.29) has the
lowest number of small scale industries per lakh of population. The distribution of small scale
industrial workers per lakh of population has been given in table 4.2 and Fig.4.2
Very High Concentration:- (1.26-3.33)
There are nine districts in this category which account for 12.86 percent of the total
districts. Out of nine districts six districts namely Muzaffarnagar, Meerut, Baghpat, Ghaziabad,
G.B.Nagar Pilihit and Bulandshahr lies in Western Uttar Pradesh and two districts namely Jhansi
and Lalitpur lies in Bundelkhand region.
High Concentration:- (0.29-1.26)
There are eighteen districts in this category which accounts for 25.71 percent of the
total districts. Out of these eighteen districts, nine districts namely Saharanpur, Moradabad,
Rampur, Mathura, Agra, Firozabad, Farrukhabad, Shahjahanpur, and Bareilly lies in Western
Uttar Pradesh; three districts namely Unnao, Lucknow and Fatehpur lies in Central Uttar

67
Pradesh; four districts namely Hamirpur, Banda, Mahoba and Jalaun lies in Bundelkhand
region and districts of Faizabad and Sonbhadra lies in Eastern Uttar Pradesh.
Medium Concentration:- (-0.41-0.29)
There are fifteen districts in this category which account for 21.43 percent of the total
districts. Out of these five districts namely Bijnor, Aligarh, Mainpuri, Kannauj, Auraiya lies in
Western Uttar Pradesh; four districts namely Kanpur Dehat, Kanpur Nagar, Raebareli and
Barabanki lies in Central Uttar Pradesh; Chitrakoot is the only district which lie in Bundelkhand
region and six districts namely Chandauli, Ghazipur, Varanasi, Bahraich, Ballia and Mau lies in
Eastern Uttar Pradesh.
Table 4.2
No. of small scale industries per lakh of population
Category Index Name of the District No. of
Districts
Very High 1.26-3.33 Muzaffarnagar, Meerut, Baghpat, Ghaziabad,
G.B.Nagar, Pilihit, Jhansi, Bulandshahr, Lalitpur
09
High 0.29-1.26 Mahoba, Faizabad, Saharanpur, Moradabad,
Rampur, Mathura, Agra, Unnao, Lucknow, Banda,
Hamirpur, Sonbhadra, Firozabad, Bareilly,
Farrukhabad, Fatehpur, Jalaun, Shahjahanpur,
18
Medium -0.41-0.29 Chandauli, J.P.Nagar,Hathras, Budaun, Etawah,
Ghazipur, Varanasi, Raebareli, Kanpur Dehat,
Kanpur Nagar, Barabanki, Chitrakoot, Bahraich,
Ballia, Mau
15
Low -1.15- -0.41 Gorakhpur, Deoria, Bijnor, Aligarh, Mainpuri,
Kannauj, Auraiya, Basti, Jaunpur, Ambedkarnagar,
Maharajganj, Kheri, Sitapur, Hardoi, Kaushambi,
Allahabad, Gonda, Sant Ravidas nagar, Mirzapur
19
Very Low -1.65- -1.15 Etah, Sultanpur, Sharawasti, Balrampur,
Kushinagar, Sidharthnagar, Sant Kabirnagar,
Azamgarh, Pratapgarh
09
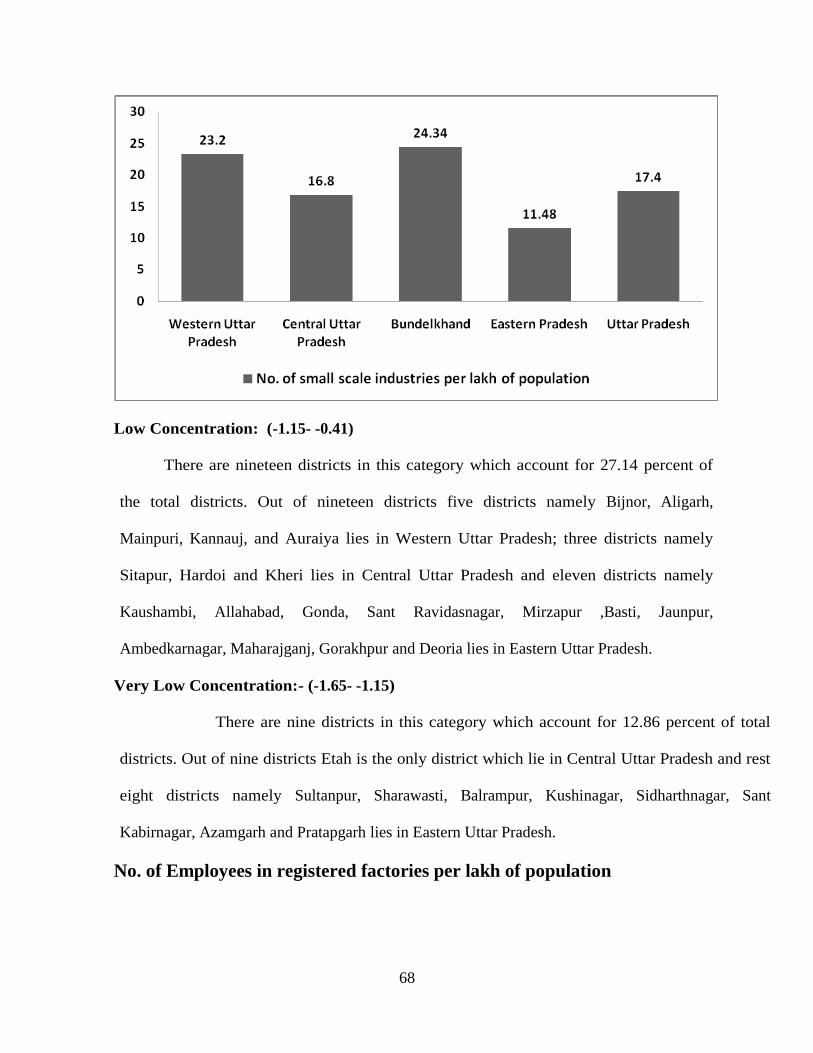
68
Low Concentration: (-1.15- -0.41)
There are nineteen districts in this category which account for 27.14 percent of
the total districts. Out of nineteen districts five districts namely Bijnor, Aligarh,
Mainpuri, Kannauj, and Auraiya lies in Western Uttar Pradesh; three districts namely
Sitapur, Hardoi and Kheri lies in Central Uttar Pradesh and eleven districts namely
Kaushambi, Allahabad, Gonda, Sant Ravidasnagar, Mirzapur ,Basti, Jaunpur,
Ambedkarnagar, Maharajganj, Gorakhpur and Deoria lies in Eastern Uttar Pradesh.
Very Low Concentration:- (-1.65- -1.15)
There are nine districts in this category which account for 12.86 percent of total
districts. Out of nine districts Etah is the only district which lie in Central Uttar Pradesh and rest
eight districts namely Sultanpur, Sharawasti, Balrampur, Kushinagar, Sidharthnagar, Sant
Kabirnagar, Azamgarh and Pratapgarh lies in Eastern Uttar Pradesh.
No. of Employees in registered factories per lakh of population
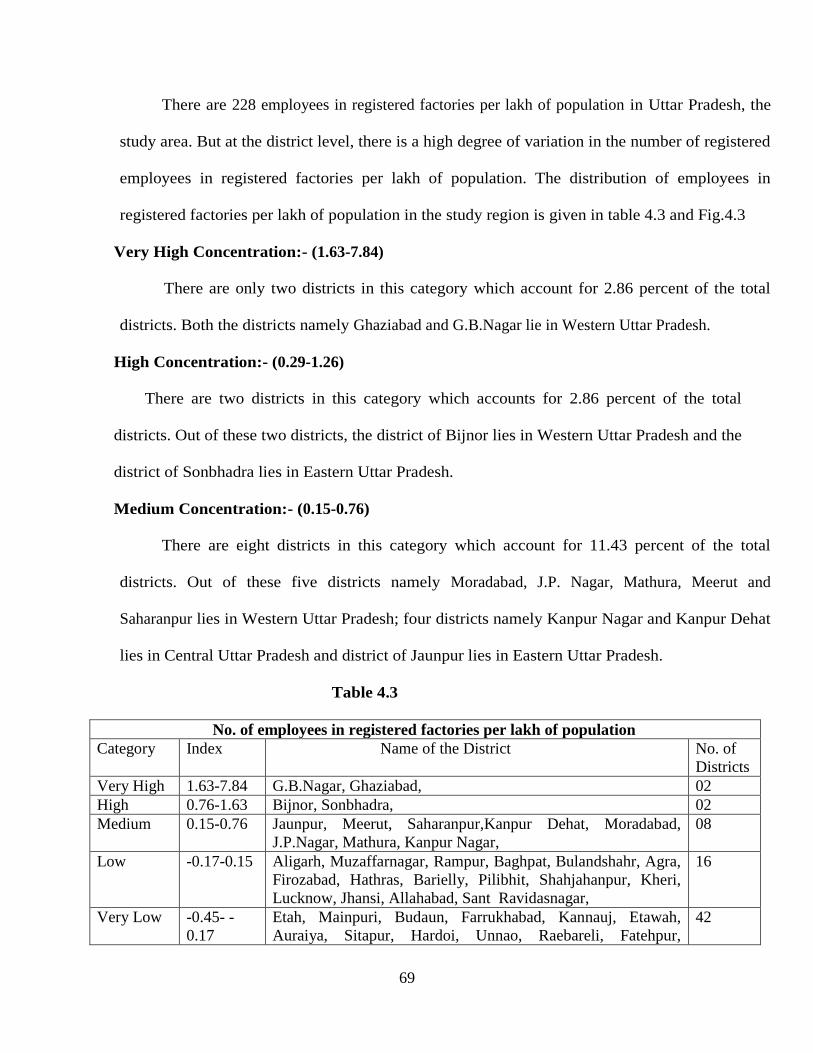
69
There are 228 employees in registered factories per lakh of population in Uttar Pradesh, the
study area. But at the district level, there is a high degree of variation in the number of registered
employees in registered factories per lakh of population. The distribution of employees in
registered factories per lakh of population in the study region is given in table 4.3 and Fig.4.3
Very High Concentration:- (1.63-7.84)
There are only two districts in this category which account for 2.86 percent of the total
districts. Both the districts namely Ghaziabad and G.B.Nagar lie in Western Uttar Pradesh.
High Concentration:- (0.29-1.26)
There are two districts in this category which accounts for 2.86 percent of the total
districts. Out of these two districts, the district of Bijnor lies in Western Uttar Pradesh and the
district of Sonbhadra lies in Eastern Uttar Pradesh.
Medium Concentration:- (0.15-0.76)
There are eight districts in this category which account for 11.43 percent of the total
districts. Out of these five districts namely Moradabad, J.P. Nagar, Mathura, Meerut and
Saharanpur lies in Western Uttar Pradesh; four districts namely Kanpur Nagar and Kanpur Dehat
lies in Central Uttar Pradesh and district of Jaunpur lies in Eastern Uttar Pradesh.
Table 4.3
No. of employees in registered factories per lakh of population
Category Index Name of the District No. of
Districts
Very High 1.63-7.84 G.B.Nagar, Ghaziabad, 02
High 0.76-1.63 Bijnor, Sonbhadra, 02
Medium 0.15-0.76 Jaunpur, Meerut, Saharanpur,Kanpur Dehat, Moradabad,
J.P.Nagar, Mathura, Kanpur Nagar,
08
Low -0.17-0.15 Aligarh, Muzaffarnagar, Rampur, Baghpat, Bulandshahr, Agra,
Firozabad, Hathras, Barielly, Pilibhit, Shahjahanpur, Kheri,
Lucknow, Jhansi, Allahabad, Sant Ravidasnagar,
16
Very Low -0.45- -
0.17
Etah, Mainpuri, Budaun, Farrukhabad, Kannauj, Etawah,
Auraiya, Sitapur, Hardoi, Unnao, Raebareli, Fatehpur,
42

70
Barabanki, Jalaun, Lalitpur, Hamirpur, Mahoba, Banda,
Chitrakoot, Pratapgarh, Kaushambi, Faizabad, Ambedkarnagar,
Sultanpur, Bahraich, Sharawasti, Balrampur, Gonda,
Sidharthnagar, Basti, Sant Kabirnagar, Maharajganj,
Gorakhpur, Kushinagar, Deoria, Azamgarh, Mau, Ballia,
Ghazipur, Chandauli, Varanasi, Mirzapur
Low Concentration:- (-0.17-0.15)
There are sixteen districts in this category which account for 22.86 percent of the total
districts. Out of these sixteen districts eleven districts namely Aligarh, Muzaffarnagar, Rampur,
Baghpat, Bulandshahr, Agra, Firozabad, Hathras, Barielly, Pilibhit and Shahjahanpur lies in Western
Uttar Pradesh; Kheri and Lucknow lies in Central Uttar Pradesh; the district of Jhansi lies in
Bundelkhand region and two districts namely Allahabad and Sant Ravidasnagar lies in Eastern
Uttar Pradesh.
Very Low Concentration:- (-0.45- -0.17)
71
There are forty two districts in this category which account for 60 percent of the total
districts. Out of these forty two districts seven districts namely Etah, Mainpuri, Budaun,
Farrukhabad, Kannauj, Etawah and Auraiya lies in Western Uttar Pradesh; six districts namely
Sitapur, Hardoi, Unnao, Raebareli, Fatehpur and Barabanki lies in Central Uttar Pradesh; six districts
namely Jalaun, Lalitpur, Hamirpur, Mahoba, Banda and Chitrakoot lies in Bundelkhand region and
the rest twenty three districts namely Pratapgarh, Kaushambi, Faizabad, Ambedkarnagar, Sultanpur,
Bahraich, Sharawasti, Balrampur, Gonda, Sidharthnagar, Basti, Sant Kabirnagar, Maharajganj,
Gorakhpur, Kushinagar, Deoria, Azamgarh, Mau, Ballia, Ghazipur, Chandauli, Varanasi and
Mirzapur lies in Eastern Uttar Pradesh.
No. of working factories per lakh of population
There are 6.7 working factories per lakh of population in Uttar Pradesh, the study area. But
at the district level, there is a high degree of variation in the number of working factories per
lakh of population. The distribution of working factories per lakh of population in the study
region is given in table 4.4 and Fig.4.4
Very High Concentration:- (1.66-8.15)
There is only one district in this category which account for 1.43 percent of the total
districts. The district of G.B.Nagar is lying in Western Uttar Pradesh.
High Concentration:- (0.48-1.66)
There are two districts in this category which accounts for 2.86 percent of the total
districts. Out of these two districts, the district of Ghaziabad lies in Western Uttar Pradesh
and Kanpur Nagar lies in Central Uttar Pradesh.
Medium Concentration:- (0.09-0.48)

72
There are six districts in this category which account for 8.58 percent of the total districts.
Out of these six districts five districts namely Muzaffarnagar, Moradabad, Meerut, Agra and
Firozabad lies in Western Uttar Pradesh and district of Lucknow lies in Central Uttar Pradesh.
Low Concentration:- (-0.16-0.09)
There are twenty districts in this category which account for 28.57 percent of the total
districts. Out of these sixteen districts thirteen districts namely Saharanpur, Bijnor, Rampur,
J.P.Nagar, Barielly, Pilibhit, Bulandshahr, Aligarh, Hathras, Mathura, Shahjahanpur, Kannauj and
Etawah lies in Western Uttar Pradesh; Kheri, Unnao and Kanpur Dehat lies in Central Uttar
Pradesh; the district of Jhansi lies in Bundelkhand region and three districts namely Chandauli,
Varanasi and Mirzapur, lies in Eastern Uttar Pradesh.
Table 4.4
No. of working factories per lakh of population
Category Index Name of the District No. of
Districts
Very High 1.66-8.15 G.B.Nagar, 01
High 0.48-1.66 Ghaziabad, Kanpur Nagar, 02
Medium 0.09-0.48 Muzaffarnagar, Moradabad, Meerut, Agra, Firozabad,
Lucknow
06
Low -0.16-0.09 Saharanpur, Bijnor, Rampur, J.P.Nagar, Barielly, Pilibhit,
Bulandshahr, Aligarh, Hathras, Mathura, Shahjahanpur,
Kannauj, Etawah, Kheri, Unnao, Kanpur Dehat, Jhansi,
Chandauli, Varanasi, Mirzapur,
20
Very Low -0.35- -
0.16
Baghpat, Etah, Mainpuri, Barabanki, Jalaun, Sitapur,
Hardoi, Buduan, Farrukhabad, Auraiya, Raebareli,
Fatehpur,Lalitpur, Hamirpur, Mahoba, Banda, Chitrakoot,
Pratapgarh, Kuashambi, Allahabad, Faizabad,
Ambedkarnagar, Sultanpur, Bahraich, Sharawasiti,
Balrampur, Gonda, Sidharthnagar, Maharajganj,
Gorakhpur, Kushinagar, Deoria, Azamgarh, Mau, Ballia,
Jaunpur, Ghazipur, Sant Ravidasnagar, Sonbhadra, Basti,
Sant Kabirnagar,
41
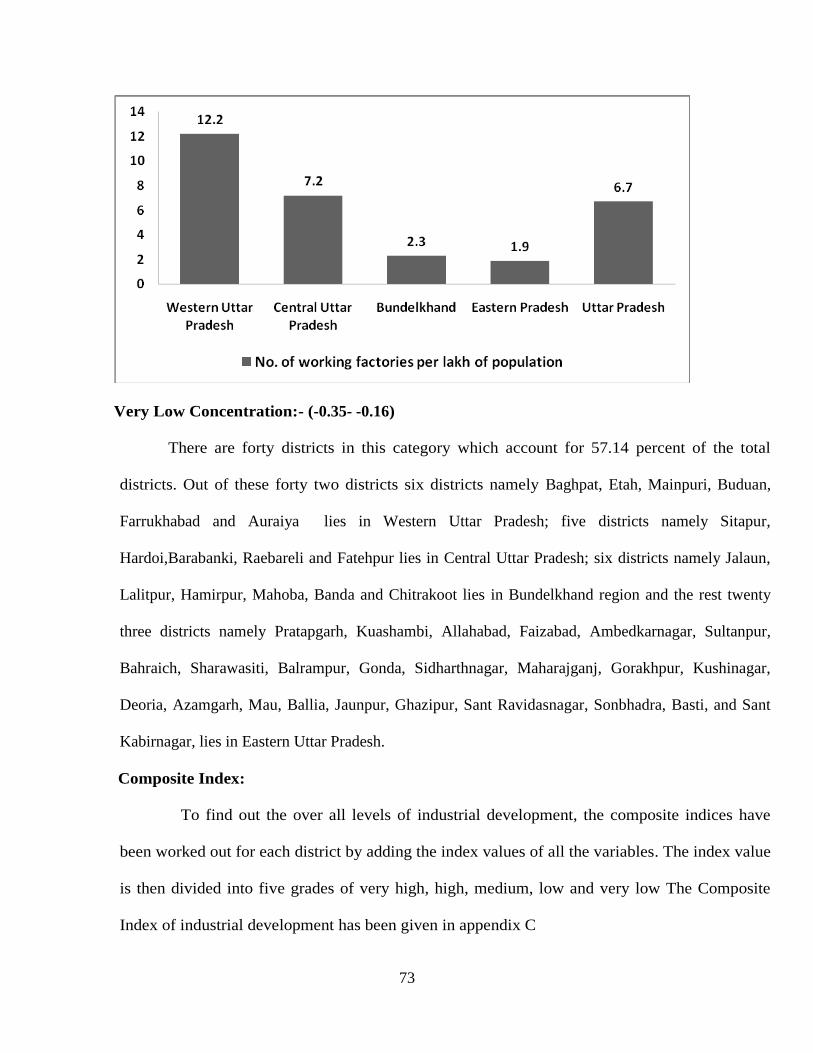
73
Very Low Concentration:- (-0.35- -0.16)
There are forty districts in this category which account for 57.14 percent of the total
districts. Out of these forty two districts six districts namely Baghpat, Etah, Mainpuri, Buduan,
Farrukhabad and Auraiya lies in Western Uttar Pradesh; five districts namely Sitapur,
Hardoi,Barabanki, Raebareli and Fatehpur lies in Central Uttar Pradesh; six districts namely Jalaun,
Lalitpur, Hamirpur, Mahoba, Banda and Chitrakoot lies in Bundelkhand region and the rest twenty
three districts namely Pratapgarh, Kuashambi, Allahabad, Faizabad, Ambedkarnagar, Sultanpur,
Bahraich, Sharawasiti, Balrampur, Gonda, Sidharthnagar, Maharajganj, Gorakhpur, Kushinagar,
Deoria, Azamgarh, Mau, Ballia, Jaunpur, Ghazipur, Sant Ravidasnagar, Sonbhadra, Basti, and Sant
Kabirnagar, lies in Eastern Uttar Pradesh.
Composite Index:
To find out the over all levels of industrial development, the composite indices have
been worked out for each district by adding the index values of all the variables. The index value
is then divided into five grades of very high, high, medium, low and very low The Composite
Index of industrial development has been given in appendix C

74
Levels of Industrial Development
The levels of industrial development of Uttar Pradesh has been shown in table 4.5 and
Fig.4.5
Very High Concentration :-( 7.70-19.84)
Out of seventy districts there are two districts in this category which accounts for
2.86 percent of the total districts. Ghaziabad and G.B.Nagar are two districts in this
category which lies in Western Uttar Pradesh.
High Concentration:- (3.29-7.70)
There are four districts in this category which account for 5.71 percent of the total districts.
Out of these four districts, one districts namely Meerut lies in Western Uttar Pradesh and three
districts namely Kanpur Nagar, Lucknow and Kanpur Dehat lies in Central Uttar Pradesh
Medium Concentration:- (0.31-3.29)
There are sixteen districts in this category which account for 22.86 percent of the total
districts. Out of these sixteen districts ten districts namely Muzaffarnaagr, Agra, Mathura,
Bulandshahr, Saharanpur, Pilibhit, Rampur, Moradabad, Bareilly and Shahjahanpur lies in
Western Uttar Pradesh; four districts namely Jhansi, Jalaun, Lalitpur and Hamirpur lies in
Central Uttar Pradesh and district of Varanasi and Sonbhadra lies in Eastern Uttar Pradesh.
Low Concentration:- (-1.45-0.31)
There are twenty five districts in this category which account for 35.71 percent of the
total districts. Out of these, nine districts namely Etawah, Baghpat, Firozabad, Hathras,
Farrukhabad, Bijnor, J.P.Nagar. Aligarh and Budaun lies in Western Uttar Pradesh; four districts
namely Raebareli, Fatehpur, Unnao and Barabanki lies in Central Uttar Pradesh; three districts

75
namely Banda, Mahoba and Chitrakoot lies in Bundelkhand region and nine districts namely
Allahabad, Ghazipur, Ballia, Gorakhpur, Faizabad, Mau, Mirzapur, Jaunpur and Bahraich lies in
Eastern Uttar Pradesh.
Very Low Concentration:- (-3.64- -1.45)
There are twenty three districts in this category which account for 32.86 percent of the
total districts. Out of these twenty three districts four districts namely Kannauj, Mainpuri, Etah
and Auraiya lies in Western Uttar Pradesh; three districts namely Kheri, Hardoi and Sitapur lies
in Central Uttar Pradesh and rest sixteen districts namely Basti Sant Ravidasnagar, Pratapgarh,
Chandauli, Sultanpur, Deoria, Gonda, Azamgarh, Sharawasti, Maharajganj, Kaushambi,
Ambedkarnagar, Sidhartnagar, Balrampur, Sant Kabirnagar and Kushinagar lies in Eastern Uttar
Pradesh.
Table 4.5
Industrial Develoment
Category Index Name of the District No. of
Districts
Very High 7.70-19.84 G.B.Nagar, Ghaziabad 02
High 3.29-7.70 Meerut, Kanpurnagar, Lucknow, Kanpur Dehat 04
Medium 0.31-3.29 Muzaffarnagar, Agra, Jhansi, Mathura, Bulandshahr,
Saharanpur, Pilibhit, Varanasi, Rampur, Lalitpur,
Sonbhadra, Moradabad, Bareilly, Jalaun, Shahjahanpur,
Hamirpur
16
Low -1.45-0.31
Raebareli, Etawah, Banda, Baghpat, Firozabad, Hathras,
Farrukhabad, Ghazipur, Unnao, Barabanki, Fatehpur,
Bijnor, J.P.Nagar, Mahoba, Allahabad, Aligarh, Ballia,
Gorakhpur, Chitrakoot, Faizabad, Mau, Budaun,
Mirzapur, Jaunpur, Bahraich
25
Very Low -3.64- -1.45 Kannauj, Kheri, Basti, Sitapur, Mainpuri, Sant
Ravidasnagar, Pratapgarh, Chandauli, Sultanpur,
Auraiya, Hardoi, Deoria, Gonda, Azamgarh, Sharawasti,
Etah, Maharajganj, Kaushambi, Ambedkarnagar,
Sidhartnagar, Balrampur, Sant Kabirnagar, Kushinagar
23

76

77
References :
1- NIRD (1999): Regional disparities in development and poverty,
India Rural Development Report, National Institute of Rural
Development, Hyderabad.
2- Radhakrishna, R. and Shovan Ray (2004): ‘Poverty in India:
Dimensions and Character’, India Development Report, Oxford
University Press, New Delhi.
3- Agrawal, R . P . and Mehrotra, C. L.-`Soil Survey and Soil Work in U.P., Allahabad, 1950.
4- Alexander, J. W. and Gibson, L. J. – Economic Geography, Prentice Hall of India P. Ltd.
New Delhi, 1979.
5- Alexander,R.S.,Cross J.S.and Hiel, R.M.-`Industrial Marketing’, D . B. Taraporevala Sons & Co.
P. Ltd., Bombay, 1968.
6- Alonso, W. - `Industrial Location and Regional Policy in Economic
Development`, Working Paper 14, Department of City and Regional
Planning and Centre for Planning and Development Research,
Institute of Urban and Regional Development, University of
California, Berkley, 1968
7- Berry, B.J.L. – ‘Essays on Commodity, Flows and Spatial Structure of the Indian
Economy’, Research Paper 111, Department ofGeography, University of Chicago, 1966.
8- Berry, B.J.L. – ‘Recent Studies Concerning the Role of
Transportation in the Space Economy’, Annuals of A.A.G., Vol. 49, No. 3, 1959, p.
328.
9- Bose S.K. – Evaluation of literature on Small Scale Industries in
India, UNESCO Research Centre on Social and Economic
Development in Southern Asia.
10- Brown, C.M. – ‘Successful Features in the Planning of New Town Industrial Estates’,
Journal of the Town Planning Institute, 1962.
11- Chandra Shekhar, C.S.– ‘Regional Planning and Regionalization,
Urban and Rural Planning Thought’, Vol. V, NO. 4, 1962, pp. 23-25.

78
12- Chandra Shekhar, C.S. – ‘The Role of Growth Foci in Regional
Development Strategy’, Urban and Rural Planning Thought’,
Vol. XV, No. 1, pp. 10-11.
13- Darwent, D.F. – ‘Growth Poles and Growth Centres in Regional Planning : A Review’,
Environment and Planning, 1965, pp. 5-31.
14- Development of Industries in Uttar Pradesh (1964-65), Directorate of Industries, U.P.
(Planning and Research Section), Kanpur, 1965.
15- Giri, H.H. – ‘Land Utilisation Survey: District Gonda”, Shivalaya Prakashan, Gorakhpur,
1976.
***************
Chapter 5
79
Socio-Economic Development and Regional
Disparity
In the preceding chapters analysis of regional development in the levels of
social, agricultural and industrial development in Uttar Pradesh has been undertaken. These
various dimensions of development are examined in terms of a variety of indicators in each
case. For example, social development is measured through eight indicators; agricultural
development is assessed with the help of four indicators and industrial development is
adjudged from the variety of indicators such as bank, employment in registered factory and
number of registered factory etc.
Method of Analysis
The level of socio-economic development of different districts of Uttar Pradesh is
obtained with the help of composite index based on optimum combination of sixteen socio-
economic indicators. The district wise data in respect of sixteen indicators were used for seventy
districts of the State. The data on most of the indicators were for the year 2001. The level of
development is obtained separately for social, agricultural and industrial development. The
district of G.B.Nagar is ranked first and the district of Sant Kabirnagar is ranked last in the level
of socio-economic development in the State as shown in table 6.1. Wide disparities are obtained
in the level of development among different economic regions. Western Uttar Pradesh and
Central Uttar Pradesh region are found to be better developed and region of Bundelkhand and
Eastern Uttar Pradesh are less developed. The intra district disparities also found in the socio-
economic development of the study area. The socio-economic development was positively
80
associated with the growth and progress of agricultural development and infrastructural
facilities. The level of education, provision of health services, banking facilities and transport
systems did not significantly influence the agricultural development in the State.
Development is a multi-dimensional continuous process. The impact of
development in different dimensions cannot be fully measured by any single indicator.
Moreover, a number of indicators when analyzed individually do not provide an integrated and
comprehensible picture of reality. Hence, there is a need for building up of a composite index of
development based on various indicators combined in an optimum manner. For this study, the
districts have been taken as the unit of analysis. Seventy districts of the state of Uttar Pradesh are
included in the study. The study utilizes data on most of the economic indicators for the year
2001-02. A total of sixteen development indicators have been included in the study.
Development Indicators
Each district faces situational factors of development unique to it as well as common
administrative and financial problems. Administrative, financial and other situational factors
common to all the districts have been taken as the indicators of development. The composite
indices of development for different districts have been obtained by using the data on the
following indicators.
Variable Definition
Social Sector
X1 No. of school per lakh of population
X2 Literacy
X3 Percentage of urban population to total population
X4 Length of PWD pucca road per lakh of population
X5 Per capita electricity consumption (K.W.H.)
X6 Percentage of main workers to total population
X7 No. of beds in Allopathic hospitals/dispensaries per lakh of population
(including P.H.C)
X8 No. of Primary Health Centres (P.H.C) per lakh of population
81
Agricultural Sector
X9 Percentage of main agricultural workers to total main workers
X10 Percentage of gross irrigated area to gross area sown
X11 Cropping intensity
X12 Distribution of total fertilizer per hectare of gross area sown
Industrial Sector
X13 No. of scheduled commercial banks per lakh of population
X14 No. of small scale industries per lakh of population
X15 No. of employees in registered factories per lakh of population
X16 No. of working factories per lakh of population
A total of sixteen development indicators have been included in the analysis for evaluating the
level of socio-economic development of different districts. These indicators may not form an all
inclusive list but these are the major interacting components of socio-economic development.
Level of Development
The composite indices of development (Cl) have been worked out for different districts
separately for social, agriculture and industrial development and overall socio-economic
development. The districts have been ranked on the basis of development indices. Table 5.1
presents the composite indices (CI) of development along with the ranks of different districts. It
may be seen from the above table that out of 70 districts of the State, the district of G.B.Nagar is
ranked first and the district of Sant Kabir Nagar ranked last in the overall socio-economic
development. The value of composite indices varied· from 22.552 to -13.320. In social
development the district of Sonbhadra is ranked first and district of Kushinagar ranked last. The
composite indices of social development varied from 18.882 to -9.591. In agricultural
development the district of Pilibhit is ranked first in the State whereas the district of Hamirpur
ranked last. The composite indices of agricultural development varied from 3.709 to -5.964.

82
Regarding industrial development, the district of G.B. Nagar again ranked first and the district of
Kushinagar again ranked last in the State. The composite indices varied from 19.844 to -3.642.
For examining the relationships among social development, agricultural development,
industrial development and overall socio-economic development pair wise correlations have
been worked out and presented in table 5.2
Table 5.2
S.No. Pair of Sectors Correlation Coefficient
1 Agriculture and Social -.297*
2 Agricultural and Industrial -.057
3 Agriculture and Socio-economic .099
4 Social and Industrial .685*
5 Social and Socio-economic .845*
6 Industry and Socio-economic .865*
*correlation is significant at the .01 level.
The correlation coefficient between the developments in agricultural and socio-economic
sectors is not found to be significant at 0.01 probability level. However, the correlation coefficient
between the developments in agriculture and social and agriculture and industrial is negatively
significant. The agricultural development is not found to be significantly affected by the level of social
development and industrial development. On the other hand the social and socio-economic development
and social and industrial development is found to be significant at 0.01 probabilities. Overall socio-
economic development is positively associated with social, agricultural and industrial development.
83
Levels of Socio-Economic Development
To find out the levels socio-economic development, the composite indices have been
worked out for each district by adding the index values of all the variables. The index value is
then divided into five grades of very high, high, medium, low and very low The Composite
Index has been given in appendix D. There are high degrees of regional disparities at regional as
well as intra-region level pertaining to agricultural, social and industrial development has been
obtained in the study region as shown in Table 5.3 and Fig.5.1
Very High Socio-Economic Development (10.35-22.55)
There are three districts in this category which accounts for the 4.29 percent of the total
districts of the study area. Out of three districts, two districts namely G.B.Nagar and Ghaziabad
lies in Western Uttar Pradesh and the districts of Sonbhadra lies in Eastern Uttar Pradesh.
High Level of Socio-Economic Development (3.70-10.35)
There are twelve districts in this category which accounts for 17.14 percent of the
total districts. Out of these twelve districts, seven districts namely Muzaffarnagar,
Moradabad, Meerut, Bulandshahr, Mathura, Agra and Mainpuri lies in Western Uttar Pradesh;
four districts namely Kanpur Nagar, Kanpur Dehat, Lucknow and Barabanki lies in Central
Uttar Pradesh and district of Lalitpur lies in Bundelkhand region. Not a single district from
Eastern Uttar Pradesh find place in this category.
Medium Socio-Economic Development (-1.38- 3.70)
There are twenty one districts in this category which accounts for 30 percent of the
total districts of the study area. Out of these twenty one districts, sixteen districts namely
Saharanpur, J.P. Nagar, Rampur, Pilibhit, Shahjahanpur, Bijnor, Aligarh, Hathras, Firozabad,
Etah, Bareilly, Farrukhabad, Kannauj, Etawah, Aurraiya and Baghpat lies in Western Uttar
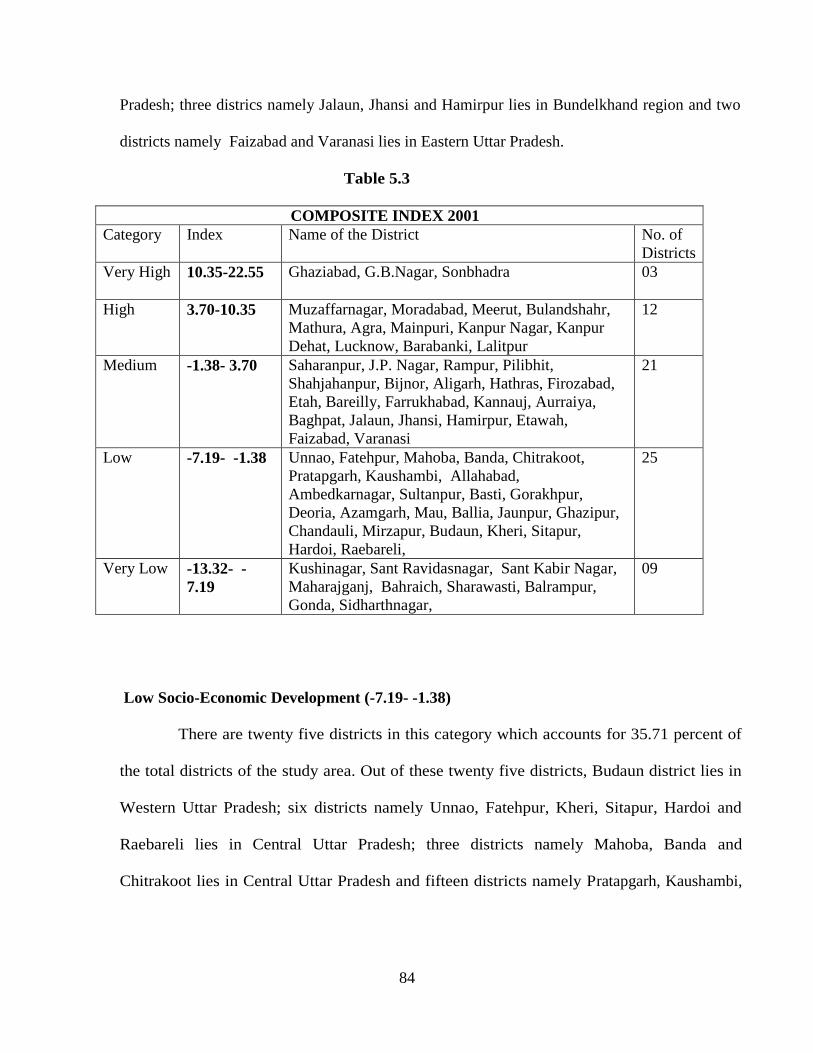
84
Pradesh; three districs namely Jalaun, Jhansi and Hamirpur lies in Bundelkhand region and two
districts namely Faizabad and Varanasi lies in Eastern Uttar Pradesh.
Table 5.3
COMPOSITE INDEX 2001
Category Index Name of the District No. of
Districts
Very High 10.35-22.55
Ghaziabad, G.B.Nagar, Sonbhadra 03
High 3.70-10.35
Muzaffarnagar, Moradabad, Meerut, Bulandshahr,
Mathura, Agra, Mainpuri, Kanpur Nagar, Kanpur
Dehat, Lucknow, Barabanki, Lalitpur
12
Medium -1.38- 3.70
Saharanpur, J.P. Nagar, Rampur, Pilibhit,
Shahjahanpur, Bijnor, Aligarh, Hathras, Firozabad,
Etah, Bareilly, Farrukhabad, Kannauj, Aurraiya,
Baghpat, Jalaun, Jhansi, Hamirpur, Etawah,
Faizabad, Varanasi
21
Low -7.19- -1.38
Unnao, Fatehpur, Mahoba, Banda, Chitrakoot,
Pratapgarh, Kaushambi, Allahabad,
Ambedkarnagar, Sultanpur, Basti, Gorakhpur,
Deoria, Azamgarh, Mau, Ballia, Jaunpur, Ghazipur,
Chandauli, Mirzapur, Budaun, Kheri, Sitapur,
Hardoi, Raebareli,
25
Very Low -13.32- -
7.19
Kushinagar, Sant Ravidasnagar, Sant Kabir Nagar,
Maharajganj, Bahraich, Sharawasti, Balrampur,
Gonda, Sidharthnagar,
09
Low Socio-Economic Development (-7.19- -1.38)
There are twenty five districts in this category which accounts for 35.71 percent of
the total districts of the study area. Out of these twenty five districts, Budaun district lies in
Western Uttar Pradesh; six districts namely Unnao, Fatehpur, Kheri, Sitapur, Hardoi and
Raebareli lies in Central Uttar Pradesh; three districts namely Mahoba, Banda and
Chitrakoot lies in Central Uttar Pradesh and fifteen districts namely Pratapgarh, Kaushambi,

85
Allahabad, Ambedkarnagar, Sultanpur, Basti, Gorakhpur, Deoria, Azamgarh, Mau, Ballia,
Jaunpur, Ghazipur, Chandauli and Mirzapur lies in Western Uttar Pradesh.
Very Socio-Economic Development (-13.32- -7.19)
There are nine districts in this category which accounts for 12.86 percent of the
total districts of study area. All the nine districts lie in Eastern Uttar Pradesh.
*******************
Chapter 7

86
Conclusion and Suggestions
The broad conclusions emerging from the study are as follows:
1. With respect to overall socio-economic development, the districts of G.B.Nagar, Ghaziabad,
Sonbhadhra, J.P.Nagar, Kanpur Nagar, Lucknow Muzaffarnagar, Bulandshahr, Mathura, Kanpur
Dehat, Lalitpur, Agra, Mainpuri, Barabanki and Moradabad are found to be better developed as
compared to the remaining districts of the state. Most of the districts belong to Western Uttar
Pradesh and Central Uttar Pradesh. Similarly the districts of Sant Kabir Nagar, Kushinagar,
Sidharthnagar, Gonda, Maharajganj, Sharawasti, Bahraich, Balrampur, Sant Ravidasnagar,
Gorakhpur, Ambedkarnagar, Mirzapur, Azamgarh, Jaunpur and Deoria are very low developed.
All of these districts belong to Eastern Uttar Pradesh. The levels of development in the rest of the
districts are of middle or low order but most of the districts having tendency to make
improvement in the pattern of development.
2. Nine districts namely Sonbhadra, Jalaun, Lalitpur, Hamirpur, G.B.Nagaar, Jhansi, Kanpur Nagar,
Agra and Chitrakoot; eleven districts namely Pilibhit, Rampur, Barabanki, Ambedkarnagar, J.P.
Nagar, Shahjahanpur, Bulandshahr, and Baghpat and two districts namely G.B.Nagar and
Ghaziabad are found to be better developed in social , agriculture and industrial sector
respectively. Similarly six districts namely Kushinagar, Sant Kabirnagar, Maharajganj, Gonda,
Ambedkarnagar, and Sidharthnagar have very low social development; seven districts namely
Hamirpur, Chitrakoot, Mahoba, Jalaun, Banda, Jhansi, and Sonbhadra have very low agricultural
development and twenty three districts namely Kushinagar, Sant Kabirnagar, Balrampur,
Sidharthnagar, Kaushambi, Maharajganj, Etah, Sharawasti, Azamgarh, Gonda, Deoria,
Ambedkarnagar, Hardoi, Auraiya, Sultanpur, Chandauli, Sant Ravidasnagar, Pratapgarh,
Mainpuri, Sitapur, Basti, Kheri, Kannauj and Bahraich have very low industrial development.

87
Nine districts namely Kushinagar, Sant Ravidasnagar, Maharajganj, Bahraich, Sharawasti,
Balrampur, Gonda and Sidharthnagar are found to be very low developed in overall socio-
economic development.
3. The overall socio-economic development is positively associated with social, agriculture and
industrial development. The impact of industrial development on overall socio-economic
development is higher than the agriculture and social development. Agricultural development
along with the better avenues for education, electricity and medical facilities will enhance the
level of level of overall socio-economic development. Agricultural development and social
development and agricultural development and industrial development are negatively associated.
4. Wide disparities in the levels of development have been observed in different districts. Western
Uttar Pradesh and Central Uttar Pradesh regions are found to be better developed whereas most
of the districts in Eastern Uttar Pradesh and Bundelkhand regions are low developed.
5. In order to reduce the disparities in the level of development, low developed districts require
improvements of various dimensions in different indicators for enhancing the level of overall
socio-economic development. The location specific technology of agricultural development
should be adopted and proper utilization of infrastructural facilities and resources should be
made. Special care and efforts should be made to enhance the industrial development particularly
household industry.

88