Embed Size (px)
Citation preview

Volumen 9 – Número 1
Enero – Marzo 2017
ISSN: 2007-4786
INNOVACIÓN Y DESARROLLO TECNOLÓGICO REVISTA DIGITAL
41
Proposal of Markov chains to determine buying probability in a period, with non-determined probability factors to elucidated
consumer behavior
Héctor D. Molina-Ruiz1, Stephani M. Rojano-Chávez2
1 Autonomous University of Hidalgo, Science Institute, Hidalgo, México. 2 Environmental Department, Tula – Tepeji’s Technological University, Hidalgo, México.
Palabras claves: Cadenas de Markov, Preferencia del consumidor, Uso de las TIC. Keywords. Consumer preference, Markov Chains, Use of ICT. 1. INTRODUCCIÓN A marketing study (sometimes this term is used indistinctly as market study) needs a big amount of resources, especially financial ones, so that it is very important to find alternative tools to support decision making process. Since computer’s born, life in various aspect of life started to change. New technologies made possible faster and more accurate calculus processes, data analysis and information building. Now a day it is well know the powerful help of Information and Communication Technologies (ICT) to society.
Resumen Es muy importante reconocer el rol que juega el estudio de mercado para la implementación de una
estrategia de mercado. Además de ello es importante considera que el estudio de mercado requiere
de una gran cantidad de diferentes recursos de la organización, principalmente recursos financieros.
Sin embargo, esta clase de son necesarios con el objeto de generar parámetros para el proceso de
toma de decisiones, sobre todo en el momento de colocar el producto o servicio en el mercado de
consumo. Lo anterior debido a que el estudio de mercado genera un punto de partida y provee
información para determinar las necesidades del consumidor final. La cadena de Markov es una
herramienta muy útil, especialmente al considerar un ambiente de escases de recursos. Mediante el
uso de las TIC (Tecnología de Información Comunicación), es posible generar escenarios en los cuales
se pueda predecir la preferencia del consumidor por cierto tipo de producto.
Abstract
It is very important to recognize the roll that plays a marketing study to implement a marketing
strategy. It is also important to consider that a marketing study needs a big amount of different
organization’s resources, especially financial ones. However, that kind of studies are necessaries to
create parameters to procure a good decision making process, in the moment of locate a product or
offer a service in the market share. It because, a marketing study generates the initial point and
provides information to determine the needs of final consumer. Markov chains can help and be a
helpful tool in a context which (from an economic focus) considers an environment with a lack of
resources. Thorough the use of ICT (Information and Communication Technologies), it is likely to
generate scenarios in which it is possible to predict final consumer preferences about certain kind of
products, using Markov chains approach.

Volumen 9 – Número 1
Enero – Marzo 2017
ISSN: 2007-4786
INNOVACIÓN Y DESARROLLO TECNOLÓGICO REVISTA DIGITAL
42
ICT are a group of tools, like computers, computers’ peripheral hardware, mobiles, tablets and other informatics’ devices, which can help managing data and information in different context like personal, organizational, and governmental, among others. ICT can be used in small firms (Southern & Tilley, 2000; Martin, & Tiu Wright, 2005; Wainwright, Green, Mitchell & Yarrow), medium sized firms (Barba-Sánchez, Martínez-Ruiz & Jiménez-Zarco, 2005; Clear & Dickson, 2005; Antlová, 2009) and large firms (Robets, 2000, Perrini, Russo & Tencati, 2007), with proved benefits to organizations. As mentioned in Steinmuller (2000), they are recognized two uses of the ICT term: (1) to change viewpoints that assign a primal importance to ‘tactic’ knowledge as a determinant of organizational behavior; that is, knowledge that cannot be adequately articulated for exchange or is not so articulated because of the costs of doing so; and (2) to call attention to the variety of techniques and to the scale of investments that are being devoted to the process of codification. ICT are enablers or tools that can be applied in support of many social, cultural, political and economic activities (Mansell, 1999). ICT can also reinforce marketing activities, thorough its use on saving and analyzing data to create information; and supports the decision-making process. Marketing deals with identifying and meeting human and social needs (Kotler, 2002). Traditionally, marketing is viewed as an intermediate function, where the specialists of the marketing department are the only persons who have an impact on the customers’ views of the firm and on their buying behavior (Grönroos, 1990). In Kotler & Levy (1969) it is pointed out marketing concept such as product improvement, pricing, distribution, and communication in organizations. Talking about the scope of marketing, it is feasible to express that marketing can use a big amount of tools to support product improvement, pricing, distribution, and also the communication inside of the organizations. Markov chains are a well-known mathematical tool, which can support marketing scope. Markov chains are named after Prof. Andrei A. Markov (1856–1922) (Ching, Huang, Ng & Siu, 2013). Markov chain is a special kind of random process; it shows the state of things from the past to now, from now to future, just like a chain, a ring by a ring (Li, Sun, Li & Xuan, 2014). Markov chains model a sequence of random variables, which correspond to the states of a certain system in such a way that the state at one time depends only on the state in the previous time (Ching et al., 2013). As pointed out in Briceño Valera (2005), when assumed that changes depend only of time, probability changes can be denoted by a first order Markov chain, with it changes’ matrix is a transition’s matrix of conditional probabilities which shows change probability from time t to time t+1. As in Markov chains actual state only depends on precedent state, it would be appropriate to restrict their operability and use on marketing scope, to stable demand products, which reduce calculus errors. Markov chain should satisfy the following conditions: the state of system is only related to the current situation, it has nothing to do with the state before (Lu, Zhang, Yu & Qu, 2014). Stable products or stable demand product (also constant demand) are that kind of goods that do not have abrupt changes in their demands along the time. At Pontes Assumpção (2003) it is pointed out that in a stable demand environment it is possible to accurately forecast end-products’ demand. It can also be mentioned that consumer preferences and/or consumer choice can be measured from different points of view (Currim & Sarin, 1983; Friese, Wänke & Plessner, 2006; Chen, Marmorstein, Tsiros & Rao, 2012; Chung & Rao, 2012; Bartels & Johnson, 2015; Tung, Tsay & Lin, 2015). When an organization has data from an initial market study, that information can be re-used if organization cannot afford an additional one (market study), thorough effective qualitative or quantitative tools. Markov

Volumen 9 – Número 1
Enero – Marzo 2017
ISSN: 2007-4786
INNOVACIÓN Y DESARROLLO TECNOLÓGICO REVISTA DIGITAL
43
chains are thus seen to be useful in marketing as a predictive device for short and long range purposes (Styan & Smith, 1964). With a Markov chain’s process, it is possible to determine the market share of a specific trademark and the preference of final consumer. 2. APPROACH Product’s market share is the percentage of enterprise actual sales quantity in the actual industry sales (Li et al., 2014). Market share in a monopolist market will have a 100% market share for a single trademark. In common conditions, there exist several trademarks in the market share. It is necessary to manage a strict condition due to the need of stability in the development of Markov chain step by step. To apply Markov chain and determine buying probability after a market study, specifically in the long term, it is suggested to strictly adjust to constant demand scenario in which it is ensured that present stadium (t) only depends of before stadium (t-1). It is also possible to consider that the approach used in present document, can be used in products of non-constant demand when organization does not have resources to afford a new market study, not as a fact but as a reference to support decision making process. Consider the hypothetical situation in which a market share has three different trademarks, each trademark has its own segment. Now consider that a market study was carried out with particular a characteristic in “research design formulation” and “data compilation” (Fig. 1) phases of market research process, that it is included a section about the consumer preference or choice in which the market study obtains information about probability of a client to buy a certain trademark or probability that a client stay faithful to certain trademark and the probability that same client changes its preference about other trademarks in the market share.
Fig. 1. Market research process. Self-elaboration based on Malhotra (2008)
Definition
Focus development
Research design
formulation
Data compilation
Data analysis
Inform

Volumen 9 – Número 1
Enero – Marzo 2017
ISSN: 2007-4786
INNOVACIÓN Y DESARROLLO TECNOLÓGICO REVISTA DIGITAL
44
When it is being integrated a marketing study it is necessary to measure customer loyalty to a product or service. In Kristensen (1998) it is measured the buying probability of a client, which means that it is possible to measure probability of a client to buy the same product or stay faithful to a certain product from the market share. In Hallowel (1996) it is also reviewed withholding concept to a product. For example, consider a client faithful to trademark A and its probability to sticks that trademark, again trademark B and C equals to 40 %, and the probabilities to prefer trademarks B and C, 35% and 25 %, respectively (Fig. 2).
A B
C
0.35
0.25
0.40
Fig. 2. Graph of Trademark A’s probabilities
Also consider a client faithful to trademark B and its probability to sticks that trademark, again trademark B and C equals to 45 %, and the probabilities to prefer trademarks A and C, 25 % and 30 %, respectively (Fig. 3).
A B
C
0.25
0.30
0.45
Fig. 3. Graph of Trademark B’s probabilities
Finally, consider a client faithful to trademark C and its probability to sticks that trademark, again trademark B and C equals to 50 %, and the probabilities to prefer trademarks A and B, 25 % and 25 %, respectively (Fig. 4).
A B
C
0.250.25
0.50
Fig. 4. Graph of Trademark C’s probabilities

Volumen 9 – Número 1
Enero – Marzo 2017
ISSN: 2007-4786
INNOVACIÓN Y DESARROLLO TECNOLÓGICO REVISTA DIGITAL
45
Now consider the complete panorama of different trademarks (Fig. 5) form which it is extracted the matrix of probabilities to Markov process (𝐸𝑐. 1).
A B
C
0.35
0.25
0.40
0.25
0.30
0.45
0.25 0.25
0.50
Fig. 5. Probability’s graph of Trademarks A, B & C
From last example, it is possible to determine the following probabilities matrix (𝐸𝑞. 1):
𝑃 = [0.40 0.30 0.250.25 0.45 0.300.25 0.25 0.50
]. . . . . . . . . . . . . . . . . . . . . . (1)
As mentioned before, marketing process need a great quantity of resources and when resources are not enough in the enterprise to start an additional market study, it can be used Markov chain approach to calculate buying probability. In this case the resultant transition matrix is (𝐸𝑞. 2), until convergence point (see Annex I to get each transition matrix):
𝑃23 = [0.294117647058823 0.349264705882353 0.3566176470588230.294117647058823 0.349264705882353 0.3566176470588230.294117647058823 0.349264705882353 0.356617647058823
] . . . . . . (2)
That matrix means that in the long-term client faithful to trademark A will prefer it in a 29.41 %, client faithful to trademark B will prefer it in a 34.92 %, and client faithful to trademark C will prefer it in a 35.66 %. It means that in the long term, trademarks A, B and C, will have 29.41 %, 34.92 %, and 35.66 %, of the market share, respectively. Alternatively, forecast (in the long term) can be calculated by solving an adapted equations’ system, which gets the convergence point with less computational resources. It means that same result is obtained when it is applied the next transformation(𝐸𝑞. 3):
[𝑝(𝑥) 𝑝(𝑦) 𝑝(𝑧)] ∗ [0.40 0.35 0.250.25 0.45 0.300.25 0.25 0.50
] = [𝑝(𝑥) 𝑝(𝑦) 𝑝(𝑧)]. . . . . (3),
and substituting one row of the resultant matrix by (𝐸𝑞. 4):
[𝑝(𝑥) 𝑝(𝑦) 𝑝(𝑧)] = 1 . . . . . . . . . . . . . . . . (4), as follows (𝐸𝑞. 5):

Volumen 9 – Número 1
Enero – Marzo 2017
ISSN: 2007-4786
INNOVACIÓN Y DESARROLLO TECNOLÓGICO REVISTA DIGITAL
46
0.40 𝑝(𝑥) +0.25 𝑝(𝑦) +0.25 𝑝(𝑧)0.35 𝑝(𝑥) +0.45 𝑝(𝑦) +0.25 𝑝(𝑧)
𝑝(𝑥) +𝑝(𝑦) +𝑝(𝑧)
===
𝑝(𝑥)
𝑝(𝑦)1
. . . . . . . . . . . (5)
When coeficients are extracted and adecuated (𝐸𝑞. 6) to be solved by Gauss-Jordan metod it is obtained:
[−0.60 0.25 0.250.35 −0.55 0.251.00 1.00 1.00
|0.000.001.00
] . . . . . . . . . . . . . . . (6),
applying Gaus-Jordan method we obtain (𝐸𝑞. 7; see annex II):
[1.00 0.00 0.000.00 1.00 0.000.00 0.00 1.00
|0.2941176470588240.3492647058823530.356617647058823
] . . . . . . . . . . . . (7),
which means that in the long term, trademarks A, B and C, will have 29.41 %, 34.92 %, and 35.66 %, of the market share, respectively. In the case of Markov chain´s transition matrixes, it is necessary to multiply matrix by matrix until reach a convergence point with little differences between one and another matrix (Table 1).
Table 1. Absolute average gradients between transition matrixes
Abs P01-->P02 Average 0.012916666666666700000
Abs P02-->P03 Average 0.002670833333333330000
Abs P03-->P04 Average 0.000547291666666659000
Abs P04-->P05 Average 0.000111427083333344000
Abs P05-->P06 Average 0.000022580729166665800
Abs P06-->P07 Average 0.000004560442708319750
Abs P07-->P08 Average 0.000000918733072927422
Abs P08-->P09 Average 0.000000184743294261312
Abs P09-->P10 Average 0.000000037098160802588
Abs P10-->P11 Average 0.000000007442057457939
Abs P11-->P12 Average 0.000000001491775289717
Abs P12-->P13 Average 0.000000000298859616067
Abs P13-->P14 Average 0.000000000059847602183
Abs P14-->P15 Average 0.000000000011980873084
Abs P15-->P16 Average 0.000000000002397884360
Abs P16-->P17 Average 0.000000000000479838391
Abs P17-->P18 Average 0.000000000000095917101
Abs P18-->P19 Average 0.000000000000019169851
Abs P19-->P20 Average 0.000000000000003848773
Abs P20-->P21 Average 0.000000000000000733981
Abs P21-->P22 Average 0.000000000000000000000
Abs P22-->P23 Average 0.000000000000000000000
Abs: Absolute gradient P[i]-->P[i+1]: change from transition matrix i to transition matrix j P[i]-->P[i+1]
Average: all of the “i j” components’ average change from transition matrix i to transition matrix j

Volumen 9 – Número 1
Enero – Marzo 2017
ISSN: 2007-4786
INNOVACIÓN Y DESARROLLO TECNOLÓGICO REVISTA DIGITAL
47
While in the case of adapted equations system(𝐸𝑞. 5), it is only necessary to solve the system to obtain the direct convergence point (𝐸𝑞. 8) and find long term buying probability after a market study, and consequently the market share.
[−0.60 0.25 0.250.35 −0.55 0.251.00 1.00 1.00
|0.000.001.00
] → [1.00 0.00 0.000.00 1.00 0.000.00 0.00 1.00
|0.2941176470588240.3492647058823530.356617647058823
]. . . . . (8)
3. PROPOSAL It is possible to see that Markov chain is a tool to forecast customer preference and that in the long term it can also show the market share between different brands. It is more accurate when trademark is related to a constant demand (stable demand) product but, as a reference parameter. It can also be used with non-constant demand products, while the total probability by case or product is equals to one. As known in a markovian chain probabilities of each row or column, depending on the focus and/or scope, must to summarize 1 (one), which ensures the 100% probability that an event happened. In that case, it is possible to state that the summation of each row must to be equals to 1. Consider next matrix of integrals which represent possible probabilities and that it is a generalization of(𝐸𝑞. 1), consider also that the representation of each integral is like the condition used in a distribution probability in which the total area under the curve is less or equals to 1.
𝑃 =
[
∫ 𝑥11
𝑥112
𝑥111
𝑑𝑥 ∫ 𝑥12
𝑥122
𝑥121
𝑑𝑥
∫ 𝑥21
𝑥212
𝑥211
𝑑𝑥 ∫ 𝑥22
𝑥222
𝑥221
𝑑𝑥
… ∫ 𝑥1𝑛
𝑥1𝑛2
𝑥1𝑛1
𝑑𝑥
∫ 𝑥2𝑛
𝑥2𝑛2
𝑥2𝑛1
𝑑𝑥
⋮ ⋱ ⋮
∫ 𝑥𝑛1
𝑥𝑛12
𝑥𝑛11
𝑑𝑥 ∫ 𝑥𝑛2
𝑥𝑛22
𝑥𝑛21
𝑑𝑥 ⋯ ∫ 𝑥𝑚𝑛
𝑥𝑚𝑛2
𝑥𝑚𝑛1
𝑑𝑥
]
. . . . . . . . . . . . (9)
It means that each integral can have the following behavior:
0 ≤ ∫ 𝑥𝑖𝑗
𝑥𝑖𝑗2
𝑥𝑖𝑗1
𝑑𝑥 ≤ 1. . . . . . . . . . . . . . . . . . . . . . . . . . . . (10)
To cover the restriction of markovian method summarize each row equals to 1, it is possible to state the following n-constrains:

Volumen 9 – Número 1
Enero – Marzo 2017
ISSN: 2007-4786
INNOVACIÓN Y DESARROLLO TECNOLÓGICO REVISTA DIGITAL
48
∑ ∫ 𝑥1𝑗
𝑥1𝑗2
𝑥1𝑗1
𝑑𝑥
𝑛
𝑗=1
≤ 1. . . . . . . . . . . . . . . . . . . . . . . . . . . . (11)
∑ ∫ 𝑥2𝑗
𝑥2𝑗2
𝑥2𝑗1
𝑑𝑥
𝑛
𝑗=1
≤ 1. . . . . . . . . . . . . . . . . . . . . . . . . . . . (12)
⋮
∑ ∫ 𝑥1𝑗
𝑥𝑚𝑗2
𝑥𝑚𝑗1
𝑑𝑥
𝑛
𝑗=1
≤ 1. . . . . . . . . . . . . . . . . . . . . . . . . . . . (13)
which ensures conceptual viability of the method. 4 CONCLUSIONS When Markov chain method is adapted to a non-defined probability approach, it gives the chance to create a generalization of the method, like in (𝐸𝑞. 1). It is useful, for example, in the case that organization has no resources to afford a market study, it is likeable to use Markov chains to determine buying probability in the long term, that parameter is a good reference to predict the market share and/or customer loyalty, because Markov chain application can show buying probability in the long term, under certain constrains like: constant demand product, and the “research design formulation” and “data compilation” phases oriented to acquire specific information as probability that a client buy a certain trademark (probability that a client stay faithful to certain brand) and the probability that same client changes its preference about other brand in the market share. It is also implicit, that to solve markovian systems it is necessary the use of ICT, particularly when the case of application have several variables. REFERENCES
[1] Antlová, K.: Motivation and barriers of ICT adoption in small and medium-sized enterprises. E & M Ekonomie a Management 12, No. 2 (2009): 140-155.
[2] Barba-Sánchez, V., Martínez-Ruiz, M. P., Jiménez-Zarco, A. I.: Drivers, benefits and challenges of ICT adoption by small and medium sized enterprises (SMEs): a literature review. Problems and Perspectives in Management 5, No. 1 (2007): 104-115.
[3] Bartels, D. M., Johnson, E. J.: Connecting cognition and consumer choice. Cognition 135 (2015): 47-51. [4] Briceño Valera. F.: Las cadenas de Markov en el análisis de cambios y asignación de usos de la tierra. Markov chain in the land-
use change and assignment analysis. Revista Geográfica Venezolana, Vol. 46(1) (2005): 35-45 [5] Chen, H. A., Marmorstein, H., Tsiros, M., Rao, A. R.: When more is less: The impact of base value neglect on consumer
preferences for bonus packs over price discounts. Journal of Marketing Vol. 76, No. 4 (2012): 64-77. [6] Ching, W.K., Huang, X., Ng, M.K. & Siu, T.K.: Markov Chains, International Series in Operations Research & Management
Science 189, (2013). [7] -Chung, J., Rao., V. R.: A general consumer preference model for experience products: application to internet
recommendation services. Journal of marketing research 49.3 (2012): 289-305. [8] Clear, F., Dickson, K.: Teleworking practice in small and medium‐sized firms: management style and worker autonomy. New
Technology, Work and Employment 20, No. 3 (2005): 218-233.

Volumen 9 – Número 1
Enero – Marzo 2017
ISSN: 2007-4786
INNOVACIÓN Y DESARROLLO TECNOLÓGICO REVISTA DIGITAL
49
[9] Currim, I. S., Sarin, R. K.: A procedure for measuring and estimating consumer preferences under uncertainty. Journal of Marketing Research (1983): 249-256.
[10] Friese, M., Wänke, M., Plessner, H.: Implicit consumer preferences and their influence on product choice. Psychology & Marketing Vol. 23, No. 9 (2006): 727-740.
[11] Grönroos, C.: Marketing redefined. Management Decision, Vol. 28, No. 8 (1990). [12] Hallowell, R.: The relationships of customer satisfaction, customer loyalty, and profitability: an empirical study. International
journal of service industry management 7, No. 4 (1996): 27-42. [13] Kotler, P., Levy, S.J.: Broadening the concept of marketing. The Journal of Marketing (1969): 10-15. [14] Kotler, P.: Marketing Management, Millenium Edition, Custom Edition for University of Phoenix, Pearson Custom Publishing
(2002). [15] Kristensen, K.: Some aspects of customer satisfaction and customer loyalty. Total Quality Management 9.4-5 (1998): 145-151. [16] Li, L., Jie Sun, J., Yan Li, Y., Xuan, H.: Mathematical model based on the product sales market forecast of markov forecasting
and application. Journal of Chemical and Pharmaceutical Research, 2014, 6(6):1359-1365. [17] Lu, Y., Zhang, M., Yu, T., Qu, M.: Application of Markov prediction method in the decision of insurance company. International
Conference on Logistics Engineering, Management and Computer Science (2014): 294-297. [18] Malhotra, N.: Investigación de Mercados un Enfoque Práctico, Quinta edición, 2008, México, Editorial Pearson Prentice Hall. [19] Mansell, R.: Global access to information & communication technologies (GAIT): priorities for action. (1999). [20] Martin, L. M., Tiu Wright, L.: No gender in cyberspace? Empowering entrepreneurship and innovation in female-run ICT small
firms. International Journal of Entrepreneurial Behavior & Research 11, No. 2 (2005): 162-178. [21] Perrini, F., Russo, A., Tencati, A.: CSR strategies of SMEs and large firms. Evidence from Italy. Journal of Business Ethics 74,
No. 3 (2007): 285-300. [22] - Pontes Assumpção, M. R.: Reflexão para gestão tecnológica em cadeias de suprimento. Gestão & Produção 10.3 (2003): 345-
362. [23] Roberts, J.: From know-how to show-how? Questioning the role of information and communication technologies in
knowledge transfer. Technology Analysis & Strategic Management 12, No. 4 (2000): 429-443. [24] Southern, A., Tilley, F.: Small firms and information and communication technologies (ICTs): toward a typology of ICTs usage.
New technology, work and employment 15, No. 2 (2000): 138-154. [25] Styan, G.P.H., Smith, H.: Markov chains applied to marketing. Journal of Marketing Research (1964): 50-55. [26] Steinmueller, W. E.: Will new information and communication technologies improve the 'codification' of knowledge? Industrial
and Corporate Change 9, No. 2 (2000): 361-376. [27] Tung, S. J., Tsay, J. C., Lin, M. C.: Life course, diet-related identity and consumer choice of organic food in Taiwan. British Food
Journal Vol. 117 No. 2 (2015): .688-704 [28] Wainwright, D., Green, G., Mitchell, E., Yarrow, D.: Towards a framework for benchmarking ICT practice, competence and
performance in small firms. Performance Measurement and Metrics 6, No. 1 (2005): 39-52
* Correo autor: [email protected]
Annex I: Probability matrixes’ transition (Microsoft ® Excel ® basic calculus)
Transition
Initial matrix
[P]
Product matrix
[Pn, n= 1, … , 23]
Resultant transition matrix
[P*Pn]
0.40 0.35 0.25
0.4000000000000 0.3500000000000 0.2500000000000
0.310000000000000 0.360000000000000 0.330000000000000
1 0.25 0.45 0.30 * 0.2500000000000 0.4500000000000 0.3000000000000 = 0.287500000000000 0.365000000000000 0.347500000000000
0.25 0.25 0.50
0.2500000000000 0.2500000000000 0.5000000000000
0.287500000000000 0.325000000000000 0.387500000000000
0.40 0.35 0.25
0.3100000000000 0.3600000000000 0.3300000000000
0.296500000000000 0.353000000000000 0.350500000000000
2 0.25 0.45 0.30 * 0.2875000000000 0.3650000000000 0.3475000000000 = 0.293125000000000 0.351750000000000 0.355125000000000
0.25 0.25 0.50
0.2875000000000 0.3250000000000 0.3875000000000
0.293125000000000 0.343750000000000 0.363125000000000
0.40 0.35 0.25
0.2965000000000 0.3530000000000 0.3505000000000
0.294475000000000 0.350250000000000 0.355275000000000
3 0.25 0.45 0.30 * 0.2931250000000 0.3517500000000 0.3551250000000 = 0.293968750000000 0.349662500000000 0.356368750000000

Volumen 9 – Número 1
Enero – Marzo 2017
ISSN: 2007-4786
INNOVACIÓN Y DESARROLLO TECNOLÓGICO REVISTA DIGITAL
50
0.25 0.25 0.50
0.2931250000000 0.3437500000000 0.3631250000000
0.293968750000000 0.348062500000000 0.357968750000000
0.40 0.35 0.25
0.2944750000000 0.3502500000000 0.3552750000000
0.294171250000000 0.349497500000000 0.356331250000000
4 0.25 0.45 0.30 * 0.2939687500000 0.3496625000000 0.3563687500000 = 0.294095312500000 0.349329375000000 0.356575312500000
0.25 0.25 0.50
0.2939687500000 0.3480625000000 0.3579687500000
0.294095312500000 0.349009375000000 0.356895312500000
0.40 0.35 0.25
0.2941712500000 0.3494975000000 0.3563312500000
0.294125687500000 0.349316625000000 0.356557687500000
5 0.25 0.45 0.30 * 0.2940953125000 0.3493293750000 0.3565753125000 = 0.294114296875000 0.349275406250000 0.356610296875000
0.25 0.25 0.50
0.2940953125000 0.3490093750000 0.3568953125000
0.294114296875000 0.349211406250000 0.356674296875000
0.40 0.35 0.25
0.2941256875000 0.3493166250000 0.3565576875000
0.294118853125000 0.349275893750000 0.356605253125000
6 0.25 0.45 0.30 * 0.2941142968750 0.3492754062500 0.3566102968750 = 0.294117144531250 0.349266510937500 0.356616344531250
0.25 0.25 0.50
0.2941142968750 0.3492114062500 0.3566742968750
0.294117144531250 0.349253710937500 0.356629144531250
0.40 0.35 0.25
0.2941188531250 0.3492758937500 0.3566052531250
0.294117827968750 0.349267064062500 0.356615107968750
7 0.25 0.45 0.30 * 0.2941171445313 0.3492665109375 0.3566163445313 = 0.294117571679687 0.349265016640625 0.356617411679688
0.25 0.25 0.50
0.2941171445313 0.3492537109375 0.3566291445313
0.294117571679687 0.349262456640625 0.356619971679688
0.40 0.35 0.25
0.2941178279688 0.3492670640625 0.3566151079688
0.294117674195312 0.349265195609375 0.356617130195312
8 0.25 0.45 0.30 * 0.2941175716797 0.3492650166406 0.3566174116797 = 0.294117635751953 0.349264760496094 0.356617603751953
0.25 0.25 0.50
0.2941175716797 0.3492624566406 0.3566199716797
0.294117635751953 0.349264248496094 0.356618115751953
0.40 0.35 0.25
0.2941176741953 0.3492651956094 0.3566171301953
0.294117651129297 0.349264806541406 0.356617542329297
9 0.25 0.45 0.30 * 0.2941176357520 0.3492647604961 0.3566176037520 = 0.294117645362793 0.349264715674414 0.356617638962793
0.25 0.25 0.50
0.2941176357520 0.3492642484961 0.3566181157520
0.294117645362793 0.349264613274414 0.356617741362793
0.40 0.35 0.25
0.2941176511293 0.3492648065414 0.3566175423293
0.294117647669394 0.349264726421211 0.356617625909394
10 0.25 0.45 0.30 * 0.2941176453628 0.3492647156744 0.3566176389628 = 0.294117646804419 0.349264707671162 0.356617645524419
0.25 0.25 0.50
0.2941176453628 0.3492646132744 0.3566177413628
0.294117646804419 0.349264687191162 0.356617666004419
0.40 0.35 0.25
0.2941176476694 0.3492647264212 0.3566176259094
0.294117647150409 0.349264710051182 0.356617642798409
11 0.25 0.45 0.30 * 0.2941176468044 0.3492647076712 0.3566176455244 = 0.294117647020663 0.349264706214674 0.356617646764663
0.25 0.25 0.50
0.2941176468044 0.3492646871912 0.3566176660044
0.294117647020663 0.349264702118674 0.356617650860663
0.40 0.35 0.25
0.2941176471504 0.3492647100512 0.3566176427984
0.294117647072561 0.349264706725277 0.356617646202161
12 0.25 0.45 0.30 * 0.2941176470207 0.3492647062147 0.3566176467647 = 0.294117647053099 0.349264705945001 0.356617647001899
0.25 0.25 0.50
0.2941176470207 0.3492647021187 0.3566176508607
0.294117647053099 0.349264705125801 0.356617647821099
0.40 0.35 0.25
0.2941176470726 0.3492647067253 0.3566176462022
0.294117647060884 0.349264706052312 0.356617646886804
13 0.25 0.45 0.30 * 0.2941176470531 0.3492647059450 0.3566176470019 = 0.294117647057965 0.349264705894310 0.356617647047725
0.25 0.25 0.50
0.2941176470531 0.3492647051258 0.3566176478211
0.294117647057965 0.349264705730470 0.356617647211565
0.40 0.35 0.25
0.2941176470609 0.3492647060523 0.3566176468868
0.294117647059133 0.349264705916551 0.356617647024317
14 0.25 0.45 0.30 * 0.2941176470580 0.3492647058943 0.3566176470477 = 0.294117647058695 0.349264705884659 0.356617647056647
0.25 0.25 0.50
0.2941176470580 0.3492647057305 0.3566176472116
0.294117647058695 0.349264705851891 0.356617647089415
0.40 0.35 0.25
0.2941176470591 0.3492647059166 0.3566176470243
0.294117647058870 0.349264705889223 0.356617647051907
15 0.25 0.45 0.30 * 0.2941176470587 0.3492647058847 0.3566176470566 = 0.294117647058804 0.349264705882801 0.356617647058395
0.25 0.25 0.50
0.2941176470587 0.3492647058519 0.3566176470894
0.294117647058804 0.349264705876248 0.356617647064948

Volumen 9 – Número 1
Enero – Marzo 2017
ISSN: 2007-4786
INNOVACIÓN Y DESARROLLO TECNOLÓGICO REVISTA DIGITAL
51
0.40 0.35 0.25
0.2941176470589 0.3492647058892 0.3566176470519
0.294117647058830 0.349264705883732 0.356617647057438
16 0.25 0.45 0.30 * 0.2941176470588 0.3492647058828 0.3566176470584 = 0.294117647058821 0.349264705882441 0.356617647058739
0.25 0.25 0.50
0.2941176470588 0.3492647058762 0.3566176470649
0.294117647058821 0.349264705881130 0.356617647060049
0.40 0.35 0.25
0.2941176470588 0.3492647058837 0.3566176470574
0.294117647058825 0.349264705882629 0.356617647058546
17 0.25 0.45 0.30 * 0.2941176470588 0.3492647058824 0.3566176470587 = 0.294117647058823 0.349264705882370 0.356617647058807
0.25 0.25 0.50
0.2941176470588 0.3492647058811 0.3566176470600
0.294117647058823 0.349264705882108 0.356617647059069
0.40 0.35 0.25
0.2941176470588 0.3492647058826 0.3566176470585
0.294117647058824 0.349264705882408 0.356617647058768
18 0.25 0.45 0.30 * 0.2941176470588 0.3492647058824 0.3566176470588 = 0.294117647058823 0.349264705882356 0.356617647058820
0.25 0.25 0.50
0.2941176470588 0.3492647058821 0.3566176470591
0.294117647058823 0.349264705882304 0.356617647058873
0.40 0.35 0.25
0.2941176470588 0.3492647058824 0.3566176470588
0.294117647058824 0.349264705882364 0.356617647058812
19 0.25 0.45 0.30 * 0.2941176470588 0.3492647058824 0.3566176470588 = 0.294117647058823 0.349264705882354 0.356617647058823
0.25 0.25 0.50
0.2941176470588 0.3492647058823 0.3566176470589
0.294117647058823 0.349264705882343 0.356617647058833
0.40 0.35 0.25
0.2941176470588 0.3492647058824 0.3566176470588
0.294117647058823 0.349264705882355 0.356617647058821
20 0.25 0.45 0.30 * 0.2941176470588 0.3492647058824 0.3566176470588 = 0.294117647058823 0.349264705882353 0.356617647058823
0.25 0.25 0.50
0.2941176470588 0.3492647058823 0.3566176470588
0.294117647058823 0.349264705882351 0.356617647058825
0.40 0.35 0.25
0.2941176470588 0.3492647058824 0.3566176470588
0.294117647058823 0.349264705882353 0.356617647058823
21 0.25 0.45 0.30 * 0.2941176470588 0.3492647058824 0.3566176470588 = 0.294117647058823 0.349264705882353 0.356617647058823
0.25 0.25 0.50
0.2941176470588 0.3492647058824 0.3566176470588
0.294117647058823 0.349264705882353 0.356617647058824
0.40 0.35 0.25
0.2941176470588 0.3492647058824 0.3566176470588
0.294117647058823 0.349264705882353 0.356617647058823
22 0.25 0.45 0.30 * 0.2941176470588 0.3492647058824 0.3566176470588 = 0.294117647058823 0.349264705882353 0.356617647058823
0.25 0.25 0.50
0.2941176470588 0.3492647058824 0.3566176470588
0.294117647058823 0.349264705882353 0.356617647058824
0.40 0.35 0.25
0.2941176470588 0.3492647058824 0.3566176470588
0.294117647058823 0.349264705882353 0.356617647058823
23 0.25 0.45 0.30 * 0.2941176470588 0.3492647058824 0.3566176470588 = 0.294117647058823 0.349264705882353 0.356617647058823
0.25 0.25 0.50
0.2941176470588 0.3492647058824 0.3566176470588
0.294117647058823 0.349264705882353 0.356617647058823
0.40 0.35 0.25
0.2941176470588 0.3492647058824 0.3566176470588
0.294117647058823 0.349264705882353 0.356617647058823
24 0.25 0.45 0.30 * 0.2941176470588 0.3492647058824 0.3566176470588 = 0.294117647058823 0.349264705882353 0.356617647058823
0.25 0.25 0.50
0.2941176470588 0.3492647058824 0.3566176470588
0.294117647058823 0.349264705882353 0.356617647058823

Volumen 9 – Número 1
Enero – Marzo 2017
ISSN: 2007-4786
INNOVACIÓN Y DESARROLLO TECNOLÓGICO REVISTA DIGITAL
52
Annex II: Equations system solution by Gauss – Jordan method (Microsoft ® Excel ® basic calculus)
-0.60 0.25 0.25 0.00
0.35 -0.55 0.25 0.00
1.00 1.00 1.00 1.00 1 -0.41667 -0.41667 0.00
0 -0.40417 0.395833 0.00
0 1.416667 1.416667 1.00 1 0 -0.82474 0.00
0 1 -0.97938 0.00
0 0 2.804124 1.00 1 0 0 0.2941176471
0 1 0 0.3492647059
0 0 1 0.3566176471
Volumen 9 – Número 1
Enero – Marzo 2017
ISSN: 2007-4786
INNOVACIÓN Y DESARROLLO TECNOLÓGICO REVISTA DIGITAL
53
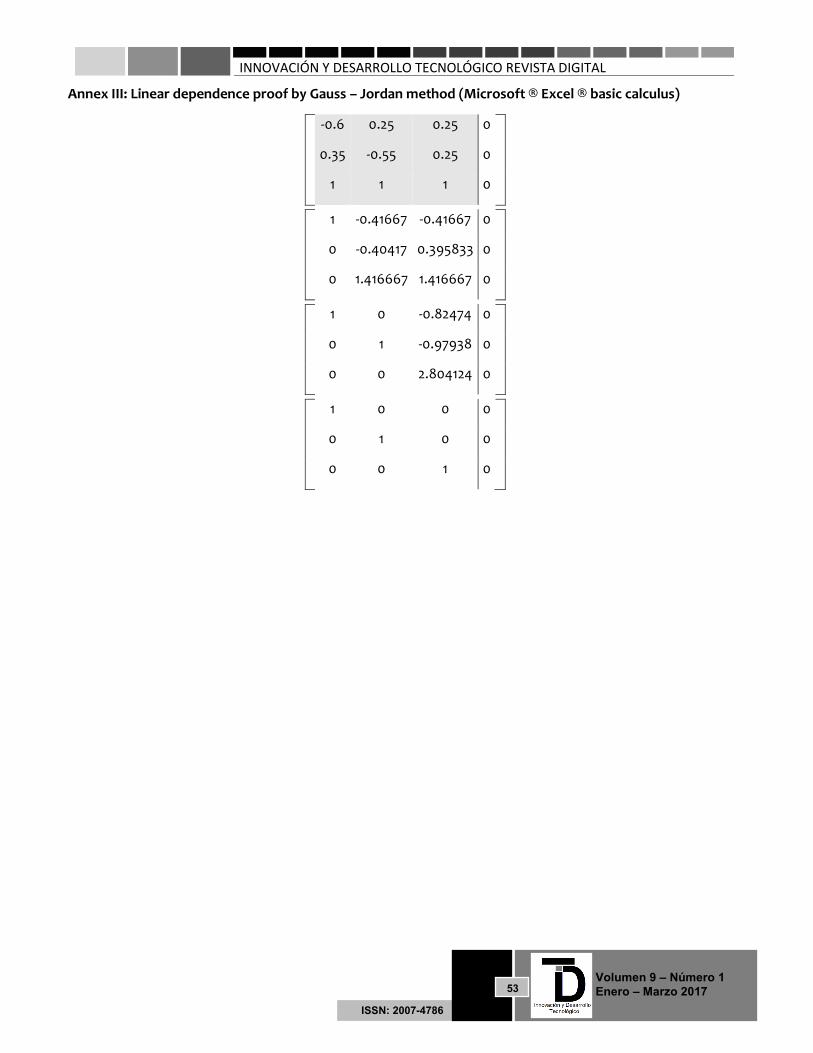
Annex III: Linear dependence proof by Gauss – Jordan method (Microsoft ® Excel ® basic calculus)
-0.6 0.25 0.25 0
0.35 -0.55 0.25 0
1 1 1 0 1 -0.41667 -0.41667 0
0 -0.40417 0.395833 0
0 1.416667 1.416667 0 1 0 -0.82474 0
0 1 -0.97938 0
0 0 2.804124 0 1 0 0 0
0 1 0 0
0 0 1 0


