Embed Size (px)
Citation preview

Research ArticleProphylactic Treatment of Probiotic and Metformin MitigatesEthanol-Induced Intestinal Barrier Injury: In Vitro, In Vivo,and In Silico Approaches
Farhin Patel ,1 Kirti Parwani ,1 Priyashi Rao ,2 Dhara Patel ,1 Rakesh Rawal ,2
and Palash Mandal 1
1Department of Biological Sciences, P.D. Patel Institute of Applied Sciences, Charotar University of Science and Technology, Changa,388421 Anand, Gujarat, India2Department of Biochemistry & Forensic Science, University School of Sciences, Gujarat University, Ahmedabad,380009 Gujarat, India
Correspondence should be addressed to Palash Mandal; [email protected]
Received 18 May 2021; Accepted 9 August 2021; Published 27 September 2021
Academic Editor: Sanjoy Roychowdhury
Copyright © 2021 Farhin Patel et al. This is an open access article distributed under the Creative Commons Attribution License,which permits unrestricted use, distribution, and reproduction in any medium, provided the original work is properly cited.
Ethanol depletes intestinal integrity and promotes gut dysbiosis. Studies have suggested the individual role of probiotics andmetformin Met in protecting intestinal barrier function from injuries induced by ethanol. The objective of the current study isto investigate the potential mechanism by which coadministration of probiotic Visbiome® (V) and Met blocks the ethanol-induced intestinal barrier dysfunction/gut leakiness utilizing Caco-2 monolayers, a rat model with chronic ethanol injury, andin silico docking interaction models. In Caco-2 monolayers, exposure to ethanol significantly disrupted tight junction (TJ)localization, elevated monolayer permeability, and oxidative stress compared with controls. However, cotreatment withprobiotic V and Met largely ameliorated the ethanol-induced mucosal barrier dysfunction, TJ disruption, and gut oxidativestress compared with ethanol-exposed monolayers and individual treatment of either agent. Rats fed with ethanol-containingLieber-DeCarli liquid diet showed decreased expression of TJ proteins, and increased intestinal barrier injury resulting in pro-inflammatory response and oxidative stress in the colon. We found that co-administration of probiotic V and Met improvedthe expression of intestinal TJ proteins (ZO-1 and occludin) and upregulated the anti-inflammatory response, leading toreduced ER stress. Moreover, co-administration of probiotic V and Met inhibited the CYP2E1 and NOX gene expression, andincrease the translocation of Nrf-2 as well as anti-oxidative genes (SOD, catalase, Gpx, and HO-1), leading to reduced colonicROS content and malondialdehyde levels. The combined treatment of probiotic V and Met also improved their bindingaffinities towards HO-1, Nrf-2, SLC5A8, and GPR109A, which could be attributed to their synergistic effect. Our findingsbased on in-vitro, in-vivo, and in-silico analyses suggest that the combination of probiotic V and Met potentially acts insynergism, attributable to their property of inhibition of inflammation and oxidative stress against ethanol-induced intestinalbarrier injury.
1. Introduction
Chronic alcohol consumption is associated with numerousgastrointestinal and liver disorders, especially alcoholic liverdisease (ALD) [1]. While the precise molecular mechanismof ALD pathogenesis is not fully understood, few of thereports suggested that ethanol-induced barrier dysfunctionplays a crucial role in ALD progression [2, 3]. Intestinal epi-
thelial tight junctions (TJs) are considered to be the key reg-ulators of intestinal mucosal permeability [4]; therefore,regulating the TJ protein expression (i.e., occludin, claudins,and zonula occludens (ZO)) or modulating its functions willpositively influence intestinal barrier function. Alcohol con-sumption is known to disrupt TJs resulting in increasedintestinal permeability [5]. It is now a most likely acceptedfact that impaired intestinal epithelial integrity and intestinal
HindawiMediators of InflammationVolume 2021, Article ID 5245197, 32 pageshttps://doi.org/10.1155/2021/5245197

barrier dysfunction are the two principle reasons behind theincreased intestinal permeability [6]. Studies have indicatedthat alcohol-induced increased intestinal permeability leadsto an anomalous leakage of bacterial endotoxins, therebycausing liver damage [7]. In alcoholics, increased bloodendotoxin levels (endotoxemia) can be due to three potentialmechanisms: (i) due to both abnormal gut dysbiosis andoverproduction of bacteria leading to increased endotoxinproduction; (ii) due to gut leakiness, which causes increasedendotoxin permeation through the gut; and (iii) due toeither portal hypertension or Kupffer cell dysfunction lead-ing to decreased endotoxin elimination [8, 9]. When thereis no evidence of portal hypertension and defective Kupffer’scell function, then it is not considered as an important factorin the initiation of ALD [8]. Therefore, gut leakiness or dis-rupted intestinal barrier function is considered to be theimportant mechanism for ethanol-induced increased endo-toxemia in alcohol-mediated liver injury [10].
Equally unclear is the molecular mechanism mediatingethanol-induced gut leakiness. Several lines of evidence sug-gest that the culprit is ethanol-induced tissue oxidativestress. Studies showed that alcohol disrupts the barrier integ-rity of monolayers of intestinal cells and that alcohol-induced disruption is due to oxidative injury to the cytoskel-eton [11]. CYP2E1, an enzyme playing an important role inalcohol metabolism, may contribute to alcohol-inducedintestinal effects [12]. Oxidative stress and ROS are predom-inantly generated through the induction of CYP2E1 metab-olism that may perhaps facilitate the disruption ofintestinal permeability [13]. The challenge to treat any stageof ALD other than by abstinence still lies in the incapabilityto recognize new therapeutic strategies. Therefore, studiesshowed that a better understanding of the exact molecularmechanisms responsible for the ethanol-induced increasein intestinal permeability may eventually result in moreeffective prevention/treatment strategies for inhibiting theprogression of ALD [14].
The intestinal bacterium that refers to gut microbiotahas a reflective impact on the host metabolism and itsimmune system [15]. Indeed, intestinal bacteria contributeto the expansion of the intestinal architecture and immunesystem and also play a lead role in gut barrier functionmaintenance [16]. Among all the beneficial functions ofgut microbiota, its capability to ferment long-chain polysac-charides that avoid human metabolism producing short-chain fatty acids (SCFAs) is considered to be the best char-acteristic. The predominant SCFAs produced are acetate,propionate, and butyrate [17]. Among the three SCFAs,butyrate is present to a smaller extent, but is the most effec-tive. After ethanol consumption, the SCFA levels in theintestine were noted to be decreased, except for acetate,whose levels are known to be increased as it is the metabo-lite of ethanol [18].
Modulation of gut microbiota through probiotic admin-istration is considered to be one of the optimized formula-tions towards alcohol-induced gut injury. According to aWorld Health Organization (WHO)/Food and AgricultureOrganization (FAO) report, probiotics are live microorgan-isms that when used in suitable quantities, confer a health
benefit on the host improving the functional properties ofgut microbiota [19]. In the past years, emerging conceptsfor the use of probiotics as functional products have beenobserved in preventing the ethanol-induced disruption ofcolonic epithelial TJs and barrier dysfunction [20]. Addi-tionally, an in vivo study explained that the probiotic Lacto-bacillus rhamnosus GG (LGG) helps in reducing gutpermeability, oxidative stress, and inflammation in the liverand intestine [21].
Met is another such medicinal compound known to pos-sess anti-hyperglycemic activity that has a potential to pre-vent alcohol-induced liver injury [22]. Recent studies haverevealed that (Met) exerts a constructive role in attenuatingintestinal dysbiosis. In type 2 diabetes, Met has been knownto alleviate the gut microbiota imbalance partially [23]. Stud-ies also demonstrated the role of Met in preventing the intes-tinal mucosal barrier injury and inflammation caused bydextran sulfate sodium (DSS) [24]. In LPS-induced in-vitroand in vivo models, Met alleviates the intestinal TJ dysfunc-tion, oxidative stress, and inflammatory response [25].
Since intestinal injury is associated with oxidative stressand free radical formation, compounds with antioxidantproperties could act as an inhibitor in amelioratingethanol-induced intestinal injury. Considering the aboveexperimental studies as well as the individual protective roleof probiotics and Met towards intestinal homeostasis, thecurrent study was executed to investigate the potential com-binatorial role of probiotic V and Met in preventing theincreased intestinal barrier integrity, epithelial cell perme-ability, and butyrate levels through interactions with recep-tors and transporters by inhibiting the gut oxidative stressand inflammation in ethanol-induced intestinal injury(in vitro and in vivo models of intestinal injury). To knowand understand the plausible mechanism by which com-bined treatment of probiotic V and Met could act in syner-gism to prevent oxidative stress and to maintain intestinalpermeability induced by ethanol, we adopted an in silicoapproach and performed the docking of Met and butyrate(metabolite released from probiotic V) with antioxidants,i.e., Nrf-2 and HO-1 as well as butyrate sensors, i.e., thebutyrate receptor GPR109A and the butyrate transporterSLC5A8.
2. Materials and Methods
2.1. Materials. All chemicals were purchased from HiMediaLaboratories (HiMedia Laboratories Private Limited, India)unless cited otherwise. The TRIzol Reagent, cDNA SynthesisKit, and SYBR/ROX Master Mix were purchased fromThermo Fisher Scientific (USA). The metformin reagent andprimers for quantitative real-time reverse transcription-polymerase chain reaction (qRT-PCR) were obtained fromSigma-Aldrich (USA).
2.2. Cell Culture. In the present study, a human colonic epi-thelial cell line, i.e., Caco-2 cells, were acquired from theNational Centre for Cell Sciences (NCCS), Pune, India,and were cultured in dulbecco's modified eagle medium(DMEM) medium supplemented with 20% (v/v) fetal bovine
2 Mediators of Inflammation

serum (FBS) and 1% (v/v) antibiotic-antimycotic solution ina humidified atmosphere of 5% (v/v) CO2 at 37°C. Theexperimental dose of probiotic V and Met (i.e., 10μl and1mM, along with 100mM ethanol) was previously deter-mined in our lab using an MTT cytotoxicity assay [26]. Cellswere maintained in T75 flasks, and the medium wasreplaced every second day for 23 days. After attaining 70%confluency, cells were detached by using a 0.25% trypsin-EDTA solution for about 5min, then centrifuged at1000 rpm for 5min, removed the supernatant, resuspendedin 16mL of complete medium (DMEM), and seeded equallyinto two new T75 flasks. Cells from passages 30 to 38 wereused for all experiments.
2.3. Probiotic Visbiome® Supplementation in an In Vitro andIn Vivo Model of Intestinal Barrier Injury. Visbiome® (Lot#07197721) is considered to be a probiotic mixture of threeviable lyophilized bacterial species containing 112:5 × 10⁹CFU/capsule. The consortium includes four strains of lacto-bacilli (Lactobacillus acidophilus, Lactobacillus paracasei, Lac-tobacillus delbrueckii subspecies bulgaricus, and Lactobacillusplantarum), three strains of bifidobacteria (Bifidobacteriumlongum, Bifidobacterium infantis, and Bifidobacterium breve),and Streptococcus salivarius subspecies thermophilus. Probi-otic Visbiome® (V) containing 1 g of each stock was sus-pended in the De Man, Rogosa, and Sharpe agar (MRS)broth (pH: 6:5 ± 0:2) at 25°C to activate the probiotic V cul-ture. The probiotic V stock culture was conserved through aglycerol-MRS broth at a concentration of 20% (v/v) andmaintained at -70°C.
2.3.1. For In Vitro Supplementation. The probiotic V culturewas sonicated for 30min (repeating 10 s of sonication and10 s of hold) with a sonicator. The probiotic V bacterial cul-ture at its respective final concentration was centrifuged at1500 × g for 10min and the individual supernatant (whole-cell extract) was obtained. Furthermore, the obtained super-natant was centrifuged at 6500 × g for 30min yielding thecell cytosol (supernatant) and the membrane (pellet). Thecell-free supernatant was stored at -20°C and used forfurther experimentation.
2.3.2. For In Vivo Supplementation. The probiotic V (1%)culture was inoculated into another freshly prepared MRSbroth. The probiotic V inoculum was collected by centrifu-gation at 10,000 × g and 4°C for 10min. After centrifugation,the remaining cell pellet was washed thrice with phosphate-buffered saline (PBS). Then, the cell pellet was resuspendedin sterile distilled water with 108 colony-forming unit(CFU)/ml as a final concentration for further experimentaluse.
2.4. Animals. Eight- to ten-week-old male Wistar rats weigh-ing 200-225 g were acquired from Zydus PharmaceuticalIndustries Pvt. Ltd. (India). Rats were allowed to acclimatizein standard cages (two rat/cage) and were fed a normal chowdiet under ambient conditions (temperature: 22 ± 2°C; rela-tive humidity: 55 ± 5%) with a 12h light and 12 h dark cyclebefore the commencement of the feeding experiment withthe Lieber DeCarli liquid diet.
2.5. In Vitro and In Vivo Induction of Intestinal BarrierInjury Using Ethanol Stimulation with SimultaneousProbiotic Visbiome® and Metformin Administration
2.5.1. In Vitro Model. Caco-2 cells were seeded in 6-wellplates at the seeding density of 1:8 × 10⁵ cells/ml and cul-tured for 23 days. Later, we assigned Caco-2 monolayers intothe following groups: (a) the control group of untreatedCaco-2 monolayers; (b) the ethanol group—cells weretreated with serum-free 100mM ethanol-containingmedium for 48 h to induce intestinal epithelial barrier dys-function; (c) experimental group-1—cells were treated withserum-free medium containing 1mM Met concentrationalong with 100mM ethanol for 48 h; (d) experimentalgroup-2—cells were treated with serum-free medium con-taining 10μl/ml probiotic V along with 100mM ethanolfor 48 h; and (e) experimental group-3 with the combina-tion—cells were treated with serum-free medium containing1mM Met and 10μl/ml probiotic V along with 100mM eth-anol for 48h.
2.5.2. In Vivo Model. Weight and age-matched rats weregiven Liber DeCarli’s diet for the first 2 days for acclimatiza-tion. After 2 days, ethanol-fed rats were permitted free accessto a complete ethanol-containing Lieber DeCarli diet. Also,control rats were given a pair-fed diet containing maltodex-trin (substituted isocalorically) for the entire feeding period.The ethanol-induced intestinal barrier injury model (25days, 32% total calories) contained increased concentrationsof ethanol (vol/vol): 1% (2 days), 2% (2 days), 4% (7 days),5% (7 days), and lastly 6% (7 days) [26].
Oral supplementation of probiotic V and Met was givenat doses of 108CFU/day and 75mg/kg, respectively, to theexperimental rats [26]. Following ethanol exposure proto-cols, rats were randomized, weighed, and anesthetized. Fol-lowing feeding protocols, blood was taken from theposterior vena cava, and from the part of whole blood,serum was isolated and kept at -80°C, until further use.Moreover, rats fasted overnight were then euthanized bythe exsanguination method (as mentioned in the CPCSEAguidelines) and colons were excised. Other small portionsof the colon were fixed in formalin, frozen in optimal cuttingtemperature (OCT) medium, and stored in RNA later at-20°C for isolating RNA.
Therefore, to induce the intestinal barrier injury ratmodel, we assigned rats to the following groups: (a) the con-trol group—rats fed with a pair-fed diet containing malto-dextrin (substituted isocalorically); (b) the ethanol controlgroup—rats fed with the ethanol-containing Lieber DeCarliliquid diet for 25 days to induce intestinal barrier dysfunc-tion; (c) experimental group-1—rats fed with 75mg/kg bodyweight Met along with the ethanol containing Lieber DeCarliliquid diet for 25 days; (d) experimental group-2—rats fedwith 108CFU/day Probiotic V along with the ethanol con-taining Lieber DeCarli liquid diet for 25 days; and (e) exper-imental group-3 with the combination—rats fed with75mg/kg body weight Met and 108CFU/day Probiotic Valong with the ethanol-containing Lieber DeCarli liquid dietfor 25 days.
3Mediators of Inflammation

2.6. Measurement of Transepithelial Electrical Resistance(TEER) in Caco-2 Monolayers. To evaluate the intestinal bar-rier integrity, Caco-2 monolayers with a seeding density of1:0 × 105 cells/transwell were seeded in 12-well plates. Therespective treatments given are based on the groupsdescribed earlier, and the percentage of TEER was measured.0.5ml and 1.5ml media were added to the upper and lowerchambers, respectively. The TEER value was measured by anepithelial volt ohmmeter. For blanks, inserts without cells wereconsidered and their mean resistance was deducted from allcontrol and treated samples. Triplicate measurements wererecorded for each monolayer, and the average value wascalculated to measure electrical resistance. TEER was calcu-lated as follows: TEER = ðRm – blankÞ × A; where Rm =transmembrane resistance; blank = intrinsic resistance of acell‒freemedia; and A =membrane surface area (cm2) [27].
2.7. Determination of In Vitro and In VivoIntestinal Permeability
2.7.1. In Vitro Model. To measure the intestinal epithelialbarrier permeability, fluorescein isothiocyanate- (FITC-)dextran (FD-4), a paracellular marker, was chosen, and theamount of the marker that passes the Caco-2 cell mono-layers was measured. Briefly, Caco-2 cells were seeded in12-well plates at a density of 1:0 × 105 cells/well for 21 days.The respective treatments given are based on the groupsdescribed earlier. Afterward, FD-4 was added to the apicalcompartment of the Caco-2 monolayer transwell insertsand incubated for 30min. The FD-4 outflow into the lowerbasal compartment was measured at the excitation wave-length of 485nm and an emission wavelength of 530nmusing a fluorescence spectrophotometer (Perkin Elmer LS-55, USA) [28].
2.7.2. In Vivo Model. After three hours from the last oralgavage, FD-4 dissolved in saline (500mg/kg body weight,125mg/mL) was orally administered to rats. Later, ani-mals were euthanized, and serum levels were checkedfor FD-4 concentration after 3 hr using a fluorescencespectrophotometer (Perkin Elmer LS-55, USA) at an exci-tation wavelength of 485 nm and an emission wavelength of530nm [29].
2.8. Determination of Colonic Myeloperoxidase (MPO)Activity. Colonic tissue was extracted according to Bradleyet al. [30] using hexadecyltrimethylammonium bromide(HTAB). The extracted sample was mixed with o-dianizidine HCl and hydrogen peroxide (H2O2), and absor-bance was read spectrophotometrically at 460 nm. The sumof the MPO activity present in each sample/g tissue weightcauses a change in spectrophotometric absorbance of1/min at 460nm [30].
2.9. Measurement of Serum Endotoxin Concentration. Serumendotoxin concentration levels were determined using thecommercially available endotoxin quantitation kit (ThermoFisher Scientific) following the kit manufacturer’s guidelines.Endotoxin concentrations were expressed in endotoxinunits/ml.
2.10. Analysis of Colon Histology by H&E Staining. Colontissue sections fixed in formalin solution were processed inOCT medium. Five to 10μM colon sections were cut usinga cryostat device. To distinguish the morphological changesamong the differentially treated rats, paraffin-fixed colonsections were stained with hematoxylin-eosin (HE) solution.All the slide sections were observed by a single investigatorwho was blinded to the treatment status. All images capturedrepresent at least five random areas per colon section pertreatment group.
2.11. Estimation of ROS Production. The amount of ROS wasmeasured following the method used by Heidari et al. in 2016[31] with modification. Briefly, colon tissue was was homoge-nized in 1 : 10 w/v Tris-HCl buffer (pH7.4, 40mM). Afterhomogenization, 100μl of colon homogenate was mixed with1ml of Tris-HCl buffer and incubated with 5μl of carboxy-H2-DCFDA [5(6)-carboxy-2’,7’-dichlorofluorescein diace-tate] in the dark with a final concentration of 10μM at 37°Cfor 1hr. The samples’ fluorescence intensity was measured at485nm excitation wavelength and 525nm emission wave-length for measuring the total of ROS production using a fluo-rescence spectrophotometer (Perkin Elmer LS-55, USA) [31].
2.12. Estimation of Colonic Oxidative Stress
2.12.1. Estimation of the Colonic MDA Content by TBAMethod. To make 10% homogenate, colon tissues were takenand processed with ice-cold potassium chloride (KCl) solu-tion with the final concentration of 1.15% (w/v). In the colonhomogenate, concentrations of MDA were measured by theTBA method [32] using Cayman Chemical MDA estimationkit. The supernatant obtained was measured spectrophoto-metrically at the absorbance of 532nm (UV-visible spectro-photometer model: PharmaSpec UV-1700, Shimadzu,Japan). For the calibration, each standard sample wasrepeated three times (n = 3). A blank sample was repeated(n = 5) replacing the standard or sample with a TCA-TBA-HCl reagent. Tissue protein levels were measured by theLowry method, and the total MDA concentration obtainedfrom each sample was then normalized to the proteinconcentration of the respective sample.
2.12.2. Estimation of the Serum MDA Content by HPLCMethod. 500μl serum samples were mixed with 6M sodiumhydroxide (NaOH) (100μl) and incubated at 60°C in a waterbath for 45min. The hydrolyzed samples were mixed with35% perchloric acid (250μl) for acidification and centrifugedfor 10min at 15000 × g. Later, supernatant (250μl) wasmixed with 2,4-dinitrophenylhydrazine (DNPH) (25μl)solution and incubated in the dark for 10min. The deriva-tized serum sample was then analyzed using HPLC appara-tus (Waters Breeze-2, USA), through the ODS2 reverse-phase column. Acetonitrile and HPLC-grade water having0.2% acetic acid at a ratio of 38 : 62 was used as mobile phase.HPLC was done under isocratic conditions with a flow rateof 1.0ml/min, and MDA content in the samples wasdetected at 310nm using a UV detector.
4 Mediators of Inflammation

(1) Preparation of Standard Curve. 20 nmol/ml of MDAstandard stock solution was prepared from 1,1,3,3-tetra-ethoxypropane (TEP) (TCI, Japan), and further diluted with1% H2SO4 to yield a final concentration of 0.10, 0.20, 0.31,0.62, 1.25, 2.50, 5.00, and 10.00 nM/ml of MDA. To 250μlof each standard sample, 25μl of DNPH was added andincubated for 10min in the dark [33].
2.12.3. Evaluation of Antioxidant Capacity. The colon tissuewas mechanically homogenized and centrifuged at 3000 × gfor 15min. The colon tissue weight to physiological salineratio was 1 : 9 v/v. Glutathione peroxidase (GSH-Px), super-oxide dismutase (SOD), and catalase (CAT) in the superna-tant of homogenate were detected by using commercialassay kits (Thermo Fisher Scientific, USA).
2.13. Estimation of Butyrate Levels in the Serum. 20μl serumsamples were mixed with 100μl methanol, followed by a vig-orous vortex. Later, the mixture was centrifuged at 4800 × gfor 10min at 4°C, and further supernatant was collected andanalyzed through the C18 chromatographic column. Aceto-nitrile and HPLC-grade water having 0.1% phosphoric acidsolution at a ratio of 20 : 80 was used as a mobile phase.HPLC was done under isocratic conditions with a flowvelocity of 1.0ml/min, and butyrate levels in the sample weredetected at 206nm using a UV detector [34].
2.13.1. Standard Curve Preparation. We diluted 0.1 g buty-rate standard solution with HPLC-grade water to 100mland filtered it through a 0.45μm Millipore filter. Standardsolution was introduced at 0μl, 5μl, 10μl, 20μl, 30μl, and50μl.
2.14. Extraction of RNA and Quantitative ReverseTranscription Polymerase Chain Reaction (qRT-PCR).Caco-2 monolayer cells were seeded in 6-well plates at theseeding density of 2:0 × 105 cells/ml and cultured for 21days. Afterward, probiotic V (10μl), Met (1mM), and etha-nol (100mM) were added according to their respectivegroups and incubated for 48 h. Cells were harvested usingthe TRIzol Reagent extraction method. Also, for in vivostudies, a total of 4mg of colonic RNA was isolated fromthe colon tissue using the TRIzol Reagent extraction method.The concentrations (ng/μl) and purity (A260/A280) ofextracted RNA were measured by a NanoDrop instrument(Thermo Fisher Scientific, Waltham, MA, USA). Extracted
RNA was given a DNase treatment, and cDNA was synthe-sized from 1μg of total RNA using a first-strand cDNA syn-thesis kit, according to the manufacturer’s protocol. Real-time PCR amplification for quantifying the gene expressionswas done using the SYBR/ROX Master Mix in an AgilentMx3005P qPCR system (Agilent Stratagene) for the follow-ing primers (Tables 1 and 2). The respective gene expres-sions were normalized to the 18S rRNA gene expression(endogenous control). The quantification of results was doneusing the 2−ΔΔCT method [35] and expressed as fold-overbasal change comparative to the control group.
2.15. Statistical Analysis. The values of the replicates werecalculated as mean ± SD. To evaluate the statistical data,GraphPad Prism 7 software using one-way analysis of vari-ance (ANOVA) was used. Statistical variations among thedifferent experimental sets of groups were considered to besignificant at a p value less than 0.05.
2.16. In Silico Analysis
2.16.1. Preparation of Proteins Using Homology Modeling.Due to the unavailability of 3D structures for Rattus norvegi-cus, protein modeling of SLC5A8 and Nrf-2 was performedbased on known crystal structures from the Protein DataBank (PDB) [36] using homology modeling through theSWISS-MODEL server [37]. The amino acid FASTAsequence of these three proteins used to build the modelwas retrieved from UniProt [38] (Accession ID: D3Z9E5,O54968, and Q80Z39, respectively). Afterward, the modelwas generated based on the quality analysis of the pre-dicted model as conducted and was evaluated on the basisof Qualitative Model Energy Analysis (QMEAN) [39] andGlobal Model Quality Estimation (GMQE) score. GMQEscore ranges between zero and one, and the score for themodeled protein closer to 1 indicates increased structuralreliability. Another parameter of QMEAN Z-scores closerto zero indicate good agreement between the model struc-ture and experimental structures of similar size. Scores of-4.0 or below is an indication of models with low quality,highlighted by a change of the “thumbs-up” symbol to a“thumbs-down” symbol next to the score. Further, Mol-Probity 4.5.1 [40] was used to build the Ramachandranplot to analyze the psi and phi angles of the modeled pro-teins. Target-template alignment of sequences of the three
Table 1: The list of Homo sapiens primers used for the quantification of mRNA expression levels in qRT-PCR.
Sr. no. Name of the gene Forward primer sequence Reverse primer sequence
1 18S ACGGAAGGGCACCACCAGGA CACCACCACCCACGGAATCG
2 ZO-1 TATTATGGCACATCAGCACG TGGGCAAACAGACCAAGC
3 Occludin CTCGAGAAAGTGCTGAGTGCCTGGAC AAGCTTTCGGTGACCAATTCACCTGA
4 CYP2E1 AGGGTACCATGTCTGCCCTCGGAGTGA ACAATTTGAAAGCTTGTTTGAAAGCGG
5 NOX GTACAAATTCCAGTGTGCAGACCAC GTACAAATTCCAGTGTGCAGACCAC
6 TNF-α CCCTCACACTCAGATCATCTTCT GCTACGACGTGGGCTACAG
7 IL-6 GACAACTTTGGCATTGTGG ATGCAGGGATGATGTTCTG
8 IL-10 ACTGCTAACCGACTCCTTA TAAGGAGTCGGTTAGCAGT
5Mediators of Inflammation
proteins for their template protein sequences was alignedusing ClustalW [41]. The crystal structures for Rattus nor-vegicus GPR109A were built using the Robetta server(http://robetta.bakerlab.org) [42], and the Ramachandranplot was built using PROCHECK [43] on SAVES serverv6.0 (https://saves.mbi.ucla.edu/). The X-ray-diffracted 3Dstructure for Rattus norvegicus heme oxygenase (PDB ID:6J7A) was available, and hence, directly retrieved fromPDB.
2.16.2. Molecular Docking. In silico experiments were per-formed to study the protein-ligand interaction and bindingaffinity [44]. For performing protein-ligand interaction, fourof the proteins were first optimized for docking studies oneby one and were prepared by assigning the hydrogen atomsand charges followed by energy minimization using theDockPrep tool [45]. Partial charges are assigned as an atomattribute as per the AM1-BCC method to generate high-quality atomic charges for protein. Charges for nonstandardresidues, if any, were calculated using Amber’s Antechambermodule [46]. The energy minimization was performed usingthe 10,000 steepest descent steps with 0.02Å step size and anupdate interval of 10 for all four proteins individually. Allthe steps mentioned above were performed using UCSF Chi-mera 1.15 [47].
The 3D conformations for both butyrate (CID: 104775)and Met (CID: 4091) to perform docking were retrievedfrom PubChem [48]. This was followed by optimizationof both ligands through the Gasteiger algorithm [49] inthe structure editing wizard of UCSF Chimera 1.15, whichworks on the chemoinformatic principle of electronegativ-ity equilibration; the ligand files were saved in mol2 format,as per the methodology adopted previously in a publishedwork [50, 51].
Out of four, all the three proteins Nrf-2, GPR109A, andSLC5A8 were modeled for species Rattus norvegicus andlacked the predefined ligand-binding site. Hence, theligand-binding site information and the amino acidsinvolved in the protein-ligand interaction at the cleft werechosen based on the crystallized ligand attached in the orig-inal PDB file of the template protein that was used to buildthe respective Rattus norvegicus protein structure. For HO-1 (PDB ID: 6J7A), the native ligand was removed beforedocking, and the protein was treated similarly to the mod-eled proteins. As we want to look into the synergistic effectof butyrate and Met working in tandem, it becomes impor-tant to screen all other potential ligand-binding sites as wellon these four respective proteins. This was achieved by per-forming molecular protein-ligand docking in three stages: (i)Blind or global docking which enables identifying theligand-binding sites on multiple cavities in and on the struc-ture of a particular protein; this strategy is particularlyadvantageous when the ligand-binding sites on the structureof the proteins are unknown, like in the case of this study.(ii) Single Ligand Localized docking (SLLD) which enablesidentifying the actual orientation of the ligand bound to aprotein at the binding site. (iii) Multiple Ligand Simulta-neous Docking (MLSD), as the name suggests, allows simul-taneous interactions of multiple ligands at the active cleft ofthe protein. MLSD varies from SLLD by allowing differentconformations of multiple ligands at random to run simulta-neously. For running MLSD, the individual docking param-eter files for each ligand, i.e., butyrate and Met, were mergedas one, minimized again, and saved as an AutoDock ligandin pdbqt format.
Protein-ligand docking analysis was conducted usingAutoDock Vina [52], and the program has executed anadd-on in Chimera. Of all the possible poses suggested after
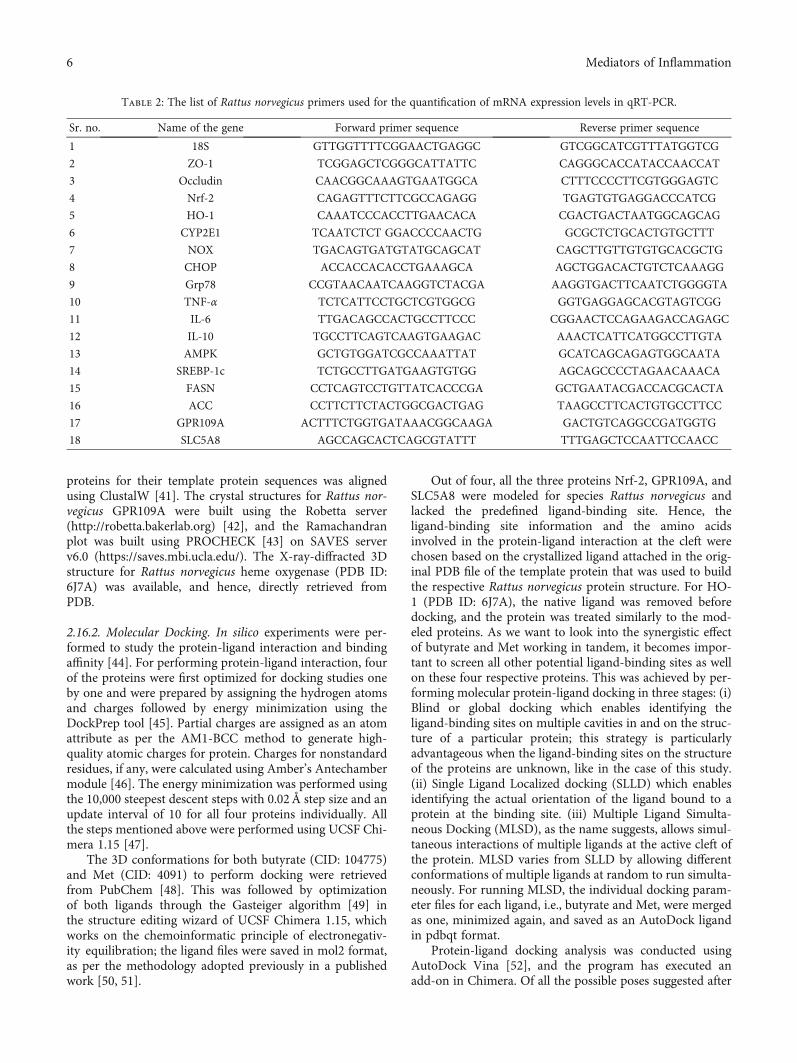
Table 2: The list of Rattus norvegicus primers used for the quantification of mRNA expression levels in qRT-PCR.
Sr. no. Name of the gene Forward primer sequence Reverse primer sequence
1 18S GTTGGTTTTCGGAACTGAGGC GTCGGCATCGTTTATGGTCG
2 ZO-1 TCGGAGCTCGGGCATTATTC CAGGGCACCATACCAACCAT
3 Occludin CAACGGCAAAGTGAATGGCA CTTTCCCCTTCGTGGGAGTC
4 Nrf-2 CAGAGTTTCTTCGCCAGAGG TGAGTGTGAGGACCCATCG
5 HO-1 CAAATCCCACCTTGAACACA CGACTGACTAATGGCAGCAG
6 CYP2E1 TCAATCTCT GGACCCCAACTG GCGCTCTGCACTGTGCTTT
7 NOX TGACAGTGATGTATGCAGCAT CAGCTTGTTGTGTGCACGCTG
8 CHOP ACCACCACACCTGAAAGCA AGCTGGACACTGTCTCAAAGG
9 Grp78 CCGTAACAATCAAGGTCTACGA AAGGTGACTTCAATCTGGGGTA
10 TNF-α TCTCATTCCTGCTCGTGGCG GGTGAGGAGCACGTAGTCGG
11 IL-6 TTGACAGCCACTGCCTTCCC CGGAACTCCAGAAGACCAGAGC
12 IL-10 TGCCTTCAGTCAAGTGAAGAC AAACTCATTCATGGCCTTGTA
13 AMPK GCTGTGGATCGCCAAATTAT GCATCAGCAGAGTGGCAATA
14 SREBP-1c TCTGCCTTGATGAAGTGTGG AGCAGCCCCTAGAACAAACA
15 FASN CCTCAGTCCTGTTATCACCCGA GCTGAATACGACCACGCACTA
16 ACC CCTTCTTCTACTGGCGACTGAG TAAGCCTTCACTGTGCCTTCC
17 GPR109A ACTTTCTGGTGATAAACGGCAAGA GACTGTCAGGCCGATGGTG
18 SLC5A8 AGCCAGCACTCAGCGTATTT TTTGAGCTCCAATTCCAACC
6 Mediators of Inflammation

docking both the ligands with an individual protein, the poseshowing maximum hydrogen bond-forming ability andminimum binding free energy change (kcal/mol) asobserved in the ViewDock window were chosen as thebest-docked pose. Best poses were then visualized in BIO-VIA Discovery Studio [53] for hydrogen bond formationby the functional groups of ligands with amino acids as partof the protein. The visualizer also suggested other support-ing hydrophobic interactions made by the ligands in the cav-ity of the protein.
3. Results
3.1. Combinatorial Treatment of Probiotic V and MetImproves the Increased Colon Weight to Length Ratio in theRat Model of Ethanol-Induced Intestinal Barrier Injury.Figure 1 shows decreased body weight (BW) and increasedcolon weight/length ratio in the ethanol-fed group as com-pared to the control group. Interestingly, administration ofprobiotic V and Met in combination significantly increasedthe BW and decreased the colon weight/length ratios com-pared to the ethanol-fed groups and individual treatmentof either probiotic V or Met. However, nonsignificant differ-ences were observed in the case of BW when compared tothe individual treatment of either probiotic V or Met.
3.2. Combinatorial Treatment of Probiotic V and MetImproves Histological Modification in Colon Tissue. Analysisof the HE-stained colon sections of control rats demon-strated the normal architecture of colon tissue with straighttubular glands lined by well-organized epithelial cells andlining as well as crypts of Lieberkühn. The vertically orientedcrypts were lined by columnar epithelial cells. The ethanol-fed group showed disorganized epithelial cells, deformedcrypts, and mucosal lining of colon. The surface area ofcrypts of Lieberkühn also showed remarkable reduction.
However, histological analysis of the ethanol-fed grouptreated with the combined administration of probiotic Vand Met showed histology similar to the normal group(Figure 2).
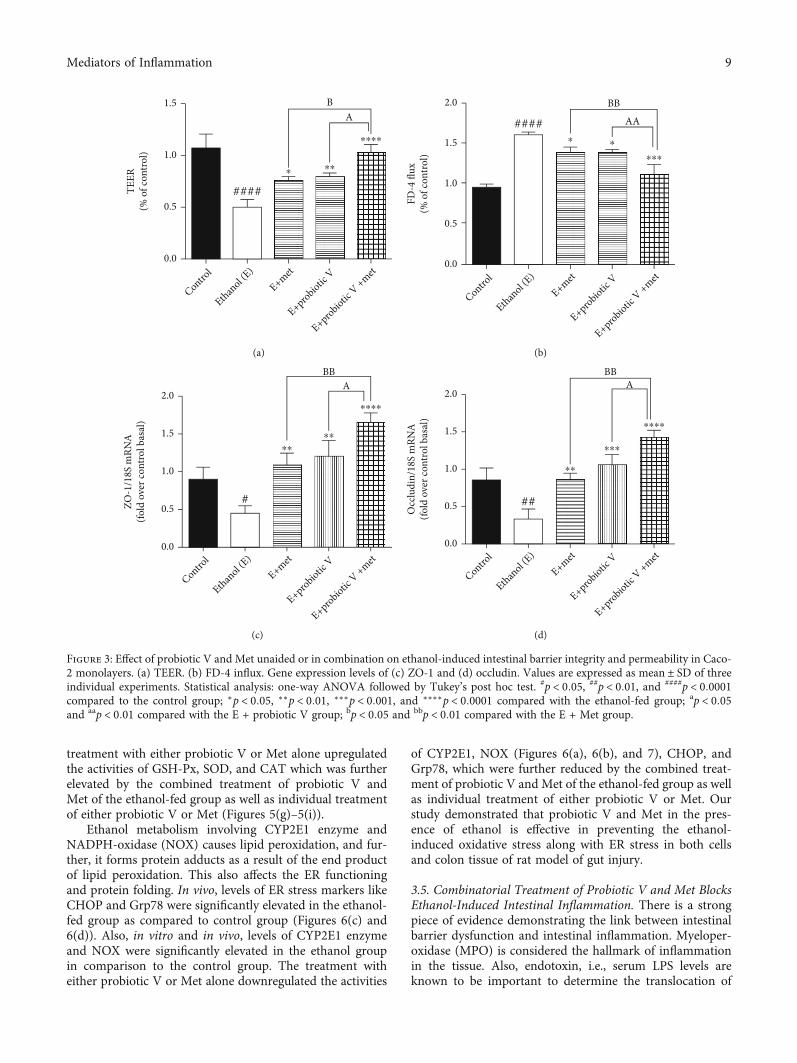
3.3. Combinatorial Treatment of Probiotic V and MetAttenuates Ethanol-Induced Disruption of TJ Expressionand Intestinal Barrier Dysfunction. TJs exert a crucial rolein preventing gut integrity. Concerning the gene expressionanalysis of TJ proteins including ZO-1 and occludin, thetranscriptions of both genes were significantly reduced inethanol-exposed Caco-2 monolayers (Figures 3(c) and3(d)) as well as the colon (Figures 4(b) and 4(c)). Theexpression of ZO-1 and occludin demonstrated an overalltrend of upregulation after the individual treatment of probi-otic V or Met, which was further more significantly upregu-lated by the two in the combinations.
In parallel, we also determined the combinatorial effectof probiotic V and Met on intestinal epithelial cell integrityin vitro and in vivo. In vitro, results showed that cellsexposed to ethanol showed a significant decrease in TEERmeasurement indicating ethanol markedly disrupts theintestinal epithelial barrier. However, the decreased TEERinduced by ethanol was significantly improved by the com-bined treatment of probiotic V and Met when comparedwith the ethanol-fed group as well as probiotic V- andMet-unaided groups (Figure 3(a)). Correspondingly, thecells incubated with ethanol greatly increased the FD-4 per-meation over that in the control group, which was signifi-cantly attenuated by the combined treatment of probioticV and Met in comparison to the ethanol group as well aseither the probiotic V- or Met- (p < 0:05) unaided groups(Figure 3(b)). In the in vivo model, mucosal permeabilityto FD-4 flux (Figure 4(a)) was higher in ethanol-fed ratscompared to the control group. Ethanol feeding, however,failed to increase FD-4 flux permeability and endotoxins
300
200Bo
dy w
eigh
t (g)
100
0
Control
Ethanol (E
)
E+met
E+probiotic V
E+probiotic V +met
⁎
#
⁎⁎
(a)
0Relat
ive c
olon
wei
ght/l
engt
h ra
tio
5
10
15
Control
Ethanol (E
)
E+met
E+probiotic V
E+probiotic V +met
####
⁎⁎⁎⁎⁎
⁎⁎⁎⁎
B
A
(b)
Figure 1: Effect of probiotic V and Met unaided or in combination on ethanol-induced gut dysbiosis. (a) Body weight. (b) Relative colonweight to length ratio. Values are expressed asmean ± SD of six rats. Statistical analysis: one-way ANOVA followed by Tukey’s post hoc test.#p < 0:05 and ####p < 0:0001 compared to the control group; ∗p < 0:05, ∗∗p < 0:01, ∗∗∗p < 0:001, and ∗∗∗∗p < 0:0001 compared with theethanol-fed group; ap < 0:05 compared with the E + probiotic V group; bp < 0:05 compared with the E + Met group.
7Mediators of Inflammation

levels, when administered with probiotic V or Met individu-ally. Moreover, combined administration of probiotic V andMet significantly decreased the FD-4 permeation comparedto the individual treatment of probiotic V or Met. Takentogether, the above results indicate that combined treatmentof probiotic V and Met restored the damaged TJs, and intes-tinal barrier function caused by the ethanol in an in-vitroand in-vivo model of intestinal barrier injury.
3.4. Combinatorial Treatment of Probiotic V and MetAttenuates Ethanol-Induced Intestinal Oxidative Stress. Toexplore the combined effect of probiotic V and Met on intes-tinal oxidative stress, we investigated the ROS generation onrat colon tissues. We observed that the production of ROSwas promoted manifestly by ethanol stimulation; mean-while, either individual treatment of probiotic V or Metnoticeably reduced the ROS accumulation, which was fur-ther dramatically diminished by the two in combination ascompared to the ethanol group as well as individual treat-ment of probiotic V or Met (Figure 5(a)). Increased ROSproduction caused lipid peroxidation, thus resulting in mal-ondialdehyde (MDA) generation.
Using HPLC, serum analysis of MDA levels showedhigher MDA content in the ethanol-fed group (83:48 ±0:89 nM/ml) compared to the control group (32:33 ± 0:82
nM/ml), indicating that severe oxidative stress occurreddue to ethanol. On the other hand, in the group with combi-natorial treatment of probiotic V and Met cotreated withethanol, the MDA content decreased to normal levels(37:08 ± 0:72 nM/ml) compared to the ethanol-fed groupas well as with either individual agent probiotic V (59:83 ±3:78 nM/ml) or Met (67:40 ± 1:94 nM/ml). The colonicMDA content in the rats was measured by the TBA method.The MDA concentration in ethanol-fed rats was found to be1:07 ± 0:06 μM/ml as compared to the control group(0:06 ± 0:01μM/ml). However, feeding the rats with probi-otic V and Met in combination along with the ethanolshowed reduced MDA levels to 0:22 ± 0:02 μM/ml comparedwith the ethanol-fed group as well as with either individualagent probiotic V (0:46 ± 0:04μM/ml) or Met (0:47 ± 0:05μM/ml) (Figures 5(b)–5(d)).
Under oxidative stress, transcription factor-like nuclearfactor-like 2 (Nrf2) and enzyme-like heme-oxygenase (HO-1) plays a role in the regulation of antioxidant machinery.Ethanol feeding caused a graphic reduction in expressionlevels for the Nrf-2 and HO-1 genes in colonic mucosa.The combined administration of probiotic V and Met signif-icantly increased the expression levels of Nrf-2 and HO-1compared to the ethanol-fed groups as well as the probioticV or Met-unaided groups (Figures 5(e) and 5(f)). The
(a) (b)
(c) (d) (e)
Figure 2: Effect of probiotic V and Met unaided or in combination on histopathological modifications in inhibiting the ethanol-inducedintestinal injury. (a) Gross examination of rat colon morphology (400x magnification). Microscopic images are as follows: (a) Controlrats supplemented with maltodextrin (substituted isocalorically). (b) Ethanol-fed rats supplemented with increasing concentrations ofethanol. (c) Met: ethanol-fed rats supplemented with 75mg/kg Met. (d) Probiotic V: ethanol-fed rats supplemented with probiotic V(108 CFU/day). (e) Probiotic V and Met: ethanol-fed rats supplemented with a mixture of probiotic V (108 CFU/day) and Met (75mg/kg).
8 Mediators of Inflammation
treatment with either probiotic V or Met alone upregulatedthe activities of GSH-Px, SOD, and CAT which was furtherelevated by the combined treatment of probiotic V andMet of the ethanol-fed group as well as individual treatmentof either probiotic V or Met (Figures 5(g)–5(i)).
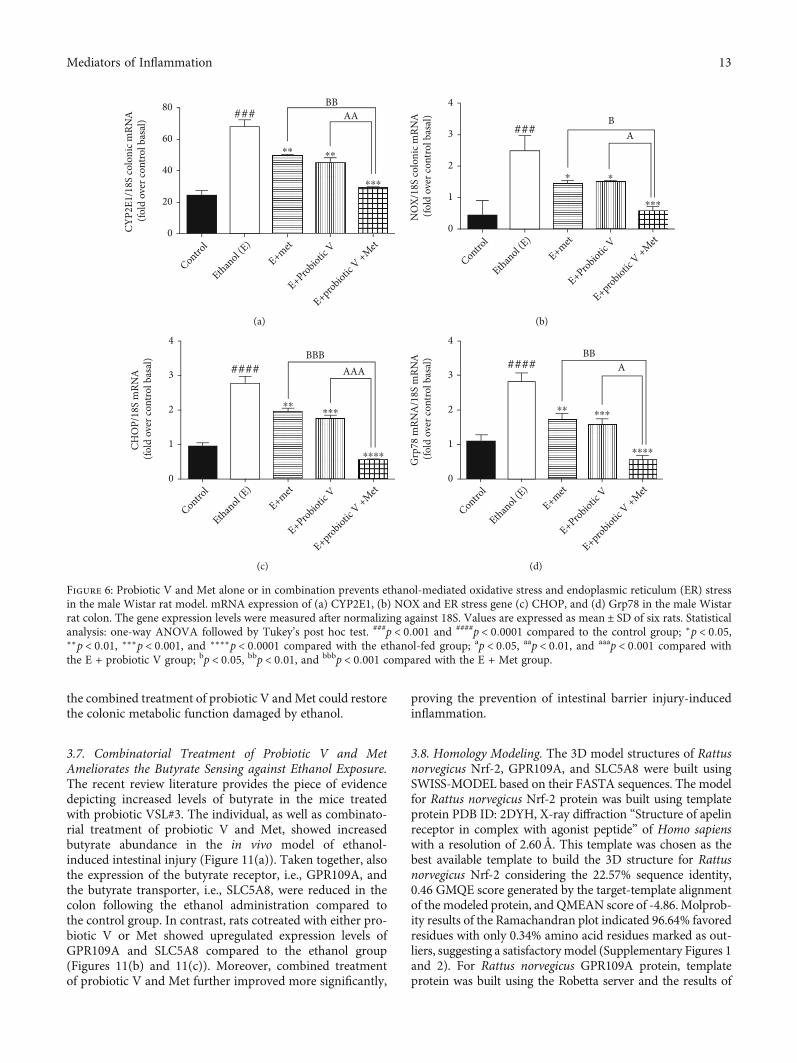
Ethanol metabolism involving CYP2E1 enzyme andNADPH-oxidase (NOX) causes lipid peroxidation, and fur-ther, it forms protein adducts as a result of the end productof lipid peroxidation. This also affects the ER functioningand protein folding. In vivo, levels of ER stress markers likeCHOP and Grp78 were significantly elevated in the ethanol-fed group as compared to control group (Figures 6(c) and6(d)). Also, in vitro and in vivo, levels of CYP2E1 enzymeand NOX were significantly elevated in the ethanol groupin comparison to the control group. The treatment witheither probiotic V or Met alone downregulated the activities
of CYP2E1, NOX (Figures 6(a), 6(b), and 7), CHOP, andGrp78, which were further reduced by the combined treat-ment of probiotic V and Met of the ethanol-fed group as wellas individual treatment of either probiotic V or Met. Ourstudy demonstrated that probiotic V and Met in the pres-ence of ethanol is effective in preventing the ethanol-induced oxidative stress along with ER stress in both cellsand colon tissue of rat model of gut injury.
3.5. Combinatorial Treatment of Probiotic V and Met BlocksEthanol-Induced Intestinal Inflammation. There is a strongpiece of evidence demonstrating the link between intestinalbarrier dysfunction and intestinal inflammation. Myeloper-oxidase (MPO) is considered the hallmark of inflammationin the tissue. Also, endotoxin, i.e., serum LPS levels areknown to be important to determine the translocation of
1.5
1.0
TEER
(% o
f con
trol)
0.5
0.0
Control
Ethanol (E
)E+met
E+probiotic V
E+probiotic V +met
BA
####
⁎⁎⁎
⁎⁎⁎⁎
(a)
FD-4
flux
(% o
f con
trol)
0.0
0.5
1.0
1.5
2.0
Control
Ethanol (E
)E+met
E+probiotic V
E+probiotic V +met
BB
AA####
⁎ ⁎
⁎⁎⁎
(b)
ZO-1
/18S
mRN
A(fo
ld o
ver c
ontro
l bas
al)
0.0
0.5
1.0
1.5
2.0
Control
Ethanol (E
)E+met
E+probiotic V
E+probiotic V +met
ABB
#
⁎⁎
⁎⁎
⁎⁎⁎⁎
(c)
Occ
ludi
n/18
S m
RNA
(fold
ove
r con
trol b
asal
)
0.0
0.5
1.0
1.5
2.0
Control
Ethanol (E
)E+met
E+probiotic V
E+probiotic V +met
ABB
##
⁎⁎
⁎⁎⁎
⁎⁎⁎⁎
(d)
Figure 3: Effect of probiotic V and Met unaided or in combination on ethanol-induced intestinal barrier integrity and permeability in Caco-2 monolayers. (a) TEER. (b) FD-4 influx. Gene expression levels of (c) ZO-1 and (d) occludin. Values are expressed as mean ± SD of threeindividual experiments. Statistical analysis: one-way ANOVA followed by Tukey’s post hoc test. #p < 0:05, ##p < 0:01, and ####p < 0:0001compared to the control group; ∗p < 0:05, ∗∗p < 0:01, ∗∗∗p < 0:001, and ∗∗∗∗p < 0:0001 compared with the ethanol-fed group; ap < 0:05and aap < 0:01 compared with the E + probiotic V group; bp < 0:05 and bbp < 0:01 compared with the E + Met group.
9Mediators of Inflammation

bacterial products and intestinal permeability. In the currentstudy, we observed that colonic MPO activity and serumLPS levels were significantly upregulated in ethanol-fed ratscompared to control rats. Ethanol-fed rat co-treated witheither probiotic V or Met showed reduced colonic MPOactivity (Figure 8(a)) and serum LPS levels (Figure 8(b))compared to the ethanol groups, which were more signifi-cantly reduced by the combinatorial treatment of probioticV and Met.
Similarly, by analyzing the gene expression by qRT-PCR,we found that the ethanol group showed an elevation in theexpression levels of proinflammatory genes like TNF-α andIL-6, compared to the control group. Downregulation ofanti-inflammatory expression levels of IL-10 was observedin the ethanol group. Treatment with either probiotic V orMet fundamentally switched all the expression levels, i.e.,decreased expression levels of TNF-α and IL-6, as well asincreased expression levels of IL-10, when compared with
the ethanol group, which was equally improved by the com-binatorial treatment when compared with either individualtreatment of probiotic V or Met (Figures 8(c)–8(e) and 9).The results suggest that combined treatment of probiotic Vand Met can prevent ethanol-induced intestinal inflamma-tion by regulating the levels of TNF-α and IL-6 in anin vitro and in vivo model of intestinal barrier injury.
3.6. Combinatorial Treatment of Probiotic V and MetRegulates the Lipid Metabolism in the Colonic Mucosa ofthe Rat Model. To determine the combined effect of probi-otic V and Met in protecting the intestinal barrier, we deter-mined the adenosine monophosphate-activated proteinkinase (AMPK) levels. Indeed, chronic alcohol consumptionleads to abnormal lipid metabolism in the colonic mucosa bydecreased AMPK activation which leads to increased sterolregulatory element-binding protein 1c (SREBP-1c) (also akey regulator of lipid metabolism) expression, further
⁎⁎
⁎⁎⁎⁎
⁎⁎⁎
####
Control
Ethanol (E
)E+met
E+probiotic V
E+probiotic V +met
0.0
0.5
1.0
1.5
BBBAA
FD-4
flux
(% o
f con
trol)
(a)
⁎⁎⁎⁎
⁎⁎⁎⁎
###
Control
Ethanol (E
)E+met
E+probiotic V
E+probiotic V +met
AB
0.0
0.5
1.0
1.5
ZO-1
/18S
mRN
A(fo
ld o
ver c
ontro
l bas
al)
(b)
⁎⁎
⁎⁎⁎⁎
⁎⁎⁎
###
Control
Ethanol (E
)E+met
E+probiotic V
E+probiotic V +met
AAABB
0.0
Occ
ludi
n/18
S m
RNA
(fold
ove
r con
trol b
asal
)
0.5
1.0
1.5
(c)
Figure 4: Effect of probiotic V and Met alone or in combination on ethanol-induced intestinal barrier integrity in the Wistar rat model. (a)Percentage of FD-4 permeation. TJ protein expression of (b) ZO-1 and (c) occludin. Values are expressed asmean ± SD of six rats. Statisticalanalysis: one-way ANOVA followed by Tukey’s post hoc test. ###p < 0:001 and ####p < 0:0001 compared to the control group; ∗∗p < 0:01,∗∗∗p < 0:001, and ∗∗∗∗p < 0:0001 compared with the ethanol-fed group; ap < 0:05, aap < 0:01, and aaap < 0:001 compared with the E +probiotic V group; bp < 0:05, bbp < 0:01, and bbbp < 0:001 compared with the E + Met group.
10 Mediators of Inflammation

Control
Ethanol (E
)E+met
E+probiotic V
E+probiotic V +met
0
50000
100000
ROS
gene
ratio
n(fl
uore
scen
ce in
tens
ity)
150000 BB
A###
⁎⁎
⁎⁎
⁎⁎⁎⁎
(a)
Control
Ethanol (E
)E+met
E+probiotic V
E+probiotic V +met
Seru
m M
DA
conc
entr
atio
n(n
m/m
l)
AAAABBB
100
80
60
40
20
0
####
⁎⁎⁎⁎⁎
⁎⁎⁎⁎
(b)
Control
Ethanol (E
)E+met
E+probiotic V
E+probiotic V +met
Col
onic
MD
A co
ncen
trat
ion
(μm
/ml)
BBAAA
1.5
1.0
0.5
0.0
####
⁎⁎⁎
⁎⁎⁎
⁎⁎⁎⁎
(c)
0.0450.0400.0350.0300.0250.0200.0150.0100.0050.000
13.3
34
0.00 2.00 4.00 6.00 8.00 10.00
Minutes
12.00
AU
14.00 16.00 18.00
13.3
34
13.3
50
0.0450.0500.055
0.0400.0350.0300.0250.0200.0150.0100.0050.000
AU
0.00 2.00 4.00 6.00 8.00 10.00
Minutes
12.00 14.00 16.00 18.00 20.00
13.3
50
0.024
13.3
520.0220.0200.0180.0160.0140.0120.0100.0080.0060.0040.0020.000
AU
0.00 2.00 4.00 6.00 8.00 10.00
Minutes
12.00 14.00 16.00 18.00
13.3
52 0.045
13.3
41
0.0400.0350.0300.0250.0200.0150.0100.0050.000
AU
0.00 2.00 4.00 6.00 8.00 10.00
Minutes
12.00 14.00 16.00 18.00
13.3
41
13.3
55
0.0400.0350.0300.0250.0200.0150.0100.0050.000
AU
0.00 2.00 4.00 6.00 8.00 10.00
Minutes
12.00 14.00 16.00 18.00
13.3
55
13.3
53
0.000
0.010
0.020
0.030
0.040
0.050
0.060
0.070
AU
0.00 2.00 4.00 6.00 8.00 10.00
Minutes
12.00 14.00 16.00 18.00
13.3
53
(d)
Figure 5: Continued.
11Mediators of Inflammation

remarkably increasing lipogenesis by activating the down-stream lipogenic genes, i.e., acetyl-CoA carboxylase (ACC)and fatty acid synthase (FAS) in ethanol-fed rats. ProbioticV or Met-unaided treatment upregulated the AMPK levelsand lipid metabolism regulator, which is another way ofbeing inhibited in the presence of ethanol. AMPK activationinhibits the expression of transcription factor, i.e., SREBP-1c, thereby preventing ethanol-induced lipogenesis. Consis-tent with the changed expression of SREBP-1c, the combina-tion of probiotic V and Met also showed reduced expression
levels of ACC and FAS as compared to the ethanol group,which was remarkably reduced as compared to individualtreatment of probiotic V or Met (Figures 10(a)–10(d)).
Also, colonic contents of total cholesterol (TC) and tri-glyceride (TG) in the ethanol-fed rats, were significantlyupregulated compared to those in the control group,which were significantly reduced in the combinatorial treat-ment of probiotic V and Met in comparison to the ethanol-fed group as well as the probiotic V or Met-unaided group(Figures 10(e) and 10(f)). The above results depicted that
###
0
1
2
3
⁎⁎ ⁎⁎
⁎⁎⁎
BA
Nrf–
2/ 1
8S m
RNA
(fold
ove
r con
trol b
asal
)
Control
Ethanol (E
)E+met
E+probiotic V
E+probiotic V+Met
(e)
#
⁎⁎⁎ ⁎⁎⁎
⁎⁎⁎⁎
BBAAA
Control
Ethanol (E
)E+met
E+probiotic V
E+probiotic V+Met
0.0
0.5
1.0
1.5
2.0
2.5
HO
–1/1
8s m
RNA
(fold
ove
r con
trol b
asal
)
(f)
⁎⁎
⁎⁎⁎⁎
BBBAAA
Control
Ethanol (E
)E+met
E+probiotic V
E+probiotic V+Met
####
0
200
400
600
800
1000
⁎
GSH
– (U
/mg
prot
ein)
(g)
⁎⁎
⁎⁎⁎⁎
BA
Control
Ethanol (E
)E+met
E+probiotic V
E+probiotic V+Met
####
0
500
1000
1500
1000
⁎⁎
SOD
(U/m
g pr
otei
n) ⁎⁎ ⁎⁎
(h)
⁎
⁎⁎⁎
BA
Control
Ethanol (E
)E+met
E+probiotic V
E+probiotic V+Met
###
0
10
20
30
40
50
⁎
CAT
(U/m
g pr
otei
n)
(i)
Figure 5: Probiotic V and Met unaided or in combination prevent ethanol-mediated ROS production and oxidative stress in ethanol-induced intestinal injury. (a) Fluorescence spectroscopy with excitation/emission wavelengths at 485 nm/525 nm after incubation withcarboxy-H2-DCFDA. (b) Total serum MDA levels. Here, the MDA levels in serum were quantified with reference to the standard areaunder the curve (AUC). (c) Total MDA concentration in colon tissue. The MDA content was quantified using the TBA assay method.(d) HPLC chromatograms of total serum MDA after DNPH derivatization in (a) standard, (b) control, (c) ethanol-fed, (d) Met(75mg/kg) + ethanol-fed, (e) probiotic V (108 CFU/day) + ethanol-fed, and (f) probiotic V (108 CFU/day) + Met (75mg/kg) + ethanol-fed rats. The amount of MDA present in serum was estimated after processing and DNPH derivatization. The serum sample afterderivatization was then analyzed by a Shimadzu HPLC instrument using a fully end-capped spherical ODS2 C18 reverse-phase HPLCcolumn. For the mobile phase, acetonitrile-distilled water with a ratio of 38 : 62 consisting of 0.2% glacial acetic acid was used. Colonicexpression of antioxidants (e) Nrf-2, (f) HO-1, (g) GSH-Px, (h) SOD, and (i) CAT. The gene expression levels were measured afternormalizing against 18S. Values are expressed as mean ± SD of six rats. Statistical analysis: one-way ANOVA followed by Tukey’s posthoc test. #p < 0:05, ###p < 0:001, and ####p < 0:0001 compared to the control group; ∗p < 0:05, ∗∗p < 0:01, ∗∗∗p < 0:001, and ∗∗∗∗p < 0:0001compared with the ethanol-fed group; ap < 0:05, aaap < 0:001, and aaaap < 0:0001 compared with the E + probiotic V group; bp < 0:05,bbp < 0:01, and bbbp < 0:001 compared with the E + Met group.
12 Mediators of Inflammation
the combined treatment of probiotic V andMet could restorethe colonic metabolic function damaged by ethanol.
3.7. Combinatorial Treatment of Probiotic V and MetAmeliorates the Butyrate Sensing against Ethanol Exposure.The recent review literature provides the piece of evidencedepicting increased levels of butyrate in the mice treatedwith probiotic VSL#3. The individual, as well as combinato-rial treatment of probiotic V and Met, showed increasedbutyrate abundance in the in vivo model of ethanol-induced intestinal injury (Figure 11(a)). Taken together, alsothe expression of the butyrate receptor, i.e., GPR109A, andthe butyrate transporter, i.e., SLC5A8, were reduced in thecolon following the ethanol administration compared tothe control group. In contrast, rats cotreated with either pro-biotic V or Met showed upregulated expression levels ofGPR109A and SLC5A8 compared to the ethanol group(Figures 11(b) and 11(c)). Moreover, combined treatmentof probiotic V and Met further improved more significantly,
proving the prevention of intestinal barrier injury-inducedinflammation.
3.8. Homology Modeling. The 3D model structures of Rattusnorvegicus Nrf-2, GPR109A, and SLC5A8 were built usingSWISS-MODEL based on their FASTA sequences. The modelfor Rattus norvegicus Nrf-2 protein was built using templateprotein PDB ID: 2DYH, X-ray diffraction “Structure of apelinreceptor in complex with agonist peptide” of Homo sapienswith a resolution of 2.60Å. This template was chosen as thebest available template to build the 3D structure for Rattusnorvegicus Nrf-2 considering the 22.57% sequence identity,0.46 GMQE score generated by the target-template alignmentof the modeled protein, and QMEAN score of -4.86. Molprob-ity results of the Ramachandran plot indicated 96.64% favoredresidues with only 0.34% amino acid residues marked as out-liers, suggesting a satisfactorymodel (Supplementary Figures 1and 2). For Rattus norvegicus GPR109A protein, templateprotein was built using the Robetta server and the results of
80
60
40
20
0
Control
Ethanol (E
)E+met
E+probiotic V +Met
E+Probiotic V
BBAA
CYP2
E1/1
8S co
loni
c mRN
A
(fold
ove
r con
trol b
asal
)
###
⁎⁎⁎⁎
⁎⁎⁎
(a)
0
4
3
2
1
Control
Ethanol (E
)E+met
E+probiotic V +Met
E+Probiotic V
###
NO
X/18
S co
loni
c mRN
A
(fold
ove
r con
trol b
asal
) BA
⁎ ⁎
⁎⁎⁎
(b)
4
3
2
1
0
Control
Ethanol (E
)E+met
E+probiotic V +Met
E+Probiotic V
BBBAAA####
CHO
P/18
S m
RNA
(fol
d ov
er co
ntro
l bas
al)
⁎⁎⁎⁎
⁎⁎⁎⁎⁎
(c)
4
3
2
1
0
Control
Ethanol (E
)E+met
E+probiotic V +Met
E+Probiotic V
####
BBA
Grp
78 m
RNA
/18S
mRN
A (f
old
over
cont
rol b
asal
)
⁎⁎⁎⁎
⁎⁎⁎⁎⁎
(d)
Figure 6: Probiotic V and Met alone or in combination prevents ethanol-mediated oxidative stress and endoplasmic reticulum (ER) stressin the male Wistar rat model. mRNA expression of (a) CYP2E1, (b) NOX and ER stress gene (c) CHOP, and (d) Grp78 in the male Wistarrat colon. The gene expression levels were measured after normalizing against 18S. Values are expressed as mean ± SD of six rats. Statisticalanalysis: one-way ANOVA followed by Tukey’s post hoc test. ###p < 0:001 and ####p < 0:0001 compared to the control group; ∗p < 0:05,∗∗p < 0:01, ∗∗∗p < 0:001, and ∗∗∗∗p < 0:0001 compared with the ethanol-fed group; ap < 0:05, aap < 0:01, and aaap < 0:001 compared withthe E + probiotic V group; bp < 0:05, bbp < 0:01, and bbbp < 0:001 compared with the E + Met group.
13Mediators of Inflammation

Ramachandran plot were obtained using PROCHECK whichindicated 92.3% favored residues with only 7.7% residues ina generously allowed region and 0.0% residues in disallowedregions (Supplementary Figures 3, 4, and 5). All thesemarkers help us to predict that the proposed models areideal modeled proteins for docking. Similarly, the model forRattus norvegicus SLC5A8 was built using template proteinPDB ID: 5NVA, an X-ray diffraction structure of “Substrate-bound outward-open state of a Na+-coupled sialic acidsymporter reveals a novel Na+-site” of organism Proteusmirabilis HI4320 with a resolution of 2.26Å. This templatewas chosen as the best available template to build the 3Dstructure for Rattus norvegicus SLC5A8 considering the25.28% sequence identity, 0.52 GMQE score generated bythe target-template alignment of the modeled protein, andQMEAN score of -5.94. The results for sequence identityand QMEAN Z-score indicate a low model quality.However, the Molprobity results of the Ramachandran plotindicated 95.97% favored residues with only 1.57% aminoacid residues marked as outliers (Supplementary Figures 6, 7,and 8). Therefore, this proposed model was considered as anideal modeled protein for Rattus norvegicus SLC5A8 and waschosen for molecular docking.
3.9. Molecular Docking. The coordinates of the ligand-binding site on four of the proteins were determined usingblind/global docking. With no prior ligand interaction pro-file, grid maps were prepared by fixing the grid box on theentire structure of the protein. Optimal pose within confor-mation of the target protein–ligand-binding sites were notedfor both Met and butyrate on each of the proteins. It is to benoted that blind docking is more demanding in terms ofcomputational time and the results are less accurate but helpto predict the affinity of the ligand candidates in their opti-mal pose within the target protein. The single ligand local-ized docking strategy was then implemented to identify the
exact orientation of the ligand on the protein and to validatethe accuracy of the optimized pose in the identified bindingcleft. As seen in Table 3, the Robetta-modeled Nrf-2 interac-tion with Met had a binding affinity of -6.0 kcal/mol, involv-ing residues ILE: 559, VAL: 606, GLY: 367, GLY: 418, VAL:512, and VAL: 465; with butyrate, it had a binding affinity of-3.4 kcal/mol, involving residues GLY: 605, ILE: 559, GLY:367, and VAL: 606 (Figures 12(a) and 12(b)). HO-1 interac-tion with Met had a binding affinity of -5.7 kcal/mol, involv-ing residues TYR: 286, ILE: 419, SER: 418, GLU: 565, HIS:620, and GLU: 623; with butyrate, it had a binding affinityof -4.7 kcal/mol, involving residues ALA: 272, SER: 267,GLN: 268, TYR: 321, and THR: 269 (Figures 13(a) and13(b)). The modeled GPR109A interaction with Met had abinding affinity of -4.9 kcal/mol, involving residues ASN:321, ASN: 320, ARG: 308, SER: 323, THR: 324, and ARG:311; with butyrate, it had a binding affinity of -3.4 kcal/mol,involving residues ILE: 162, ALA: 142, ASN: 65, PHE: 64,TRP: 56 (Figures 14(a) and 14(b)). Lastly, modeled SLC5A8interaction with metformin had a binding affinity of-5.1 kcal/mol, involving residues GLN: 249, PHE: 458, andGLY: 462; with butyrate, it had a binding affinity of-4.7 kcal/mol, involving residues GLN: 82, and THR: 63(Figures 15(a) and 15(b)). The results for MLSD reveal thatNrf-2 interaction with Met and butyrate had a simultaneousbinding affinity of -9.7 kcal/mol, involving residues ASN:321, VAL: 463, VAL: 604 LEU: 365, and LEU: 557 withMet, and ILE: 559, GLY: 367, and GLY: 558 with butyrate(Figure 12(c)). HO-1 interaction with Met and butyratehad a simultaneous binding affinity of -8.9 kcal/mol, involv-ing residues GLU: 402, GLU: 623, LEU: 624, and LEU: 625with Met, and PHE: 699, THR: 188, THR: 703, LYS: 700,and HIS: 803 with butyrate (Figure 13(c)). GPR109A inter-action with Met and butyrate had a simultaneous bindingaffinity of -9.7 kcal/mol, involving residues ASN: 321, ASN:320, ARG: 308, SER: 323, THR: 324, and ARG: 311 with
8
BA
CYP2
E1/1
8S m
RNA
(fold
ove
r con
trol b
asal
)
6
4
2
0
Control
Ethanol (E
)E+met
E+probiotic V
E+probiotic V +met
⁎⁎⁎⁎
⁎⁎⁎⁎
####
(a)
BB
AA
2.5
2.0
1.5
1.0
0.5
0.0
NO
X/18
S m
RNA
(fold
ove
r con
trol b
asal
)
Control
Ethanol (E
)E+met
E+probiotic V
E+probiotic V +met
⁎⁎⁎⁎⁎⁎
⁎⁎⁎⁎
###
(b)
Figure 7: Probiotic V and Met alone or in combination prevents ethanol-mediated oxidative stress in Caco-2 monolayer cells. mRNAexpression of (a) CYP2E1 and (b) NOX. The gene expression levels were measured after normalizing against 18S. Values are expressedas mean ± SD of three individual experiments. Statistical analysis: one-way ANOVA followed by Tukey’s post hoc test. ###p < 0:001 and####p < 0:0001 compared to the control group. ∗∗p < 0:01, ∗∗∗p < 0:001, and ∗∗∗∗p < 0:0001 compared with the ethanol-fed group;ap < 0:05 and aap < 0:01 compared with the E + probiotic V group; bp < 0:05 and bbp < 0:01 compared with the E + Met group.
14 Mediators of Inflammation

Met, and ILE: 162, ALA: 142, ASN: 65, PHE: 64, and TRP:56 with butyrate (Figure 14(c)). SLC5A8 interaction withMet and butyrate had a simultaneous binding affinity of-8.3 kcal/mol, involving residues GLN: 249, GLY: 412,and GLY: 242 with metformin, and GLN: 82, THR: 63,and VAL: 281 with butyrate (Figure 15(c)). Docking con-formations were evaluated using these precalculated gridmaps to enhance the robustness of docking. Binding ener-gies and amino acid interaction for both the ligands aredescribed in Table 3. There were several hydrophobicinteractions such as alkyl and pi-alkyl bond formationoccurring in the hydrophobic active site that is describedin Figures 16, 17, 18, and 19.
4. Discussion
The effect of alcohol at the pathophysiological level contrib-utes to a leaky gut or dysbiosis leading to intestinal hyper-permeability of intestinal bacteria [7, 8, 54]. Understandingthe pathophysiological mechanism behind the ethanol-induced intestinal barrier dysfunction, as the present studyexecuted, is considered to be significant with regard to bio-logical and clinical manifestationbecause disruption of intes-tinal barrier integrity, called a leaky gut syndrome, isreflected to be one of the chief mechanisms involved inalcohol-mediated endotoxemia in the progression of ALD.Despite extensive research over the past decade, the
⁎⁎
⁎⁎⁎
AAA
Control
Ethanol (E
)
E+met
E+probiotic V
E+probiotic V+met
###
0
6
4
2
8
10
⁎
Uni
ts/m
g pr
otei
n
BB
(a)
⁎⁎
⁎⁎⁎⁎
A####
0.0
0.5
1.0
1.5
⁎⁎
B
Seru
m L
PS (E
U/m
l)
E+probiotic V+met
E+probiotic V
E+met
Ethanol (E
)
Control
⁎⁎⁎⁎
(b)
Control
Ethanol (E
)
E+met
E+probiotic V
E+probiotic V+Met
0
1
2
3
4
5
TNF–
/18S
colo
nic m
RNA
(fold
ove
r con
trol
bas
al)
####
⁎⁎⁎⁎
⁎⁎⁎⁎
AAABBB
(c)
⁎⁎
⁎⁎⁎
A
Control
Ethanol (E
)E+met
E+probiotic V
E+probiotic V+Met
####
0
4
3
2
1
⁎
IL–6
/18S
colo
nic m
RNA
(fold
ove
r con
trol b
asal
)
B
⁎⁎⁎
(d)
⁎⁎⁎⁎
⁎⁎⁎⁎⁎⁎
6
4
2
0
IL–1
0/18
S co
loni
c mRN
A(fo
ld o
ver c
ontr
ol b
asal
)
Control
Ethanol (E
)
E+met
E+probiotic V
E+probiotic V+Met
#
AAABB
⁎⁎⁎⁎⁎⁎
(e)
Figure 8: Probiotic V and Met alone or in combination inhibits ethanol-induced intestinal inflammation in the male Wistar rat model. (a)Effect on the myeloperoxidase activities in the colon. (b) Effect on the LPS levels in the blood. The inflammatory gene levels in the maleWistar rat colon of (c) TNF-α and (d) IL-6 and anti-inflammatory gene level of (e) IL-10. The gene expression levels were measuredafter normalizing against 18S. Values are expressed as mean ± SD of six rats. Statistical analysis: one-way ANOVA followed by Tukey’spost hoc test. #p < 0:05, ###p < 0:001, and ####p < 0:0001 compared to the control group; ∗p < 0:05, ∗∗p < 0:01, ∗∗∗p < 0:001, and ∗∗∗∗p <0:0001 compared with the ethanol-fed group; ap < 0:05 and aaap < 0:001 compared with the E + probiotic V group; bp < 0:05, bbp < 0:01,and bbbp < 0:001 compared with the E + Met group.
15Mediators of Inflammation

molecular mechanisms for ethanol-induced intestinal bar-rier integrity dysfunction have remained unsuccessfullyunderstood. During acute or chronic alcohol consumption,colon tissue has consistently been targeted.
At present, there are no available FDA-approved treat-ments to halt or cure alcoholic liver injury. Abstinence fromdrinking alcohol is known to be the only way to limit ALDdevelopment and progression. At this time, available treat-ments are single, and the ameliorative effect is not ideal[55]. One such individual known therapy is probiotics whichprotect against alcohol-induced gut leakiness [20]. For thefirst time, the current study proved the protective effect ofMet against alcohol-induced gut leakiness. However, com-bined treatment of effective therapies can provide differentlinks and targets to treat or prevent ethanol-induced gut dys-biosis through modulating intestinal mucosal barrier integ-rity, intestinal epithelial permeability, gut oxidation, andinflammatory response. Therefore, the current study cogi-tated that probiotic V in combination with Met couldremarkably prevent the development of ethanol-inducedintestinal barrier injury.
Recent studies demonstrated that chronic alcohol drink-ing leads to intestinal barrier dysfunction, increased intesti-nal permeability, and endotoxemia, which are consideredto be initial events of ALD progression [56, 57]. The entirepermeability of colon and Caco-2 monolayers were mea-sured in the current study investigating the potential protec-tive effect of combined treatment of probiotic V and Met onalcohol-induced intestinal mucosal barrier injury in bothin vitro and in vivomodels. Our results are following numer-ous studies, where Caco-2 monolayers and rat colonic epi-
thelium presented decreased TEER (%) and increasedcolonic mucosal permeability to FITC-inulin was observedin the ethanol group, which indicates that ethanol caninduce substantial damage to the colon as seen in bothin vitro and in vivo models [58, 59]. Studies reported thatadministration of probiotic VSL#3 decreased the ethanol-induced epithelial permeability [60]. Also, supplementationof L. plantarum improves the colonic mucosal barrier dys-function induced by the ethanol-fed diet [20]. The reportshowed reduced TEER and FITC-dextran hyperpermeabilitywith Met treatment in a dextran sodium sulfate- (DSS-)induced colitis model [24]. In accordance with the aboveresults, our results also demonstrated that coadministrationof probiotic V and Met significantly prevented the decreasedlevels of TEER and intestinal hyperpermeability induced byethanol indicating the combinatorial treatment completelyblocks the ethanol-induced intestinal barrier dysfunction.
Several studies reported that alcohol and/or its metabo-lite (i.e., acetaldehyde) causes intestinal mucosal barrier dys-function through alterations in TJ proteins [61, 62]. Theinterplay between ZO-1 and occludin is crucial for theassembly and preservation of TJs as well as the developmentof mucosal barrier function [63]. Occludin is the first identi-fied and integral membrane TJ protein, which plays animportant role in maintaining the barrier function andstructural integrity of TJs [64]. Also, ZO-1 is a cytoskeletallinker protein that forms cross-links with other transmem-brane proteins like occludins, necessary for the connectionof other TJ proteins to the cytoskeleton [65]. The reportdemonstrated that the administration of 40mM ethanol toCaco-2 monolayers disrupted the TJs, specifically occludins
2.5
2.0
1.5
1.0
0.5
0.0
Control
Ethanol (E
)
E+Met
E+probiotic V +Met
E + probiotic V
TNF
–α/1
8s m
RNA
(fol
d ov
er co
ntro
l bas
al)
BB
A###
⁎ ⁎
⁎⁎⁎⁎⁎⁎
(a)
2.5
2.0
1.5
1.0
0.5
0.0
Control
Ethanol (E
)E+Met
E+probiotic V +Met
E + probiotic V
IL –
6/18
S m
RNA
(fo
ld o
ver c
ontro
l bas
al)
BB
A⁎
⁎⁎
⁎⁎⁎
###
(b)
1.5
1.0
0.5
0.0
Control
Ethanol (E
)
E+Met
E+probiotic V +Met
E + probiotic V
IL –
10/1
8S m
RNA
(fo
ld o
ver c
ontro
l bas
al)
BA
⁎⁎ ⁎⁎
⁎⁎⁎⁎
###
⁎⁎ ⁎⁎
(c)
Figure 9: Probiotic V and Met alone or in combination inhibits ethanol-induced intestinal inflammation in the Caco-2 monolayers.Inflammatory gene levels of (a) TNF-α and (b) IL-6 and anti-inflammatory gene level of (c) IL-10. The gene expression levels weremeasured after normalizing against 18S. Values are expressed as mean ± SD of three individual experiments. Statistical analysis: one-wayANOVA followed by Tukey’s post hoc test. ###p < 0:001 compared to the control group; ∗p < 0:05, ∗∗p < 0:01, ∗∗∗p < 0:001, and ∗∗∗∗p <0:0001 compared with the ethanol-fed group; ap < 0:05 compared with the E + probiotic V group; bp < 0:05 and bbp < 0:01 comparedwith the E + Met group.
16 Mediators of Inflammation

###
⁎⁎⁎⁎
⁎⁎
⁎⁎
BA1.5
AM
PK/1
8S co
loni
c mRN
A(fo
ld o
ver c
ontro
l bas
al)
Control
Ethanol (E
)E+met
E+probiotic V
E+probiotic V +met
1.0
0.5
0.0
(a)
###
⁎
⁎⁎⁎
⁎
BBA
SREB
P-1c
/18S
colo
nic m
RNA
(fold
ove
r con
trol b
asal
)
2.5
Control
Ethanol (E
)E+met
E+probiotic V
E+probiotic V +met
2.0
1.5
1.0
0.5
0.0
(b)
####
⁎⁎⁎⁎
⁎⁎⁎⁎⁎⁎
BBBAA
FASN
//18S
colo
nic m
RNA
(fold
ove
r con
trol b
asal
)
3
2
1
0
Control
Ethanol (E
)E+met
E+probiotic V
E+probiotic V +met
(c)
####
⁎⁎⁎
⁎⁎⁎⁎
⁎⁎⁎
BB
AA
ACC/
18S
colo
nic m
RNA
(fold
ove
r con
trol b
asal
)
Control
Ethanol (E
)E+met
E+probiotic V
E+probiotic V +met
3
2
1
0
(d)
###
⁎⁎⁎⁎
⁎⁎⁎⁎
B
A
Tota
l cho
leste
rol i
n co
lon
(mg/
g)
20
15
10
5
0
Control
Ethanol (E
)E+met
E+probiotic V
E+probiotic V +met
25
(e)
####
⁎⁎⁎⁎
⁎⁎
BB
AA
Trig
lyce
ride i
n co
lon
(mg/
g)
30
20
Control
Ethanol (E
)E+met
E+probiotic V
E+probiotic V +met
10
0
(f)
Figure 10: Probiotic V and Met unaided or in combination regulate the lipid accumulation in the colon to prevent ethanol-inducedintestinal injury. mRNA expression of lipogenic genes (a) AMPK, (b) SREBP-1c, (c) FAS, and (d) ACC involved in lipid metabolism inthe rat colon and (e) levels of TC and (f) TG in the colon. The gene expression levels were measured after normalizing against 18S.Values are expressed as mean ± SD of six rats. Statistical analysis: one-way ANOVA followed by Tukey’s post hoc test. ###p < 0:001 and####p < 0:0001 compared to the control group; ∗p < 0:05, ∗∗p < 0:01, ∗∗∗p < 0:001, and ∗∗∗∗p < 0:0001 compared with the ethanol-fedgroup; ap < 0:05 and aap < 0:01 compared with the E + probiotic V group; bp < 0:05, bbp < 0:01, and bbbp < 0:001 compared with the E +Met group.
17Mediators of Inflammation

and ZO-1 [66]. Also, acute alcohol exposure disrupts thebarrier function by downregulating the expressions of ZO-1 and occludin in colons of mice [18].
Supplementation of probiotic L. plantarum prevents theredistribution of TJ proteins (ZO-1 and occludin) from thecolonic epithelial junction, which was induced by ethanol[20]. A. muciniphila showed protection against ethanol-induced gut leakiness by enhancing mucus thickness andTJ protein expression [67]. A scaffolding protein like tight
junction protein-1 (TJP-1) is a gene that encodes for ZO-1protein, an essential protein required for the maintenanceof epithelial barrier integrity. The report proved that TJP-1gene overexpression may be considered as an index of ele-vated intestinal barrier integrity in a VSL#3-induced NODmice model [68]. Studies showed that pretreatment of L.plantarum ZLP001 markedly prevented the decreases inZO-1 and occludin mRNA expression levels which is causedby enterotoxigenic Escherichia coli (ETEC) infection [69]. In
Table 3: Binding energies and amino acid interaction for Met and butyrate on performing molecular docking with respective proteinstructures.
Protein LigandBinding energy(kcal/mol)
Amino acid interactions
Nrf-2
SLLD Met -6.0 ILE: 559, VAL: 606, GLY: 367, GLY: 418, VAL: 512, VAL: 465
SLLD butyrate -3.4 GLY: 605, ILE: 559, GLY: 367, VAL: 606
MLSD Met andbutyrate
-9.7 ILE: 559, GLY: 367, GLY: 558, VAL: 463, VAL: 604, LEU: 365, LEU: 557
HO-1
SLLD Met -5.7 TYR: 286, ILE: 419, SER: 418, GLU: 565, HIS: 620, GLU: 623
SLLD butyrate -4.7 ALA: 272, SER: 267, GLN: 268, TYR: 321, THR: 269
MLSD Met andbutyrate
-8.9PHE: 699, THR: 188, THR: 703, LYS: 700, HIS: 803, GLU: 402, GLU: 623, LEU: 624,
LEU: 625
GPR109A
SLLD Met -4.9 ASN: 321, ASN: 320, ARG: 308, SER: 323, THR: 324, ARG: 311
SLLD butyrate -3.4 ILE: 162, ALA: 142, ASN: 65, PHE: 64, TRP: 56
MLSD Met andbutyrate
-9.7ILE: 162, ALA: 142, ASN: 65, PHE: 64, TRP: 56, ASN: 321, ASN: 320, ARG: 308, SER:
323, THR: 324, ARG: 311
SLC5A8
SLLD Met -5.1 GLN: 249, PHE: 458, GLY: 462
SLLD butyrate -4.7 GLN: 82, THR: 63
MLSD Met andbutyrate
-8.3 GLN: 82, THR: 63, VAL: , 281, GLN: 249, GLY: 412, GLY: 242
⁎⁎⁎⁎
⁎⁎⁎⁎
####
Control
Ethanol (E
)E+met
E+probiotic V
E+probiotic V +met
1.5BBB
AAA
1.0
0.5
Seru
m b
utyr
ate (μ
m)
0.0
(a)
⁎⁎⁎⁎
⁎⁎⁎⁎
###
Control
Ethanol (E
)E+met
E+probiotic V
E+probiotic V +met
B
AA
GPR
109A
/18S
mRN
A(fo
ld o
ver c
ontro
l bas
al)
1.5
1.0
0.5
0.0
(b)
⁎⁎⁎⁎⁎⁎
⁎⁎⁎⁎
###
Control
Ethanol (E
)E+met
E+probiotic V
E+probiotic V +met
BA
SLC5
A8/
18S
mRN
A(fo
ld o
ver c
ontro
l bas
al)
1.5
1.0
0.5
0.0
(c)
Figure 11: Probiotic V and Met unaided or in combination in enhancing the expression of butyrate receptor and transporter proteins in arat model of ethanol-induced intestinal injury. Expression levels of (a) serum butyrate levels; (b) butyrate receptor: GPR109A; and (c)butyrate transporter: SLC5A8. The gene expression levels were measured after normalizing against 18S. Values are expressed as mean ±SD of six rats. Statistical analysis: one-way ANOVA followed by Tukey’s post hoc test. ###p < 0:001 and ####p < 0:0001 compared to thecontrol group; ∗∗p < 0:01, ∗∗∗p < 0:001, and ∗∗∗∗p < 0:0001 compared with the ethanol-fed group; ap < 0:05, aap < 0:01, and aaap < 0:001compared with the E + probiotic V group; bp < 0:05 and bbbp < 0:001 compared with the E + Met group.
18 Mediators of Inflammation

(a)
(b)
(c)
Figure 12: Molecular 3D interaction of Rattus norvegicus Nrf-2 (modeled using PDB ID: 2DYH) with (a) Met, (b) butyrate performedthrough SLLD, and (c) Met and butyrate together performed through MLSD.
19Mediators of Inflammation

both, Caco-2 monolayers and colitis mice model, Metadministration provided protection against the decreasedexpression of occludin and ZO-1 as well as increased bacte-
rial translocation [24, 70]. In Caco-2 monolayers, Met ame-liorates the inhibiting effect of TNF-α on epithelial tightjunction-related protein expression [71]. Therefore, the
(a)
(b)
(c)
Figure 13: Molecular 3D interaction of Rattus norvegicus HO-1 (modeled using PDB ID: 6J7A) with (a) Met, (b) butyrate performedthrough SLLD, and (c) Met and butyrate together performed through MLSD.
20 Mediators of Inflammation
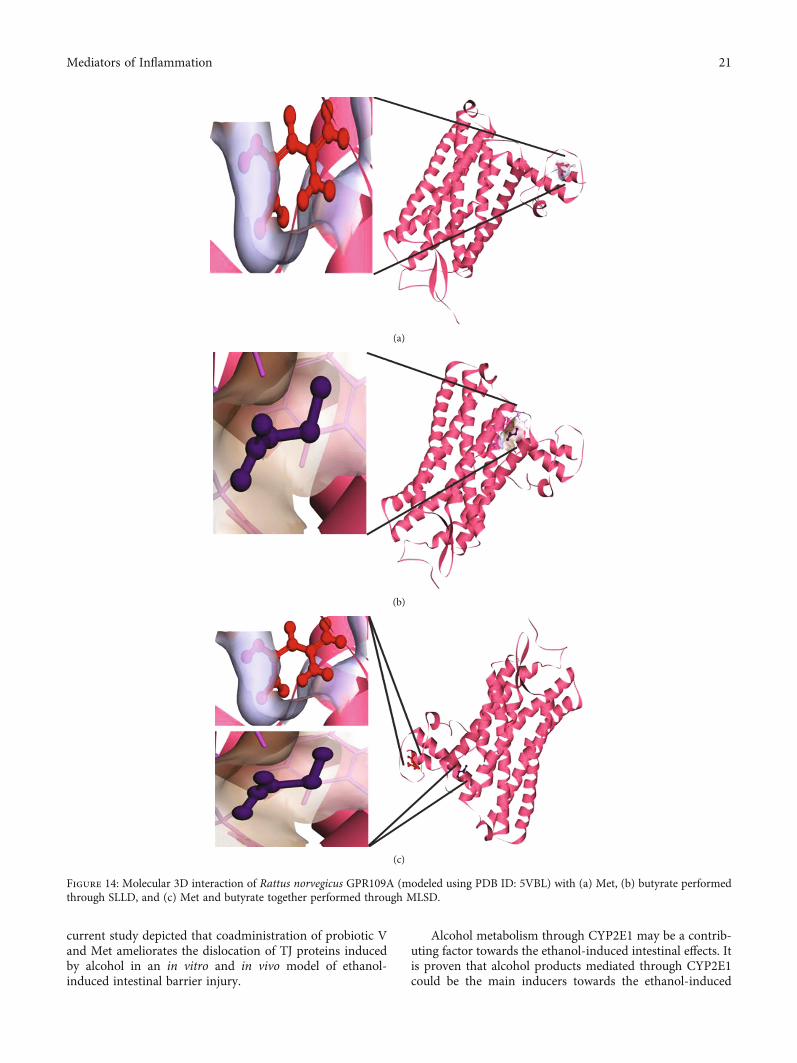
current study depicted that coadministration of probiotic Vand Met ameliorates the dislocation of TJ proteins inducedby alcohol in an in vitro and in vivo model of ethanol-induced intestinal barrier injury.
Alcohol metabolism through CYP2E1 may be a contrib-uting factor towards the ethanol-induced intestinal effects. Itis proven that alcohol products mediated through CYP2E1could be the main inducers towards the ethanol-induced
(a)
(b)
(c)
Figure 14: Molecular 3D interaction of Rattus norvegicus GPR109A (modeled using PDB ID: 5VBL) with (a) Met, (b) butyrate performedthrough SLLD, and (c) Met and butyrate together performed through MLSD.
21Mediators of Inflammation

gut barrier dysfunction and hepatic injury. CYP2E1-mediated alcohol metabolism causes increased oxidativestress products like MDA that can generate reactive oxygen
species/reactive nitrogen species (ROS/RNS) that can resultin intestinal epithelial hyperpermeability or disruption [12,13, 72]. A recent study showed increased CYP2E1 expression
(a)
(b)
(c)
Figure 15: Molecular 3D interaction of Rattus norvegicus SLC5A8 (modeled using PDB ID: 5NVA) with (a) Met, (b) butyrate performedthrough SLLD, and (c) Met and butyrate together performed through MLSD.
22 Mediators of Inflammation
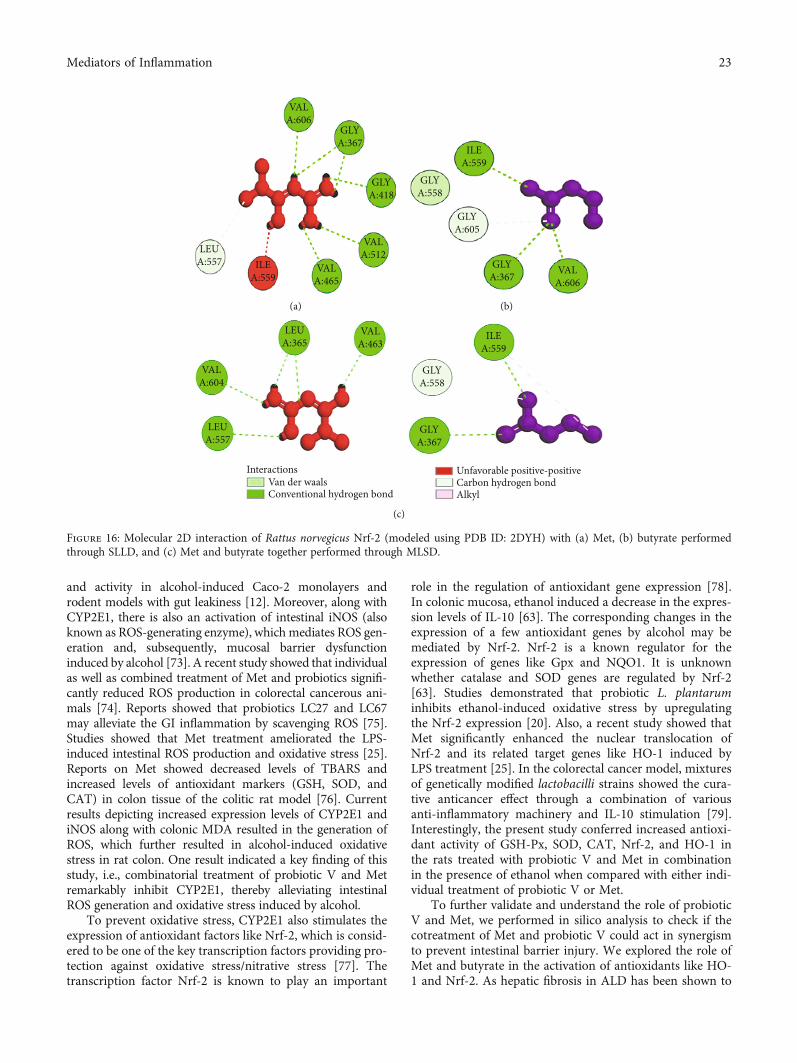
and activity in alcohol-induced Caco-2 monolayers androdent models with gut leakiness [12]. Moreover, along withCYP2E1, there is also an activation of intestinal iNOS (alsoknown as ROS-generating enzyme), which mediates ROS gen-eration and, subsequently, mucosal barrier dysfunctioninduced by alcohol [73]. A recent study showed that individualas well as combined treatment of Met and probiotics signifi-cantly reduced ROS production in colorectal cancerous ani-mals [74]. Reports showed that probiotics LC27 and LC67may alleviate the GI inflammation by scavenging ROS [75].Studies showed that Met treatment ameliorated the LPS-induced intestinal ROS production and oxidative stress [25].Reports on Met showed decreased levels of TBARS andincreased levels of antioxidant markers (GSH, SOD, andCAT) in colon tissue of the colitic rat model [76]. Currentresults depicting increased expression levels of CYP2E1 andiNOS along with colonic MDA resulted in the generation ofROS, which further resulted in alcohol-induced oxidativestress in rat colon. One result indicated a key finding of thisstudy, i.e., combinatorial treatment of probiotic V and Metremarkably inhibit CYP2E1, thereby alleviating intestinalROS generation and oxidative stress induced by alcohol.
To prevent oxidative stress, CYP2E1 also stimulates theexpression of antioxidant factors like Nrf-2, which is consid-ered to be one of the key transcription factors providing pro-tection against oxidative stress/nitrative stress [77]. Thetranscription factor Nrf-2 is known to play an important
role in the regulation of antioxidant gene expression [78].In colonic mucosa, ethanol induced a decrease in the expres-sion levels of IL-10 [63]. The corresponding changes in theexpression of a few antioxidant genes by alcohol may bemediated by Nrf-2. Nrf-2 is a known regulator for theexpression of genes like Gpx and NQO1. It is unknownwhether catalase and SOD genes are regulated by Nrf-2[63]. Studies demonstrated that probiotic L. plantaruminhibits ethanol-induced oxidative stress by upregulatingthe Nrf-2 expression [20]. Also, a recent study showed thatMet significantly enhanced the nuclear translocation ofNrf-2 and its related target genes like HO-1 induced byLPS treatment [25]. In the colorectal cancer model, mixturesof genetically modified lactobacilli strains showed the cura-tive anticancer effect through a combination of variousanti-inflammatory machinery and IL-10 stimulation [79].Interestingly, the present study conferred increased antioxi-dant activity of GSH-Px, SOD, CAT, Nrf-2, and HO-1 inthe rats treated with probiotic V and Met in combinationin the presence of ethanol when compared with either indi-vidual treatment of probiotic V or Met.
To further validate and understand the role of probioticV and Met, we performed in silico analysis to check if thecotreatment of Met and probiotic V could act in synergismto prevent intestinal barrier injury. We explored the role ofMet and butyrate in the activation of antioxidants like HO-1 and Nrf-2. As hepatic fibrosis in ALD has been shown to
VALA:606
GLYA:367
GLYA:418
VALA:512
VALA:465
ILEA:559
LEUA:557
(a)
GLYA:558
ILEA:559
GLYA:605
GLYA:367 VAL
A:606
(b)
LEUA:365
VALA:463
GLYA:558
ILEA:559
GLYA:367
LEUA:557
InteractionsVan der waalsConventional hydrogen bond
Unfavorable positive-positiveCarbon hydrogen bondAlkyl
VALA:604
(c)
Figure 16: Molecular 2D interaction of Rattus norvegicus Nrf-2 (modeled using PDB ID: 2DYH) with (a) Met, (b) butyrate performedthrough SLLD, and (c) Met and butyrate together performed through MLSD.
23Mediators of Inflammation

be mitigated by antioxidants like Nrf-2 and HO-1, theirinducers can be promising agents to prevent fibrosis inthe liver. Therefore, we checked if probiotic V and Metcould synergistically induce the expression of Nrf-2 andHO-1. Upon analysis of their interactions in being able toinduce Nrf-2 and HO-1, we found that both probiotic Vand Met individually showed interactions with Nrf-2 andHO-1, with binding energies (Nrf-2: -6.0 and -3.4 kcal/mol;HO-1: -5.7 and -4.7 kcal/mol), which was significantlyimproved when docked in combination (Nrf-2: -9.7 kcal/-mol; HO-1: -8.9 kcal/mol). This suggests that both probioticV and Met could much better induce the expression of Nrf-2 and HO-1 when administered together as compared totheir individual treatment. The in silico results are in agree-ment with the in vitro and in vivo results where the combi-nation of Met and probiotic V induced the expression ofNrf-2 and HO-1.
ALD has been shown to alter lipid metabolism andincrease the levels of serum triglycerides. Reports suggestthat high circulating triglycerides also render men with atwofold risk of developing colorectal cancer [80]. Variousreports also suggest that dyslipidemia can be associated withdeveloping colorectal carcinoma [81]. Similarly, the presentstudy also showed remarkably elevated levels of colonicTGs and cholesterol in the ethanol-fed rats, which wasimproved by treatment with probiotic V and Met cotreat-ment. Our previous study showed that combinatorial treat-ment of probiotic V and Met is known to preventlipogenesis in ALD in the liver [26]; therefore, we exploredits role in inhibiting alcohol-induced lipogenesis by regulat-ing specific lipid metabolism-associated transcription factorsin the intestine. In the hepatic tissue, unaided administrationof Met and probiotic V showed AMPK activation, which isotherwise inhibited in the presence of ethanol confirming
SERA:418
GLUA:565
HISA:620
GLUA:623
Interactions
Attractive charge
Conventional hydrogen bond
ILEA:419
TYRA:286
(a)
Carbon hydrogen bond
TYRA:321
GLNA:268
SERA:267
ALAA:272
THRA:269
(b)
LEUA:624
LEUA:625
THRA:188
THRA:703
LYSA:700
HISA:803
PHEA:699
GLUA:402
Interactions
Salt bridgePi-Alkyl
Conventional hydrogen bondAttractive charge
GLUA:623
(c)
Figure 17: Molecular 2D interaction of Rattus norvegicus HO-1 (modeled using PDB ID: 6J7A) with (a) Met, (b) butyrate performedthrough SLLD, and (c) Met and butyrate together performed through MLSD.
24 Mediators of Inflammation
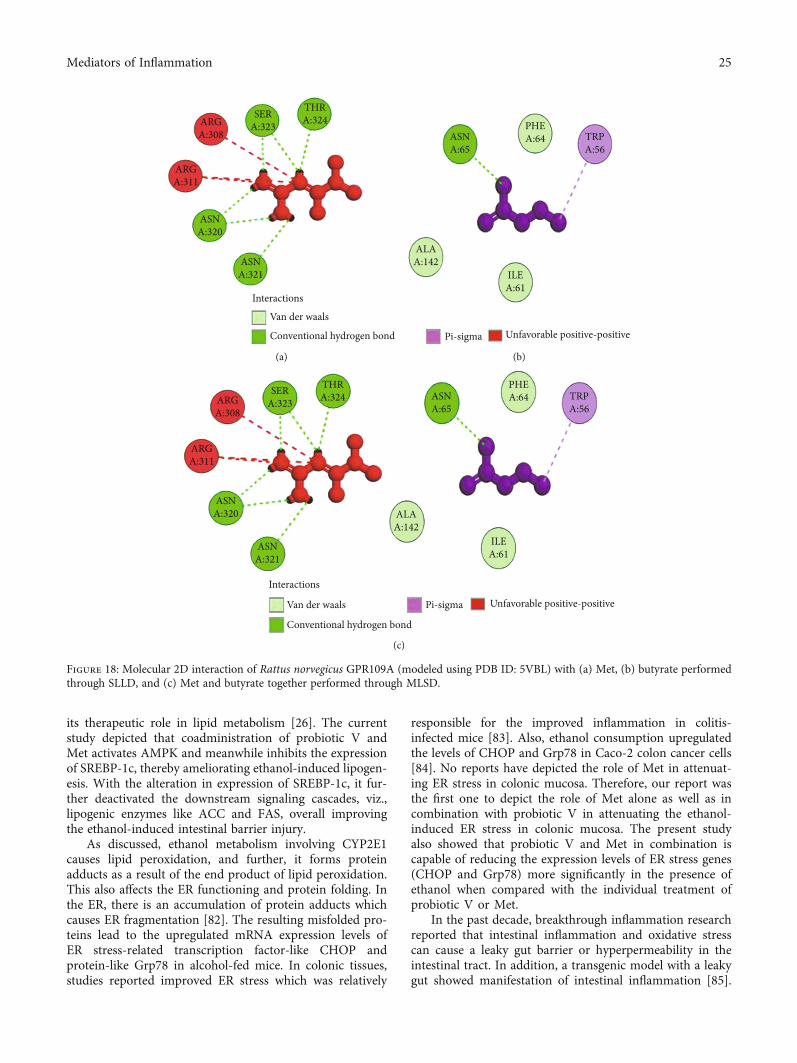
its therapeutic role in lipid metabolism [26]. The currentstudy depicted that coadministration of probiotic V andMet activates AMPK and meanwhile inhibits the expressionof SREBP-1c, thereby ameliorating ethanol-induced lipogen-esis. With the alteration in expression of SREBP-1c, it fur-ther deactivated the downstream signaling cascades, viz.,lipogenic enzymes like ACC and FAS, overall improvingthe ethanol-induced intestinal barrier injury.
As discussed, ethanol metabolism involving CYP2E1causes lipid peroxidation, and further, it forms proteinadducts as a result of the end product of lipid peroxidation.This also affects the ER functioning and protein folding. Inthe ER, there is an accumulation of protein adducts whichcauses ER fragmentation [82]. The resulting misfolded pro-teins lead to the upregulated mRNA expression levels ofER stress-related transcription factor-like CHOP andprotein-like Grp78 in alcohol-fed mice. In colonic tissues,studies reported improved ER stress which was relatively
responsible for the improved inflammation in colitis-infected mice [83]. Also, ethanol consumption upregulatedthe levels of CHOP and Grp78 in Caco-2 colon cancer cells[84]. No reports have depicted the role of Met in attenuat-ing ER stress in colonic mucosa. Therefore, our report wasthe first one to depict the role of Met alone as well as incombination with probiotic V in attenuating the ethanol-induced ER stress in colonic mucosa. The present studyalso showed that probiotic V and Met in combination iscapable of reducing the expression levels of ER stress genes(CHOP and Grp78) more significantly in the presence ofethanol when compared with the individual treatment ofprobiotic V or Met.
In the past decade, breakthrough inflammation researchreported that intestinal inflammation and oxidative stresscan cause a leaky gut barrier or hyperpermeability in theintestinal tract. In addition, a transgenic model with a leakygut showed manifestation of intestinal inflammation [85].
ARGA:308
ARGA:311
ASNA:320
ASNA:321
Interactions
Van der waals
Conventional hydrogen bond
SERA:323
THRA:324
(a)
Pi-sigma Unfavorable positive-positive
ALAA:142
ILEA:61
ASNA:65
PHEA:64 TRP
A:56
(b)
THRA:324SER
A:323ARGA:308
ARGA:311
ASNA:320
ASNA:321
ALAA:142
ASNA:65
PHEA:64 TRP
A:56
ILEA:61
Interactions
Van der waals Pi-sigma Unfavorable positive-positive
Conventional hydrogen bond
(c)
Figure 18: Molecular 2D interaction of Rattus norvegicus GPR109A (modeled using PDB ID: 5VBL) with (a) Met, (b) butyrate performedthrough SLLD, and (c) Met and butyrate together performed through MLSD.
25Mediators of Inflammation

Intestinal inflammation is mostly connected with mucosalbarrier dysfunction and TJ disruption [25]. It is known thatalcohol-induced oxidative stress caused mucosal barrier dys-function and epithelial TJ disruption, which resulted inluminal LPS leakage in the colonic mucosa. Ingestion ofalcohol upregulates the myeloperoxidase activity in thecolon [75]. Recent reports demonstrated the synergisticeffect of Met and probiotic in reducing the levels of TNF-αand IL-6 in the colon and serum resulting in a markedimprovement in the inflammatory response [74]. Studiesshowed that probiotic L. plantarum downregulated theexpression levels of cytokines (TNF-α, IL-6, and IL-β) inthe colonic mucosa, thereby preventing the ethanol-induced inflammatory response [20]. The study demon-strated that VSL#3 administration induces a remarkable
reduction in cytokine expression, i.e., IL-1β in the intestinalmucosa of the NOD mice [68]. The report showed that Mettreatment could suggestively prevent LPS-induced proin-flammatory cytokines like IL-6 and TNF-α expression inthe mice model of intestinal tissue [25]. In agreement withthe above reports, the present study also demonstrated thesignificantly increased mRNA expression levels of TNF-α,IL-6, and IL-β in the ethanol group compared to the controlin an in vivo and in vitro model. The present study demon-strated the downregulated expression of TNF-α, IL-6, andIL-β indicating the anti-inflammatory effect of combinato-rial treatment of probiotic V and Met in the in vitro as wellas in vivo model.
It has been reported that a consortium of eight bacterialstrains, i.e., VSL#3 (similar to Visbiome®), was shown to
GLNA:249
PHEA:458
GLYA:462
Interactions
Conventional hydrogen bond
(a)
GLNA:82
THRA:63
(b)
VALA:281
GLYA:242
GLYA:249
Interactions
Conventional hydrogen bond Alkyl
GLYA:412
THRA:63
GLNA:82
(c)
Figure 19: Molecular 2D interaction of Rattus norvegicus SLC5A8 (modeled using PDB ID: 5NVA) with (a) Met, (b) butyrate performedthrough SLLD, and (c) Met and butyrate together performed through MLSD.
26 Mediators of Inflammation

increase the levels of SCFA butyrate with no changes inother SCFAs [86]. Butyrate is considered to be a primeenergy source for colonocytes and also helps in regulatingintestinal homeostasis through anti-inflammatory mecha-nisms. In accordance with the above studies, the currentstudy demonstrated the increased levels of butyrate inethanol-fed rats treated with probiotic V. Therefore, it isof prime importance to understand how butyrate has beenabsorbed and transported to the intestine. Several studiesshowed that the butyrate receptor, i.e., GPR109A, and thebutyrate transporter, i.e., SLC5A8, are required for thesame, and their expressions are circumscribed to the apicalmembranes of intestinal and colonic epithelial cells [87,88], thus permitting uninterrupted access to butyrate inthe lumen. SLC5A8 is a butyrate transporter linked withNa+ required for the butyrate transport into cells [89].GPR109A is a butyrate receptor that is intricated in thestimulation of surface expression and activity of butyratetransporters. These synchronized regulatory mechanismseventually led to increased absorption of butyrate whenelevated concentrations of butyrate are accessible [90].Alcohol consumption as discussed earlier disrupts intesti-nal permeability by reducing the expression of TJ proteins.The restoration of intestinal permeability can be of highertherapeutic benefit to prevent the progression of ALD. TheSCFA butyrate has been shown to promote the epithelialbarrier function by upregulating the expression of genesencoding TJ constituents and protein reassembly through
STAT3 and SP1 activation [91]. The present study showedthat chronic alcohol consumption led to the downregu-lated expression of butyrate sensors, i.e., GPR109A andSLC5A8 proteins in the rat colon, while the cotreatmentof probiotic V and Met prevented these changes inethanol-fed rats.
As discussed earlier, butyrate plays a very important rolein maintaining intestinal permeability, but the absorption ofSCFAs is highly enhanced by SLC5A8, and SCFAs areshown to activate signaling pathways via GPR109A. Consid-ering the role of GPR109A as the butyrate receptor andSLC5A8 as the butyrate transporter, we explored the roleof Met and butyrate in interacting with GPR109A andSLC5A8 by in silico analysis. As expected, being the ligandfor both proteins, butyrate showed a good binding affinitywith GPR109A and SLC5A8. The main aim of our studywas to see if butyrate and Met could work in synergism orenhance the affinity of butyrate towards its receptor. There-fore, we docked both Met and butyrate simultaneously, andwe found that the cotreatment of both the ligands enhancedthe binding affinities (GRP109A: -9.7 kcal/mol; SLC5A8:-8.3 kcal/mol) as compared to their individual binding affin-ities (GRP109A: -4.9 and -3.4 kcal/mol; SLC5A8: -5.1 and-4.7 kcal/mol) suggesting their synergism in activatingGPR109A and SLC5A8. The in silico results are in agree-ment with the in vitro and in vivo results where the combi-nation of Met and probiotic V induced the expression ofGPR109A and SLC5A8.
NADPH CYP2E1
Reactive oxygenspecies (ROS)
P50 P65
P50 P65
TMD-α, IL-6
Inflammatory genes expressionIL-10HO-1
Nrf-2
Nrf-2
Translation
Reduced intestinalpermeability
COLON
Inhibition
Ethanol Metformin (met)
H3C
CH3
NH2
NADPH Oxidase
Lipogenesis
Activation
Translation
(NR-κB)
(NR-κB)
Tight junctions proteinregulation
Ethanol-induced intestinal-barrier injury
ZO-1,occludin
ERstress
InflammationOxidative
stress
Lipidperoxidation
N
NH NHProbiotic V
NH
Figure 20: Potential preventive mechanism of probiotic V and Met in combination against ethanol-induced intestinal barrier injury.
27Mediators of Inflammation

5. Conclusion
The current study stipulated the confirmation for the potentialrole of oxidative stress and inflammatory response in ethanol-induced disruption of colonic TJs, intestinal hyperpermeabil-ity, and endotoxemia both in vitro and in vivo and that thesupplementation of probiotic V and Met prevents alcoholic-induced gut integrity and permeability, endotoxemia, lipogen-esis, inflammatory responses, and ROS generation and upre-gulates the antioxidant gene expression (Figure 20). Wefurther verify that supplementation of probiotic V and Meteffectively prevents ethanol-induced intestinal barrier dys-function by acting on butyrate receptors and transporters.For the very first time, we report here the combined protectivefunction of probiotic V and Met in the human intestinal epi-thelial barrier. In addition, also for the first time, the currentstudy showed how the probiotic V and Met could act in syn-ergism by demonstrating the in silico interactions of bothligands in inducing the expressions of antioxidant machinerylike HO-1 and Nrf-2 and also the butyrate receptor GPR109Aand transporter SLC5A8, which matched with our findings,further validating our hypothesis. Such knowledge will pro-vide support for developing the combination of probiotic Vand Met as a therapeutic candidate to improve ethanol-induced intestinal epithelial barrier dysfunction or gut leaki-ness. Additionally, this may provide a strong piece of evidencefor further prospective research which will unravel its poten-tial application in humans.
Data Availability
The authors confirm that the data supporting the findings ofthis study are available within the article.
Ethical Approval
The study was conducted according to the guidelines of theCommittee for the Purpose of Control and Supervision ofExperiments on Animals (CPCSEA), Ministry of Environ-ment, Forest and Climate Change, Government of India(New Delhi, India), and approved by the Institutional Ani-mal Ethics Committee (IAEC) of Ramanbhai Patel Collegeof Pharmacy, Charotar University of Science and Technol-ogy (Anand, India) (940/PO/Re/S/06/CPCSEA).
Conflicts of Interest
The authors declare no conflict of interest.
Authors’ Contributions
Farhin Patel and Kirti Parwani contributed equally to thiswork.
Acknowledgments
The authors are thankful to the DST-INSPIRE FellowshipScheme for providing fellowship and to Charotar Universityof Science and Technology for the facilities used to carry outthe experiments. The authors acknowledge Tapan Patel,
Assistant Professor at P.D. Patel Institute of Applied Sci-ences, Charotar University of Science and Technology forhis help in the histological analysis.
Supplementary Materials
Supplementary Material: multiple sequence alignment(MSA) and the Ramachandran plot of Nrf-2, GRP109A,and SLC5A8. Supplementary Figure 1: multiple sequencealignment (MSA) was performed between target proteinnuclear factor erythroid 2-related factor (NRF-2) of Rattusnorvegicus (accession no. O54968) and the template proteinKelch-like ECH-associated protein 1 of Mus musculus(mouse) (accession no. Q9Z2X8). Due to the unavailabilityof the target protein in PDB, the modeled protein for thesame was built using the structure of the template protein.MSA was performed to establish a sense of conservednessamong both proteins and to justify the selection of templatesper se. Observed identity is 75.9% and similarity is 24.6%among both the sequences. Supplementary Figure 2: theNrf-2 Ramachandran plot results were performed usingSAVES server v6.0 PROCHECK. Supplementary Figure 3:GPR109A—multiple sequence alignment (MSA) was per-formed between target protein hydroxycarboxylic acidreceptor 2 of Rattus norvegicus (accession no. Q80Z39) andthe template protein G-protein-coupled receptor APJ (apelinreceptor) of Homo sapiens (accession no. P35414). Due tothe unavailability of the target protein in PDB, the modeledprotein for the same was built using the structure of the tem-plate protein. MSA was performed to establish a sense ofconservedness among both proteins and to justify the selec-tion of templates per se. Observed identity is 97.8% and sim-ilarity is 21.8% among both the sequences. SupplementaryFigure 4: the GPR109A Ramachandran plot results were per-formed using MolProbity. Supplementary Figure 5: qualitychecks on the parameters for the GPR109A modeled proteinwere performed using the SWISS MODEL. SupplementaryFigure 6: SLC5A8—multiple sequence alignment (MSA)was performed between target protein electrogenic sodiummonocarboxylate cotransporter of Rattus norvegicus (acces-sion no. D3Z9E5) and the template protein putativesodium : solute symporter of Proteus mirabilis (accessionno. B4EZY7). Due to the unavailability of the target proteinin PDB, the modeled protein for the same was built using thestructure of the template protein. MSA was performed toestablish a sense of conservedness among both proteinsand to justify the selection of templates per se. Observedidentity is 75.9% and similarity is 24.6% among both thesequences. Supplementary Figure 7: the SLC5A8 proteinRamachandran plot results were performed using MolProb-ity. Supplementary Figure 8: quality check parameters forthe SLC5A8 modeled protein were performed using theSWISS MODEL. (Supplementary Materials)
References
[1] R. E. Mann, R. G. Smart, and R. Govoni, “The epidemiology ofalcoholic liver disease,” Alcohol Research & Health, vol. 27,no. 3, pp. 209–219, 2003.
28 Mediators of Inflammation

[2] A. Keshavarzian, E. W. Holmes, M. Patel, F. Iber, J. Z. Fields,and S. Pethkar, “Leaky gut in alcoholic cirrhosis: a possiblemechanism for Alcohol-Induced liver damage,” AmercianJournal of Gastroenterology, vol. 94, no. 1, pp. 200–207, 1999.
[3] R. K. Rao, A. Seth, and P. Sheth, “Recent advances in alcoholicliver disease I. Role of intestinal permeability and endotoxemiain alcoholic liver disease,” American Journal of Physiology-Gastrointestinal and Liver Physiology, vol. 286, no. 6,pp. G881–G884, 2004.
[4] T. Suzuki, “Regulation of intestinal epithelial permeability bytight junctions,” Cellular and molecular life sciences, vol. 70,no. 4, pp. 631–659, 2013.
[5] W. Zhong, C. J. McClain, M. Cave, Y. J. Kang, and Z. Zhou,“The role of zinc deficiency in alcohol-induced intestinal bar-rier dysfunction,” American Journal of Physiology- Gastroin-testinal and Liver Physiology, vol. 298, no. 5, pp. G625–G633,2010.
[6] W. Y. Chen, M. Wang, J. Zhang, S. S. Barve, C. J. McClain, andS. Joshi-Barve, “Acrolein Disrupts Tight Junction Proteins andCauses Endoplasmic Reticulum Stress-Mediated EpithelialCell Death Leading to Intestinal Barrier Dysfunction and Per-meability,” American Journal of Pathology, vol. 187, no. 12,pp. 2686–2697, 2017.
[7] V. Purohit, J. C. Bode, C. Bode et al., “Alcohol, intestinal bac-terial growth, intestinal permeability to endotoxin, and medi-cal consequences: summary of a symposium,” Alcohol,vol. 42, no. 5, pp. 349–361, 2008.
[8] E. Mutlu, A. Keshavarzian, P. Engen, C. B. Forsyth,M. Sikaroodi, and P. Gillevet, “Intestinal dysbiosis: a possiblemechanism of alcohol-induced endotoxemia and alcoholicsteatohepatitis in rats,” Alcoholism: Clinical and ExperimentalResearch, vol. 33, no. 10, pp. 1836–1846, 2009.
[9] P. Mandal, M. T. Pritchard, and L. E. Nagy, “Anti-inflamma-tory pathways and alcoholic liver disease: role of an adipo-nectin/interleukin-10/heme oxygenase-1 pathway,” Worldjournal of gastroenterology: WJG, vol. 16, no. 11, pp. 1330–1336, 2010.
[10] A. Keshavarzian, S. Choudhary, E. W. Holmes et al., “Prevent-ing gut leakiness by oats supplementation ameliorates alcohol-induced liver damage in rats,” Journal of Pharmacology andExperimental Therapeutics, vol. 299, no. 2, pp. 442–448, 2001.
[11] A. Banan, J. Z. Fields, H. Decker, Y. Zhang, andA. Keshavarzian, “Nitric oxide and its metabolites mediateethanol-induced microtubule disruption and intestinal barrierdysfunction,” Journal of Pharmacology and ExperimentalTherapeutics, vol. 294, no. 3, pp. 997–1008, 2000.
[12] C. B. Forsyth, R. M. Voigt, M. Shaikh et al., “Role for intestinalCYP2E1 in alcohol-induced circadian gene-mediated intesti-nal hyperpermeability,” American Journal of Physiology-Gastrointestinal and Liver Physiology, vol. 305, no. 2,pp. G185–G195, 2013.
[13] E. E. Elamin, A. A. Masclee, J. Dekker, and D. M. Jonkers,“Ethanol metabolism and its effects on the intestinal epithelialbarrier,” Nutrition reviews, vol. 71, no. 7, pp. 483–499, 2013.
[14] A. Banan, A. Keshavarzian, L. Zhang et al., “NF-κB activationas a key mechanism in ethanol-induced disruption of the F-actin cytoskeleton and monolayer barrier integrity in intestinalepithelium,” Alcohol, vol. 41, no. 6, pp. 447–460, 2007.
[15] J. K. Nicholson, E. Holmes, J. Kinross et al., “Host-gut micro-biota metabolic interactions,” Science, vol. 336, no. 6086,pp. 1262–1267, 2012.
[16] S. Leclercq, P. Stärkel, N. M. Delzenne, and P. de Timary, “Thegut microbiota: a new target in the management of alcoholdependence?,” Alcohol, vol. 74, pp. 105–111, 2019.
[17] R. B. Canani, M. Di Costanzo, L. Leone, M. Pedata, R. Meli,and A. Calignano, “Potential beneficial effects of butyrate inintestinal and extraintestinal diseases,” World Journal of Gas-troenterology, vol. 17, no. 12, 2011.
[18] G. Xie, W. Zhong, X. Zheng et al., “Chronic ethanol consump-tion alters mammalian gastrointestinal content metabolites,”Journal of Proteome Research, vol. 12, pp. 3297–3306, 2013.
[19] H. Tsuda and T. Miyamoto, “Guidelines for the evaluation ofprobiotics in food. Report of a joint FAO/WHO workinggroup on drafting guidelines for the evaluation of probioticsin food Guidelines for the evaluation of probiotics in food.Report of a joint FAO/WHO working group on draftingguidelines for the evaluation of probiotics in food, 2002,” FoodScience and Technology Research, vol. 16, no. 1, pp. 87–92,2010.
[20] P. K. Shukla, A. S. Meena, B. Manda et al., “Lactobacillus plan-tarumprevents and mitigates alcohol-induced disruption ofcolonic epithelial tight junctions, endotoxemia, and liver dam-age by an EGF receptor-dependent mechanism,” The FASEBJournal, vol. 32, no. 11, pp. 6274–6292, 2018.
[21] C. B. Forsyth, A. Farhadi, S. M. Jakate, Y. Tang, M. Shaikh, andA. Keshavarzian, “Lactobacillus GG treatment amelioratesalcohol-induced intestinal oxidative stress, gut leakiness, andliver injury in a rat model of alcoholic steatohepatitis,” Alcohol,vol. 43, no. 2, pp. 163–172, 2009.
[22] I. Bergheim, L. Guo, M. A. Davis et al., “Metformin preventsalcohol-induced liver injury in the mouse: critical role of plas-minogen activator inhibitor-1,” Gastroenterology, vol. 130,no. 7, pp. 2099–2112, 2006.
[23] MetaHIT consortium, K. Forslund, F. Hildebrand et al., “Dis-entangling type 2 diabetes and metformin treatment signa-tures in the human gut microbiota,” Nature, vol. 528,no. 7581, pp. 262–266, 2015.
[24] J. Deng, L. Zeng, X. Lai et al., “Metformin protects againstintestinal barrier dysfunctionviaAMPKα1-dependent inhibi-tion of JNK signalling activation,” Journal of Cellular andMolecular Medicine, vol. 22, no. 1, pp. 546–557, 2018.
[25] W. Wu, S. Wang, Q. Liu, T. Shan, and Y. Wang, “Metforminprotects against LPS-induced intestinal barrier dysfunctionby activating AMPK pathway,” Molecular Pharmaceutics,vol. 15, no. 8, pp. 3272–3284, 2018.
[26] F. Patel, K. Parwani, D. Patel, and P. Mandal, “Metformin andprobiotics interplay in amelioration of ethanol-induced oxida-tive stress and inflammatory response in an in vitro and in vivomodel of hepatic injury,” Mediators of Inflammation,vol. 2021, Article ID 6636152, 31 pages, 2021.
[27] S. Y. Che, J. W. Yuan, L. Zhang, Z. Ruan, X. M. Sun, and H. Lu,“Puerarin prevents epithelial tight junction dysfunctioninduced by ethanol in Caco-2 cell model,” Journal of Func-tional Foods, vol. 73, article 104079, 2020.
[28] H. Zhao, C. Zhao, Y. Dong et al., “Inhibition of miR122a byLactobacillus rhamnosus GG culture supernatant increasesintestinal occludin expression and protects mice from alco-holic liver disease,” Toxicology letters, vol. 234, no. 3,pp. 194–200, 2015.
[29] M. Tanaka-Okamoto, K. Hori, H. Ishizaki et al., “Involvementof afadin in barrier function and homeostasis of mouse intes-tinal epithelia,” Journal of cell science, vol. 124, no. 13,pp. 2231–2240, 2011.
29Mediators of Inflammation
[30] P. P. Bradley, D. A. Priebat, R. D. Christensen, andG. Rothstein, “Measurement of cutaneous inflammation: esti-mation of neutrophil content with an enzymemarker,” Journalof Investigative Dermatology, vol. 78, no. 3, pp. 206–209, 1982.
[31] R. Heidari, V. Taheri, H. R. Rahimi, B. S. Yeganeh,H. Niknahad, and A. Najibi, “Sulfasalazine-induced renalinjury in rats and the protective role of thiol-reductants,”Renal Failure, vol. 38, no. 1, pp. 137–141, 2016.
[32] M. Uchiyama andM.Mihars, “Determination of malondialde-hyde precursor in tissues by thiobarbituric acid,” AnalyticalBiochemistry, vol. 86, pp. 271–278, 1978.
[33] N. Tukozkan, H. Erdamar, and I. Seven, “Measurement of totalmalondialdehyde in plasma and tissues by high-performanceliquid chromatography and thiobarbituric acid assay,” FiratTip Dergisi, vol. 11, no. 2, pp. 88–92, 2006.
[34] L. Zhe-feng, Y. R. An, W.-M. Chen, Q. Z. Wei, and E.-H. Xu,“HPLCmethod is used to measure the method for butyric acidand sodium butyrate (CN103728389B),” 2016, https://patents.google.com/patent/CN103728389A/en.
[35] K. J. Livak and T. D. Schmittgen, “Analysis of relative geneexpression data using real-time quantitative PCR and the2−ΔΔCT method,” Methods, vol. 25, no. 4, pp. 402–408, 2001.
[36] S. K. Burley, H. M. Berman, C. Bhikadiya et al., “RCSB ProteinData Bank: biological macromolecular structures enablingresearch and education in fundamental biology, biomedicine,biotechnology and energy,” Nucleic Acids Research, vol. 47,no. D1, pp. D464–D474, 2019.
[37] A. Waterhouse, M. Bertoni, S. Bienert et al., “SWISS-MODEL:homology modelling of protein structures and complexes,”Nucleic Acids Research, vol. 46, no. W1, pp. W296–W303, 2018.
[38] A. Bateman, M. J. Martin, S. Orchard et al., “UniProt: the uni-versal protein knowledgebase in 2021,”Nucleic Acids Research,vol. 49, no. D1, pp. D480–D489, 2021.
[39] P. Benkert, M. Biasini, and T. Schwede, “Toward the estima-tion of the absolute quality of individual protein structuremodels,” Bioinformatics, vol. 27, no. 3, pp. 343–350, 2011.
[40] C. J. Williams, J. J. Headd, N. W. Moriarty et al., “MolProbity:more and better reference data for improved all-atom struc-ture validation,” Protein Science, vol. 27, no. 1, pp. 293–315,2018.
[41] J. D. Thompson, D. G. Higgins, and T. J. Gibson, “CLUSTALW: improving the sensitivity of progressive multiple sequencealignment through sequence weighting, position-specific gappenalties and weight matrix choice,” Nucleic Acids Research,vol. 22, no. 22, pp. 4673–4680, 1994.
[42] D. E. Kim, D. Chivian, and D. Baker, “Protein structure predic-tion and analysis using the Robetta server,” Nucleic acidsresearch, vol. 32, no. Web Server, Supplement 2, pp. W526–W531, 2004.
[43] R. A. Laskowski, M. W. MacArthur, D. S. Moss, and J. M.Thornton, “PROCHECK: a program to check the stereochem-ical quality of protein structures,” Journal of Applied Crystal-lography, vol. 26, no. 2, pp. 283–291, 1993.
[44] A. Shukla, P. Parmar, P. Rao, D. Goswami, and M. Saraf,“Twin peaks: presenting the antagonistic molecular interplayof curcumin with LasR and LuxR quorum sensing pathways,”Current Microbiology, vol. 77, no. 8, pp. 1800–1810, 2020.
[45] D. T. Moustakas, P. T. Lang, S. Pegg et al., “Development andvalidation of a modular, extensible docking program: DOCK5,” Journal of Computer-Aided Molecular Design, vol. 20,no. 10-11, pp. 601–619, 2006.
[46] J. Wang, W.Wang, P. A. Kollman, and D. A. Case, “Automaticatom type and bond type perception in molecular mechanicalcalculations,” Journal of Molecular Graphics and Modelling,vol. 25, no. 2, pp. 247–260, 2006.
[47] E. F. Pettersen, T. D. Goddard, C. C. Huang et al., “UCSF Chi-mera?A visualization system for exploratory research andanalysis,” Journal of Computational Chemistry, vol. 25,no. 13, pp. 1605–1612, 2004.
[48] S. Kim, J. Chen, T. Cheng et al., “PubChem in 2021: new datacontent and improved web interfaces,” Nucleic Acids Research,vol. 49, no. D1, pp. D1388–D1395, 2019.
[49] J. Gasteiger and C. Jochum, “An algorithm for the perceptionof synthetically important rings,” Journal of Chemical Infor-mation and Computer Sciences, vol. 19, no. 1, pp. 43–48, 1979.
[50] P. Rao, A. Shukla, P. Parmar et al., “Proposing a fungalmetabolite-flaviolin as a potential inhibitor of 3CLpro of novelcoronavirus SARS-CoV-2 identified using docking and molec-ular dynamics,” Journal of Biomolecular Structure and Dynam-ics, pp. 1–13, 2020.
[51] P. Parmar, A. Shukla, P. Rao, M. Saraf, B. Patel, andD. Goswami, “The rise of gingerol as anti-QSmolecule: darkestepisode in the LuxR-mediated bioluminescence saga,” Bioor-ganic Chemistry, vol. 99, 2020.
[52] O. Trott and A. J. Olson, “AutoDock Vina: improving thespeed and accuracy of docking with a new scoring function,efficient optimization, and multithreading,” Journal of Compu-tational Chemistry, vol. 31, no. 2, pp. 455–461, 2010.
[53] BIOVIA,Dassault Systèmes, Dassault Systèmes, Discovery Stu-dio, v17.2 San Diego, 2017.
[54] E. A. Mutlu, P. M. Gillevet, H. Rangwala et al., “Colonic micro-biome is altered in alcoholism,” American Journal ofPhysiology-Gastrointestinal and Liver Physiology, vol. 302,no. 9, pp. G966–G978, 2012.
[55] S. Singh, N. A. Osna, and K. K. Kharbanda, “Treatmentoptions for alcoholic and non-alcoholic fatty liver disease: areview,” World Journal of Gastroenterology, vol. 23, no. 36,pp. 6549–6570, 2017.
[56] C. Bode and J. C. Bode, “Activation of the innate immune sys-tem and alcoholic liver disease: effects of ethanol per se orenhanced intestinal translocation of bacterial toxins inducedby ethanol?,” Alcoholism: Clinical & Experimental Research,vol. 29, pp. 166S–171S, 2005.
[57] C. Schäfer, A. Parlesak, C. Schütt, J. Christian Bode, andC. Bode, “Concentrations of lipopolysaccharide-binding pro-tein, bactericidal/permeability-increasing protein, solubleCD14 and plasma lipids in relation to endotoxaemia inpatients with alcoholic liver disease,” Alcohol and Alcoholism,vol. 37, no. 1, pp. 81–86, 2002.
[58] Y. Wang, J. Tong, B. Chang, B. Wang, D. Zhang, and B. Wang,“Effects of alcohol on intestinal epithelial barrier permeabilityand expression of tight junction-associated proteins,”Molecu-lar Medicine Reports, vol. 9, no. 6, pp. 2352–2356, 2014.
[59] K. K. Chaudhry, P. K. Shukla, H. Mir et al., “Glutamine supple-mentation attenuates ethanol-induced disruption of apicaljunctional complexes in colonic epithelium and amelioratesgut barrier dysfunction and fatty liver in mice,” The Journalof nutritional biochemistry, vol. 27, pp. 16–26, 2016.
[60] B. Chang, L. Sang, Y. wang, J. Tong, D. Zhang, and B. Wang,“The protective effect of VSL#3 on intestinal permeability ina rat model of alcoholic intestinal injury,” BMC gastroenterol-ogy, vol. 13, no. 1, 2013.
30 Mediators of Inflammation

[61] R. K. Rao, “Acetaldehyde-induced barrier disruption and para-cellular permeability in Caco-2 cell monolayer,” in Alcohol,vol. 447 of Methods in molecular biology, , pp. 171–183,Springer, 2008.
[62] K. J. Atkinson and R. K. Rao, “Role of protein tyrosinephosphorylation in acetaldehyde-induced disruption of epi-thelial tight junctions,” American Journal of Physiology-Gastrointestinal and Liver Physiology, vol. 280, no. 6,pp. G1280–G1288, 2001.
[63] A. S. Meena, P. K. Shukla, P. Sheth, and R. Rao, “EGF receptorplays a role in the mechanism of glutamine-mediated preven-tion of alcohol-induced gut barrier dysfunction and liverinjury,” The Journal of nutritional biochemistry, vol. 64,pp. 128–143, 2019.
[64] G. Feldman, J. Mullin, and M. Ryan, “Occludin: Structure,function and regulation,” Advanced Drug Delivery Reviews,vol. 57, no. 6, pp. 883–917, 2005.
[65] C. Chelakkot, J. Ghim, and S. H. Ryu, “Mechanisms regulatingintestinal barrier integrity and its pathological implications,”Experimental & molecular medicine, vol. 50, no. 8, pp. 1–9,2018.
[66] D. A. Bellos, D. Sharma, M. R. McMullen et al., “Specificallysized hyaluronan (35 kDa) prevents ethanol-induced disrup-tion of epithelial tight junctions through a layilin-dependentmechanism in Caco-2 cells,” Alcoholism: Clinical and Experi-mental Research, vol. 43, no. 9, pp. 1848–1858, 2019.
[67] C. Grander, T. E. Adolph, V. Wieser et al., “Recovery ofethanol-inducedAkkermansia muciniphiladepletion amelio-rates alcoholic liver disease,” Gut, vol. 67, no. 5, pp. 891–901,2018.
[68] J. Dolpady, C. Sorini, C. Di Pietro et al., “Oral Probiotic VSL#3Prevents Autoimmune Diabetes by Modulating Microbiotaand Promoting Indoleamine 2,3-Dioxygenase-Enriched Tol-erogenic Intestinal Environment,” Journal of diabetes research,vol. 2016, Article ID 7569431, 12 pages, 2016.
[69] J. Wang, H. Ji, S. Wang et al., “Probiotic Lactobacillus plan-tarum promotes intestinal barrier function by strengtheningthe epithelium and modulating gut microbiota,” Frontiers inmicrobiology, vol. 9, p. 1953, 2018.
[70] L. Chen, J. Wang, Q. You et al., “Activating AMPK to restoretight junction assembly in intestinal epithelium and to attenu-ate experimental colitis by metformin,” Frontiers in pharma-cology, vol. 9, p. 761, 2018.
[71] H. Y. Zhou, H. Zhu, X. M. Yao et al., “Metformin regulatestight junction of intestinal epithelial cells via MLCK-MLC sig-naling pathway,” European Review for Medical and Pharmaco-logical Sciences, vol. 21, no. 22, pp. 5239–5246, 2017.
[72] A. I. Cederbaum, “Role of CYP2E1 in ethanol-induced oxidantstress, fatty liver and hepatotoxicity,” Digestive Diseases,vol. 28, no. 6, pp. 802–811, 2010.
[73] A. Banan, S. Choudhary, Y. Zhang, J. Z. Fields, andA. Keshavarzian, “Ethanol-induced barrier dysfunction andits prevention by growth factors in human intestinal mono-layers: evidence for oxidative and cytoskeletal mechanisms,”Journal of Pharmacology and Experimental Therapeutics,vol. 291, no. 3, pp. 1075–1085, 1999.
[74] S. Al Kattar, R. Jurjus, A. Pinon et al., “Metformin and probio-tics in the crosstalk between colitis-associated colorectal can-cer and diabetes in mice,” Cancers, vol. 12, no. 7, p. 1857, 2020.
[75] W. G. Kim, H. I. Kim, E. K. Kwon, M. J. Han, and D. H. Kim,“Lactobacillus plantarum LC27 and Bifidobacterium longum
LC67 mitigate alcoholic steatosis in mice by inhibiting LPS-mediated NF-κB activation through restoration of the dis-turbed gut microbiota,” Food & function, vol. 9, no. 8,pp. 4255–4265, 2018.
[76] A. Pandey, S. Verma, and V. L. Kumar, “Metformin maintainsmucosal integrity in experimental model of colitis by inhibit-ing oxidative stress and pro-inflammatory signaling,” Biomed-icine & Pharmacotherapy, vol. 94, pp. 1121–1128, 2017.
[77] P. Gong and A. I. Cederbaum, “Nrf2 is increased by CYP2E1in rodent liver and HepG2 cells and protects against oxidativestress caused by CYP2E1,” Hepatology, vol. 43, no. 1, pp. 144–153, 2006.
[78] B. M. Hybertson, B. Gao, S. K. Bose, and J. M. McCord, “Oxi-dative stress in health and disease: the therapeutic potential ofNrf2 activation,” Molecular aspects of medicine, vol. 32, no. 4-6, pp. 234–246, 2011.
[79] S. Del Carmen, A. D. de Moreno de LeBlanc, R. Levit et al.,“Anti-cancer effect of lactic acid bacteria expressing antioxi-dant enzymes or IL-10 in a colorectal cancer mouse model,”International Immunopharmacology, vol. 42, pp. 122–129,2017.
[80] M. Trevisan, J. Liu, P. Muti, G. Misciagna, A. Menotti, andF. Fucci, “Markers of insulin resistance and colorectal cancermortality,” Cancer Epidemiology and Prevention Biomarkers,vol. 10, no. 9, pp. 937–941, 2001.
[81] M. Tabuchi, J. Kitayama, and H. Nagawa, “Hyperglycemia andhypertriglyceridemia may associate with the adenoma–carci-noma transition in colorectal epithelial cells,” Journal of gas-troenterology and hepatology, vol. 23, no. 6, pp. 985–987, 2008.
[82] J. J. Galligan, R. L. Smathers, C. T. Shearn et al., “Oxidativestress and the ER stress response in a murine model forearly-stage alcoholic liver disease,” Journal of toxicology.,vol. 2012, article 207594, 12 pages, 2012.
[83] Y. Liu, Q. Ye, Y.-L. Liu, J. Kang, Y. Chen, and W. G. Dong,“Schistosoma japonicum attenuates dextran sodium sulfate-induced colitis in mice via reduction of endoplasmic reticulumstress,” World Journal of Gastroenterology, vol. 23, no. 31,pp. 5700–5712, 2017.
[84] C. Cernigliaro, A. D’Anneo, D. Carlisi et al., “Ethanol-medi-ated stress promotes autophagic survival and aggressivenessof colon cancer cells via activation of Nrf2/HO-1 pathway,”Cancers, vol. 11, no. 4, p. 505, 2019.
[85] M. L. Hermiston and J. I. Gordon, “Inflammatory bowel dis-ease and adenomas in mice expressing a dominant negativeN-cadherin,” Science, vol. 270, no. 5239, pp. 1203–1207, 1995.
[86] H. Yadav, J. H. Lee, J. Lloyd, P. Walter, and S. G. Rane, “Ben-eficial metabolic effects of a probiotic via butyrate-inducedGLP-1 hormone secretion,” Journal of biological chemistry,vol. 288, no. 35, pp. 25088–25097, 2013.
[87] M. Thangaraju, G. A. Cresci, K. Liu et al., “GPR109A is a G-protein-coupled receptor for the bacterial fermentation prod-uct butyrate and functions as a tumor suppressor in colon,”Cancer research, vol. 69, no. 7, pp. 2826–2832, 2009.
[88] S. Sivaprakasam, P. K. Ganapathy, M. O. Sikder et al., “Defi-ciency of dietary fiber in Slc5a8-null mice promotes bacterialdysbiosis and alters colonic epithelial transcriptome towardsproinflammatory milieu,” Canadian Journal of Gastroenterol-ogy and Hepatology, vol. 2019, Article ID 2543082, 12 pages,2019.
[89] S. Sivaprakasam, Y. D. Bhutia, S. Yang, and V. Ganapathy,“Short-chain fatty acid transporters: role in colonic
31Mediators of Inflammation

homeostasis,” Comprehensive Physiology, vol. 8, no. 1, pp. 299–314, 2017.
[90] A. Borthakur, S. Priyamvada, A. Kumar et al., “A novel nutri-ent sensing mechanism underlies substrate-induced regulationof monocarboxylate transporter-1,” American Journal ofPhysiology-Gastrointestinal and Liver Physiology, vol. 303,no. 10, pp. G1126–G1133, 2012.
[91] D. Parada Venegas, M. K. de la Fuente, G. Landskron et al.,“Short chain fatty acids (SCFAs)-mediated gut epithelial andimmune regulation and its relevance for inflammatory boweldiseases,” Frontiers in immunology, vol. 10, p. 277, 2019.
32 Mediators of Inflammation