Embed Size (px)
Citation preview

Properties and Calibration of MEMS andPiezoactuated Fabry-Perot Spectral Imagers
EUFAR Joint Expert Working Group Meeting: Imaging SpectroscopySensors, Calibration/ Validation, and Data Processing, Edinburgh,UK, 14th April 2011.
Heikki SaariVTT Technical Research Centre of Finland

4/27/2011 EUFAR Joint Expert Working Group Meeting 2
Outline
Introduction and classification of imaging spectrometersOverview of the VTT Fabry-Perot Interferometer (FPI) – technologiesFabry-Perot Interferometer principle and spectroscopy applicationsFPI hyperspectral imager major characteristics and operation modesThe Piezo-actuated FPI component and its controllingVTT’s Surface Micro-Machined MEMS FPI StructureWorld’s first MEMS FPI Spectral ImagerVTT UAS FPI VIS-VNIR Spectral Camera for forest and agriculture applicationsFPI based spectral camera F-number and throughputMathematical description of the FPI Spectral Imager conceptCalibration of the FPI Hyperspectral ImagerConclusions and future plansAdditional slides on the-state-of-the-art of the hyper and multispectral imagingtechnology and on planned UAV applications of FPI spectral imager

4/27/2011 EUFAR Joint Expert Working Group Meeting: 3
Classification of imaging spectrometers for remote sensingapplications
Ref. R. Sellar&G.Boreman, “Classificationof imagingspectrometers forremote sensingapplications“, Opt.Eng.44(1), Jan 2005.
Ref. X. Prieto-Blanco, C.Montero-Orille, B.Couce, R. de la Fuente,“Optical configurationsfor ImagingSpectrometers, Comput.Intel. For RemoteSensing, SCI 133, pp. 1-25, 2008 Springer-Verlag, Heidelberg 2008.

4/27/2011 EUFAR Joint Expert Working Group Meeting: 4
Overview of the VTT Fabry-Perot Interferometer – technologies
Piezo-actuatedFabry-Perotinterferometermodules
Detector modules including a Fabry-Perot interferometer detector andoptionally cooling.
Microelectromechanical components (MEMS)- Development started 1990 / 1991, CARBOCAP® -production at Vaisala / VTT 1997- Novel technologies: ALD, Si3N4, etc.- Small, robust, cheap, high volumes- Wavelength ranges 350 nm – 14000 nm
Piezo-components- More transmitted light, large range of wavelengths- Small and medium series with apertures from 3 mm to 50 mm.- Fits well to imaging systems
VTT owns IPR of several Fabry-Perot inventionsFilter chips, 3x3 mm2
Tunable band-pass filters (350– 14000 nm)
4/27/2011 EUFAR Joint Expert Working Group Meeting: 5
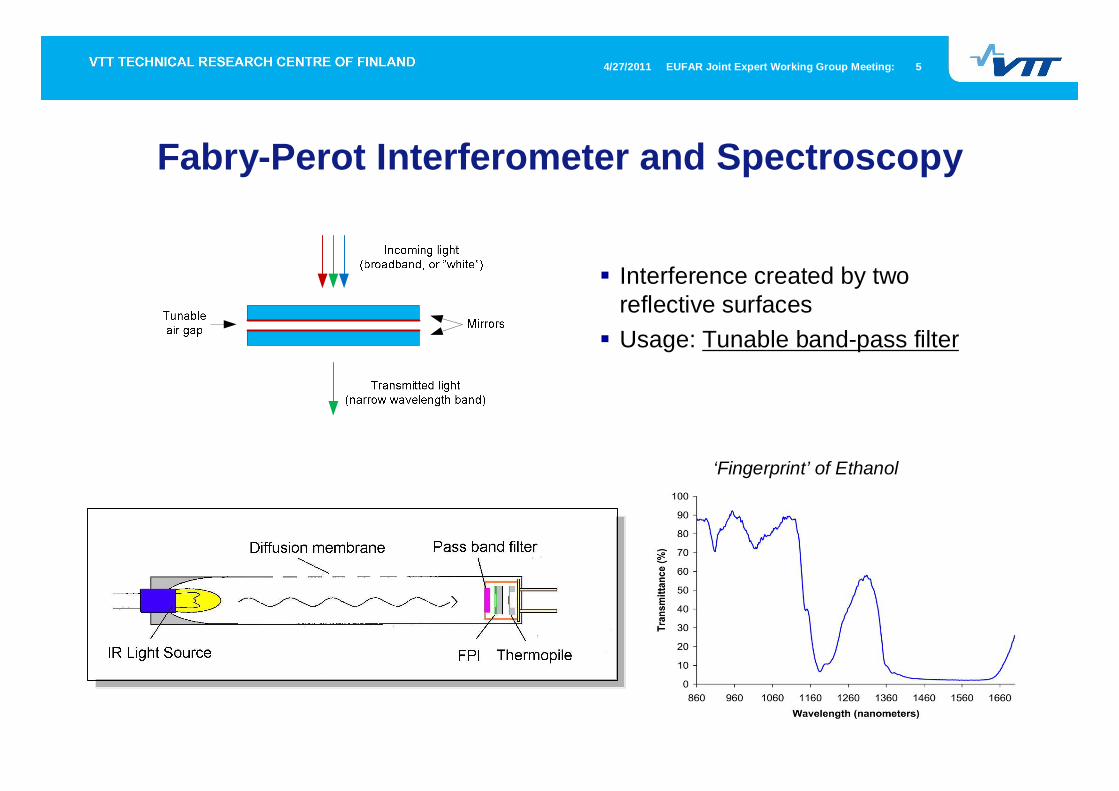
Fabry-Perot Interferometer and Spectroscopy
‘Fingerprint’ of Ethanol
Interference created by tworeflective surfacesUsage: Tunable band-pass filter

4/27/2011 EUFAR Joint Expert Working Group Meeting: 6
Fabry-Perot Interferometer (FPI) and principle ofhyperspectral imaging based on it
400 500 600 700 800 900 10000
0.2
0.4
0.6
0.8
Wavelength/[nm]
Spec
tral t
rans
mis
sion
Fabry-Perot Mirrors
Air gapOrder sorting
filter
Object of thehyperspectral
imager
Image of thehyperspectral
imager
Front opticsfor collimation Focusing optics
for imaging
The Fabry-Perot Interferometer basedhyperspectral imager concept.

4/27/2011 EUFAR Joint Expert Working Group Meeting: 7
FPI multispectral image sensor hyperspectral imager principle - Matchingthree Fabry-Perot Interferometer orders to a R-, G-, and B-pixels
400 500 600 7000
0.1
0.2
0.3
0.4
Air gap = 1100 nm
Wavelength/[nm]
Tran
smis
sion
400 500 600 7000
0.05
0.1
B pixels at the Air gap = 1100 nmG pixels at the Air gap = 1100 nmR pixels at the Air gap = 1100 nm
Wavelength/[nm]
Qua
ntum
eff
icie
ncy
400 500 600 700 800 900 1000 11000
0.1
0.2
0.3
0.4
Blue/B pixelsGreen/G pixlesRed/R pixels
Wavelength/[nm]
Qua
ntum
eff
icie
ncy

4/27/2011 EUFAR Joint Expert Working Group Meeting: 8
FPI hyperspectral imager major characteristics
< 3 W< 400 g
< 65 x 65 x 130 mm< 1.0 s
2592 x 1944 pixels
640 x 480 pixels80 %
25 %
< 1.0< 2.8
< 1 nm< 1 nm
3 - 11 nm @ FWHM400 – 1000 nm
Typical value for Vis-VNIR
< 25 WPower consumption< 2.0 kgWeight
< 150 x 100 x 200 mmDimensions< 1.0 sRecording time for 100 layer data cube
512 x 512 pixelsMaximum spectral image size
384 x 288 pixelsDefault spectral image dimensions80 %Average FPI transmission with dielectric mirrors
25 %Average FPI transmission with metallic mirrors
< 1.0F-number @ 10 max FPI ray angle< 2.8F-number @ 5 max FPI ray angle
< 1 nmSpectral instability< 1 nmSpectral step
8 - 30 nm @ FWHMSpectral resolution900 – 2500 nmVisible-VNIR
Typical value for SWIRParameter

4/27/2011 EUFAR Joint Expert Working Group Meeting: 9
FPI hyperspectral imager operation modes
Tunable FPI filter camera utilizing onlyone FPI order at a time for exampleVNIR camera for 700 – 1000 nm with airgap range 520 – 880 nm, res. 9..11 @FWHM or Vis-VNIR camera for 550 –770 nm air gap range 360 – 560 nm, res.12..15 @ FWHMFalse color imager with relatively narrowGreen, Red and VNIR pass bands with+5 Mpix resolution (see next slide)The FPI camera can be used as atunable multispectral imager with +5Mpix resolution by taking images insequence at the selected spectral bands.Three 5 Mpix images can be recorded intypically in less than 0.3 s.
0 100 200 300 400 500 600 700 800 900 1000 1100 1200 1300 1400 1500350
400
450
500
550
600
650
700
750
800
850
900
950
1000
1050
Air gap/[nm]
Wav
elen
gths
of s
pect
ral p
eaks
at s
ever
al F
PI o
rder
s/[n
m]

4/27/2011 EUFAR Joint Expert Working Group Meeting: 10
False color imager with relatively narrow Green, Red and VNIR pass bands• The FPI spectral camera operates like a
normal false color camera except thegreen (G), red (R) and VNIR spectralbands are narrower.
• An example of the measured spectraltransmissions of the FPI module at airgap values of 1000 nm and 1500 nm areshown on the right.
• The spectral bands used in the falsecolor imaging at the air gap value 1500nm are:
• G: 560 nm @ 10 nm FWHM• R: 670 nm @ 10 nm FWHM• VNIR: 845 nm @ 10 nm FWHM
400 450 500 550 600 650 700 750 800 850 900 950 10000
0.03
0.06
0.09
0.12
0.15
0.18
0.21
0.24
0.27
0.3
Measured transmission at air 1000 nm gapMeasured transmission at air 1500 nm gap
Wavelength/[nm]
Tran
smiss
ion

4/27/2011 EUFAR Joint Expert Working Group Meeting: 11
The Piezo-actuated Fabry-Perot Interferometer component and its controlling
Piezo-FPI
Commercial piezo-actuators
UV-curable glue
Ti-Ag-SiO2 coating
Three electrodes,split capacitances
Contact pads only onlower substrate
Fused silica substrate
=> FPI cavity stays parallel=> FPI cavity stays parallelHermetically packagedPiezo actuated FPI

4/27/2011 EUFAR Joint Expert Working Group Meeting: 12
Piezo Actuated Fabry-Perot Interferometer control electronics

4/27/2011 EUFAR Joint Expert Working Group Meeting: 13
VTT’s Surface Micro-Machined MEMS FPI Structure
Upper mirror acts as a tensioned membrane enables:Large optical apertures up to millimeters in diameterSuperior mirror flatnessVery high nominal frequencies, ~ 1 MHz (insensitive to vibrations)No gravitational effectsLow operation voltages

4/27/2011 EUFAR Joint Expert Working Group Meeting: 14
World’s first MEMS FPI Spectral Imager
VTT has built world’s first MEMS FPIbased spectral imager device fordemonstration to Photonics West 2011fair
The device consist of optics, apackaged MEMS Fabry-PerotInterferometer (aperture diameter 2mm), and a color imager, together withelectronics and mechanics.
Device can be used for surfaceinspection (it has built-in white LEDs aslight source) or in remote sensingmode, focused to infinity
The wavelength range is 460-585 nmand resolution ca. 5 nm

4/27/2011 EUFAR Joint Expert Working Group Meeting: 15
FPI Spectral Imager trials with the UAV helicopter
VTT has developed in previous VTT andTekes funded projects proprietaryhyperspectral imaging technology forlight weight UAS planes (Patents:FI119345B , GB 2445956, Pat. Appl.FI20095356).A proof of concept prototype has beenbuilt and used in VITO (Flemish Institutefor Technological Research) DraganflyX6 UAS helicopter.The results of the first trial flights hasbeen published in SPIE conferences onSeptember 20091 and April 20102.
VTT proof-of-concept prototype integrationto the Draganfly X6 UÁS helicopter
VTT proof-of-concept prototype used for testtargets onboard Draganfly X6 UÁS helicopter
1Saari, H., Aallos, V., Akujärvi, A., Antila, T., Holmlund C., Kantojärvi, U.,Mäkynen, J. and Ollila J., “Novel Miniaturized Hyperspectral Sensor forUAV and Space Applications”, Proc. SPIE 7474 (2009).
2Saari, H., Aallos, V., Holmlund, C., Mäkynen, J., Delauré, B., Nackaerts,K., and Michiels, B., “Novel Hyperspectral Imager for Lightweight UAVs”,Proc. SPIE 7668 (2010) to be published.

4/27/2011 EUFAR Joint Expert Working Group Meeting: 16
VTT UAS FPI VIS-VNIR Spectral Camerafor forest and agriculture applications
Major specifications of the spectral cameraSpectral range: 500 – 900 nmSpectral Resolution: 7..10 nm @ FWHMFocal length: 9.3 mmImage size: 7.1 mm x 4.3 mm, 5 MpixField of View: 32 (across the flight direction)Ground pixel size: 3.5 cm @ 150 m heightWeight: 395 gSize: 62 mm x 61 mm/76mm x 120 mmPower consumption: 3 W

4/27/2011 EUFAR Joint Expert Working Group Meeting: 17
FPI based spectral camera F-number and throughput 1(4)
Maximum allowed rayangle max through
FPI
Maximum radialheight hcmos of
the imagesensor
Maximum radialheight
intermediateimage him
Effective aperture ofthe FPI, DFPILens 1 Lens 2
Fabry-PerotInterferometer (FPI)
Lens 3
An ideal lens with focal length of flens1 collimates the rays coming from an object with a height him and the angleof the collimated beam is max. In the case of relay optics at magnification of 1 the him = hcmos which is themaximum radial height of the image sensor. It is now possible to calculate the focal length of the Lens 1
)tan( max1
cmosLens
hf Eq. 1
The maximum effective aperture of the lens 1 can be approximated by the effective diameter of the FPI moduleDFPI. The F-Number of the FPI spectral camera Fnsys1 is given by
)tan( max1
FPI
cmossys D
hFn Eq. 2

4/27/2011 EUFAR Joint Expert Working Group Meeting: 18
FPI based spectral camera F-number and throughput 2(4)
It is possible to lower the F-number by using a larger FPIdiameter and by increasing themax allowed FPI ray angle.The F-number as low as 1.0can be achieved with 15 mmFPI diameter and 10 degreemax FPI angle.This makes it possible tomanufacture Hyperspectralimager with weight < 400 g forVis-VNIR with F-number 1.0and spectral resolution < 10 nm@ FWHM
3 5 7 9 11 13 15 17 19 21 23 250
1
2
3
4
5
6
7
8
9
10
11
12
13
14
15
max allowed FPI angle 5.0 degree, Image diameter = 7.13 mmmax allowed FPI angle 7.5 degree, Image diameter = 7.13 mmmax allowed FPI angle 10.0 degree, Image diameter = 7.13 mmmax allowed FPI angle 15.0 degree, Image diameter = 7.13 mm
Diameter of the Fabry-Perot Interferometer/[mm]
F-nu
mbe
r

4/27/2011 EUFAR Joint Expert Working Group Meeting: 19
FPI based spectral camera F-number and throughput 3(4)
The FPI ray angle affects the centerwavelength of the FPI spectral peak.In the first approximation the peakwavelength is linearly dependent onthe cosine of the ray angle.
525 527 529 531 533 535 537 539 541 543 545 547 549 551 553 555 557 559 561 563 5650
0.05
0.1
0.15
0.2
0.25
0.3
0.35
0.4
0.45
0.5
FPI ray angle 1 degreeFPI ray angle 3 degreesFPI ray angle 5 degreesFPI ray angle 7.5 degreesFPI ray angle 10 degreesFPI ray angle 15 degrees
Wavelength/[nm]
Tran
smiss
ion
2)cos(
0dm
, m=1,2….
The optics can be designed in such away that the rays go through the FPIas a collimated beam for a specificpixel of the image.So for the measurement ofcontinuous spectrum the large FPIray angles can be used because thespectral resolution is not affected bythe FPI ray angle
4/27/2011 EUFAR Joint Expert Working Group Meeting: 20
FPI based spectral camera F-number and throughputconclusions 4(4)
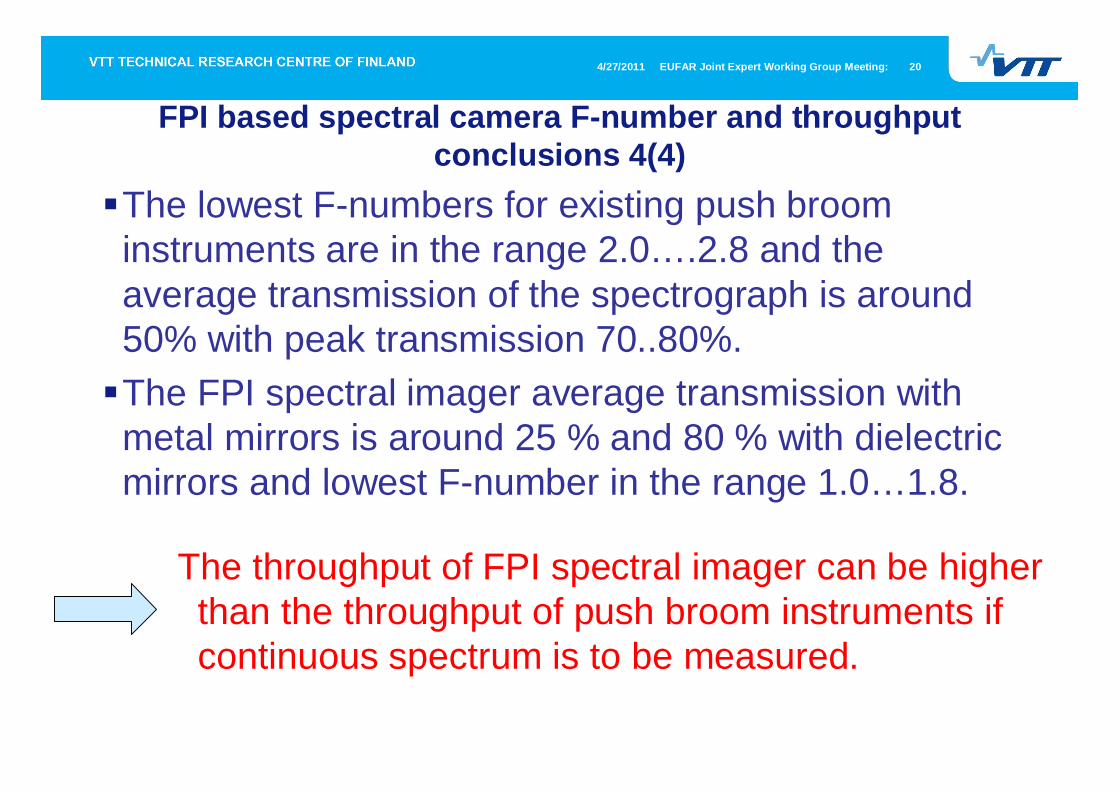
The lowest F-numbers for existing push broominstruments are in the range 2.0….2.8 and theaverage transmission of the spectrograph is around50% with peak transmission 70..80%.The FPI spectral imager average transmission withmetal mirrors is around 25 % and 80 % with dielectricmirrors and lowest F-number in the range 1.0…1.8.
The throughput of FPI spectral imager can be higherthan the throughput of push broom instruments ifcontinuous spectrum is to be measured.

4/27/2011 EUFAR Joint Expert Working Group Meeting: 21
Signal of a RGB image sensor Blue (B), Green (G) and Red (R) pixels
Equations for the calculation of the signals of a RGB image sensor Blue (B),Green (G) and Red (R) pixels
max
min
)()(),()()( dSTdTdS sysgapFPIBgapB (5)
max
min
)()(),()()( dSTdTdS sysgapFPIGgapG (6)
max
min
)()(),()()( dSTdTdS sysgapFPIRgapR (7)
B( ), G( ) ja R( ) are the quantum efficiencesof the B-, G- ja R-pixels at the wavelength and the S( ) is the spectral photon flux entering the system. The combined spectral transmission of the optical system without the FPI is included in theterm Tsys( ).

4/27/2011 EUFAR Joint Expert Working Group Meeting: 22
Retrieval of the spectral signals at the Fabry-PerotInterferometer pass bands at the selected three orders 1(3)
For the retrieval of the spectral signal a calibration is required for the responses of the B-,G- and R-pixels around the selected three FPI pass bands.
))1(2
11(2
))1(2
11(2
)(),()(),(nnn
d
nnnd
sysgapFP IBgapB n
gap
gap
dTdTndS
))1(2
11(2
))1(2
11(2
)(),()(),(nnn
d
nnnd
sysgapFP IGgapGn
gap
gap
dTdTndS
))1(2
11(2
))1(2
11(2
)(),()(),(nnn
d
nnnd
sysgapFP IRgapR n
gap
gap
dTdTndS
dgap is the FPI air gap width, n is the FPI order, theB( ), G( ) ja R( ) are the quantum efficiences of
the B-, G- ja R-pixels at the wavelength , TFPI( , dgap)is the spectral transmission of the FPI and Tsys( ) is thecombined spectral transmission of the optical systemwithout the FPI.

4/27/2011 EUFAR Joint Expert Working Group Meeting: 23
Retrieval of the spectral signals at the Fabry-PerotInterferometer pass bands at the selected three orders 2(3)
Rm
Gm
Bm
n
n
n
RnRnRn
GnGnGn
BnBnBn
SSS
SSS
SSSSSSSSS
1
2
12
12
12
Rm
Gm
Bm
RnRnRn
GnGnGn
BnBnBn
n
n
n
SSS
SSSSSSSSS
SSS 1
12
12
12
1
2
In a measurement the goal is to determine the spectral intensity S( ) of the lightAt a preset gap width we will measure signals SBm, SGm and SRm. at the B-, G- ja R pixelsThe calibration coefficients SBn, SBn+1, SBn+2, SGn, SGn+1, SGn+2, SRn, SRn+1 ja SRn+2 can now beused for the calculation of the measured signals at the three narrow bands of three Fabry-Perot orders.The measured signals of the light at the three FPI passbands are now
Where Sn+2, Sn+1 and Sn are the unknown intensities atFPI orders n+2, n+1 and n.
The unknown can now be solved by

4/27/2011 EUFAR Joint Expert Working Group Meeting: 24
Retrieval of the spectral signals at the Fabry-PerotInterferometer pass bands at the selected three orders 3(3)
The coefficients that must be applied to signals at B-, G- andR-pixels to get the signal at the selected air gap value aregiven by R matrix below
1
12
12
12
111
222
BnBnBn
GnGnGn
RnRnRn
BnGnRn
BnGnRn
BnGnRn
SSSSSSSSS
RRRRRRRRR

4/27/2011 EUFAR Joint Expert Working Group Meeting: 25
The signal at the FPI order n+2 as a linear combination of thesignals at B-, G- and R-pixels
BmBnGmGnRmRnn SRSRSRS 2222
max
min
max
min
max
min
)()(),()(
)()(),()()()(),()(
2
222
dTdTR
dTdTRdTdTRS
phsysgapFPIBBn
phsysgapFPIGGnphsysgapFPIRRnn
max
min
)()(),())()()(( 2222 dTdTRRRS phsysgapFPIBBnGGnRRnn
The signal at the pass band of the FPI order n+2 is a linear combination of the signals atB-, G- and R-pixels.
(15)

4/27/2011 EUFAR Joint Expert Working Group Meeting: 26
Calibration of the FPI Hyperspectral Imager 1(5)The calibration should provide as an output the spectral response curves
R( ) TFPI( , dgap) Tsys( ), G( ) TFPI( , dgap) Tsys( ), B( ) TFPI( , dgap) Tsys( )
These curves are used in the calculation of the calibration coefficients SBn,SBn+1, SBn+2, SGn, SGn+1, SGn+2, SRn, SRn+1 and SRn+2.
The coefficients RBn+1, RBn+2, RGn, RGn+1, RGn+2, RRn, RRn+1 and RRn+2 arederived as an inverse matrix of S-coefficients.
The R-coefficients can be used in the calculation of photon flux at thethree spectral bands of FPI orders n+2, n+1 and n.

4/27/2011 EUFAR Joint Expert Working Group Meeting: 27
Calibration of the FPI Hyperspectral Imager 2(5)
•The calibration isstarted with themeasurement of thespectral photon fluxentering the input of theFPI spectral imager.
•The signals of theabsolute radiometer andthe reference detectorare typically recordedfor wavelength ranges400 – 1000 nm at 1 nmintervals and at aresolution of 1 @FWHM.
Absolute photon flux calibration detectorThree photodiode light trap photodetectorQED-200-14526(Calibrated absolute photometer forquantum efficiency measurements)
Xenon Short Arc or HalogenLamp
UV/Visible/NIR Monochromatororder selection filter Monochromator
Bentham TMc300
Reference detector
Holographic diffusers
Beam splitter plate
QED-200Absoluteradiometer

4/27/2011 EUFAR Joint Expert Working Group Meeting: 28
Calibration of the FPI Hyperspectral Imager 3(5)
Xenon Short Arc or HalogenLamp
UV/Visible/NIR Monochromatororder selection filter Monochromator
Bentham TMc300
Reference detector
Holographic diffusers
Beam splitter plate
Fabry-Perot Interferometer based spectralcamera under calibration
Piezo actuated Fabry-Perot InterferometerModule
Long and Short pass filtersdefing the spectral range
RGB imagesensor
The calibration measurement for the FPI hyperspectral image sensor is performedby recording for each selected air gap value the images of the RGB image sensorfor the same spectral range and at the same spectral step and slit width as in thecalibration of the spectral photon flux.

4/27/2011 EUFAR Joint Expert Working Group Meeting: 29
Calibration of the FPI Hyperspectral Imager 4(5)
Because the spectral photon flux ph( ) is known it is possible determine for hyperspectralimage sensor total spectral response i.e. product KADU TFPI( , dgap) Tsys( ) ( ) = Ssys( ) forR-, G-, and B-pixels
)(),()()(
)()(),()()( sysgapFPIRADU
ph
phsysgapFPIRADUsys TdTK
TdTKS
The system gain KADU is the total gain of the image sensor in units ADU/electrons whichcan be determined using the mean-variance method. The sensitivity in equation above isgiven in absolute units ADU/photons.

4/27/2011 EUFAR Joint Expert Working Group Meeting: 30
Typical result of a FPI Hyperspectral Imager Calibration
•Measured total spectral sensitivity of R-, G-,and B-pixels at air gap value 1400 nm•Spectral resolution is 7 – 9 nm @ FWHM
400 450 500 550 600 650 700 750 800 850 900 950 1 1030
0.05
0.1
0.15
0.2
0.25
Red pixelsGreen pixelsBlue pixels
Wavelength/[nm]
Tota
l spe
ctra
l sen
sitiv
ity/[A
DU
/pho
tons
]
450 500 550 600 650 700 750 800 850 900 9500.05
0
0.05
0.1
0.15
0.2
0.25
0.3
0.35
0.4
0.45
Wavelength/[nm]
Tota
l sen
sitiv
ity a
s a li
near
com
bina
tion
of R
-, G
- and
B-s
ensi
tiviti
es
•Measured total spectral sensitivity at spectral peak of FPIorder n+2 at air gap value 1400 nm.•The total spectral sensitivity is derived as a weightedsum of the R-, G-, and B-pixel sensitivities plotted on theleft.•The weights were taken from R-matrix for FPI air gap1400nm. R-pixel weight =-0.154 , G-pixel weight = 2.098and B-pixel weight = -2.184

4/27/2011 EUFAR Joint Expert Working Group Meeting: 31
SNR estimation for the FPI Hyperspectral Imager
)(),())()()(()( 222 sysgapFPIBBnGGnRRn TdTRRRI
2
2
)()(),())()()(( 2222
n
n
dTdTRRRS phsysgapFPIBBnGGnRRnn
max
2
2
min
2222
2222
22
))()(),())()()(((
))()(),())()()(((
n
n
dTdTRRR
dTdTRRRN
phsysgapFPIBBnGGnRRn
phsysgapFPIBBnGGnRRnn
2
22
n
nn N
SSNR
The total spectral sensitivity function for one specific spectral band representing one FPI orderat a fixed FPI air gap can be expressed with Equation
If we assume a constant signal over the whole spectral range we get for the signal at the spectralpeak of FPI order n+2 ( n+2) Sn+2
The square of the noise (Nn+2)2 can be estimated with the following
Where is width of the spectral peak defined in such a way that the signal is contained in therange n+2- - n+2+ . The relevant spectral range min max is determined with longand short pass filters. The Signal-to-Noise-Ratio (SNRn+2) can now be expressed as
4/27/2011 EUFAR Joint Expert Working Group Meeting: 32
Example of the SNR estimation for the FPI Hyperspectral Imager
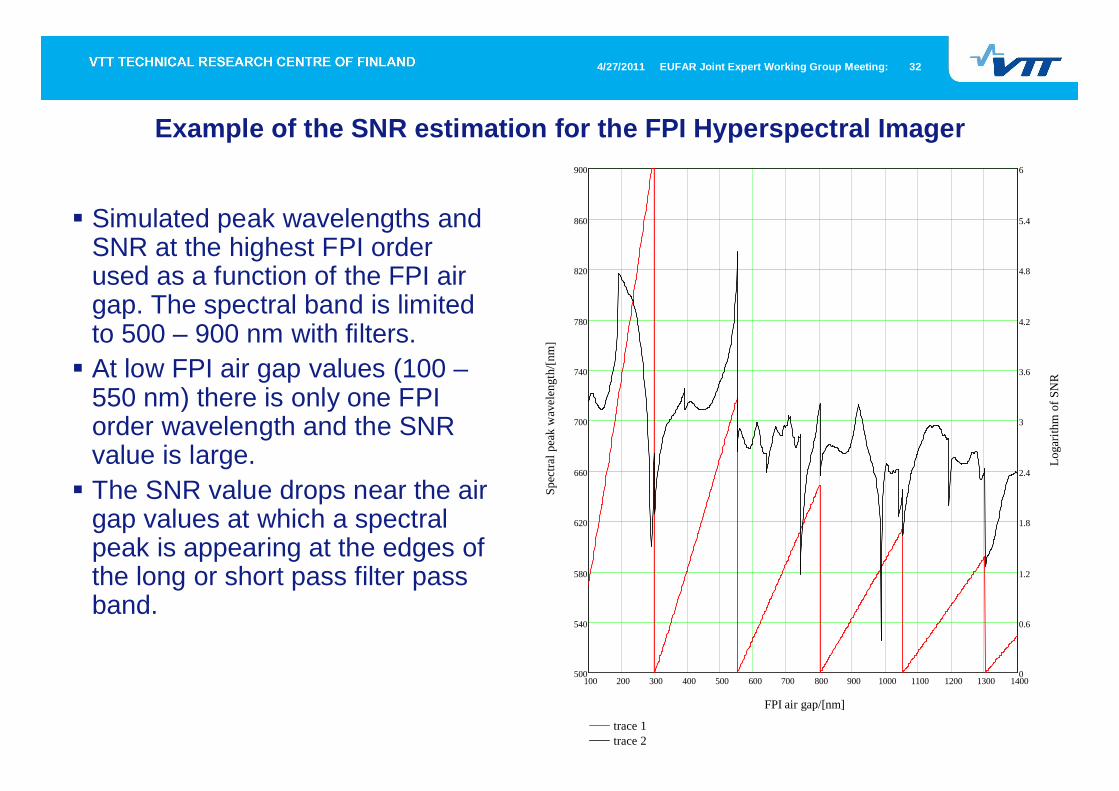
Simulated peak wavelengths andSNR at the highest FPI orderused as a function of the FPI airgap. The spectral band is limitedto 500 – 900 nm with filters.At low FPI air gap values (100 –550 nm) there is only one FPIorder wavelength and the SNRvalue is large.The SNR value drops near the airgap values at which a spectralpeak is appearing at the edges ofthe long or short pass filter passband.
100 200 300 400 500 600 700 800 900 1000 1100 1200 1300 1400500
540
580
620
660
700
740
780
820
860
900
0
0.6
1.2
1.8
2.4
3
3.6
4.2
4.8
5.4
6
trace 1trace 2
FPI air gap/[nm]
Spec
tral p
eak
wav
elen
gth/
[nm
]
Loga
rithm
of S
NR

4/27/2011 EUFAR Joint Expert Working Group Meeting: 33
Devices built based on the piezo-FPIs
Chemical Imager (1-2.5 µm)Malinen, J. et.al., “Comparative performance studies between tunablefilter and pushbroom chemical imaging systems”, Proc. SPIE 7680(2010).
Handheld hyperspectral imager (400-700 nm)Saari, H. et.al., “Hand-Held Hyperspectral Imager”, Proc. SPIE 7680(2010).
Light-weight hyperspectral imager for UAVs (500-900 nm)Saari, H. et.al., “Novel Hyperspectral Imager for Lightweight UAVs”,Proc. SPIE 7668 (2010)
Handheld hyperspectral imager for remote sensing, food quality andmedical applications
Saari, H. et.al. Handheld spectral imager for remote sensing, food qualityand medical applications. Proceedings of Finnish Remote Sensing Days3.-4.11.2010.

4/27/2011 EUFAR Joint Expert Working Group Meeting: 34
Applications
The light weight and framing imaging mode enable totally new applications forthe hyperspectral imaging because cost effective UAVs can be used toacquire data.The remote sensing applications that can benefit from the new UAVinstrument include precision agriculture, forestry, natural water monitoringapplications.In space the need of compact hyperspectral imager has been also beenidentified and the new technology to manufacture RGB-type pixelizedmultispectral image sensors for wide spectral range including IR enables thedevelopment of a highly compact hyperspectral imager for SWIR (1.0 – 3.0µm) range using MCT detector & multispectral filter in combination of Fabry-Perot interferometer.The hyperspectral imaging has been used in medical imaging, accurate colormeasurements, pharmaceutical manufacturing, diagnostic test analysisequipment, art restoration, archaeology etc.The presented new concept has potential to offer hyperspectral imagingsystem at a much lower cost level opening many applications in which it hasbeen previously blocked by the cost of hardware.

4/27/2011 EUFAR Joint Expert Working Group Meeting: 35
Conclusions and future plansThe Fabry-Perot Interferometer technology has been developed at VTT to level that itcan be used in hyperspectral imagersIn many applications it is beneficial to produce megapixel 2D spatial images with asingle exposure at a few selected wavelength bands instead of 1D spatial and allspectral band images like in push broom instruments.In this spectrometer the multiple orders of the Fabry-Perot Interferometer are used atthe same time matched to the sensitivities of the multispectral image sensorwavelength channels.The F-number of the spectral camera can be as low as 1.0 for cases were full spectraldata cube is to be measured.The size (< 65 mm x 65 mm x 120 mm), weight (< 400 g) and power consumption (< 3W) of the FPI hyperspectral spectrometer is compatible with the light weight UAVplatforms.The Finnish Aalto-1 Nanosatellite Payload will be based on the MEMS FPIhyperspectral imager.
ContactsHeikki SaariVTT Photonic Devices and Measurement SolutionsPL1000, Espoo, FinlandPhone: +358 40 5891254Email: [email protected]

4/27/2011 EUFAR Joint Expert Working Group Meeting: 36
Additional slides on the-state-of-the-art of thehyper and multispectral imaging technologyand on planned UAV applications of Fabry-
Perot Interferometer spectral imager

4/27/2011 EUFAR Joint Expert Working Group Meeting: 37
State-of-the-art in multi&hyperspectral imaging
New multispectral technologies are being developed by companies like OceanOptics, Silios, etc.The Rotating Filter Wheel (RFW) Multispectral Camera technology has developedwith small steps during recent years.The new opportunities is offered by the Dichroic Filter Array (DFA) MultispectralCamera technology presented by Ocean Optics at the SPIE conference “Imaging,Manipulation, and Analysis of Biomolecules, Cells, and Tissues VIII” SPIE Vol.7568.VTT has developed MEMS Fabry-Perot Interferometers for the visible wavelengthrange. This technology is planned to be used in the Finnish Aalto-1 nanosatellite forhyperspectral remote sensing.The combination of a MEMS FPI and a dichroic filter array would enable to build ahyperspectral imager whose spectral bands could be tuned to various applications.

4/27/2011 EUFAR Joint Expert Working Group Meeting: 38
Rotating Filter Wheel (RFW) Multispectral Camera
Multispectral imaging has traditionallybeen performed with rotating filter wheel.If the wavelength bands required for theapplication are known the RFWmultispectral imager is a straight forwardsolution.The disadvantages of the RFW conceptare
Tuning of the spectral bands is notpossibleThe spectral bands are registered atdifferent timesThe miniaturization is challanging
because of the filter wheelmechanism.
Ref. Eichenholz, J.M., et.al., “Real time Megapixel Multispectral Bioimaging”, Proc. SPIE 7568 (2010).

4/27/2011 EUFAR Joint Expert Working Group Meeting: 39
Dichroic Filter Array (DFA) Multispectral Camera
The physical size of the DFA is 35mm x 23 mm and there are3500x2500 individual filters on theDFA. The pixel pitch is 10 m x 10
m.The image of a target is formed onthe DFA surface and the Microscopeobjective forms an image of the DFAon the Camera sensor.The advantages of DFA camera are
The spectral bands areregistered simultaneouslyNo moving parts
The disadvantages of the DFAconcept are
Tuning of the spectral bands isnot possibleThe miniaturization ischallenging because of relayoptics required for imaging theDFA to the image sensor. Ref. Eichenholz, J.M., et.al., “Real time Megapixel
Multispectral Bioimaging”, Proc. SPIE 7568 (2010).

4/27/2011 EUFAR Joint Expert Working Group Meeting: 40
Hyperspectral imager concept based on combining a Dichroic Filter Arraywith Fabry-Perot Interferometer
One can separate the multiple orderpeaks by using special filters!

4/27/2011 EUFAR Joint Expert Working Group Meeting: 41
Application of spectral imaging in crop farmingApplication of spectral imaging in crop farming-- Information flow is marked with numbersInformation flow is marked with numbers
Spectral libraries for interpretationSupport for interpretation andfarming planning-manual&automatic
FARMING TASKS
Weather and otherambient env. data
WEB data basesfor farmers data
FARMER INDUSTRY
DATA FOR A FARM
ADMINISTRATION
Research
FERTILIZING SPRAYING
Aerial imagesInterpreted images
Planning mapsActual maps
Aerial images
Enchanhed farming and production planning- saves in fertilizer, watering & other costs- Product quality > price- Environmental issues
Forecasting and traceability data (contracts)Amount and quality of crop yield
1.
3.
2. 4.
5.
6.6.
Knowledge on thevalidity of the EUsupport conditions
6.
Support for productdevelopment
INFORMATION SERVICES/ FARMING PROGRAMS

4/27/2011 EUFAR Joint Expert Working Group Meeting: 42
Application of spectral imaging in forestry applicationsApplication of spectral imaging in forestry applications--Information flow is marked with numbersInformation flow is marked with numbers
Cutting of forest
WEB-DATABASESForest Remote Sensing data
INFORMATION SERVICES
Forest officer/Forest usage planner INDUSTRY
Stand based data
ADMINISTRATION
RESEARCH
Spectral data bases
Interpretation + forest usageplanning
Aerial imagesInterpreted images
Borders of the area to be cut- Image data of the forest area- tree volume and species dataAerial images
Cutting planning-stand based tree volume and-tree species data to PC- More accurate cutting plansaving cost in cutting work
Forecasting and traceability data (contracts)amount, species and quality of cut trees
2.
1.
6.
3.
5.
Knowledge on thevalidity of the EUsupport conditions
6.
4.
Cutting plan
Weather and otherambient env. data

43
Aalto-1The Finnish Student Satellite
Aalto-1The Finnish Student Satellite
Aalto-1 Nanosatellite PayloadOverview
A miniature Hyperspectral Imager based on a tunable Fabry-PérotinterferometerJoint project between Aalto-university and VTT Technical ResearchCentre of FinlandThe spectrometer module is built and developed by VTT TechnicalResearch Centre of FinlandThe spectral imager is accompanied by a high resolution digitalcameraThe smallest hyperspectral imager to be used in a satellite
3/17

4/27/2011 EUFAR Joint Expert Working Group Meeting: 44
Spectral imaging for the monitoring of Wine leave health status
Wine grapes are robust plants that canlive more than 100 years but, dependingon the atmospheric conditions, they maybe attacked by several different plaguesor diseases along their lives, or even byhailstorms. And all these problems affectin different ways to the quality of thegrapes growing on those wines and,consequently in the long run, to the wine.Spectral imaging experiments wereplanned to detect Mildew on Wine leavesDowny Mildew is a disease that can beextremely serious in grapes and willcause severe crop loss. The fungusPlasmopara viticola causes downymildew.

4/27/2011 EUFAR Joint Expert Working Group Meeting: 45
45http://www.flir.com/thermography/eurasia/en/
Case 2: Spectral imaging in clinical processes especially brain surgery 1(2)
http://www.infraredcamerasinc.com
Infrared thermal Image ofdeep vein Thrombphlebituon the left leg
Cedip IR camera

4/27/2011 EUFAR Joint Expert Working Group Meeting: 46
Case 2: Spectral imaging in clinical processes especially brainsurgery 2(2)
In the MEDI-IMAGINGproject Fabry-PerotInterferometer Spectralcamera will be integratedto the Zeiss Penterobrain surgerymicroscope.The spectral range usedin the study is 400 –1000 nm.
The spectralcamera isplanned to beintegrated to theZeiss penterobrain surgerymicroscope atthe KuopioUniversityHospital