Embed Size (px)
Citation preview

Propaganda and Protest:
Evidence from Post-Cold War Africa∗
Brett L. Carter† Erin Baggott Carter‡
December 29, 2016
Abstract
Does propaganda reduce the probability of popular protest in Africa’s contemporary autocracies?
To answer this question, we draw on an original dataset of state-run newspapers from 21 African
countries, encompassing two languages and roughly 600,000 articles. We find that propaganda
diminishes the probability of protest, and that its effects persist over time. By increasing the level
of pro-regime propaganda by one standard deviation, autocrats have reduced the probability
of protest the following day by 8%. The half-life of this effect is between 4 and 12 days, and
between 10% and 20% of the initial effect persists after one month. This temporal persistence
is remarkably consistent with campaign advertisements in democracies.
Word Count: 10,946
∗For helpful comments, we thank Andrew Coe, Benjamin Graham, David Kang, Alex Lin, Bryn Rosenfeld, ArthurSpirling, and participants at the ISA 2016 annual meeting, USC Center for International Studies Workshop, and theNYU Text as Data Speaker Series. We especially thank James Lo for sharing his code and expertise. Author orderwas determined randomly.†Assistant Professor, School of International Relations, University of Southern California. [email protected].‡Assistant Professor, School of International Relations, University of Southern California. [email protected].
1

1 Introduction
Does propaganda work? Scholars increasingly find that it can. In pre-World War II Germany, state
radio broadcasts increased support for the Nazi regime and, in historically anti-Semitic regions,
the rate at which Jews were denounced and deported to concentration camps.1 During the 1994
Rwandan genocide, radio broadcasts increased the Tutsi death toll by 10%.2 During the 1999
Russian parliamentary election, access to independent television decreased the likelihood of voting
for President Vladimir Putin’s United Russia by 8.9 percentage points.3 Today, Chinese students
exposed to propaganda in an educational setting are more likely to believe the regime is strong and
less willing to engage in political dissent.4
Popular protests increasingly constitute the chief threat to autocratic survival, especially in
Sub-Saharan Africa, where the rate of military coups has declined dramatically in recent decades.5
In this paper, we ask whether pro-regime propaganda has diminished the rate of popular protest
in Africa’s contemporary autocracies. To do so, we draw on an original dataset of state-run news-
papers from 21 African countries, encompassing two languages and roughly 600,000 articles. To
collect this corpus, we scraped online newspaper archives using the Python programming language.
When online archives were not available, we manually downloaded articles from Lexis Nexis. We
then identified each country’s incumbent executive during the sample period, as well as his po-
litical party; we refer to these proper nouns as “identifiers.” Next, we transformed the corpus of
articles into time series data by measuring the valence – both positive and negative – of the words
immediately surrounding each identifier on a given day. The result is a country-day dataset that
records the amount of coverage for the executive and his political party, as well as its tone. In
defining propaganda as positive spin rather than objective falsehood, we follow Joseph Goebbels,
the chief architect of Nazi Germany’s propaganda apparatus.6 Accordingly, in our dataset, more
propagandistic coverage presents the regime in a more favorable light. For purposes of comparison,
we collected similar data for state-affiliated newspapers in democracies.
Autocrats employ propaganda strategically. Therefore, when estimating the effect of propa-
ganda on the probability of protest, we confront two forms of selection bias. First, autocrats who
employ propaganda may be systematically different than those who do not, and in ways that are
correlated with the probability of protest. We refer to this as “autocrat selection bias,” and it may
1Adena et al. (2015).2Yanagizawa-Drott (2014).3Enikolopov, Petrova and Zhuravskaya (2011). See also White, Oates and McAllister (2005).4Huang (2015). Propaganda also appears to be important in transitional democracies. Boas and Hidalgo (2011)
find that municipal politicians in Brazil regard community radio stations as “spoils of office” and use them to cementfuture victories. See also McMillan and Zoido (2004), Greene (2011), and Lawson and McCann (2005).
5Goemans and Marinov (2014) document this decline and argue that it was caused by pressure from Westerncreditors.
6When crafting propaganda, Joseph Goebbels, architect of Nazi Germany’s propaganda apparatus, favored positivespin over lies because “otherwise the enemy or the facts might expose falsehoods” (Taylor 1998). To measure positivespin, we follow the methods developed in Carter and Carter (2016).
2

occur for a variety of reasons. Most obviously, the autocrats most likely to employ propaganda may
exert particularly strong control over their countries’ media environments, and this degree of control
could be associated with higher or lower levels of popular protest. Second, autocrats employ pro-
paganda differently at different times of year, and these moments may be systematically associated
with popular protests. We refer to this as “temporal selection bias,” and it too may emerge for a
variety of reasons. Carter and Carter (2016) find that the rate of propaganda in African and Asian
autocracies rises immediately before elections, when autocrats have a particularly strong incentive
to manipulate the beliefs of their citizens.7 Additionally, autocratic propaganda apparatuses may
provide more positive coverage when there is more genuinely good news: when the unemployment
rate is lower or when the economy grows more quickly. If positive coverage indicates genuinely
good news rather than pro-regime propaganda – and citizens are less likely to protest during these
moments – then an estimated relationship between propaganda and protest will be spurious.
To accommodate autocrat selection bias, we employ estimating equations with autocrat-level
fixed effects. In so doing, we ask how changes in the volume of propaganda on day t− 1 condition
the probability of protest on day t. To accommodate temporal selection bias, we control for a range
of time variant features that may condition whether autocrat i employs propaganda on a given day
or during a given year: whether day t falls during an election season or on election day itself,
any prevailing political instability, country i’s history of political instability up to day t, the rate of
internet access, as well as a range of economic measures that reflect the living conditions of citizens.
We control for the daily amount of genuinely positive developments in country i by measuring the
amount of positive less negative coverage it receives in the world’s newspapers of record. As
robustness checks, we estimate a series of Markov transition models, which focus exclusively, in
turn, on country-days following protests and country-days where no protests occurred on day t−1.
In addition to these baseline models, we draw on recent research in American politics to probe
whether the effects of propaganda persist over time. Indeed, scholars increasingly find that political
messaging in democracies has the strongest effect on citizens’ beliefs immediately after consumption.
Although these effects decline quickly, they tend to persist, with half-lives of roughly one week. We
explore whether the effect of pro-regime propaganda on popular protest exhibits similar properties.
If propaganda has measurable effects on the rate of protest on day t, is some proportion of the
effect still felt in the days or weeks that follow? Put otherwise, does the autocrat’s decision to
employ propaganda on day t have a measurable effect on the probability of protest on day t + 5
or t+ 15? To answer this question, we follow Hill et al. (2013), who identify a series of functional
forms that fit how memories and beliefs fade over time. Hill et al. (2013) refer to these as decay
functions, and, like them, we ask which among several best fit the patterns in our data.
We find that pro-regime propaganda is associated with a substantively meaningful reduction
in the probability of popular protest. By increasing the level of pro-regime propaganda by one
7See also Carter (2016a).
3

standard deviation, Africa’s autocrats have reduced the probability of protest the following day
by 8%. This effect is relatively durable. Depending on the form of the decay function, the half-
life of the effect is between 4 and 12 days. One month later, some 10% to 20% of the initial
effect still persists. This temporal signature is strikingly consistent with political messaging in
American politics. In short, propaganda in autocracies appears to condition protests much as
campaign advertisements in democracies condition voting. Our data do not permit us to identify
precisely why propaganda reduces the rate of protest. Indeed, the mechanisms of behavior change
in democracies and autocracies may be quite different. It is possible, for instance, that propaganda
persuades citizens of the regime’s merits, and hence mitigates the frustration that compels protest.
Alternatively, propaganda might constitute a signal, implicitly understood by citizens, about the
autocrat’s willingness to employ violence to retain power, which diminishes the probability of
protest by increasing its expected costs to citizens. We discuss these mechanisms in more detail
in Section 2. In Section 6 we discuss how subsequent research might adjudicate among them. As
a placebo, we estimate similar models for our sample of state-affilated newspapers in democracies;
we find no effect on the rate of popular protest.
This paper contributes to the broader literature on autocratic survival. Scholars increasingly
recognize that the world’s autocrats attempt to discourage mass protests by manipulating their
citizens’ informational environments. Social media and domestic newspapers figure prominently
in these efforts. King, Pan and Roberts (2013, 2016) find that the Chinese government employs
electronic tools to censor online discourse about collective action and, during politically sensitive
moments, trumpets the regime’s accomplishments. Munger et al. (2016) show that the Venezuelan
government uses Twitter to steer social media discourse away from protests, once they emerge.
Carter and Carter (2016) find that autocrats across Africa and Asia sharply increase pro-regime
propaganda in state-run newspapers during election seasons. These techniques are well documented,
but we know little about whether they actually achieve their aims. This paper provides evidence
that they do.
In so doing, this paper joins a growing wave of scholarship that locates the origins of autocratic
survival in the politics of information and belief. This was once the chief way that scholars explained
autocratic durability. As Tullock (1987) put it: “As long as people think that the dictator’s power
is secure, it is secure.”8 Scholars routinely seek the origins of autocratic survival in formal political
institutions: single party regimes9 or national legislatures populated by regular elections.10 But in
post-Cold War Africa, autocrats have access neither to the single party regimes of their Cold War era
8If beliefs were critical to sustaining an autocrat’s power, so too, scholars concluded, could they bring an autocratdown. This time, scholars drew not on the durability of the 20th century’s most famous dictators, but rather thestunning ease with which they were toppled. Among others, Kuran (1989) famously explained how the Soviet Unioncould collapse so thoroughly by applying “tipping point” models of collective action developed in the late 1980s andearly 1990s.
9Brownlee (2007), Slater (2010), Svolik (2012).10Lust-Okar (2006), Magaloni (2008), Gandhi and Przeworski (2007), Gandhi (2008), Wright (2008), Blaydes
(2008), Gandhi and Lust-Okar (2009).
4

predecessors nor welcome the nominally democratic institutions mandated by Western creditors.
They also lack the easy recourse to repression on which their predecessors often relied.11 Most
broadly, our results suggest that the struggle for citizens’ beliefs is fundamental to understanding
how autocrats survive.
This paper proceeds as follows. Section 2 surveys recent scholarship on political communication
in autocracies and democracies, from which we derive our hypotheses for empirical testing. Sec-
tion 3 introduces our corpus of 21 state-run newspapers and describes our measure of propaganda.
Section 4 estimates the effect of pro-regime propaganda upon the rate of popular protest. Section 5
explores to what extent the initial effects of propaganda persist over time. Section 6 concludes with
suggestions for future research. In the online appendix we provide additional information about
our measure of propaganda and our corpus of newspapers.
2 Theoretical Framework
2.1 Mechanisms of Propaganda and Protest
Autocratic propaganda may alter the beliefs or behaviors of citizens through a variety of mecha-
nisms.12 In the context of popular unrest, three are particularly salient.
First, pro-regime propaganda may change citizens’ beliefs about the autocrat’s performance in
office. If autocrats regard their citizens as rational Bayesians, they may instruct their propaganda
apparatuses to cultivate a reputation for neutrality. By mixing factual reporting with useful fic-
tions, Gentzkow and Shapiro (2006) and Gehlbach and Sonin (2014) show theoretically, autocratic
propaganda apparatuses acquire some reputation for credibility, and hence too the capacity to
shape their citizens’ beliefs. Carter and Carter (2016) show that autocrats across Africa and Asia
appear to employ precisely this strategy. State-run newspapers in autocracies, they find, cover their
incumbent regimes almost as neutrally as do state-affiliated newspapers in democracies, which are
often lauded by Western donors for their journalistic integrity. The exception is during election
seasons, when autocrats require their citizens’ acquiescence and attempt to secure it with a burst
of pro-regime propaganda. If citizens are not rational Bayesians, the scope for propaganda to ma-
nipulate beliefs is likely more profound. Citizens may underestimate the biases in media content,13
be constrained by memory limitations,14 or double count reported information.15
Second, pro-regime propaganda may compel citizens to question the beliefs of their neighbors.
Even if individuals are not persuaded by pro-regime propaganda, they may have less confidence
in their neighbors’ ability to distinguish fact from fiction. In autocracies, this alone is sufficient
11See Carter (2016b) and Aronow, Carnegie and Marinov (2012).12In the democratic context, there is considerable evidence that political messaging alters the beliefs of those who
consume it. See, for example, DellaVigna and Gentzkow (2010).13Cain, Loewenstein and Moore (2005), Eyster and Rabin (N.d.).14Mullainathan, Schwartzstein and Shleifer (2008).15DeMarzo, Vayanos and Zwiebel (2003).
5

to generate widespread popular compliance. Little (2015) shows formally that if citizens believe
their neighbors view government propaganda as credible, then it can affect mass behavior without
affecting mass beliefs. Citizens engage in “preference falsification” by acquiescing to the regime,
like their neighbors, lest they be punished for non-compliance.16
Even if citizens are unpersuaded by pro-regime propaganda – and citizens know that their
neighbors are similarly unpersuaded – propaganda may still reduce the rate of popular protest.
The reason is that propaganda may convey information to voters about the autocrat’s willingness
to use force to retain power. In particular, citizens may believe that an autocrat who broadcasts
obviously false platitudes may also employ violence against citizens. In game theoretic terms, the
use of propaganda may convey information about an autocrat’s type.
There is some evidence of this. The Republic of Congo was wracked by a series of civil wars
between 1993 and 2003. The most intense round of fighting occurred between June and October
1997, when Denis Sassou Nguesso deposed Pascal Lissouba, the only democratically elected presi-
dent in Congo’s history. The war killed roughly 1% of the country’s citizens and displaced at least
30%. Sassou Nguesso’s propaganda newspaper, Les Depeches de Brazzaville, frequently casts him
as the “apostle of peace,” the “guarantor” of the country’s “cherished” stability. Some Congolese
citizens interpret these fulsome allusions as threats: about the violence Sassou Nguesso is willing to
employ to retain power. Given the prospect of violence, citizens in autocracies may be particularly
sensitive to these signals, and hence be less likely to protest after receiving them.
These three mechanisms yield our first hypothesis.
Hypothesis 1: Propaganda should reduce the contemporaneous probability of popular protest.
2.2 Temporal Dynamics of Propaganda
Social psychologists have long recognized that the effects of persuasive communication are most
profound immediately after consumption, and then decline quickly after.17 This appears to be true
for political messaging in democracies. Hill et al. (2013) find that the half-life of American campaign
advertisements is roughly one week. Similarly, casualty reports decrease popular support for a war,
but only for one to two months at a time.18 A large experimental study supports these conclusions.
Gerber et al. (2011) randomly assigned $2 million of television and radio advertisements to different
media markets in the 2006 Texas gubernatorial race. A tracking poll conducted telephone interviews
with 1,000 registered voters each day. Advertisements had strong but short-lived effects on voting
preferences, with their effects relatively undetectable a week or two after consumption.
Political communication rarely has long-term effects, these scholars suggest, because it does not
elicit “effortful processing” from consumers. That is, citizens generally consume political adver-
16Kuran (1997); Wedeen (1999). See also Davison (1983).17Cook and Flay (1978).18Hayes and Myers (2009); Althaus, Bramlett and Gimpel (2012). See also Sides and Vavreck (2013).
6

tisements in passing, without actively internalizing them. For persuasive communication to have
lasting effects on the beliefs of consumers, it must induce individuals to process it actively. If it
does not, consumers will revert to their prior beliefs relatively quickly.19
Our understanding of propaganda is consistent with this general framework, with some impor-
tant nuances. Each of the three theoretical mechanisms above implies that the effects of propaganda
should persist over time. They have different implications, however, for the duration of this persis-
tence. Propaganda that aims to influence beliefs about regime performance is theoretically similar
to a campaign advertisement. To illustrate how, in Table 2 we reproduce a series of excerpts from
Paul Kagame’s The New Times, which cite his efforts to improve infrastructure and help young
people “realise their full potential.” They bear a striking resemblance to American campaign ad-
vertisements, and hence their persuasive effects may decay at similar rates. If anything, we might
expect the persuasive effects of pro-regime propaganda in autocracies to decay even more quickly
than campaign advertisements in democracies. Each country in our sample is relatively poor, and so
the gap between regime promises and citizen welfare tends to be large. Moreover, the welfare gains
that occur are generally concentrated among elites. Accordingly, we expect the facade of regime
performance to be difficult to maintain. Whatever effect performance propaganda may have, it is
likely temporary, undone by economic realities.
If, by contrast, propaganda conditions the rate of popular protest chiefly by signaling the
autocrat’s willingness to employ violence, then citizens likely engage in the “effortful processing”
that social psychologists regard as critical for propaganda to have durable effects. In this case, we
should expect the effects of pro-regime propaganda to persist after the initial signal, and potentially
much longer.
In short, although the three theoretical mechanisms above suggest that pro-regime propaganda
should diminish the rate of protest, they have different implications for the effect’s persistence.
Still, we frame our second hypothesis generally.
Hypothesis 2: The effect of propaganda upon protest will decay over time.
3 Measuring Propaganda
3.1 Identifying and Collecting State-Run Newspapers
To create the dataset, we identified the most widely distributed state-run newspapers for as many
autocracies as possible in Africa.20 We then restricted attention to newspapers that are published
in English and French, languages for which quantitative text analysis methods are well developed.
Moreover, since we speak them fluently, we can identify important colloquialisms. We further
19Hill et al. (2013).20We draw our regime classifications from Svolik (2012) and update them through 2015.
7

restricted attention to state-run newspapers with online archives to facilitate data collection and
computational processing.
Although these two restrictions were critical for data collection, each entails a drawback. First,
by restricting attention to state-run newspapers in English and French, we were unable to include
several prominent propaganda newspapers that are published in Arabic, Portuguese, and widely
spoken African languages. Although this restriction may reduce the precision of our statistical
estimates, we do not believe it generates bias. We have no reason to believe, for instance, that the
Ethiopian government’s propaganda newspaper, Addis Zemen, published in Amharic, is systemati-
cally different than Yahya Jammeh’s Daily Observer. Perhaps more importantly, for countries with
multiple politically salient ethnic groups, publishing a propaganda newspaper in a local language
would prevent many citizens from consuming it. Hence Denis Sassou Nguesso, who has ruled the
Republic of Congo for all but five years since 1979, publishes Les Depeches de Brazzaville in French
rather than Lingala, which is spoken mostly by the country’s northerners. By publishing pro-regime
propaganda in the language of the European colonizer, Africa’s autocrats implicitly target the ur-
ban citizens whose protests, given their proximity to the national capital, are most threatening, and
who read English and French at much higher rates than their rural compatriots.21 Accordingly, we
view the restriction to English and French media as theoretically appropriate, even if, by excluding
state-run newspapers in Burundi and Ethiopia, it reduces the precision of our statistical estimates.
Second, by restricting attention to state-run newspapers with online archives, we may leave open
the possibility of selection bias. It is possible that state-run newspapers with online archives are
systematically different than those without. In particular, autocrats who finance online archives for
propaganda newspapers may do so because their populations enjoy higher rates of internet access.
If this reflects superior access to information, these citizens could be more likely to protest. If
this reflects superior welfare, these citizens might be less likely to protest. We cannot rule this
possibility out.
Reflecting the growing prevalence of internet access across the world, however, we found that
autocrats who govern Africa’s poorest countries are as likely to maintain online archives as those
from more affluent countries. Rather, whether state-run newspapers maintain freely available online
archives appears to be more a function of regime type than GDP. We found that the vast major-
ity of autocrats make their state-run newspapers available online, accessible without restriction.
Since propaganda is useful only when consumed, most autocrats maximize its distribution, and so
seldom regard it as intellectual property. This is consistent with their approach to domestic dis-
tribution. Sassou Nguesso is again instructive. Les Depeches de Brazzaville remains Congo’s only
daily newspaper, printed in color on high quality paper. At a market price of roughly $0.20, it is
heavily subsidized by the state.22 Its primary competitor is La Semaine Africaine, an independent
21Bates (1983).22Interviews with anonymous journalists. Many claim that Les Depeches de Brazzaville is subsidized by the state
oil company.
8

newspaper that appears twice per week. Constrained by market forces, it sells for roughly $1.00,
despite being printed in black ink on cheap paper. In democracies, we found that state-affiliated
newspapers are far more likely to operate as a business, with articles behind a paywall. When
newspaper archives were not freely available, we acquired them from Lexis Nexis.
Although our chief theoretical focus is propaganda in autocracies, we include state-affiliated
newspapers from democracies as a baseline for comparison. These newspapers are generally holdovers
from a previous autocratic regime. In Senegal, for instance, Le Soleil was founded in May 1970
by President Leopold Sedar Senghor. Though by some accounts benevolent, Senghor nonetheless
tightly circumscribed press freedom, and Le Soleil remained the only newspaper that published
uninterrupted until the early 1990s. Senegal transitioned to democracy in 2000, when Abdoulaye
Wade defeated Senghor’s successor, Abdou Diouf, in an election so lopsided that Diouf chose to
step down after two decades rather than suppress protesters. In the years since the democratic
transition, the Senegalese state has remained the chief shareholder of Le Soleil. While its editorial
line remains somewhat pro-regime, it is regarded as far less biased than before the transition.23
Our final sample includes state-run newspapers from 21 countries from across Africa.24 Of these
21 state-affiliated newspapers, 12 were published under autocratic governments throughout the
sample period, seven under democratic governments throughout, and two experienced transitions
from autocracy to democracy.25 The sample reflects the heterogeneity of Africa’s autocracies. It
includes a police state (Eritrea), a monarchy (Swaziland), and a handful of autocracies governed
with nominally democratic institutions (Rwanda, Gambia, and others). A full list of newspapers,
by country, language, and regime type, appears in Table 1.
3.2 From Text to Time Series Data on Propaganda
After we finalized our sample of state-run newspapers, we either scraped their online archives using
the Python programming language or manually downloaded all available articles from Lexis Nexis.
To convert newspaper text into time series data on propaganda, we identified each instance that a
newspaper from country i referenced the autocrat or his ruling party on day t.26 For each, we then
extracted the 10 words before and after the identifier, a string known as a “concordance segment.”
Drawing on standard semantic dictionaries, we measured how fulsome or critical were these 20
words.27 The variable Positive Coverageit constitutes our measure of pro-regime propaganda, and
it measures the number of fulsome words, less critical words, among the 20, summed for day t.
23IREX (2014).24We include a detailed description of all newspapers in our sample in Section 8 of the online appendix.25We draw our regime classifications from Svolik (2012) and update them through 2015.26A list of these identifiers appears in Section 9 of the online appendix.27For English, we used Harvard General Inquirer (2015). For French, we translated the Inquirer. We lowercased
and stemmed each word in our corpus, dictionaries, and list of identifiers. We removed numbers, symbols, andpunctuation from the corpus before generating the concordance segments from which we extracted our measure oftone. See Grimmer and Stewart (2013) and Lowe et al. (2010).
9

The result is a country-day dataset that records the amount of coverage for the executive and his
political party, as well as its tone. Descriptive statistics for our Positive Coverageit variable appear
in Table 1.
(1) (2) (3) (4) (5) (6) (7) (8) (9)Country Newspaper Language Coverage Regime Country Positive Positive Protest
Spell Days Coverage Coverage RateMean St Dev
Madagascar La Verite French 2012-15 Aut 2485 0.37 3.95 0.04Libya JANA/LANA English 2014-15 Dem 1592 1.02 2.61 0.43
Guinea Aminata French 2012-15 Dem 2220 1.10 3.53 0.18Morocco Ag. M. De Presse French 2013-15 Aut 3287 1.11 2.91 0.18
Burkina Faso Sidwaya French 2010-12 Aut 2861 1.47 2.96 0.05Ghana Ghanaian Times English 2013-15 Dem 3287 1.67 3.65 0.01Tunisia La Presse French 2011-12 Dem 1813 1.67 3.64 0.47
Cote d’Ivoire Fraternite Matin French 2013-15 Dem 1726 1.96 4.22 0.53Djibouti La Nation French 2013-15 Aut 3287 2.15 3.99 0.00Eritrea Hadas Shabait English 2010-15 Aut 3287 2.66 5.06 0.00Mali L’Essor French 2014-15 Dem 3265 3.18 4.69 0.10Libya JANA/LANA English 2010-11 Aut 1695 5.86 9.78 0.01
Cameroon Cameroon Tribune French 2010-15 Aut 3287 6.82 10.84 0.13Malawi The Nation English 2012-15 Dem 3287 6.17 9.76 0.09Senegal Le Soleil French 2010-15 Dem 3287 13.57 16.37 0.09Rwanda The New Times English 2010-15 Aut 3287 16.94 17.07 0.01Tunisia La Presse French 2010-11 Aut 1474 16.18 13.23 0.02Zambia The Times English 2010-15 Dem 3287 17.80 20.13 0.09Uganda New Vision English 2010-13 Aut 3287 18.55 19.08 0.05Namibia New Era English 2010-15 Aut 3287 19.33 20.57 0.01
Swaziland Swazi Observer English 2015-15 Aut 3287 22.25 13.53 0.07Zimbabwe The Herald English 2010-15 Aut 3287 30.59 28.70 0.29Gambia Daily Observer English 2009-15 Aut 3287 66.17 41.29 0.00
Table 1: Propaganda Statistics by Country-Regime Spell. For clarity, countries are listed by theirmean level of positive coverage for the executive. Democracy spells are recorded in gray.
Gambia’s Daily Observer registers as the most propagandistic newspaper in our sample. We
regard this as unsurprising. Since seizing power in a 1994 coup, President Yahya Jammeh has
accumulated among the world’s worst human rights records. In 2011, Jammeh announced that he
would rule for “one billion years, God willing.” A recent USAID report observed that there are
only two independent newspapers in the country, and their journalists routinely self-censor to avoid
incarceration and, in some cases, assassination. Observed one Gambian journalist:
A cloud of fear to freely express oneself now hovers over the country. Citizens tend toopenly express their true opinions only in safe corners.28
Another Gambian journalist said:
28IREX (2014).
10
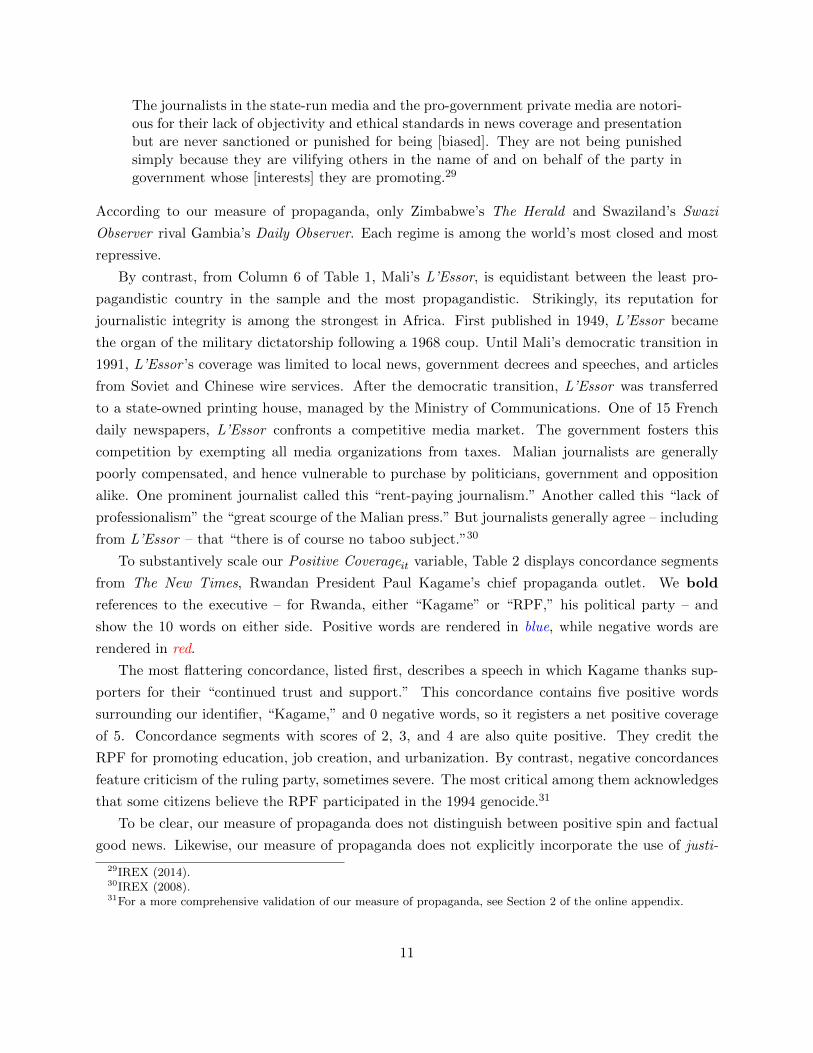
The journalists in the state-run media and the pro-government private media are notori-ous for their lack of objectivity and ethical standards in news coverage and presentationbut are never sanctioned or punished for being [biased]. They are not being punishedsimply because they are vilifying others in the name of and on behalf of the party ingovernment whose [interests] they are promoting.29
According to our measure of propaganda, only Zimbabwe’s The Herald and Swaziland’s Swazi
Observer rival Gambia’s Daily Observer. Each regime is among the world’s most closed and most
repressive.
By contrast, from Column 6 of Table 1, Mali’s L’Essor, is equidistant between the least pro-
pagandistic country in the sample and the most propagandistic. Strikingly, its reputation for
journalistic integrity is among the strongest in Africa. First published in 1949, L’Essor became
the organ of the military dictatorship following a 1968 coup. Until Mali’s democratic transition in
1991, L’Essor ’s coverage was limited to local news, government decrees and speeches, and articles
from Soviet and Chinese wire services. After the democratic transition, L’Essor was transferred
to a state-owned printing house, managed by the Ministry of Communications. One of 15 French
daily newspapers, L’Essor confronts a competitive media market. The government fosters this
competition by exempting all media organizations from taxes. Malian journalists are generally
poorly compensated, and hence vulnerable to purchase by politicians, government and opposition
alike. One prominent journalist called this “rent-paying journalism.” Another called this “lack of
professionalism” the “great scourge of the Malian press.” But journalists generally agree – including
from L’Essor – that “there is of course no taboo subject.”30
To substantively scale our Positive Coverageit variable, Table 2 displays concordance segments
from The New Times, Rwandan President Paul Kagame’s chief propaganda outlet. We bold
references to the executive – for Rwanda, either “Kagame” or “RPF,” his political party – and
show the 10 words on either side. Positive words are rendered in blue, while negative words are
rendered in red.
The most flattering concordance, listed first, describes a speech in which Kagame thanks sup-
porters for their “continued trust and support.” This concordance contains five positive words
surrounding our identifier, “Kagame,” and 0 negative words, so it registers a net positive coverage
of 5. Concordance segments with scores of 2, 3, and 4 are also quite positive. They credit the
RPF for promoting education, job creation, and urbanization. By contrast, negative concordances
feature criticism of the ruling party, sometimes severe. The most critical among them acknowledges
that some citizens believe the RPF participated in the 1994 genocide.31
To be clear, our measure of propaganda does not distinguish between positive spin and factual
good news. Likewise, our measure of propaganda does not explicitly incorporate the use of justi-
29IREX (2014).30IREX (2008).31For a more comprehensive validation of our measure of propaganda, see Section 2 of the online appendix.
11

Tone Concordance Segment
5 2010 presidential candidate. In his acceptance speech, President Kagame thankedRPF members for their continued trust and support for him. He
4 focus on education as well as job creation. Murayire said RPF’s goal is to enableyoung people realise their full potential
3 about, among other factors, is rapid rural-to-urban migration; which the RPFliberation unleashed with the freedoms accorded the people to seek
2 to be. Our history has taught us the right choice. RPF made the choice to workhard to achieve the dignity
1 at the National University of Rwanda, said. Omar said the RPF electorateappreciated their MPs’ previous performance basing on the infrastructure
0 Rwanda to free the people from fear caused by the RPF government. She madethe statements during an interview at Voice
-1 Kayibanda before him. Yet, there was no guarantee that the RPF governmentwould itself not fall in the same trap as
-2 ground in Rwanda. Trevidic’s predecessor, Jean-Louis Bruguiere, previouslyaccused the RPF of shooting down the plane, a move that led Rwanda
-3 a different story of the genocide in which he blames RPF for the massacres in1994 that claimed over one million
-4 all sorts of allegations and fabrications aimed at undermining the RPF party andits leadership. In a lecture he held at
-5 opponents and exiled members of the genocidal machinery, Bruguiere accusedRPF of carrying out the deadly April 6, 1994 attack that
Table 2: Example Concordance Segments. Positive valence words are shown in blue and negativevalence words in red. The first column reports our measure of Positive Coverage, positive wordsless negative words in concordance segments centered upon an executive identifier. We employedstandard text preprocessing practices. We lowercased and stemmed all words and removed numbers,symbols, and punctuation. For ease of interpretation, we did not preprocess the above concordancesegments.
fication or comparison frames: articles that defend the government’s record by appealing to past
difficulties or current difficulties in neighboring countries. Neither, however, constitutes a threat to
inference, as we illustrate in Section 4 of the online appendix.
4 Baseline Estimation
4.1 Protest and Regime Data
Propaganda and protest are both day-level events. Propaganda is distributed in print newspapers,
often published daily. Protests occur on specific days, either organized by political activists or
having emerged spontaneously. To avoid ecological bias, therefore, we treat the country-day as the
12

unit of analysis.32
In constructing our day-level dataset, we build on the work of others. Svolik (2012) provides
a roster of the world’s autocrats between 1960 and 2007; it includes the dates of their entry and
exit, as well as the means by which they did so. We update these data to 2015 for the countries
in our sample. We draw data on state repression and popular protests from the Social Conflict on
Africa Database (SCAD), introduced by Salehyan et al. (2012). SCAD records the daily number of
repression and protest events throughout the African continent since 1989. Based on an exhaustive
search of the Lexis Nexis archive, Salehyan et al. (2012) employed a research team to hand code
details about each repression and protest event. The result is the most detailed and complete
record yet assembled.33 The share of days on which a protest event occurred, by country, appears
in Table 1. Cha
4.2 Autocrat Selection Bias
Autocrats choose whether to employ propaganda; it is a strategic decision. As a result, autocrats
who employ propaganda may be systematically different than those who do not, and in ways
that are correlated with the probability of protest. For instance, since propaganda may be most
effective when citizens are unaware of it, the autocrats most likely to employ propaganda may exert
particularly strong control over their countries’ media environments. In turn, this degree of control
could be associated with higher or lower levels of popular protest.
To accommodate the possibility of autocrat selection bias, we employ estimating equations with
autocrat-level fixed effects. In so doing, we ask how changes in the volume of propaganda over a
given time frame affect the probability of protest on day t. Our baseline estimating equation is:
Pr (Protestit = 1) = α+ β (Positive Coverageit)
+β (Positive Coverageit × Election Seasonit)
+κXit + ψWis + γi + ε (1)
where i indexes country, t indexes day, s indexes year. The vectors Xit and Wis include all relevant
day- and year-level covariates, respectively, which we discuss below. To accommodate any unob-
served characteristics by country or year, we include a full set of country-level fixed effects, given
by γi.
32Ecological bias arises from aggregating day-level events into larger temporal units, such as the month or year.For more, see King (1997).
33This is the chief reason that we limit our country sample to Africa: day-level records of protest and repressionexist, and are of relatively high quality. The SCAD project recently expanded its country sample to include severalLatin American countries, mostly democracies.
13

4.3 Temporal Selection Bias
Autocrats who routinely employ propaganda may vary it according to the prevailing political envi-
ronment. Certain temporal windows could make propaganda and protest more common, and thus
render any observed relationship spurious. We discuss three such threats to inference below.
4.3.1 Election Seasons
Election seasons are a leading candidate for spurious correlation. Virtually all of Africa’s post-Cold
War autocrats govern with nominally democratic political institutions: presidential term limits,
multiparty legislatures, and regular elections. They have little choice. As scholars have observed,
Western donors virtually require nominally democratic institutions in exchange for development
aid and debt relief.34 These regular elections constitute “focal moments” for popular protest. Since
elections can help citizens coordinate otherwise dangerous anti-regime behavior, Carter (2016a)
finds, the probability of popular protest is some three to four times higher during election seasons
than on any other day of the calendar year.35 But because winning elections without obvious
fraud renders autocrats more secure from popular instability, elite coups, and Western pressure,
autocrats also face tremendous incentives to persuade citizens to vote for them. Accordingly, Carter
and Carter (2016) observe, pro-regime propaganda is three times as common during election seasons
than otherwise.
Since the rate of propaganda and the rate of protest both increase during election season,
failing to control for the effect of election season could make it appear that propaganda actually
increased the probability of protest. To avoid this possibility, we draw from the National Elections
Across Democracy and Autocracy (NELDA) dataset. Introduced by Hyde and Marinov (2012),
the NELDA dataset records the date of every election around the world between 1960 and 2010.
We update the dataset to 2015 for the countries in our sample. Following previous research, we
control for whether day t in country i falls within the 15 days before and after election day. We
refer to this 30 day period as an election season. We also let the effect of Positive Coverageit on
protest depend on whether day t occurred during an election season.
4.3.2 The “Good News” Effect
A second potential source of temporal selection bias is what we refer to as the “good news” ef-
fect. Autocratic propaganda apparatuses may provide more positive coverage when there is more
genuinely good news: when the unemployment rate is lower or when the economy grows more
quickly. Citizens, of course, are less likely to protest during these moments. We control for a
range of economic indicators that reflect living standards: country i’s real GDP, GDP per capita,
employment rate, oil supply, and internet penetration rate. Observed annually, however, these
34Bratton and van de Walle (1997), Dunning (2004), Levitsky and Way (2010), and Goemans and Marinov (2014).35McFaul (2005), Tucker (2007), Radnitz (2010), Bunce and Wolchik (2011), and Fearon (2011).
14

economic indicators may be crude. It is possible that good news emerges by the day or week, that
the autocrat’s propaganda apparatus reports this news objectively, and that citizens respond by
protesting less. In short, annual economic indicators may be unable to totally account for genuine
good news, which renders citizen protests less likely.
Table 3: Corpus of Global Newspapers of Record
Al Jazeera English AllAfrica.com BBC MonitoringInternational New York Times Newsweek Oil and Gas JournalOil Daily Petroleum Economist The Standard (UK)The Telegraph (UK) The Mirror (UK) The Christian Science MonitorThe Courier Mail (Australia) The Daily Mail (UK) The Evening Standard (UK)The Globe and Mail (Canada) The Washington Post The Toronto StarIRIN UN News Service USA TodayWall Street Journal Agence France Presse Associated PressCNN News Bites – Africa PR Newswire AfricaUnited Press International
To ensure that this possibility does not drive our results, we create the variable Good Newsit.
We do so much as we did Positive Coverageit. For each country i, we downloaded from Lexis
Nexis every article that references country i from the world’s news organizations of record. We
identify 28 such news sources, which appear in Table 3. Then, for each article in the corpus, we
identify every mention of country i’s executive or his ruling political party; as above, we refer
to these proper nouns as identifiers. Next, we extract the 20 words surrounding each identifier.
Using standard semantic dictionaries, we measure how fulsome or critical are these 20 words. The
resulting Good Newsit variable, we believe, is as close to an objective measure of “good news,”
recorded at the day level, as currently exists.
To assess the measure’s plausibility, we estimate a series of bivariate regressions. The results
appear in Table 4. From Model 1, our measures of Good Newsit and Positive Coverageit are strongly
correlated. We regard this is unsurprising, as autocratic propaganda apparatuses surely capitalize
upon – and claim credit for – positive developments. Since our economic indicators are observed at
the country-year level, to estimate Models 2 through 4 we calculate annual means of Good Newsit.
As expected, both measures of GDP are positively correlated with our measure of good news, as is
the employment rate. This suggests that global newspapers of record are indeed picking up welfare
gains across Africa’s autocracies.
4.3.3 Protest and Repression Histories
A final potential source of temporal selection bias is the recent history of protest and repression.
It is possible, for instance, that protests on day t− 1 may render continued protests on day t more
likely and simultaneously compel the regime to increase propaganda. Likewise, if the autocrat
15

Table 4: Correlates of Good Newsit in Autocracies
Model 1 Model 2 Model 3 Model 4Country-Day Country-Year Country-Year Country-Year
Positive Coverage 0.036∗∗
(0.005)ln Real GDP Expenditure Side 1.623∗∗
(0.563)
Employment 17.821†
(9.005)ln GDP Per Capita 1.280
(1.183)N 10,868 22 22 22
Significance levels: † : 10% ∗ : 5% ∗∗ : 1%
employs repression on day t−1, citizens may be particularly angry on day t, rendering propaganda
especially useful. Alternatively, in response to repression on day t− 1, citizens may be less inclined
to protest today, rendering propaganda less critical for the autocrat. To be clear, the first two
sources of bias, if unaccounted for, should bias against the theoretical mechanisms above, and the
third should bias in favor of them.
We control for underlying political instability in several ways. First, we control for whether day
t−1 witnessed a protest or repression event. Like our measure of protest, we draw data on repression
from the SCAD dataset. Second, since these lagged measures of protest and repression may not
fully capture prevailing political instability, we also control for the number of days in the preceding
week on which a protest occurred. We label this variable Protest History: Weekit, and we create a
similar variable, Repression History: Weekit, that measures the numbers of days in the preceding
week on which an autocrat employed repression. Finally, to ensure that we fully accommodate
any latent political instability that could be associated with both protest and propaganda, we also
control for the number of days in the preceding month on which a protest occurred. We label
this variable Protest History: Monthit, and we create an analogous Repression History: Monthit
variable similarly. In the online appendix, we control for repression and protest during much
wider temporal windows: over the preceding three months, six months, one year, and two years.
Descriptive statistics for all variables used in our analysis appear in Table 30 of the online appendix.
4.4 Results
The results appear in Table 5. Across models, pro-regime propaganda on day t−1 renders protests
less likely on day t. In particular, each additional positive word about the autocrat, from among
the surrounding 20, renders popular protests roughly 2% less likely. This effect is substantively
meaningful. The mean level of pro-regime propaganda in our sample is roughly 19 words per day,
with a standard deviation of roughly 29 words per day. If an autocrat shifts from an average level of
16

pro-regime propaganda on day t to a standard deviation greater, then, we estimate, the probability
of protest falls by some 8%.
Protests may be correlated across days. It may be much easier, for instance, to sustain a protest
once it has emerged than to initiate one in the first place. As a result, the outcome variable in
equation (1) may be serially correlated. As a robustness check, we employ a Markov transition
framework.36 That is, we restrict attention to country-days where no protests occurred on day
t− 1, and hence discard country-day observations where some protest event occurred on day t− 1.
In so doing, we measure the effect of media coverage on the probability that protests emerged on a
given day t. The results appear in Table 6, and they are essentially identical to the baseline results
in Table 5.
For comparison, we reestimate equation (1), now restricting attention to country-days where
protests occurred the day before. In so doing, we measure the effect of media coverage on the
probability that protests continue. Propaganda may render ongoing protests less likely to continue
for a variety of reasons, already elucidated in Section 2. Propaganda may shape the beliefs of
frustrated citizens, or it may signal to frustrated citizens that the regime will employ violence to
retain power, and hence discourage continued protests. The results appear in Table 7. Again,
we find that each additional positive word about the autocrat renders popular protests roughly
2% less likely. This effect holds in Models 1 through 4, despite the relatively small number of
observations: between 179 and 203. Note that the effect is statistically insignificant in Model 5,
which includes just 139 observations; the magnitude of the estimated effect, however, is virtually
identical to Models 1 through 4.
We find some evidence that pro-regime propaganda does not reduce the rate of protest during the
15 days before and after election day. Across models, the (Positive Coverageit × Election Seasonit)
interaction is consistently positive, and often statistically significant. From the odds ratios at
the bottom of the panels, the effect of Positive Coverageit on the probability of protest is not
statistically distinguishable from 0. There are two explanations for this. First, it may genuinely
be the case that, during election seasons, pro-regime propaganda has no effect on the probability
of protest in our sample. The countries in our sample are among Africa’s poorest, their citizens
are keen for change, and during election seasons opposition leaders inspire their hopes for a better
future. As a result, the constraining effects of propaganda may genuinely fail to overcome popular
grievances.
Alternatively, it may also be the case that election seasons are systematically different from
other calendar days, and in ways that our model does not fully accommodate. Carter and Carter
(2016) show, for instance, that pro-regime propaganda spikes during the 15 days before election
day. Likewise, scholars increasingly recognize that election seasons constitute focal points for
popular protests, when citizens are engaged and collective action problems more easily overcome.
36For more on Markov transition models, see Epstein et al. (2005).
17

In this sense, we should expect both pro-regime propaganda and popular protests to be occur
simultaneously during election seasons. For the forces that make election seasons so ripe for popular
protest also compel autocrats to simultaneously increase pro-regime propaganda. In short, the
appropriate counterfactual would be election season days where no propaganda was employed, and
we may simply lack sufficient data to estimate propaganda’s effects.
Finally, we reestimate the baseline models above for the sample of state-affiliated newspapers
in democracies. The results appear in Section 7 of the online appendix. In all models, the effect of
Positive Coverageit on the probability of protest is indistinguishable from 0, both outside election
seasons and during, which suggests that propaganda has no effect. We regard this as akin to a
placebo test. Existing literature suggests we ought not to expect propaganda to be widely employed
in democracies, just as popular protests should be a less salient form of political expression. That
we find no effect in democracies is thus reassuring.
We conclude with a note of caution. Although we expressed these results in terms of the
marginal effect of an additional word of propaganda on day t, these results do not suggest that,
in practice, more propaganda would further reduce the probability of protest. As we note above,
autocrats employ propaganda by choice. They set the amount of propaganda by choice as well.37
Since “propaganda becomes ineffective the moment we are aware of it,” as Goebbels observed, it
may well be the case that additional propaganda would undermine the entire effort. In short, we
believe that autocrats set the amount of propaganda optimally. The results above make clear that
propaganda, as it has been employed, has indeed reduced the rate of protest in Africa’s autocracies.
By contrast, the results do not suggest that, if autocrats had employed even more propaganda,
they could have rendered protest even less likely as well.
5 Do the Effects of Propaganda Persist Over Time?
5.1 Functional Forms
To probe whether the effects of pro-regime propaganda persist over time, we follow Hill et al.
(2013), who study the effects of political advertisements in the 2000 presidential race and a series
of state races in 2006. Drawing on an extensive psychology literature that models memory decay
for simple facts and words,38 Hill et al. (2013) identify a series of decay functions that have been
found to best describe the persistence of persuasion effects. They then fit these decay functions to
their data, and ask which of them best captures “whatever pattern of decay may be present.”
Following Hill et al. (2013), we focus on three functional forms: the power, exponential, and
Weibull. The specific functional forms appear in Table 8. In each, the daily probability of protest is
a function of two main effects. The first is the effect of pro-regime propaganda on day t− 1, which
37Carter and Carter (2016).38For a review, see Rubin and Wenzel (1996).
18

Table 5: Protest and Propaganda in Autocracies, Baseline Results
Model 1 Model 2 Model 3 Model 4 Model 5Logit Logit Logit Logit Logit
Day Level VariablesPositive Coverage -0.010∗ -0.012∗ -0.017∗∗ -0.017∗ -0.019∗
(0.005) (0.005) (0.005) (0.007) (0.010)Election Season -1.859 -1.902 -1.829 -2.036
(1.435) (1.433) (1.507) (1.546)Election -13.851 -14.192 -13.828 -13.764
(5,046.571) (5,024.674) (4,973.312) (4,859.315)Good News -0.007 -0.006 -0.007
(0.005) (0.006) (0.007)Protestt−1 2.874∗∗ 3.109∗∗
(0.281) (0.351)Repressiont−1 -1.313 -0.351
(1.486) (2.020)Protest History: Week 4.155∗∗ 4.276∗∗
(0.751) (0.907)Repression History: Week -0.415 -1.074
(2.935) (4.074)Protest History: Month -0.075∗ -0.100∗
(0.036) (0.040)Repression History: Month 0.044 0.033
(0.098) (0.109)Country Level Variables
ln Real GDP Expenditure Side 24.500(19.585)
ln GDP Per Capita -50.896(54.150)
Employment Rate -50.896(54.150)
Oil Supply -11.254(38.746)
Internet -0.213(1.694)
Interaction TermsPositive Coverage × Election Season 0.032∗ 0.038∗ 0.040∗ 0.043∗
(0.015) (0.016) (0.017) (0.019)Country Fixed Effects Yes Yes Yes Yes YesN 7,128 7,128 6,054 6,046 3,375
Significance levels: † : 10% ∗ : 5% ∗∗ : 1%
Odds ratio of protest per day(with 90% confidence intervals)
Baseline 0.989 0.988 0.983 0.982 0.980(0.98, 0.99) (0.98, 0.99) (0.97, 0.99) (0.97, 0.99) (0.96, 0.99)
During Election Seasons 0.996 0.996 0.997 0.997(0.99, 1.04) (0.99, 1.04) (0.99, 1.04) (0.99, 1.05)
19

Table 6: Protest and Propaganda in Autocracies, Markov Protestt−1 = 0
Model 1 Model 2 Model 3 Model 4 Model 5Logit Logit Logit Logit Logit
Day Level Variables
Positive Coverage -0.014† -0.018∗ -0.016† -0.016† -0.022†
(0.008) (0.008) (0.008) (0.008) (0.012)Election Season -1.590 -1.556 -1.540 -1.593
(1.479) (1.472) (1.472) (1.493)Election -15.079 -14.500 -15.439 -15.177
(8,374.827) (5,055.460) (8,333.785) (8,000.540)Good News -0.009 -0.009 -0.003
(0.009) (0.009) (0.011)Protestt−1
Repressiont−1 -16.775 -16.811(3,759.150) (6,761.558)
Protest History: Week 2.294 -0.255(1.739) (3.860)
Repression History: Week -0.652 -3.113(2.839) (4.734)
Protest History: Month -0.151 -0.428†
(0.094) (0.234)Repression History: Month 0.196∗ 0.268∗
(0.090) (0.106)Country Level Variables
ln Real GDP Expenditure Side 23.229(20.155)
ln GDP Per Capita -90.917(63.183)
Employment Rate 807.121(639.030)
Oil Supply -24.643(57.584)
Internet -2.336(2.446)
Interaction TermsPositive Coverage × Election Season 0.038∗ 0.037∗ 0.037∗ 0.042∗
(0.017) (0.017) (0.017) (0.019)Country Fixed Effects Yes Yes Yes Yes YesN 6,925 6,925 5,875 5,867 3,236
Significance levels: † : 10% ∗ : 5% ∗∗ : 1%
Odds ratio of protest per day(with 90% confidence intervals)
Baseline 0.985 0.982 0.983 0.983 0.978(0.97, 0.99) (0.96, 0.99) (0.97, 0.99) (0.97, 0.99) (0.96, 0.99)
During Election Seasons 0.994 0.995 0.995 0.994(0.99, 1.04) (0.99, 1.04) (0.99, 1.04) (0.99, 1.04)
20
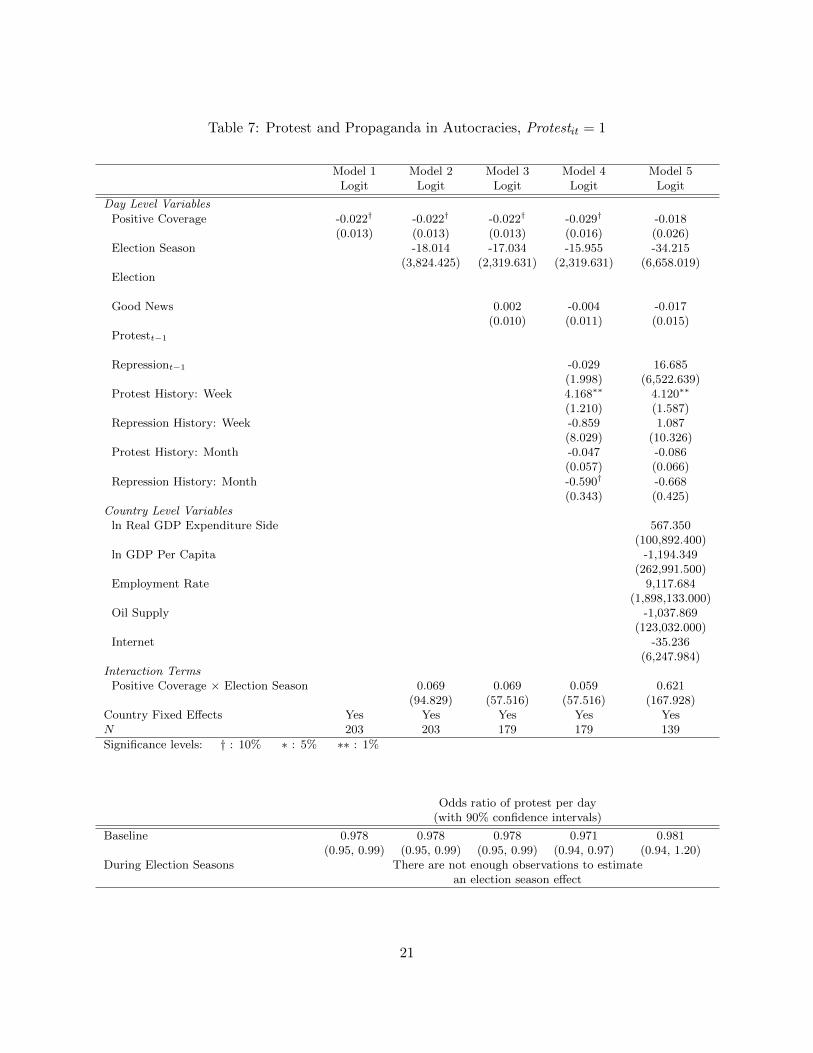
Table 7: Protest and Propaganda in Autocracies, Protestit = 1
Model 1 Model 2 Model 3 Model 4 Model 5Logit Logit Logit Logit Logit
Day Level Variables
Positive Coverage -0.022† -0.022† -0.022† -0.029† -0.018(0.013) (0.013) (0.013) (0.016) (0.026)
Election Season -18.014 -17.034 -15.955 -34.215(3,824.425) (2,319.631) (2,319.631) (6,658.019)
Election
Good News 0.002 -0.004 -0.017(0.010) (0.011) (0.015)
Protestt−1
Repressiont−1 -0.029 16.685(1.998) (6,522.639)
Protest History: Week 4.168∗∗ 4.120∗∗
(1.210) (1.587)Repression History: Week -0.859 1.087
(8.029) (10.326)Protest History: Month -0.047 -0.086
(0.057) (0.066)
Repression History: Month -0.590† -0.668(0.343) (0.425)
Country Level Variablesln Real GDP Expenditure Side 567.350
(100,892.400)ln GDP Per Capita -1,194.349
(262,991.500)Employment Rate 9,117.684
(1,898,133.000)Oil Supply -1,037.869
(123,032.000)Internet -35.236
(6,247.984)Interaction Terms
Positive Coverage × Election Season 0.069 0.069 0.059 0.621(94.829) (57.516) (57.516) (167.928)
Country Fixed Effects Yes Yes Yes Yes YesN 203 203 179 179 139
Significance levels: † : 10% ∗ : 5% ∗∗ : 1%
Odds ratio of protest per day(with 90% confidence intervals)
Baseline 0.978 0.978 0.978 0.971 0.981(0.95, 0.99) (0.95, 0.99) (0.95, 0.99) (0.94, 0.97) (0.94, 1.20)
During Election Seasons There are not enough observations to estimatean election season effect
21

Table 8: Decay Functions
Distribution Functional Form
Exponential Protestt = I ×∑Tt=0 exp (−δ × t) Positive Coveraget−1 +Xβ
Weibull Protestt = I ×∑Tt=0 exp (−δ × t) Positive Coveraget−1 +Xβ
Power Protestt = I ×∑Tt=0 exp (t+ 1)−δ Positive Coveraget−1 +Xβ
conditions the probability of protest on day t − 1 through its estimated coefficient, I, which Hill
et al. (2013) refer to as an impact parameter. The second is the effect of pro-regime propaganda
on the days that preceded t− 1, which exert the effect I weighted by the value of a decay function
on its day. The value of the decay function on a given day is determined by the shape parameter δ,
which we estimate with maximum likelihood techniques. Here, to be conservative, we let pro-regime
propaganda as temporally distant as 60 days preceding day t condition the probability of protest
on day t. The vector X gives the set of covariates from the baseline models, as well as country
fixed effects.
5.2 Results
Table 9 presents results for the two key parameters, the impact parameter I and the decay parameter
δ, for each of the three functional forms. Figure 1 presents survival rates of pro-regime propaganda
influence on the probability of protest, based on the results in Table 9. These survival plots display
the percent of propaganda impact from each lagged day (2 to 60) that survives at day t = 0, when
a protest occurs or does not. Importantly, the impact parameter estimates I are very similar to
the baseline results in Tables 5 through 7. An additional word of pro-regime propaganda on day
t− 1, these decay models suggest, reduces the probability of protest on day t by roughly 1%.
The effects of pro-regime propaganda, we find, are indeed persistent, and in much the same
way as campaign advertisements. Using the exponential function, we estimate that the half-life
of pro-regime propaganda is roughly 12 days. Using the Weibull and power functions, we find
that the half-life of pro-regime propaganda is roughly four days. Depending on the form of the
decay function, we find that, 30 days after propaganda is employed, between 10% and 20% of
its initial effect persists. These are non-trivial effects. If, by increasing pro-regime propaganda a
single standard deviation on day t, an autocrat can reduce the probability of protest on day t+ 1
by roughly 8%, then some five days later that decision will reduce the probability of protest by
roughly 4%.
22

Table 9: Parametric Decay Estimates in Autocracies
Model 1 Model 2 Model 3Exponential Weibull Power
Impact -0.005∗∗ -0.009∗∗ -0.010∗∗
(0.001) (0.003) (0.003)Decay 0.058∗∗ 0.410∗∗ 0.676∗∗
(0.015) (0.104) (0.164)N 4,217 4,217 4,217
Significance levels: †† : 20% † : 10% ∗ : 5% ∗∗ : 1%
6 Conclusion
Propaganda works, we find, and it does so with a temporal signature similar to political messaging in
democracies. A one standard deviation increase in propaganda reduces the probability of protest
the following day by 8%. The half-life of propaganda in autocracies is 4 to 12 days, similar to
the one week half-life of campaign advertisements in democracies. These effects are substantively
meaningful and precisely estimated.
This paper suggests a number of directions for future research. Most importantly, it remains
unclear why propaganda diminishes the rate of protest: that is, which of the mechanisms outlined
in Section 2 are most important. Does propaganda shape the beliefs of citizens, and so diminish
whatever grievances would otherwise compel them to the streets? Does it cause citizens to view their
neighbors as more likely to support the regime, and thereby render collective action more costly to
initiate? Does it signal to citizens that the regime is willing to meet protest with repression, and
hence discourage protest in the first place? We believe that field experiments may be best suited
to adjudicate among these competing explanations.
This paper employs quantitative text analysis to study the effect of autocratic propaganda on
popular protest. In a sense, this focus is relatively narrow. For propaganda newspapers contain
a vast amount of other information, presumably selected strategically by the autocrat or his ap-
pointees to achieve some domestic objective. The quantitative text analysis techniques that we
employ above can be easily adapted to study the timing of these signals, as well as their effects.
When, for instance, do autocrats issue threats of violence? Do these threats have measurable effects
on the probability of protest?
Finally, propaganda may have its most profound effects when it is employed consistently over
a sustained period: when it creates an alternate reality that, over time, induces its citizens to
relinquish their once held convictions. This paper has focused on the effects of deviations from
a state-run newspaper’s average level of propaganda. If propaganda is most effective when it is
consistently employed, however, these deviations may, in fact, have a weaker effect on the probability
of protest than the level of propaganda that an autocrat consistently employs. In this paper, we
23

0 5 10 15 20 25 30 35 40 45 50 55 60
010
2030
4050
6070
8090
100
Decay rates
Number of days since propaganda
Per
cent
impa
ct r
emai
ning
on
Day
t
ExponentialWeibullPower
Figure 1: Pro-regime propaganda decay rates in autocracies. Plots show percentage of initial impactthat remains at day 0 from each previous day.
used autocrat-level fixed effects, in part, for identification. Future research might consider how to
measure sustained propaganda campaigns, and then measure their effects.
Most broadly, this paper insists on the centrality of information and belief to autocratic survival.
Perhaps because the concepts are so difficult to measure, the new wave of research on autocratic
politics has largely overlooked the centrality of information and beliefs to autocratic survival. Of
course, this research has taught us much about the role of institutions: of single parties, in particu-
lar, but also how autocrats have learned to survive nominally democratic institutions and, in some
cases, use these institutions to advance their interests. Yet this focus on institutions has come at
the expense of information and beliefs, which scholars long regarded as the chief determinant of
24

acquiescence – both by the frustrated population and conspiring elites – and, therefore, to auto-
cratic survival. New computational tools make it possible to measure the politics of information
and, ultimately, to understand its effects on autocratic survival.
25

References
Adena, Maja, Ruben Enikolopov, Maria Petrova, Veronica Santarosa and Ekaterina Zhuravskaya.
2015. “Radio and the Rise of the Nazis in Prewar Germany.” Quarterly Journal of Economics
130(4):1885–1939.
Althaus, SL, BH Bramlett and J Gimpel. 2012. “When War Hits Home: The Geography of Military
Losses and Support for War in Time and Space.” Journal of Conflict Resolution 56:382–412.
Aronow, Peter M., Allison Carnegie and Nikolay Marinov. 2012. “The Effects of Aid
on Rights and Governance: Evidence from a Natural Experiment.” Available at SSRN:
http://ssrn.com/abstract=2199131.
Bates, Robert H. 1983. Essays on The Political Economy of Rural Africa. Berkeley: University of
California.
Blaydes, Lisa A. 2008. “Authoritarian Elections and Elite Management: Theory and Evidence
from Egypt.” Stanford University.
Boas, Taylor C. and F. Daniel Hidalgo. 2011. “Controlling the Airwaves: Incumbency Advantage
and Community Radio in Brazil.” American Journal of Political Science 55(4):869–885.
Bratton, Michael and Nicholas van de Walle. 1997. Democratic Experiments in Africa: Regime
Transitions in Comparative Perspective. New York: Cambridge University.
Brownlee, Jason. 2007. Durable Authoritarianism in an Age of Democratization. New York: Cam-
bridge University.
Bunce, Valerie and Sharon Wolchik. 2011. Defeating Authoritarian Leaders in Post-Communist
Countries. New York: Cambridge University.
Cain, Daylian M., George Loewenstein and Don A. Moore. 2005. “The Dirt on Coming Clean:
Perverse Effects of Disclosing Conflicts of Interest.” Journal of Legal Studies 34(1):1–25.
Carter, Brett L. 2016a. “Elections, Protests, and Focal Moments: Day-Level Evidence from Post-
Cold War Africa.” Stanford University.
Carter, Brett L. 2016b. “Repression and Foreign Aid in Autocracies: Exploiting Debt Relief Nego-
tiations in Post-Cold War Africa.” AidData Working Paper Series 29.
Carter, Erin Baggott and Brett L. Carter. 2016. “Honest Propaganda: Evidence from State-Run
Newspapers in Africa and Asia.” Stanford University.
Cook, TD and B Flay. 1978. “The Persistance of Experimentally Induced Attitude Change.”
Advances in Experimental Social Psychology 11:1–57.
26

Davison, Phillips. 1983. “The Third-Person Effect in Communication.” Public Opinion Quarterly
47(1):1–15.
DellaVigna, Stefano and Matthew Gentzkow. 2010. “Persuasion: Empirical Evidence.” Annual
Review of Economics 2:643–669.
DeMarzo, Peter M., Dimitri Vayanos and Jeffrey Zwiebel. 2003. “Persuasion Bias, Social Influence,
and Unidimensional Opinions.” Quarterly Journal of Economics 118(3):909–968.
Dunning, Thad. 2004. “Conditioning the Effects of Aid: Cold War Politics, Donor Credibility, and
Democracy in Africa.” International Organization 58(2):409–423.
Enikolopov, Ruben, Maria Petrova and Ekaterina Zhuravskaya. 2011. “Media and Political Per-
suasion: Evidence from Russia.” American Economic Review 101(7):3253–3285.
Epstein, David, Robert H. Bates, Jack Goldstone, Ida Kristensen and Sharyn O’Halloran. 2005.
“Democratic Transitions.” American Journal of Political Science 59:551–569.
Eyster, Erik and Matthew Rabin. N.d. “Rational and Naive Herding.” Centre for Economic Policy
Research Discussion Paper. Forthcoming.
Fearon, James D. 2011. “Self-Enforcing Democracy.” Quarterly Journal of Economics 126(4):1661–
1708.
Gandhi, Jennifer. 2008. Political Institutions under Dictatorship. New York: Cambridge University.
Gandhi, Jennifer and Adam Przeworski. 2007. “Authoritarian Institutions and the Survival of
Autocrats.” Comparative Political Studies 11:1279–1301.
Gandhi, Jennifer and Ellen Lust-Okar. 2009. “Elections Under Authoritarianism.” Annual Review
of Political Science 12:403–422.
Gehlbach, Scott and Konstantin Sonin. 2014. “Government Control of the Media.” Journal of
Public Economics 118:163–171.
Gentzkow, Matthew and Jesse M. Shapiro. 2006. “Media Bias and Reputation.” Journal of Political
Economy 114(2):280–316.
Gerber, AS, GJ Gimpel, DP Green and DR Shaw. 2011. “How Large and Long-Lasting are the
Persuasive Effects of Televised Campaign Ads? Results from a Randomized Field Experiment.”
American Political Science Review 105:135–150.
Goemans, Hein and Nikolay Marinov. 2014. “Coups and Democracy.” British Journal of Political
Science 44:799–825.
27

Greene, Kenneth F. 2011. “Campaign Persuasion and Nascent Partisanship in Mexico’s New
Democracy.” American Journal of Political Science 55(2).
Grimmer, Justin and Brandon Stewart. 2013. “Text as Data: The Promise and Pitfalls of Automatic
Content Analysis Methods for Political Texts.” Political Analysis 21(3):267–297.
Harvard General Inquirer. 2015. “Positiv and Negativ Semantic Dictionaries.”
http://www.wjh.harvard.edu/ inquirer/.
Hayes, AF and T Myers. 2009. “Testing the Proximate Casualties Hypothesis: Local Troop Loss,
Attention to News, and Support for Military Intervention.” Mass Communication and Society
12:379–402.
Hill, Seth J., James Lo, Lynn Vavreck and John Zaller. 2013. “How Quickly We Forget: The
Duration of Persuasion Effects from Mass Communication.” Political Communication 30:521–
547.
Huang, Haifeng. 2015. “International Knowledge and Domestic Evaluations in a Changing Society:
The Case of China.” American Political Science Review 109(3):613–634.
Hyde, Susan D. and Nikolay Marinov. 2012. “Which Elections Can Be Lost?” Political Analysis
20(2):191–201.
IREX. 2008. “Media Sustainability Index 2006/2007: Development of Sustainable Independent Me-
dia in Africa.” Washington, DC: Available at http http://pdf.usaid.gov/pdf docs/pnaea448.pdf.
IREX. 2014. “Media Sustainability Index 2012.” Washington, DC:
https://www.irex.org/sites/default/files/u115/Gambia%202012%20MSI%20Proof.pdf.
King, Gary. 1997. A Solution to the Ecological Inference Problem: Reconstructing Individual Level
Behavior from Aggregate Data. Princeton: Princeton University.
King, Gary, Jennifer Pan and Margaret E. Roberts. 2013. “How Censorship in China Allows
Government Criticism but Silences Collective Expression.” American Political Science Review
107(2):326–343.
King, Gary, Jennifer Pan and Margaret E. Roberts. 2016. “How the Chinese Government Fabricates
Social Media Posts for Strategic Distraction, not Engaged Argument.” Harvard University.
Kuran, Timur. 1989. “Sparks and Prairie Fires: A Theory of Unanticipated Political Revolution.”
Public Choice 61(1):41–74.
Kuran, Timur. 1997. Private Truths, Public Lies: The Social Consequences of Preference Falsifi-
cation. Cambridge: Harvard University Press.
28
Lawson, Chappell and James A. McCann. 2005. “Television News, Mexico’s 2000 Elections and
Media Effects in Emerging Democracies.” British Journal of Political Science 35:1–30.
Levitsky, Steven and Lucan A. Way. 2010. Competitive Authoritarianism: Hybrid Regimes After
the Cold War. Cambridge University.
Little, Andrew T. 2015. “Propaganda and Credulity.” Cornell University.
Lowe, Will, Kenneth Benoit, Slava Mikhaylov and Michael Laver. 2010. “Scaling Policy Preferences
from Coded Political Texts.” Legislative Studies Quarterly XXXVI(1):123–155.
Lust-Okar, Ellen. 2006. “Elections under Authoritarianism: Preliminary Lessons from Jordan.”
Democratization 13(3):456–471.
Magaloni, Beatriz. 2008. “Credible Power-Sharing and the Longevity of Authoritarian Rule.”
Comparative Political Studies 41(4):715–741.
McFaul, Michael. 2005. “Transitions from Postcommunism.” Journal of Democracy 16(3):5–19.
McMillan, John and Pablo Zoido. 2004. “How to Subvert Democracy: Montesinos in Peru.” Journal
of Economic Perspectives 18(4):69–92.
Mullainathan, Sendhil, Joshua Schwartzstein and Andrei Shleifer. 2008. “Coarse Thinking and
Persuasion.” Quarterly Journal of Economics 123(2):577–619.
Munger, Kevin, Richard Bonneau, John T. Jost, Jonathan Nagler and Joshua A. Tucker. 2016.
“Elites Tweet to get Feet off the Streets: Measuing Regime Social Media Strategies During
Protest.” NYU SMaPP Lab.
Radnitz, Scott. 2010. “The Color of Money: Privatization, Economic Dispersion, and the Post-
Soviet ‘Revolutions’.” Comparative Politics 42(2):127–146.
Rubin, David C. and Amy Wenzel. 1996. “One Hundred Years of Forgetting.” Psychological Review
103(4):734–760.
Salehyan, Idean, Cullen S. Hendrix, Jesse Hamner, Christina Case, Christopher Linebarger, Emily
Stull and Jennifer Williams. 2012. “Social Conflict in Africa: A New Database.” International
Interactions 38(4):503–511.
Sides, J and L Vavreck. 2013. The Gamble: Choice and Chance in the 2012 Election. Princeton:
Princeton University Press.
Slater, Dan. 2010. Ordering Power: Contentious Politics and Authoritarian Leviathans in Southeast
Asia. New York: Princeton University.
29

Svolik, Milan W. 2012. The Politics of Authoritarian Rule. Cambridge University.
Taylor, Richard. 1998. Film Propaganda: Soviet Russia and Nazi Germany. New York: I.B. Tauris.
Tucker, Joshua A. 2007. “Enough! Electoral Fraud, Collective Action Problems, and Post-
Communist Colored Revolutions.” Perspectives on Politics 5(3):535–551.
Tullock, Gordon. 1987. Autocracy. New York: Springer.
Wedeen, Lisa. 1999. Ambiguities of Domination: Politics, Rhetoric, and Symbols in Contemporary
Syria. Chicago: The University of Chicago.
White, Stephen, Sarah Oates and Ian McAllister. 2005. “Media Effects and Russian Elections.”
British Journal of Political Science 35(2):191–208.
Wright, Joseph. 2008. “Do Authoritarian Institutions Constrain? How Legislatures Affect Economic
Growth and Investment.” American Journal of Political Science 52(2):322–343.
Yanagizawa-Drott, David. 2014. “Propaganda and Conflict: Evidence from the Rwandan Geno-
cide.” Quarterly Journal of Economics 129(4):1947–1994.
30