Embed Size (px)
Citation preview

10Directed graphs
and networks10.1 Kick off with CAS
10.2 Critical path analysis
10.3 Critical path analysis with backward scanning and crashing
10.4 Network � ow
10.5 Assignment problems and bipartite graphs
10.6 Review
c10DirectedGraphsAndNetworks.indd 480 12/09/15 4:16 AM
UNCORRECTED
UNCORRECTED
UNCORRECTED Directed graphs
UNCORRECTED Directed graphs
and networks
UNCORRECTED
and networks10.1
UNCORRECTED
10.1 Kick off with CAS
UNCORRECTED
Kick off with CAS
10.2
UNCORRECTED
10.2
PAGE
PAGE 10PAGE 1010PAGE 10PAGE
PAGE PROOFS
PROOFS10PROOFS10

Please refer to the Resources tab in the Prelims section of your eBookPLUS for a comprehensive step-by-step guide on how to use your CAS technology.
10.1 Kick off with CASDirected graphs and networks
This topic does not lend itself to a CAS activity.
c10DirectedGraphsAndNetworks.indd 481 12/09/15 4:16 AM
UNCORRECTED
UNCORRECTED PAGE P
ROOFS

Critical path analysisActivity charts and networksIn any process, ranging from our daily schedule to major construction operations, tasks need to be completed within a certain period of time.
Consider Frieda’s morning schedule, where she needs to eat her cooked breakfast, download her email and read her email. The �rst two tasks take 6 minutes and 1 minute respectively, while the last takes 2 minutes. Frieda needs to complete all these tasks in 7 minutes. How might she accomplish this?
Clearly, she needs to be able to do some tasks simultaneously. Although this seems like a simple problem, let us look at what might happen each minute.
Time Activity Activity
1st minute Download email
2nd minute Eat breakfast
3rd minute Eat breakfast
4th minute Eat breakfast
5th minute Eat breakfast Read email
6th minute Eat breakfast Read email
7th minute Eat breakfast
More complex activities require more planning and analysis. A network diagram can be used to represent the ‘�ow’ of activities.
In the �gure at right, the edges of our network represent the three activities of downloading (B), reading (C) and eating (A). The left node represents the start of all activity, the right node the end of all activity and the middle node indicates that activity B must occur before activity C can begin. In other words, activity B is the immediate predecessor of activity C.
Another way of representing this information is in an activity chart.
Activity letter Activity Predecessor Time (min)
A Eat breakfast — 6
B Download email — 1
C Read email B 2
This chart also shows that activity B (downloading) is the immediate predecessor of activity C (reading), and that activities B and A have no predecessors.
An alternative network diagram is also shown.
The activities can be undertaken only in a certain sequence, so arrowheads are placed on the edges. Because of the implied direction, these networks are called directed graphs or directed networks. (The edges in a directed graph represent a one-way path between the nodes, as compared with undirected graphs where the edges represent a two-way path between the nodes.)
We can use the network diagram to help Frieda reduce the total time spent on the tasks. If the tasks were spread out in a straight line, so that no two tasks were
A, 6
B, 1 C, 2
InteractivityCritical path analysis int-6290
A, 6
B, 1 C, 2
Unit 4
AOS M2
Topic 2
Concept 1
Graphs of directed networks Concept summary Practice questions
10.2
482 MATHS QUEST 12 FURTHER MATHEMATICS VCE Units 3 and 4
c10DirectedGraphsAndNetworks.indd 482 12/09/15 4:16 AM
UNCORRECTED be used to represent the ‘�ow’ of activities.
UNCORRECTED be used to represent the ‘�ow’ of activities.
of our network represent
UNCORRECTED of our network represent the three activities of downloading (B), reading (C)
UNCORRECTED the three activities of downloading (B), reading (C)
node
UNCORRECTED node represents the start of
UNCORRECTED represents the start of
all activity, the right node the end of all activity and the middle node indicates that
UNCORRECTED all activity, the right node the end of all activity and the middle node indicates that activity B must occur before activity C can begin. In other words, activity B is the
UNCORRECTED activity B must occur before activity C can begin. In other words, activity B is the immediate predecessor
UNCORRECTED
immediate predecessor of activity C.
UNCORRECTED
of activity C.
Another way of representing this information is in an activity chart.
UNCORRECTED
Another way of representing this information is in an activity chart.
UNCORRECTED
UNCORRECTED
UNCORRECTED
UNCORRECTED
UNCORRECTED
UNCORRECTED
UNCORRECTED
UNCORRECTED
Activity letter
UNCORRECTED
Activity letter
A
UNCORRECTED
A
B
UNCORRECTED
B
This chart also shows that activity B (downloading) is the immediate predecessor of
UNCORRECTED
This chart also shows that activity B (downloading) is the immediate predecessor of
UNCORRECTED
UNCORRECTED
UNCORRECTED
UNCORRECTED PAGE
PAGE
PAGE
PAGE
PAGE 5th minute Eat breakfast Read email
PAGE 5th minute Eat breakfast Read email
6th minute Eat breakfast Read email
PAGE 6th minute Eat breakfast Read email
More complex activities require more planning and analysis. A network diagram can
PAGE More complex activities require more planning and analysis. A network diagram can be used to represent the ‘�ow’ of activities.PAGE be used to represent the ‘�ow’ of activities.
of our network represent PAGE
of our network represent
PROOFSClearly, she needs to be able to do some tasks simultaneously. Although this seems
PROOFSClearly, she needs to be able to do some tasks simultaneously. Although this seems
PROOFS
PROOFS
PROOFS
PROOFS
PROOFS
PROOFS
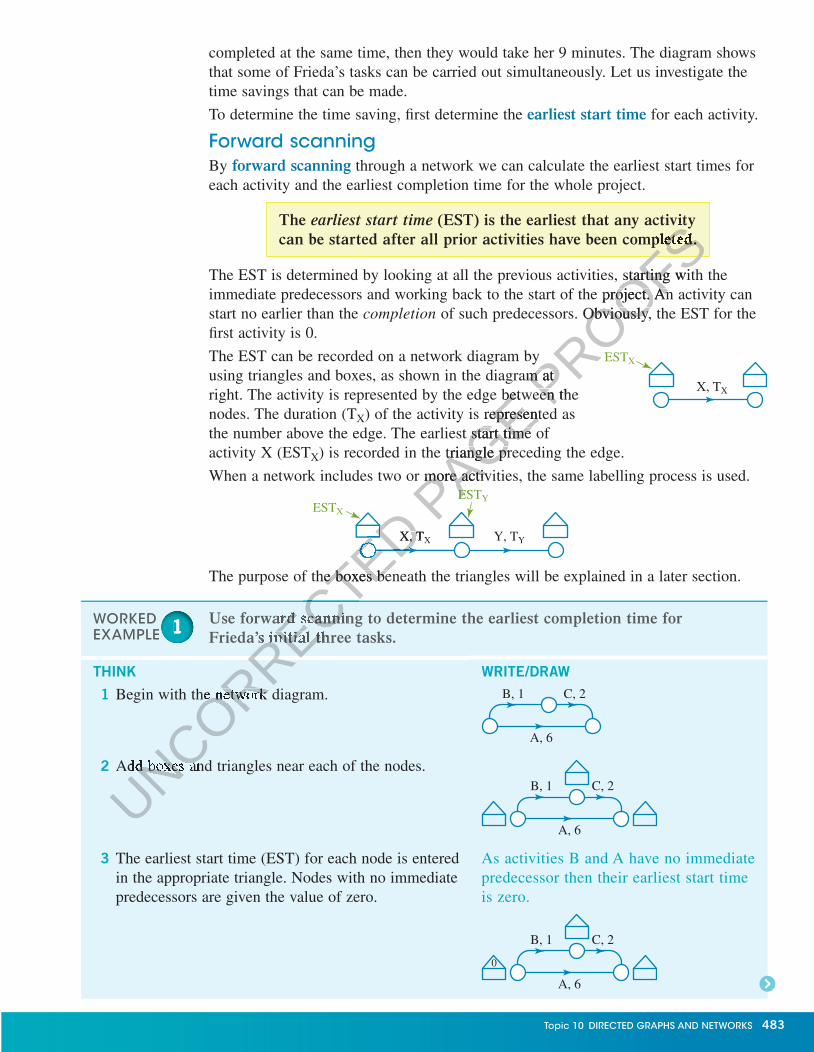
completed at the same time, then they would take her 9 minutes. The diagram shows that some of Frieda’s tasks can be carried out simultaneously. Let us investigate the time savings that can be made.
To determine the time saving, � rst determine the earliest start time for each activity.
Forward scanningBy forward scanning through a network we can calculate the earliest start times for each activity and the earliest completion time for the whole project.
The earliest start time (EST) is the earliest that any activity can be started after all prior activities have been completed.
The EST is determined by looking at all the previous activities, starting with the immediate predecessors and working back to the start of the project. An activity can start no earlier than the completion of such predecessors. Obviously, the EST for the � rst activity is 0.
The EST can be recorded on a network diagram by using triangles and boxes, as shown in the diagram at right. The activity is represented by the edge between the nodes. The duration (TX) of the activity is represented as the number above the edge. The earliest start time of activity X (ESTX) is recorded in the triangle preceding the edge.
When a network includes two or more activities, the same labelling process is used.
The purpose of the boxes beneath the triangles will be explained in a later section.
ESTX
X, TX
Y, TY
ESTYESTX
X, TX
Use forward scanning to determine the earliest completion time for Frieda’s initial three tasks.
THINK WRITE/DRAW
1 Begin with the network diagram.
A, 6
B, 1 C, 2
2 Add boxes and triangles near each of the nodes.
A, 6
B, 1 C, 2
3 The earliest start time (EST) for each node is entered in the appropriate triangle. Nodes with no immediate predecessors are given the value of zero.
As activities B and A have no immediate predecessor then their earliest start time is zero.
A, 6
B, 1
0
C, 2
WORKED EXAMPLE 111
Topic 10 DIRECTED GRAPHS AND NETWORKS 483
c10DirectedGraphsAndNetworks.indd 483 12/09/15 4:16 AM
UNCORRECTED The purpose of the boxes beneath the triangles will be explained in a later section.
UNCORRECTED The purpose of the boxes beneath the triangles will be explained in a later section.
UNCORRECTED X, T
UNCORRECTED X, T
UNCORRECTED
UNCORRECTED
UNCORRECTED
UNCORRECTED
UNCORRECTED
UNCORRECTED
Use forward scanning to determine the earliest completion time for
UNCORRECTED
Use forward scanning to determine the earliest completion time for Frieda’s initial three tasks.
UNCORRECTED
Frieda’s initial three tasks.
UNCORRECTED
UNCORRECTED
Begin with the network diagram.
UNCORRECTED
Begin with the network diagram.
Add boxes and triangles near each of the nodes.
UNCORRECTED
Add boxes and triangles near each of the nodes.
UNCORRECTED PAGE right. The activity is represented by the edge between the
PAGE right. The activity is represented by the edge between the ) of the activity is represented as
PAGE ) of the activity is represented as the number above the edge. The earliest start time of
PAGE the number above the edge. The earliest start time of
) is recorded in the triangle preceding the edge.
PAGE ) is recorded in the triangle preceding the edge.
When a network includes two or more activities, the same labelling process is used.
PAGE When a network includes two or more activities, the same labelling process is used.
ESTPAGE EST
PROOFS
PROOFS
PROOFS (EST) is the earliest that any activity
PROOFS (EST) is the earliest that any activity
can be started after all prior activities have been completed.
PROOFScan be started after all prior activities have been completed.
The EST is determined by looking at all the previous activities, starting with the
PROOFSThe EST is determined by looking at all the previous activities, starting with the immediate predecessors and working back to the start of the project. An activity can
PROOFSimmediate predecessors and working back to the start of the project. An activity can
of such predecessors. Obviously, the EST for the
PROOFS of such predecessors. Obviously, the EST for the
The EST can be recorded on a network diagram by
PROOFSThe EST can be recorded on a network diagram by using triangles and boxes, as shown in the diagram at PROOFS
using triangles and boxes, as shown in the diagram at right. The activity is represented by the edge between the PROOFS
right. The activity is represented by the edge between the
EST
PROOFSEST

4 Move to another node and enter the earliest start time (EST) in its triangle. In the case of activity C, it must wait one minute while its immediate predecessor, B, is completed. A, 6
B, 1
0
1
C, 2
5 The last node’s earliest start time is entered. When more than one edge joins at a node then the earliest start time is the largest value of the paths to this node. This is because all tasks along these paths must be completed before the job is � nished.
There are two paths converging at the � nal node. The top path takes 3 minutes to complete and the bottom, 6 minutes. The larger value is entered in the triangle.
Path B–C = 1 + 2 = 3 minutes
Path A = 6 minutes
A, 6
B, 1
0
1
6
C, 2
6 The earliest completion time is the value in the triangle next to the end node.
All tasks can be completed in 6 minutes.
It is important for anybody planning many tasks to know which tasks can be delayed and which tasks must be completed immediately. In Worked example 1, the eating must be commenced immediately if the 6-minute time is to be attained, whereas downloading the email could be delayed three minutes and there would still be enough time for it to be read while eating.
Let us now extend Frieda’s activity chart to a more complex set of activities for her morning routine.
Activity letter Activity Predecessor Time (min)
A Prepare breakfast — 4
B Cook breakfast A 2
C Eat breakfast B, E, G 6
D Have shower A 4
E Get dressed D 4
F Brush teeth C, H 2
G Download email A 1
H Read email B, E, G 2
Total time 25
The network diagram for these activities is shown below.
E, 4B, 2 C, 6
H, 2
F, 2
G, 1
D, 4
A, 4
Using all the activities listed in Frieda’s morning routine, find the earliest completion time and hence identify those tasks that may be delayed without extending the completion time.
WORKED EXAMPLE 222
484 MATHS QUEST 12 FURTHER MATHEMATICS VCE Units 3 and 4
c10DirectedGraphsAndNetworks.indd 484 12/09/15 4:16 AM
UNCORRECTED
UNCORRECTED
UNCORRECTED
UNCORRECTED
UNCORRECTED
UNCORRECTED
UNCORRECTED
UNCORRECTED
UNCORRECTED
UNCORRECTED
UNCORRECTED
UNCORRECTED
UNCORRECTED
UNCORRECTED
UNCORRECTED
UNCORRECTED
UNCORRECTED
UNCORRECTED
UNCORRECTED
UNCORRECTED
UNCORRECTED
UNCORRECTED
UNCORRECTED Activity Predecessor
UNCORRECTED Activity Predecessor
Prepare breakfast
UNCORRECTED Prepare breakfast
Cook breakfast
UNCORRECTED Cook breakfast
Eat breakfast
UNCORRECTED Eat breakfast
Have shower
UNCORRECTED
Have shower
E
UNCORRECTED
E
F
UNCORRECTED
F
G
UNCORRECTED
G
The network diagram for these activities is shown below.UNCORRECTED
The network diagram for these activities is shown below.
PAGE and which tasks must be completed immediately. In Worked example 1, the eating
PAGE and which tasks must be completed immediately. In Worked example 1, the eating must be commenced immediately if the 6-minute time is to be attained, whereas
PAGE must be commenced immediately if the 6-minute time is to be attained, whereas downloading the email could be delayed three minutes and there would still be
PAGE downloading the email could be delayed three minutes and there would still be enough time for it to be read while eating.
PAGE enough time for it to be read while eating.
Let us now extend Frieda’s activity chart to a more complex set of activities for her
PAGE Let us now extend Frieda’s activity chart to a more complex set of activities for her
PROOFS
PROOFS
PROOFS
PROOFSAll tasks can be completed in 6 minutes.
PROOFSAll tasks can be completed in 6 minutes.
It is important for anybody planning many tasks to know which tasks can be delayed PROOFS
It is important for anybody planning many tasks to know which tasks can be delayed and which tasks must be completed immediately. In Worked example 1, the eating PROOFS
and which tasks must be completed immediately. In Worked example 1, the eating

THINK WRITE/DRAW
1 Add the boxes and triangles to the directed network diagram.
E, 4
B, 2 C, 6
H, 2
F, 2
G, 1
D, 4
A, 4
2 Begin forward scanning. The earliest start time (EST) for the �rst three nodes in the path can be entered immediately.
E, 4
8
40
B, 2 C, 6
H, 2
F, 2
G, 1
D, 4
A, 4
3 Calculate the time values for the paths to the fourth node. Enter the largest value (or longest time) into the appropriate triangle.
A–D–E = 4 + 4 + 4= 12 minutes
A–B = 4 + 2= 6 minutes
A–G = 4 + 1= 5 minutes
E, 4
8
1240
B, 2 C, 6
H, 2
F, 2
G, 1
D, 4
A, 4
4 Repeat step 3 for the next node. Note that calculations begin by using the time from the previous node (12 minutes).
A–E–C = 12 + 6= 18 minutes
A–E–H = 12 + 2= 14 minutes
E, 4
8
12 1840
B, 2 C, 6
H, 2
F, 2
G, 1
D, 4
A, 4
5 There is only one path to the last activity (F). Add its time requirement to that of the previous node (18 minutes).
A–C–F = 18 + 2= 20 minutes
Earliest completion time is 20 minutes.
E, 4
8
12 18 2040
B, 2 C, 6
H, 2
F, 2
G, 1
D, 4
A, 4
Topic 10 DIRECTED GRAPHS AND NETWORKS 485
c10DirectedGraphsAndNetworks.indd 485 12/09/15 4:16 AM
UNCORRECTED
UNCORRECTED
UNCORRECTED
UNCORRECTED
UNCORRECTED
UNCORRECTED
UNCORRECTED
UNCORRECTED A, 4
UNCORRECTED A, 4
Repeat step 3 for the next node.
UNCORRECTED Repeat step 3 for the next node. Note that calculations begin by
UNCORRECTED Note that calculations begin by using the time from the previous
UNCORRECTED
using the time from the previous
A–E–C
UNCORRECTED A–E–C
UNCORRECTED
5 UNCORRECTED
5 There is only one path to the last UNCORRECTED
There is only one path to the last activity (F). Add its time requirement UNCORRECTED
activity (F). Add its time requirement
PAGE minutes
PAGE minutes
PAGE
PAGE 4PAGE 4 D, 4PAGE
D, 4
PROOFS
PROOFS
PROOFS
PROOFS
PROOFS
PROOFS
PROOFS
PROOFS
PROOFS
PROOFS
PROOFSH, 2
PROOFSH, 2
F, 2
PROOFSF, 2

Critical paths
The path through the network which follows those activities that cannot be delayed without causing the entire project to be delayed is called the critical path.
Therefore the critical path for the activities listed in Frieda’s morning routine would be A–D–E–C–F. It is easily seen that this path takes the longest time (20 minutes).
Float time and latest start timeFloat time is the difference in time between those paths that cannot be delayed and those that can. When planning projects, paths with � oat time are often delayed if there is a cost saving, otherwise, they are done as soon as possible if this is more appropriate. The latest start time for such activities is de� ned as the latest time they may begin without delaying the project.
6 The time in the last triangle indicates the earliest completion time.
Earliest completion time = 20 minutes
7 Identify sections of the network where there was a choice of paths. There are two such sections of the network. Examine the � rst one (the 4th node).
E, 4
8
124
B, 2
G, 1
D, 4
8 List and total the time for each path through this section of the network. Activities on the path with the largest value cannot be delayed.
D–E = 4 + 4 = 8 minutes B = 2 minutes G = 1 minute
Activities B and G can be delayed.
9 Repeat step 8 for the next section identi� ed in step 7.
C = 6 minutesH = 2 minutes
Activity H can be delayed. C, 6
H, 2
12 18
Work out the float time for activities B and G in Worked example 2, and hence identify the latest starting time for these activities.
G, 1
B, 2
D, 4 E, 4 12
8
4
WORKED EXAMPLE 333
Unit 4
AOS M2
Topic 2
Concept 7
Critical path network constructionConcept summary Practice questions
486 MATHS QUEST 12 FURTHER MATHEMATICS VCE Units 3 and 4
c10DirectedGraphsAndNetworks.indd 486 12/09/15 4:16 AM
UNCORRECTED
UNCORRECTED
UNCORRECTED be delayed without causing the entire
UNCORRECTED be delayed without causing the entire project to be delayed is called the
UNCORRECTED project to be delayed is called the
Therefore the critical path for the activities
UNCORRECTED Therefore the critical path for the activities listed in Frieda’s morning routine would be
UNCORRECTED listed in Frieda’s morning routine would be A–D–E–C–F. It is easily seen that this path
UNCORRECTED A–D–E–C–F. It is easily seen that this path takes the longest time (20 minutes).
UNCORRECTED
takes the longest time (20 minutes).
Float time and latest start time
UNCORRECTED
Float time and latest start timeFloat time
UNCORRECTED
Float time is the difference in time between
UNCORRECTED
is the difference in time between those paths that cannot be delayed and those
UNCORRECTED
those paths that cannot be delayed and those that can. When planning projects, paths with
UNCORRECTED
that can. When planning projects, paths with � oat time are often delayed if there is a cost
UNCORRECTED
� oat time are often delayed if there is a cost saving, otherwise, they are done as soon as
UNCORRECTED
saving, otherwise, they are done as soon as possible if this is more appropriate. The
UNCORRECTED
possible if this is more appropriate. The
PAGE
PAGE
PAGE
PAGE The path through the network which
PAGE The path through the network which follows those activities that cannot
PAGE follows those activities that cannot be delayed without causing the entire PAGE be delayed without causing the entire PAGE
PAGE
PAGE PROOFS
PROOFS
PROOFS
PROOFS
PROOFS
PROOFS
PROOFS
PROOFS
PROOFS
PROOFS
PROOFS12 18
PROOFS12 1812 18
PROOFS12 18
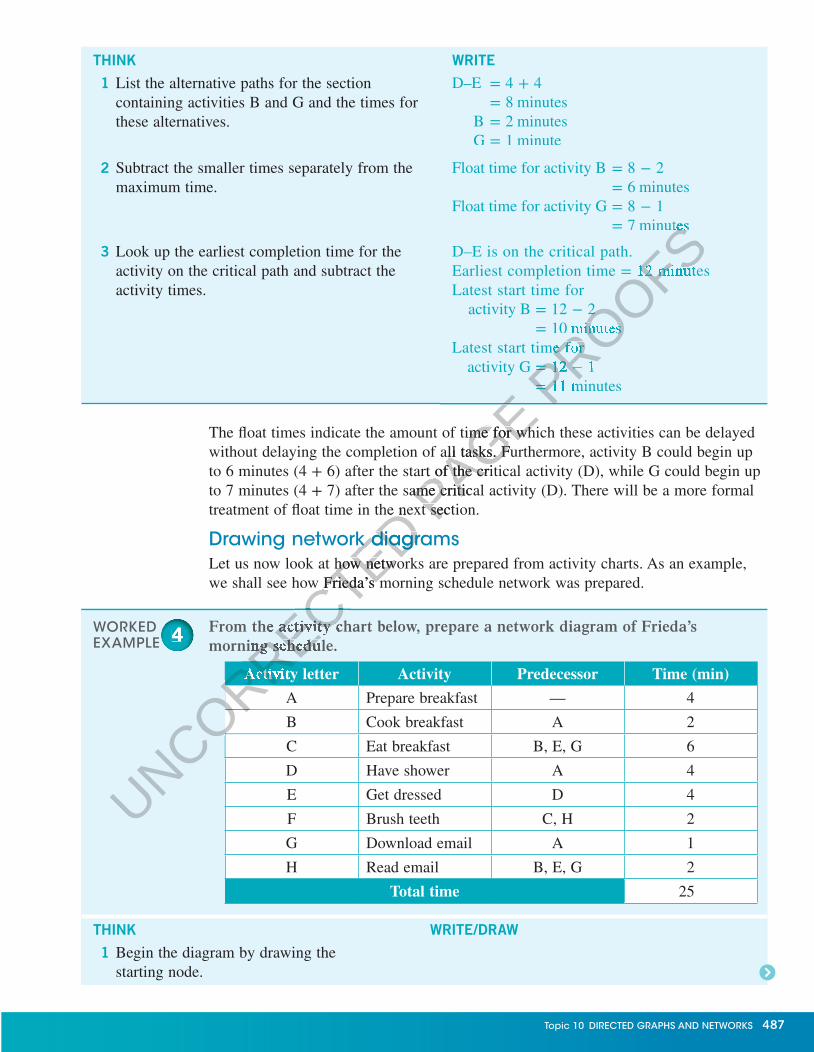
The � oat times indicate the amount of time for which these activities can be delayed without delaying the completion of all tasks. Furthermore, activity B could begin up to 6 minutes (4 + 6) after the start of the critical activity (D), while G could begin up to 7 minutes (4 + 7) after the same critical activity (D). There will be a more formal treatment of � oat time in the next section.
Drawing network diagramsLet us now look at how networks are prepared from activity charts. As an example, we shall see how Frieda’s morning schedule network was prepared.
From the activity chart below, prepare a network diagram of Frieda’s morning schedule.
Activity letter Activity Predecessor Time (min)
A Prepare breakfast — 4
B Cook breakfast A 2
C Eat breakfast B, E, G 6
D Have shower A 4
E Get dressed D 4
F Brush teeth C, H 2
G Download email A 1
H Read email B, E, G 2
Total time 25
THINK WRITE/DRAW
1 Begin the diagram by drawing the starting node.
WORKED EXAMPLE 444
THINK WRITE
1 List the alternative paths for the section containing activities B and G and the times for these alternatives.
D–E = 4 + 4= 8 minutes
B = 2 minutes G = 1 minute
2 Subtract the smaller times separately from the maximum time.
Float time for activity B = 8 − 2= 6 minutes
Float time for activity G = 8 − 1= 7 minutes
3 Look up the earliest completion time for the activity on the critical path and subtract the activity times.
D–E is on the critical path.Earliest completion time = 12 minutesLatest start time for
activity B = 12 − 2
= 10 minutesLatest start time for
activity G = 12 − 1
= 11 minutes
Topic 10 DIRECTED GRAPHS AND NETWORKS 487
c10DirectedGraphsAndNetworks.indd 487 12/09/15 4:16 AM
UNCORRECTED treatment of � oat time in the next section.
UNCORRECTED treatment of � oat time in the next section.
Drawing network diagrams
UNCORRECTED Drawing network diagramsLet us now look at how networks are prepared from activity charts. As an example,
UNCORRECTED Let us now look at how networks are prepared from activity charts. As an example, we shall see how Frieda’s morning schedule network was prepared.
UNCORRECTED we shall see how Frieda’s morning schedule network was prepared.
UNCORRECTED
From the activity chart below, prepare a network diagram of Frieda’s
UNCORRECTED
From the activity chart below, prepare a network diagram of Frieda’s morning schedule.
UNCORRECTED
morning schedule.
UNCORRECTED
UNCORRECTED
UNCORRECTED
UNCORRECTED
UNCORRECTED
UNCORRECTED
UNCORRECTED
UNCORRECTED
UNCORRECTED
UNCORRECTED
Activity letter
UNCORRECTED
Activity letter
UNCORRECTED PAGE
The � oat times indicate the amount of time for which these activities can be delayed
PAGE The � oat times indicate the amount of time for which these activities can be delayed without delaying the completion of all tasks. Furthermore, activity B could begin up
PAGE without delaying the completion of all tasks. Furthermore, activity B could begin up
6) after the start of the critical activity (D), while G could begin up
PAGE 6) after the start of the critical activity (D), while G could begin up 7) after the same critical activity (D). There will be a more formal PAGE 7) after the same critical activity (D). There will be a more formal
treatment of � oat time in the next section.PAGE
treatment of � oat time in the next section.PAGE
PAGE PROOFS
PROOFS
PROOFS
PROOFSminutes
PROOFSminutes
=
PROOFS= 12 minutes
PROOFS 12 minutes
2
PROOFS2
10 minutes
PROOFS10 minutes
Latest start time for
PROOFSLatest start time for
activity G
PROOFS
activity G =
PROOFS
= 12
PROOFS
12 −
PROOFS
− 1
PROOFS
1=PROOFS
= 11 minutesPROOFS
11 minutes

2 (a) Examine the table looking for activities that have no predecessors. There must be at least one of these. Why?
(b) This activity becomes the �rst edge and is labelled with its activity letter and arrowhead.
Activity A has no predecessors.
A
3 (a) List all activities for which A is the immediate predecessor.
(b) Add a node to the end of the edge for activity A.
(c) Create one edge from this node for each of the listed activities.
Label these edges.
Note: The end node for each of these activities is not drawn until either you are certain that it is not the immediate predecessor of any later activities, or all activities have been completed.
Activity B has A as an immediate predecessor.Activity D has A as an immediate predecessor.Activity G has A as an immediate predecessor.
A
D
B
G
4 Repeat step 3 for activity D. Since it is the only immediate predecessor of activity E, this can be added to the diagram. Otherwise, activity E could not be added yet.
A
D
B
G
E
5 (a) Repeat step 3 for activities B and G. They have no activities for which they are the only predecessors. Since activity C is preceded by all of B, G and E, join all the edges at a single node.
(b) Add activity C after this joining node. Note that activity H is also preceded by all of B, G and E but not by activity C.
A
D
B
G
E
C
6 Determine whether activity C and H are independent of each other. Since they are independent, activity H starts from the same node as activity C.
A
D
B
G
E
C
H
7 The last activity is F, which has C and H as its immediate predecessors. Therefore join C and H with a node, then add an edge for F. Since F is the �nal activity, also add the end node.
A
D
B
G
E
C
H
F
8 Add the time required for each activity next to its letter. A, 4
D, 4
B, 2
G, 1
E, 4
C, 6
H, 2
F, 2
488 MATHS QUEST 12 FURTHER MATHEMATICS VCE Units 3 and 4
c10DirectedGraphsAndNetworks.indd 488 12/09/15 4:16 AM
UNCORRECTED vities B and G. They
UNCORRECTED vities B and G. They have no activities for which they are the
UNCORRECTED have no activities for which they are the only predecessors. Since activity C is
UNCORRECTED only predecessors. Since activity C is preceded by all of B, G and E, join all the
UNCORRECTED preceded by all of B, G and E, join all the
activity C after this joining node.
UNCORRECTED
activity C after this joining node. Note that activity H is also preceded by
UNCORRECTED
Note that activity H is also preceded by all of B, G and E but
UNCORRECTED
all of B, G and E but not
UNCORRECTED
not by activity C.
UNCORRECTED
by activity C.not by activity C.not
UNCORRECTED
not by activity C.not
UNCORRECTED
UNCORRECTED
Determine whether activity C and H are
UNCORRECTED
Determine whether activity C and H are independent of each other. Since they are
UNCORRECTED
independent of each other. Since they are independent, activity H starts from the same
UNCORRECTED
independent, activity H starts from the same node as activity C.
UNCORRECTED
node as activity C.
UNCORRECTED
The last activity is F, which has C and H
UNCORRECTED
The last activity is F, which has C and H as its immediate predecessors. Therefore UNCORRECTED
as its immediate predecessors. Therefore join C and H with a node, then add an edge UNCORRECTED
join C and H with a node, then add an edge
PAGE
PAGE
PAGE A
PAGE A
D
PAGE D
B
PAGE B
PAGE
PAGE
PAGE
PAGE
PAGE
PAGE
PAGE PROOFS
Activity G has A as an immediate predecessor.
PROOFSActivity G has A as an immediate predecessor.

Critical path analysis1 WE1 Complete a forward scan for the critical path network shown. Determine the
earliest completion time.
C, 4
A, 9 J, 4 L, 6
B, 6
D, 10E, 5 K, 8
G, 4
H, 10
N, 4
M, 5
F, 6
9 15
11
50
2 The project plan for a new computer software program is shown in the �gure below. Time is measured in days. Determine the earliest completion time.
A, 6B, 13
C, 11 H, 19
E, 17
D, 22F, 23
G, 20 N, 26
P, 29 R, 30
Q, 32L, 27
J, 21M, 24
K, 25
3 WE2 From question 1, what is the maximum time that path J can be delayed without increasing the earliest completion time?
4 From question 2, what is the maximum time that path K can be delayed without increasing the earliest completion time?
5 WE3 For the network in question 1, complete a backward scan and determine:
a the critical path b the �oat time for non-critical activities.
6 For the network in question 2, determine the �oat time for non-critical activities.
7 WE4 Prepare a network diagram from the activity chart.
8 Prepare a network diagram from the activity chart.
EXERCISE 10.2
PRACTISE
Activity Immediate predecessor
DEFG
—DD
E, F
Activity Immediate predecessor
NOPQRS
—N
O, TP—N
Activity Immediate predecessor
TUVWXYZ
S, YO, TO, T
VYRX
Topic 10 DIRECTED GRAPHS AND NETWORKS 489
c10DirectedGraphsAndNetworks.indd 489 12/09/15 4:16 AM
UNCORRECTED From question
UNCORRECTED From question 1
UNCORRECTED 1, what is the maximum time that path J can be delayed
UNCORRECTED , what is the maximum time that path J can be delayed
without increasing the earliest completion time?
UNCORRECTED without increasing the earliest completion time?
From question
UNCORRECTED From question 2
UNCORRECTED 2, what is the maximum time that path K can be delayed without
UNCORRECTED , what is the maximum time that path K can be delayed without
increasing the earliest completion time?
UNCORRECTED increasing the earliest completion time?
For the network in question
UNCORRECTED
For the network in question
the critical path
UNCORRECTED
the critical path
6
UNCORRECTED
6 For the network in question
UNCORRECTED
For the network in question
7
UNCORRECTED
7
UNCORRECTED
WE4
UNCORRECTED
WE4
activity chart.
UNCORRECTED
activity chart.
PAGE
PAGE
PAGE
PAGE C, 11 H, 19
PAGE C, 11 H, 19
E, 17PAGE E, 17
F, 23
PAGE F, 23
G, 20 N, 26
PAGE G, 20 N, 26
PAGE
PAGE
PAGE
PAGE
PAGE
PAGE
PAGE
PAGE
PAGE PROOFS
The project plan for a new computer software program is shown in the �gure
PROOFSThe project plan for a new computer software program is shown in the �gure below. Time is measured in days. Determine the earliest completion time.
PROOFSbelow. Time is measured in days. Determine the earliest completion time.
PROOFS
PROOFS
PROOFS

9 Consider the network diagram shown. Times shown are in minutes.
a Which of the following statements is true?A Activity A is an immediate predecessor of F.B Activity D is an immediate predecessor of F.C Activity F must be done before activity D.D Activity F must be done before activity E.E Activity D is an immediate predecessor of E.
b The minimum time taken to complete all activities is:A 19 minutes B 21 minutes C 23 minutesD 28 minutes E 49 minutes
10 Refer to the diagram shown.
a Use forward scanning to determine the earliest completion time.
b Identify tasks that may be delayed without increasing the earliest completion time.
11 Determine the critical path for the network in question 9.
12 Refer to the network diagram shown.
a The number required in the triangle above the node after activities B and F is:A 0 B 4 C 5D 8 E 13
b The number required in the triangle above the node after activity E is:A 5 B 9 C 10D 18 E none of these
c The earliest completion time for all tasks is:A 27 B 24 C 21 D 18 E 15
13 a Find the earliest start time for each node in the network shown.
b Hence, �nd the earliest completion time for the project.
14 From the network diagram in question 9, produce an activity chart.
15 From the network diagram in question 12, produce an activity chart.
16 From the network in question 13, produce an activity chart.
17 For the network in question 12:
a �nd the critical pathb determine which activities have �oat time and hence calculate their �oat timesc determine the latest start time for all non-critical activities.
CONSOLIDATE A, 7 C, 12
B, 9D, 8 F, 9
E, 4
B, 4
C, 5
A, 3D, 6
G, 18
H, 8
J, 6
E, 5
F, 8
0
3 9
5
B, 2 C, 5
A, 3
D, 9 G, 8
H, 11
E, 6 F, 4
B, 15C, 12A, 10
D, 8 G, 6H, 10 M, 7
L, 8 K, 9
J, 11
E, 10
F, 25
490 MATHS QUEST 12 FURTHER MATHEMATICS VCE Units 3 and 4
c10DirectedGraphsAndNetworks.indd 490 12/09/15 4:16 AM
UNCORRECTED The number required in the triangle
UNCORRECTED The number required in the triangle above the node after activity E is:
UNCORRECTED above the node after activity E is:
B
UNCORRECTED B 9
UNCORRECTED 9
E
UNCORRECTED E none of these
UNCORRECTED none of these
The earliest completion time for all tasks is:
UNCORRECTED
The earliest completion time for all tasks is:
Find the earliest start
UNCORRECTED
Find the earliest start time for each node in the
UNCORRECTED
time for each node in the network shown.
UNCORRECTED
network shown.
b
UNCORRECTED
b Hence, �nd the earliest
UNCORRECTED
Hence, �nd the earliest
PAGE Determine the critical path for the network in question
PAGE Determine the critical path for the network in question
5 PAGE
5 PAGE
PAGE
PAGE 0
PAGE 0
PROOFS23 minutes
PROOFS23 minutes
Determine the critical path for the network in question PROOFS
Determine the critical path for the network in question 9PROOFS
9PROOFS
PROOFSC, 5
PROOFSC, 5
D, 9
PROOFSD, 9
PROOFSE, 6
PROOFSE, 6
PROOFS
PROOFS
PROOFS
PROOFS
PROOFS
PROOFS
PROOFS
PROOFS

18 For the network in question 13:
a �nd the critical pathb determine which activities have �oat time.
19 Prepare a network diagram from each of the activity charts.
a
b
20 When a personal computer is being assembled the following processes must be performed.
Activity letter Activity Predecessor Time (min)
A Install memory board — 2
B Install hard drive A 20
C Test hard drive B, E 4
D Install I/O ports A 5
E Install DVD drive D 3
F Test DVD drive E 5
G Install operating system C, F 10
H Test assembled computer G 12
Total time 61
a Construct a network diagram.b Determine the minimum time in which
all tasks could be completed.
MASTERActivity Immediate predecessor
ABC
——A
Activity Immediate predecessor
A —
B A
C A
D C
E B
F B
G F
H D, E, G
I J, H
J D, E, G
Topic 10 DIRECTED GRAPHS AND NETWORKS 491
c10DirectedGraphsAndNetworks.indd 491 12/09/15 4:16 AM
UNCORRECTED When a personal computer is being assembled the following processes must
UNCORRECTED When a personal computer is being assembled the following processes must
UNCORRECTED
UNCORRECTED
UNCORRECTED
UNCORRECTED
UNCORRECTED
UNCORRECTED
UNCORRECTED
UNCORRECTED
UNCORRECTED
UNCORRECTED
UNCORRECTED
UNCORRECTED
UNCORRECTED
UNCORRECTED
UNCORRECTED Activity letter
UNCORRECTED Activity letter
Install memory board
UNCORRECTED Install memory board
B
UNCORRECTED B
C
UNCORRECTED
C
D
UNCORRECTED
D
PAGE
When a personal computer is being assembled the following processes must PAGE
When a personal computer is being assembled the following processes must
D, E, G
PAGE D, E, G
PROOFS

Critical path analysis with backward scanning and crashingWith more complex projects requiring the coordination of many activities, it is necessary to record more information on the network diagrams and to display the information more formally using charts.
In the previous section the �oat times and the critical path were worked out using somewhat informal methods. In this section a more formal method will be shown to enable �oat times to be calculated and the critical path to be determined. This method involves backward scanning.
Requirements for critical path analysisAlong with the informal rules and techniques already developed in the previous section, we need to de�ne two more rules that must be followed in order to successfully complete a critical path analysis of a network.
Rule 1. Two nodes can be connected directly by a maximum of one edge.
Consider the following activity table, and associated network diagram.
Activity letterImmediate predecessor Time (min)
A — 5
B — 4
C A, B 6
For activity C to have both A and B as predecessors, activities A and B must be drawn as parallel edges. Clearly this does not meet the requirement of Rule 1, which allows for only one edge (activity) connecting two nodes.
Violation of this rule does not affect forward scanning and the calculation of minimum completion time but will cause problems when identifying the critical path using the method of backward scanning described later in this section. A method for dealing with parallel edges will be suggested below.
Rule 2. An activity must be represented by exactly one edge. Consider the two network diagrams shown here.
A
A
BA
A
The left-hand drawing indicates two separate �ows along the same edge. If A were a water pipe, how could you keep the two �ows separate? The right-hand example suggests that A can happen at the same time as B while still being its immediate predecessor.
Backward scanningTo complete critical path analysis, a procedure called backward scanning must be performed.
10.3
C, 6A, 5
B, 4
Unit 4
AOS M2
Topic 2
Concept 8
Critical path locationConcept summary Practice questions
492 MATHS QUEST 12 FURTHER MATHEMATICS VCE Units 3 and 4
c10DirectedGraphsAndNetworks.indd 492 12/09/15 4:16 AM
UNCORRECTED
UNCORRECTED
UNCORRECTED
UNCORRECTED
UNCORRECTED For activity C to have both A and B as predecessors, activities A and B must be drawn
UNCORRECTED For activity C to have both A and B as predecessors, activities A and B must be drawn as parallel edges. Clearly this does not meet the requirement of Rule 1, which allows
UNCORRECTED as parallel edges. Clearly this does not meet the requirement of Rule 1, which allows for only one edge (activity) connecting two nodes.
UNCORRECTED for only one edge (activity) connecting two nodes.
Violation of this rule does not affect forward scanning and the calculation of
UNCORRECTED Violation of this rule does not affect forward scanning and the calculation of minimum completion time but will cause problems when identifying the critical path
UNCORRECTED
minimum completion time but will cause problems when identifying the critical path
UNCORRECTED
using the method of backward scanning described later in this section. A method for
UNCORRECTED
using the method of backward scanning described later in this section. A method for dealing with parallel edges will be suggested below.
UNCORRECTED
dealing with parallel edges will be suggested below.
UNCORRECTED
UNCORRECTED
UNCORRECTED
UNCORRECTED
UNCORRECTED
UNCORRECTED
Rule 2. An activity must be represented by exactly one edge. Consider the
UNCORRECTED
Rule 2. An activity must be represented by exactly one edge. Consider the two network diagrams shown here.
UNCORRECTED
two network diagrams shown here.
PAGE Consider the following activity table, and associated network diagram.
PAGE Consider the following activity table, and associated network diagram.
PAGE
PAGE
PAGE
PAGE
PAGE Time (min)
PAGE Time (min)
PAGE 5
PAGE 5
4PAGE 4
6PAGE
6
PROOFSAlong with the informal rules and techniques already developed in the previous
PROOFSAlong with the informal rules and techniques already developed in the previous section, we need to de�ne two more rules that must be followed in order to
PROOFSsection, we need to de�ne two more rules that must be followed in order to
PROOFS
PROOFS
PROOFS
Rule 1. Two nodes can be connected directly by a maximum of one edge.
PROOFS
Rule 1. Two nodes can be connected directly by a maximum of one edge.
Consider the following activity table, and associated network diagram.PROOFS
Consider the following activity table, and associated network diagram.
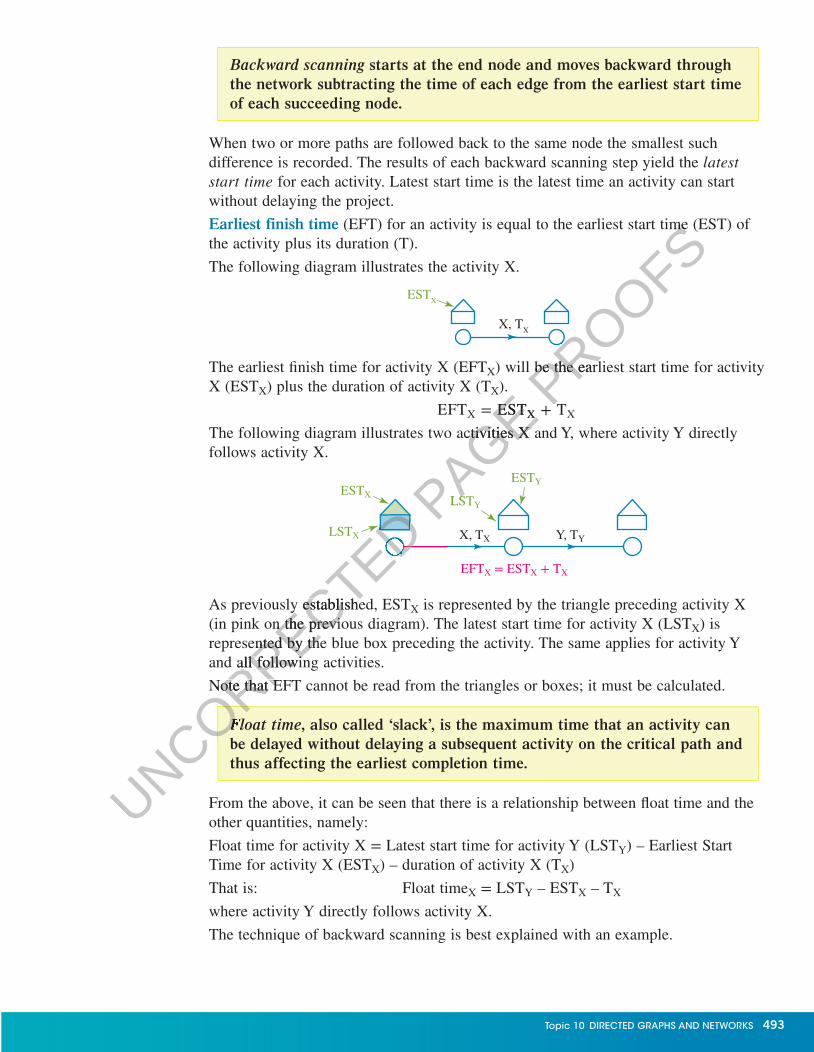
The earliest �nish time for activity X (EFTX) will be the earliest start time for activity X (ESTX) plus the duration of activity X (TX).
EFTX = ESTX + TX
The following diagram illustrates two activities X and Y, where activity Y directly follows activity X.
Y, TY
ESTYESTX
EFTX = ESTX + TX
X, TXLSTX
LSTY
As previously established, ESTX is represented by the triangle preceding activity X (in pink on the previous diagram). The latest start time for activity X (LSTX) is represented by the blue box preceding the activity. The same applies for activity Y and all following activities.
Note that EFT cannot be read from the triangles or boxes; it must be calculated.
Float time, also called ‘slack’, is the maximum time that an activity can be delayed without delaying a subsequent activity on the critical path and thus affecting the earliest completion time.
From the above, it can be seen that there is a relationship between �oat time and the other quantities, namely:
Float time for activity X = Latest start time for activity Y (LSTY) – Earliest Start Time for activity X (ESTX) – duration of activity X (TX)
That is: Float timeX = LSTY – ESTX – TX
where activity Y directly follows activity X.
The technique of backward scanning is best explained with an example.
Backward scanning starts at the end node and moves backward through the network subtracting the time of each edge from the earliest start time of each succeeding node.
When two or more paths are followed back to the same node the smallest such difference is recorded. The results of each backward scanning step yield the latest start time for each activity. Latest start time is the latest time an activity can start without delaying the project.
Earliest finish time (EFT) for an activity is equal to the earliest start time (EST) of the activity plus its duration (T).
The following diagram illustrates the activity X.
ESTX
X, TX
Topic 10 DIRECTED GRAPHS AND NETWORKS 493
c10DirectedGraphsAndNetworks.indd 493 12/09/15 4:16 AM
UNCORRECTED
UNCORRECTED
UNCORRECTED
UNCORRECTED
UNCORRECTED
UNCORRECTED
UNCORRECTED
UNCORRECTED
UNCORRECTED
UNCORRECTED As previously established, EST
UNCORRECTED As previously established, EST(in pink on the previous diagram). The latest start time for activity X (LST
UNCORRECTED
(in pink on the previous diagram). The latest start time for activity X (LSTrepresented by the blue box preceding the activity. The same applies for activity Y
UNCORRECTED
represented by the blue box preceding the activity. The same applies for activity Y and all following activities.
UNCORRECTED
and all following activities.
Note that EFT cannot be read from the triangles or boxes; it must be calculated.
UNCORRECTED
Note that EFT cannot be read from the triangles or boxes; it must be calculated.
UNCORRECTED
UNCORRECTED
UNCORRECTED
Float time
UNCORRECTED
Float time
PAGE EST
PAGE ESTX
PAGE X
The following diagram illustrates two activities X and Y, where activity Y directly
PAGE The following diagram illustrates two activities X and Y, where activity Y directly
LSTPAGE LST
PROOFS
) will be the earliest start time for activity
PROOFS
) will be the earliest start time for activity
TPROOFS
T
(EFT) for an activity is equal to the earliest start time (EST) of
PROOFS (EFT) for an activity is equal to the earliest start time (EST) of
PROOFS

The network diagram shown has been constructed for a project manager. Use forward and backward scanning to clearly display the critical path and to list any float times.
THINK WRITE/DRAW
1 Forward scan through the network and record the earliest start time (EST) for each activity in the appropriate triangle.
B, 5
A, 3 C, 6
D, 2
5
0 9
3
2 Begin backward scanning.
(a) Start at the end node and trace backwards along all paths from this node.
(b) Subtract the times of the activities along each path from the earliest � nish time (EST = 9) and record the value in the box at the previous node. These values are the latest start times (LST) for the activities leaving this node.
Along path C: 9 – 6 = 3Along path D: 9 – 2 = 7
Latest start time for activity C (LSTC) = 3Latest start time for activity D (LSTD) = 7
3 Repeat the process backwards through the diagram. Where two (or more) paths come together (activities A and B), record the smaller value in the box.
Along path A: 3 – 3 = 0Along path B: 7 – 5 = 2Smallest value = 0.
4 The critical path can now be clearly identi� ed. It is the path that has the same numbers in both the triangles and boxes at any node.
Remember to include all such nodes in the critical path.
Critical path is A–C (as shown in blue).
B, 5
A, 3 C, 6
D, 2
B, 5
A, 3 C, 6
D, 2
57
0 99
33
2B, 5
A, 3 C, 6
D, 2
57
00
99
33
2B, 5
A, 3 C, 6
D, 2
57
00
99
33
WORKED EXAMPLE 555
494 MATHS QUEST 12 FURTHER MATHEMATICS VCE Units 3 and 4
c10DirectedGraphsAndNetworks.indd 494 12/09/15 4:16 AM
UNCORRECTED the value in the box at the previous
UNCORRECTED the value in the box at the previous node. These values are the latest
UNCORRECTED node. These values are the latest start times (LST) for the activities
UNCORRECTED start times (LST) for the activities
Latest start time for
UNCORRECTED Latest start time for activity C (LST
UNCORRECTED activity C (LSTLatest start time for
UNCORRECTED Latest start time for
UNCORRECTED activity D (LST
UNCORRECTED activity D (LST
Repeat the process backwards through
UNCORRECTED
Repeat the process backwards through the diagram. Where two (or more)
UNCORRECTED
the diagram. Where two (or more) paths come together (activities A
UNCORRECTED
paths come together (activities A and B), record the
UNCORRECTED
and B), record the smaller
UNCORRECTED
smaller
The critical path can now be clearly UNCORRECTED
The critical path can now be clearly
PAGE 6
PAGE 6 =
PAGE = 3
PAGE 3
Along path D: 9
PAGE Along path D: 9 –
PAGE – 2
PAGE 2 =
PAGE = 7
PAGE 7
Latest start time for PAGE
Latest start time for
PROOFS
PROOFS
PROOFS

Worked example 5 is fairly simple as the critical path could easily be determined by direct inspection. There is only one path that is not on the critical path, therefore the calculation of � oat time is also simple. In the real world, the problems are more complicated and so require the use of the formal method. Float times are important for the ef� cient management of any project. They enable the manager to determine what delays can be tolerated in the project. For example, the manager in charge of a building site is able to tell sub-contractors that they have a time window in which they must work. The sub-contractors can then arrange their schedules to incorporate this time window.
5 (a) Float times are calculated now. Construct a table with the headings shown.
(b) Record the times from the triangles in the earliest start times (EST) column, the times in the boxes in the latest start time (LSTY) column as well as the activity times (TX). Calculate � oat times using the equation:
FloatX = LSTY – ESTX – TX
In this example the � oat times are also the differences between the corresponding times in the boxes and triangles. This is not the rule in the general case.
For activity D: Float = 9 − 5 − 2= 2
For activity C: Float = 9 − 3 − 6= 0
For activity B: Float = 7 − 0 − 5= 2
For activity A: Float = 3 − 0 − 3= 0
Activity X
Activity time (TX)
Earliest start
time of this activity
(ESTX)
Latest start time of the following activity (LSTY)
Float time
A 3 0 3 0
B 5 0 7 2
C 6 3 9 0
D 2 5 9 2
Topic 10 DIRECTED GRAPHS AND NETWORKS 495
c10DirectedGraphsAndNetworks.indd 495 12/09/15 4:16 AM
UNCORRECTED Worked example 5 is fairly simple as the critical path could easily be determined
UNCORRECTED Worked example 5 is fairly simple as the critical path could easily be determined by direct inspection. There is only one path that is not on the critical path, therefore
UNCORRECTED by direct inspection. There is only one path that is not on the critical path, therefore the calculation of � oat time is also simple. In the real world, the problems are more
UNCORRECTED the calculation of � oat time is also simple. In the real world, the problems are more complicated and so require the use of the formal method. Float times are important
UNCORRECTED complicated and so require the use of the formal method. Float times are important for the ef� cient management of any project. They enable the manager to determine
UNCORRECTED
for the ef� cient management of any project. They enable the manager to determine what delays can be tolerated in the project. For example, the manager in charge of a
UNCORRECTED
what delays can be tolerated in the project. For example, the manager in charge of a building site is able to tell sub-contractors that they have a time window in which they
UNCORRECTED
building site is able to tell sub-contractors that they have a time window in which they must work. The sub-contractors can then arrange their schedules to incorporate this
UNCORRECTED
must work. The sub-contractors can then arrange their schedules to incorporate this time window.
UNCORRECTED
time window.
UNCORRECTED
UNCORRECTED PAGE
PAGE
PAGE or activity A: Float
PAGE or activity A: Float=
PAGE = PROOFS−
PROOFS− 6
PROOFS6
7
PROOFS7 −
PROOFS− 0
PROOFS0 −
PROOFS− 5
PROOFS5
= PROOFS
= 2PROOFS
2= PROOFS
= 3PROOFS
3 −PROOFS
− 0PROOFS
0PROOFS
PROOFS9 2
PROOFS9 2

The chart shown has been given to an operations manager. The activities have been simplified to letter names. The manager is required to find all critical activities and the earliest completion time for the project by:
a creating a network diagram
b completing a forward scan and determining the earliest completion time
c completing a backward scan and identifying the critical path
d calculating the float times for each activity.
THINK WRITE/DRAW
a Construct the network diagram from the table.
a
B, 4
C, 6
A, 3
D, 15
G, 2
I, 2
J, 3 M, 2
K, 4 N, 3
H, 4
E, 4 F, 7
b 1 Draw boxes and triangles
at each node. Forward scan through the network. Start at zero for the � rst node and then add the times taken for a path (TX) and write it in the triangle at the next node (ESTY).
Adding the times of the paths (TX) to the times in the triangle at the previous node (ESTX) gives the next value to be entered (ESTY).
When two paths converge at a node, the largest time value is entered as all immediate predecessors need to be completed before the next activity can begin.
b A = 3 daysA–E = 3 + 4 = 7 daysB = 4 daysThe blue triangle (ESTH) may be reached by following two paths:A–E–G = 3 + 4 + 2
= 9 days B–C = 4 + 6
= 10 days, thus the larger of the times, 10, is entered in the triangle.
B, 4
C, 6
A, 3
D, 15
G, 2
I, 2
J, 3 M, 2
K, 4 N, 3
H, 4
E, 4 F, 7
25
0
7
3 18
21
4 10
14
9
22
Activity letter
Immediate Predecessor
Time (days)
A — 3
B — 4
C B 6
D A 15
E A 4
F E 7
G E 2
H C, G 4
I F, H 2
J D, I 3
K D, I 4
M J 2
N K 3
WORKED EXAMPLE 666
496 MATHS QUEST 12 FURTHER MATHEMATICS VCE Units 3 and 4
c10DirectedGraphsAndNetworks.indd 496 12/09/15 4:16 AM
UNCORRECTED B, 4
UNCORRECTED B, 4 G, 2
UNCORRECTED G, 2
E, 4
UNCORRECTED E, 4
UNCORRECTED
UNCORRECTED
UNCORRECTED
UNCORRECTED
UNCORRECTED
UNCORRECTED
UNCORRECTED
UNCORRECTED
through the network. Start
UNCORRECTED
through the network. Start at zero for the � rst node and
UNCORRECTED
at zero for the � rst node and then add the times taken
UNCORRECTED
then add the times taken ) and write it
UNCORRECTED
) and write it in the triangle at the next
UNCORRECTED
in the triangle at the next
Y
UNCORRECTED
Y).
UNCORRECTED
).
Adding the times of the
UNCORRECTED
Adding the times of the paths (T
UNCORRECTED
paths (TX
UNCORRECTED
X) to the times in the
UNCORRECTED
) to the times in the triangle at the previous node UNCORRECTED
triangle at the previous node (EST UNCORRECTED
(ESTXUNCORRECTED
X) gives the next value to UNCORRECTED
) gives the next value to be entered (ESTUNCORRECTED
be entered (EST
b
UNCORRECTED b A
UNCORRECTED A =
UNCORRECTED = 3 days
UNCORRECTED 3 days
A
UNCORRECTED A–
UNCORRECTED –E
UNCORRECTED E
B
UNCORRECTED
B
PAGE
PAGE
PAGE D, 15
PAGE D, 15
PAGE
PAGE PROOFS
PROOFS
PROOFS
PROOFS
PROOFS
PROOFS
PROOFS
PROOFS
PROOFS
PROOFS
PROOFS
PROOFS
PROOFS
PROOFS
PROOFS
PROOFS
PROOFS
PROOFS
PROOFS
PROOFS
PROOFS
PROOFS
PROOFS
PROOFS2
PROOFS24
PROOFS4F, H
PROOFSF, H
D, I
PROOFSD, I
D, I
PROOFSD, I
J
PROOFSJ

2 The earliest completion time can be read from the last triangle.
Earliest completion time = 25 days
c 1 Starting at the end node, begin the backward scan. Enter the earliest completion time in the last box. Subtract the times of any paths ending at this node (M and N) from the value in the last box and enter the result in the appropriate boxes to calculate the latest start time (LST) of that activity.
c Blue box value (LSTM) = 25 − 2= 23 days
Pink box value (LSTN) = 25 − 3= 22 days
B, 4
C, 6
A, 3
D, 15
G, 2
I, 2
J, 3 M, 2
K, 4 N, 3
H, 4
E, 4 F, 7
2525
0
7
3 18
2123
4 10
14 2222
2 Repeat the process backwards through the network diagram. Where the paths converge the smallest value is entered in the box.
Backtracking to the green box (LSTJ) via activityJ = 23 − 3
= 20Backtracking to the green box (LSTK) via activityK = 23 − 4
= 18Enter the smaller of the values (18) in the green box.
B, 4
C, 6
A, 3
D, 15
G, 2
I, 2
J, 3M, 2
K, 4 N, 3
H, 4
E, 4 F, 7
2525
0
7
3 1818
2123
4 10
14
20
2222
3 Repeat the process back through all paths.
B, 4
C, 6
A, 3
D, 15
G, 2
I, 2
J, 3 M, 2
K, 4 N, 3
H, 4
E, 4 F, 7
2525
00
79
33
1818
2123
46
1012
1416
10
5
2 2222
Topic 10 DIRECTED GRAPHS AND NETWORKS 497
c10DirectedGraphsAndNetworks.indd 497 12/09/15 4:16 AM
UNCORRECTED 18
UNCORRECTED 18
UNCORRECTED Enter the smaller of the values (18) in the green box.
UNCORRECTED Enter the smaller of the values (18) in the green box.
Repeat the process back
UNCORRECTED
Repeat the process back through all paths.UNCORRECTED
through all paths.
PAGE
PAGE
PAGE
PAGE Backtracking to the green box (LST
PAGE Backtracking to the green box (LST
Backtracking to the green box (LST
PAGE Backtracking to the green box (LST
4 PAGE 4
PROOFS
PROOFS
PROOFS
PROOFS
PROOFSM, 2
PROOFSM, 2
K, 4
PROOFSK, 4
PROOFS
PROOFS
PROOFS
PROOFS
PROOFS
PROOFS
PROOFS
PROOFS
PROOFS
PROOFS
10 PROOFS
1010 PROOFS
10 PROOFS
PROOFS
PROOFS14
PROOFS1414
PROOFS14
PROOFS
PROOFS
PROOFS
PROOFS
PROOFS
PROOFS

4 Nodes which have the earliest start time (triangles) equal to the latest start times (boxes) are identi�ed as being on the critical path.
A–D–K–N is the critical path.
B, 4
C, 6
A, 3
D, 15
G, 2
I, 2
J, 3 M, 2
K, 4 N, 3
H, 4
E, 4 F, 7
2525
00
79
33
1818
2123
46
1012
1416
2222
d 1 (a) The �oat times for each of the activities are calculated using the formula.
(b) The section showing activity A from part c, step 4 clearly shows the latest start time of the following activity (LSTY) (pink), the earliest start time (ESTX) (blue) and the activity time (TX) (green).
d Float time of X = LSTY – ESTX – TX
Float (A) = 3 – 0 – 3 = 0A result of zero indicates that activity A is on the critical path with no �oat time available.
2 (a) The best way to keep organised and to calculate �oat times is to set up a table.
(b) Add columns for earliest start times (EST), latest start times (LST) and �oat times to the original table.
Repeat step 1 for all activities.
Activity letter
Immediate predecessor TX ESTX LSTY
Float timeX = LSTY –
ESTX – TX
A — 3 0 3 3 – 0 – 3 = 0
B — 4 0 6 6 – 0 – 4 = 2
C B 6 4 12 12 – 4 – 6 = 2
D A 15 3 18 18 – 3 – 15 = 0
E A 4 3 9 9 – 3 – 4 = 2
F E 7 7 16 16 – 7 – 7 = 2
G E 2 7 12 12 – 7 – 2 = 3
H C, G 4 10 16 16 – 10 – 4 = 2
I F, H 2 14 18 18 – 14 – 2 = 2
J D, I 3 18 23 23 – 18 – 3 = 2
K D, I 4 18 22 22 – 18 – 4 = 0
M J 2 21 25 25 – 21 – 2 = 2
N K 3 22 25 25 – 22 – 3 = 0
A, 3
33
00
498 MATHS QUEST 12 FURTHER MATHEMATICS VCE Units 3 and 4
c10DirectedGraphsAndNetworks.indd 498 12/09/15 4:16 AM
UNCORRECTED
UNCORRECTED
UNCORRECTED
UNCORRECTED
start times (LST) and �oat
UNCORRECTED
start times (LST) and �oat times to the original table.
UNCORRECTED
times to the original table.
step 1 for all
UNCORRECTED
step 1 for all
UNCORRECTED
UNCORRECTED
UNCORRECTED
UNCORRECTED
UNCORRECTED
UNCORRECTED
UNCORRECTED Activity
UNCORRECTED Activity
letter
UNCORRECTED letter
Immediate
UNCORRECTED Immediate predecessor T
UNCORRECTED predecessor T
A —
UNCORRECTED A —
PAGE
PAGE A, 3
PAGE A, 3
PAGE
PAGE
PAGE
PAGE
PAGE
PAGE 0
PAGE 00
PAGE 0
PROOFSA result of zero indicates that activity A is on the critical
PROOFSA result of zero indicates that activity A is on the critical path with no �oat time available.
PROOFSpath with no �oat time available.
PROOFS
PROOFS
PROOFS
PROOFS
PROOFS
3PROOFS
33PROOFS
3
Note that all activities that were on the critical path have � oat times of zero. It is important to note that if even a single activity is ‘� oated’ by having its start delayed, then the entire network diagram should be re-drawn and � oat times recalculated.
If the manager employed extra workers for a critical activity, its duration time could be reduced, hence reducing the completion time for the project. The reduction in the duration time of an activity is called crashing. Crashing may result in a different critical path. This will be explored further in a later section.
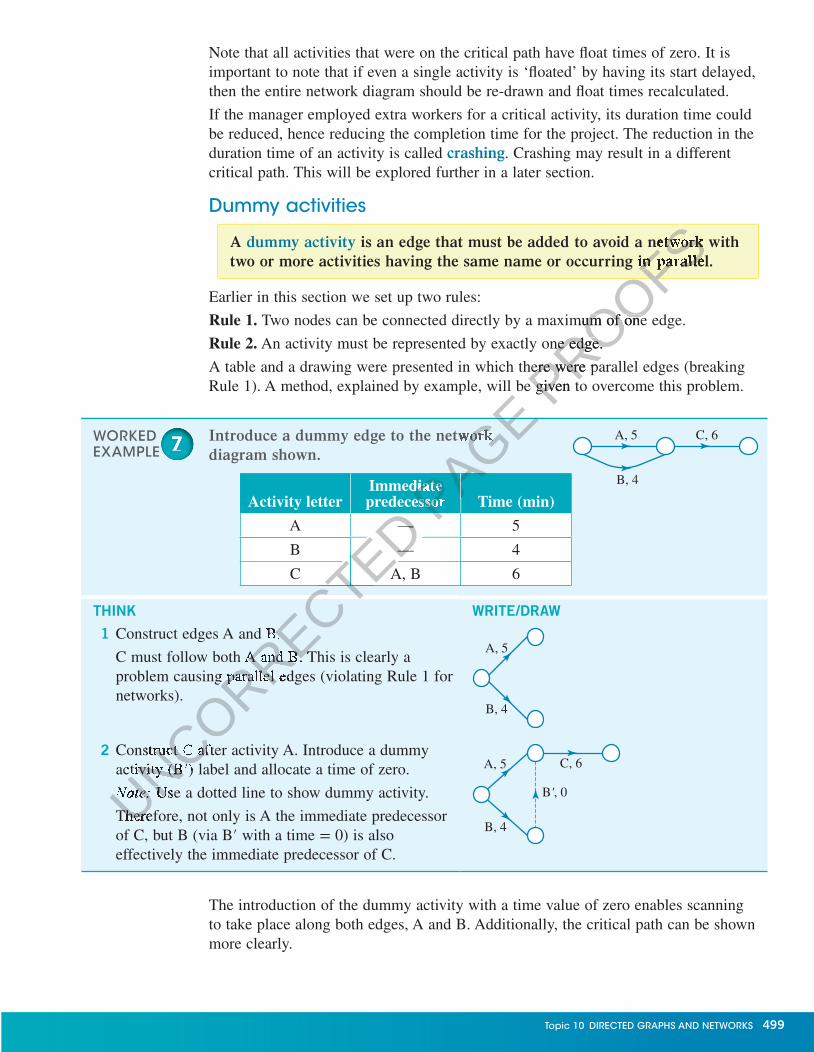
Dummy activities
A dummy activity is an edge that must be added to avoid a network with two or more activities having the same name or occurring in parallel.
Earlier in this section we set up two rules:
Rule 1. Two nodes can be connected directly by a maximum of one edge.
Rule 2. An activity must be represented by exactly one edge.
A table and a drawing were presented in which there were parallel edges (breaking Rule 1). A method, explained by example, will be given to overcome this problem.
Introduce a dummy edge to the network diagram shown.
Activity letterImmediate predecessor Time (min)
A — 5
B — 4
C A, B 6
THINK WRITE/DRAW
1 Construct edges A and B.
C must follow both A and B. This is clearly a problem causing parallel edges (violating Rule 1 for networks).
A, 5
B, 4
2 Construct C after activity A. Introduce a dummy activity (B′) label and allocate a time of zero.
Note: Use a dotted line to show dummy activity.
Therefore, not only is A the immediate predecessor of C, but B (via B′ with a time = 0) is also effectively the immediate predecessor of C.
A, 5 C, 6
B, 4
B', 0
C, 6A, 5
B, 4
WORKED EXAMPLE 777
The introduction of the dummy activity with a time value of zero enables scanning to take place along both edges, A and B. Additionally, the critical path can be shown more clearly.
Topic 10 DIRECTED GRAPHS AND NETWORKS 499
c10DirectedGraphsAndNetworks.indd 499 12/09/15 4:16 AM
UNCORRECTED
UNCORRECTED
UNCORRECTED
UNCORRECTED
UNCORRECTED
UNCORRECTED
UNCORRECTED
UNCORRECTED
UNCORRECTED
UNCORRECTED predecessor
UNCORRECTED predecessor
—
UNCORRECTED —
—
UNCORRECTED —
A, B
UNCORRECTED A, B
UNCORRECTED
UNCORRECTED
Construct edges A and B.
UNCORRECTED
Construct edges A and B.
C must follow both A and B. This is clearly a
UNCORRECTED
C must follow both A and B. This is clearly a problem causing parallel edges (violating Rule 1 for
UNCORRECTED
problem causing parallel edges (violating Rule 1 for
Construct C after activity A. Introduce a dummy
UNCORRECTED
Construct C after activity A. Introduce a dummy activity (B
UNCORRECTED
activity (B′
UNCORRECTED
′) label and allocate a time of zero.
UNCORRECTED
) label and allocate a time of zero.
Note:UNCORRECTED
Note: Use a dotted line to show dummy activity.UNCORRECTED
Use a dotted line to show dummy activity.
Therefore, not only is A the immediate predecessor UNCORRECTED
Therefore, not only is A the immediate predecessor
PAGE Rule 1). A method, explained by example, will be given to overcome this problem.
PAGE Rule 1). A method, explained by example, will be given to overcome this problem.
PAGE Introduce a dummy edge to the network
PAGE Introduce a dummy edge to the network
PAGE
PAGE
PAGE Immediate PAGE Immediate predecessorPAGE predecessorPAGE P
ROOFS
PROOFS
PROOFS
PROOFS is an edge that must be added to avoid a network with
PROOFS is an edge that must be added to avoid a network with two or more activities having the same name or occurring in parallel.
PROOFStwo or more activities having the same name or occurring in parallel.
Two nodes can be connected directly by a maximum of one edge.
PROOFS Two nodes can be connected directly by a maximum of one edge.
An activity must be represented by exactly one edge.
PROOFS An activity must be represented by exactly one edge.
A table and a drawing were presented in which there were parallel edges (breaking
PROOFS
A table and a drawing were presented in which there were parallel edges (breaking Rule 1). A method, explained by example, will be given to overcome this problem.PROOFS
Rule 1). A method, explained by example, will be given to overcome this problem.

From the table shown construct a network diagram.
Activity letter Immediate predecessor Time (days)
A — 5
B — 4
C A, B 4
D B 6
THINK WRITE/DRAW
1 Construct edges A and B.A, 5
B, 4
2 Construct edge D following B as it has only one immediate predecessor.
A, 5
B, 4 D, 6
3 C must follow both A and B (clearly a problem). Construct C after activity A. Introduce a dummy activity (B′) from B to C and allocate it a time of zero.
A, 5
B, 4
B', 0
D, 6
C, 4
WORKED EXAMPLE 888
Worked example 8 provides a method of not only avoiding parallel edges but also avoiding A being shown as the immediate predecessor of D, which (from the table) it clearly is not.
Once any required dummy activities have been de� ned, it is possible, using forward and backward scanning, to determine the earliest completion time for the project and � oat times for each non-critical activity, as per the methods of Worked example 6.
CrashingAs discussed earlier, crashing is a method of speeding up the completion time of a project by shortening the critical path. Follow the same method as in previous sections to calculate the new critical path and minimum completion time.
InteractivityCrashingint-6286
Take the critical path found in the network in Worked example 6 reproduced here.
To shorten the overall completion time of the project, activity A is to be shortened to 2 days and activity D is to be shortened to 12 days. Determine the new critical path and the new minimum completion time for the project.
WORKED EXAMPLE 999
500 MATHS QUEST 12 FURTHER MATHEMATICS VCE Units 3 and 4
c10DirectedGraphsAndNetworks.indd 500 12/09/15 4:16 AM
UNCORRECTED
UNCORRECTED
UNCORRECTED
UNCORRECTED
UNCORRECTED ) from B to C and allocate it a time of zero.
UNCORRECTED ) from B to C and allocate it a time of zero.
Worked example 8 provides a method of not only avoiding parallel edges but also
UNCORRECTED Worked example 8 provides a method of not only avoiding parallel edges but also avoiding A being shown as the immediate predecessor of D, which (from the table) it
UNCORRECTED
avoiding A being shown as the immediate predecessor of D, which (from the table) it clearly is not.
UNCORRECTED
clearly is not.
Once any required dummy activities have been de� ned, it is possible, using forward
UNCORRECTED
Once any required dummy activities have been de� ned, it is possible, using forward and backward scanning, to determine the earliest completion time for the project and
UNCORRECTED
and backward scanning, to determine the earliest completion time for the project and � oat times for each non-critical activity, as per the methods of Worked example 6.
UNCORRECTED
� oat times for each non-critical activity, as per the methods of Worked example 6.
Cras
UNCORRECTED
Crashing
UNCORRECTED
hingAs discussed earlier, crashing is a method of speeding up the completion time of a
UNCORRECTED
As discussed earlier, crashing is a method of speeding up the completion time of a project by shortening the critical path. Follow the same method as in previous sections
UNCORRECTED
project by shortening the critical path. Follow the same method as in previous sections
UNCORRECTED
UNCORRECTED
UNCORRECTED PAGE
PAGE
PAGE
PAGE B, 4
PAGE B, 4
PAGE
PAGE
PAGE
) from B to C and allocate it a time of zero.PAGE
) from B to C and allocate it a time of zero.
A, 5PAGE A, 5
PROOFS
PROOFS

B, 4
C, 6
D, 15
G, 2
I, 2
J, 3 M, 2
K, 4 N, 3
H, 4
E, 4 F, 7
2525
00
33
7
9
1818
2123
46
1012
1416
2222
A, 3
THINK WRITE/DRAW
1 Redraw the network with the new completion times.
B, 4
C, 6
D, 12
G, 2
I, 2
J, 3 M, 2
K, 4 N, 3
H, 4
E, 4 F, 7
7A, 2
2 Recalculate the earliest start times (EST) and latest start times (LST) by completing forward and backward scanning.
B, 4
C, 6
D, 12
G, 2
I, 2
J, 3 M, 2
K, 4 N, 3
H, 4
E, 4 F, 7
2323
00
23
6
7
1616
1921
44
1010
1414
2020
A, 2
3 Write the answer. The new critical path is B–C–H–I–K–N. The minimum �nishing time is 23 days.
Critical path analysis with backward scanning and crashing1 WE5 For the network diagram shown, use forward
and backward scanning to clearly display the critical path and to list any �oat times for non-critical activities. Times are in hours.
EXERCISE 10.3
A, 3 C, 7
E, 2D, 6
B, 4
F, 3
G, 6
PRACTISE
Topic 10 DIRECTED GRAPHS AND NETWORKS 501
c10DirectedGraphsAndNetworks.indd 501 12/09/15 4:16 AM
UNCORRECTED
UNCORRECTED
UNCORRECTED
UNCORRECTED
UNCORRECTED
UNCORRECTED
UNCORRECTED
Write the answer.
UNCORRECTED
Write the answer.
PAGE C, 6PAGE C, 6
G, 2
PAGE G, 2
PAGE
PAGE F, 7
PAGE F, 7
PAGE
PAGE
PAGE
PAGE
PAGE
PAGE
PAGE
PAGE
PAGE
PAGE
PAGE
PAGE
PAGE
PAGE
PAGE PROOFS
PROOFS
PROOFS
D, 12 PROOFS
D, 12 PROOFS
PROOFS
PROOFS

2 Perform a backward scan on the network shown. Determine:
a the critical pathb �oat times for non-critical activities.
3 WE6 The manufacturing of bicycles can be considered as a 7-step process:
A — Collect all the parts — 12 minutes
B — Paint frame — 35 minutes (requires A to be completed �rst)
C — Assemble brakes — 16 minutes (requires A to be completed �rst)
D — Assemble gears — 20 minutes (requires B to be completed �rst)
E — Install brakes — 12 minutes (requires C to be completed �rst)
F — Install seat — 5 minutes (requires C to be completed �rst)
G — Final assembly — 18 minutes (requires D and E to be completed �rst)
a Construct an activity chart.b Construct a network diagram.c Determine the earliest completion time using forward and backward
scanning.d Determine the critical path.
4 In the bicycle manufacturing system described in question 3, activities with �oat time are:
A A, B, C, D, E, F, G B A, B, D, G C C, E, FD C only E none
5 WE7 Re-draw the network diagram shown, inserting any necessary dummy activities so that Rule 1 for critical path problems is not violated.
6 Consider the following activity table.
By creating one (or more) dummy activities, construct a proper critical path network diagram.
A, 1
B, 2
C, 1 H, 1G, 1.5
F, 2.5
E, 3.5
D, 3
K, 2 J, 2
B
D
HE
FG
A C
Activity Immediate predecessor
Activity Time (min)
A — 7
B — 6
C A, B 8
D C 12
E C 7
F D, E 9
502 MATHS QUEST 12 FURTHER MATHEMATICS VCE Units 3 and 4
c10DirectedGraphsAndNetworks.indd 502 12/09/15 4:16 AM
UNCORRECTED B
UNCORRECTED B A, B, D, G
UNCORRECTED A, B, D, GE
UNCORRECTED E none
UNCORRECTED none
Re-draw the network diagram shown, inserting any necessary dummy
UNCORRECTED Re-draw the network diagram shown, inserting any necessary dummy
activities so that Rule 1 for critical path problems is not violated.
UNCORRECTED activities so that Rule 1 for critical path problems is not violated.
Consider the following activity table.
UNCORRECTED
Consider the following activity table.
UNCORRECTED
UNCORRECTED
UNCORRECTED
Activity Immediate
UNCORRECTED
Activity Immediate
PAGE Determine the earliest completion time using forward and backward
PAGE Determine the earliest completion time using forward and backward
In the bicycle manufacturing system described in question
PAGE In the bicycle manufacturing system described in question
A, B, D, GPAGE
A, B, D, G
PROOFSA to be completed �rst)
PROOFSA to be completed �rst)
A to be completed �rst)
PROOFSA to be completed �rst)
B to be completed �rst)
PROOFSB to be completed �rst)
C to be completed �rst)
PROOFSC to be completed �rst)
C to be completed �rst)
PROOFSC to be completed �rst)
D and E to be completed �rst)
PROOFSD and E to be completed �rst)
Determine the earliest completion time using forward and backward PROOFS
Determine the earliest completion time using forward and backward

7 WE8 From the following activity table construct a network diagram and indicate the location and direction of the dummy activity.
Activity letter Immediate predecessor Time (h)
A — 3
B — 5
C A 7
D B 7
E B, C 1
F D, E 2
8 Convert the following activity table into a network diagram.
9 WE9 From your network diagram in question 6, determine:
a the earliest completion timeb the critical pathc �oat times for non-critical activities.
10 For the network in Exercise 10.2, question 2, determine the critical path.
11 For the network diagram shown, use forward and backward scanning to clearly display the critical path and to list any �oat times. Times are in minutes.
12 Complete the �gure by forward and backward scanning and hence:
a determine the earliest completion timeb indicate the critical path.
Times are in days.
c Imagine now that activity E can be completed in 9 days. How does this affect the answers to parts a and b?
Activity letter Immediate predecessor Time (h)
A — 1000
B — 600
C — 800
D A, B 1100
E B 400
F C 100
G C 600
H D, E 1600
A, 12C, 4
E, 3
B, 9D, 11
CONSOLIDATE
B, 11A, 7
D, 3
C, 4 G, 8
F, 6
E, 12
Topic 10 DIRECTED GRAPHS AND NETWORKS 503
c10DirectedGraphsAndNetworks.indd 503 12/09/15 4:16 AM
UNCORRECTED From your network diagram in question
UNCORRECTED From your network diagram in question
the earliest completion time
UNCORRECTED the earliest completion timethe critical path
UNCORRECTED the critical path�oat times for non-critical activities.
UNCORRECTED �oat times for non-critical activities.
For the network in Exercise 10.2, question
UNCORRECTED
For the network in Exercise 10.2, question
For the network diagram shown, use forward and
UNCORRECTED
For the network diagram shown, use forward and backward scanning to clearly display the critical path
UNCORRECTED
backward scanning to clearly display the critical path and to list any �oat times. Times are in minutes.
UNCORRECTED
and to list any �oat times. Times are in minutes.
UNCORRECTED PAGE
PAGE
PAGE
PAGE
PAGE
PAGE
PAGE
PAGE
PAGE
PAGE
PAGE C
PAGE C
D, EPAGE D, E
PROOFS
PROOFS
PROOFS
PROOFS
PROOFS
PROOFS
PROOFS
PROOFSTime (h)
PROOFSTime (h)
1000
PROOFS1000
600
PROOFS600
800PROOFS
800

13 The �oat time for activity D in question 12 is:
A 1 day B 2 days C 3 days D 4 days E 7 days
14 From the network diagram shown:
a produce an activity tableb complete a forward scan and hence determine the earliest completion timec complete a backward scan and hence determine the critical pathd use the activity table from a to calculate �oat times for all non-critical activities.
15 From the following activity table:
a construct a network diagramb determine the earliest completion timec by forward and backward scanning, determine the critical pathd determine the �oat time for all non-critical activities.
Activity letter Immediate predecessor Time (h)
A — 5
B — 3
C A 4
D A 7
E B 4
F C 9
G D, E 5
H G 3
J G 6
K F, H 4
16 Re-draw the network diagram shown, inserting any necessary dummy activities so that rule 1 for critical path problems is not violated.
17 From the following activity table:
a construct a network diagram, adding any dummy activities that may be requiredb determine the earliest completion time
B J
D
H KEF
G
A C
B, 4A, 3
D, 7
C, 6 G, 12
M, 9H, 2
F, 5 K, 10 N, 6
J, 11
L, 3
E, 8
504 MATHS QUEST 12 FURTHER MATHEMATICS VCE Units 3 and 4
c10DirectedGraphsAndNetworks.indd 504 12/09/15 4:16 AM
UNCORRECTED
UNCORRECTED
UNCORRECTED
UNCORRECTED
UNCORRECTED
UNCORRECTED
UNCORRECTED
UNCORRECTED
UNCORRECTED
UNCORRECTED
UNCORRECTED
UNCORRECTED
UNCORRECTED
UNCORRECTED
UNCORRECTED
UNCORRECTED
UNCORRECTED
UNCORRECTED
UNCORRECTED Immediate predecessor
UNCORRECTED Immediate predecessor
—
UNCORRECTED —
E
UNCORRECTED
E
F
UNCORRECTED
F
G
UNCORRECTED
G
H
UNCORRECTED
H
16
UNCORRECTED
16
PAGE determine the earliest completion time
PAGE determine the earliest completion timeby forward and backward scanning, determine the critical path
PAGE by forward and backward scanning, determine the critical pathdetermine the �oat time for all non-critical activities.
PAGE determine the �oat time for all non-critical activities.
PAGE
Immediate predecessorPAGE
Immediate predecessor
PROOFScomplete a forward scan and hence determine the earliest completion time
PROOFScomplete a forward scan and hence determine the earliest completion timecomplete a backward scan and hence determine the critical path
PROOFScomplete a backward scan and hence determine the critical path
to calculate �oat times for all non-critical activities.PROOFS
to calculate �oat times for all non-critical activities.

c determine the critical path by forward and backward scanningd determine the �oat time for all non-critical activities.
Activity letter Immediate predecessor Time (h)
A — 11
B — 9
C A 2
D A 5
E B 12
F C 3
G D 3
H E 4
J E, F, G 7
18 From the network diagram at right (activity times are recorded in days):
a forward scan to determine the earliest completion time
b backward scan to determine the critical path
c determine the �oat time for activity Xd imagine that crashing results in J
being completed in 5 days. How does this affect the earliest completion time and the critical path?
19 Given the network diagram at right, determine the:
a four missing values in the boxesb critical pathc �oat time for activity F.
20 Given the network diagram at right, determine the:
a four missing values in the boxes
b critical pathc �oat time for activity F.
B, 4
J, 7D, 3
H, 5N, 6
L, 3
Q, 5M, 4
K, 5
E, 5
F, 9
G, 9
P, 10
X, 3
A, 15C, 10
A, 10
F,
C, 7
E, 1
J, 8
K, 5
D', 0G, 4
B, 8
I,
1010
016
815
2424
2929
1717
D, 6
A, 12
D, 9
H, 18
I, 8G, 20
F, 16B, 10
C, 15
12
00
15 2425
3838
4444
1014
3030
E,
K,
B′, 0
J, 13
Topic 10 DIRECTED GRAPHS AND NETWORKS 505
c10DirectedGraphsAndNetworks.indd 505 12/09/15 4:16 AM
UNCORRECTED being completed in 5 days. How does
UNCORRECTED being completed in 5 days. How does this affect the earliest completion
UNCORRECTED this affect the earliest completion time and the critical path?
UNCORRECTED time and the critical path?
Given the network diagram at right,
UNCORRECTED Given the network diagram at right, determine the:
UNCORRECTED determine the:
four missing values in the boxes
UNCORRECTED four missing values in the boxescritical path
UNCORRECTED
critical path�oat time for activity F.
UNCORRECTED
�oat time for activity F.
PAGE determine the �oat time for activity X
PAGE determine the �oat time for activity Ximagine that crashing results in J PAGE imagine that crashing results in J being completed in 5 days. How does PAGE
being completed in 5 days. How does
A, 15
PAGE A, 15
C, 10
PAGE C, 10
PAGE
PAGE
PAGE
PAGE PROOFS
PROOFS
PROOFS
PROOFS
PROOFS7
PROOFS7
PROOFS
B, 4 PROOFS
B, 4
E, 5
PROOFSE, 5
PROOFS
PROOFS
PROOFS
PROOFS
PROOFS
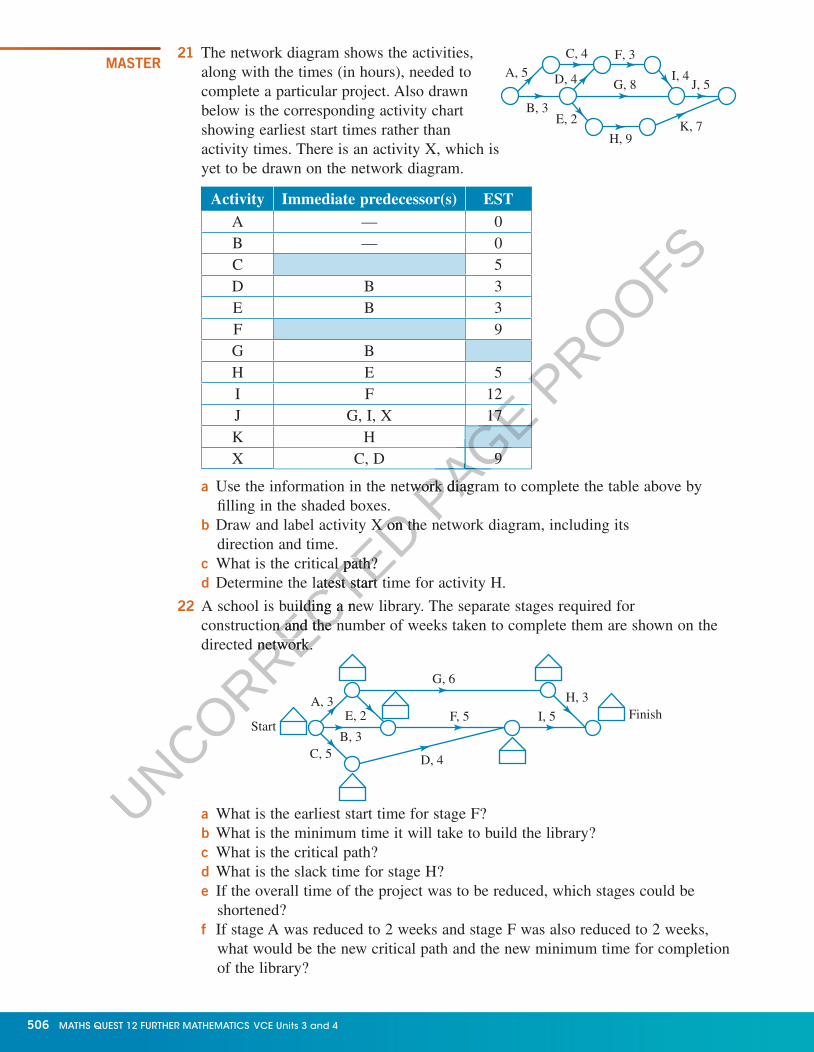
21 The network diagram shows the activities, along with the times (in hours), needed to complete a particular project. Also drawn below is the corresponding activity chart showing earliest start times rather than activity times. There is an activity X, which is yet to be drawn on the network diagram.
Activity Immediate predecessor(s) ESTA — 0B — 0C 5D B 3E B 3F 9G BH E 5I F 12J G, I, X 17K HX C, D 9
a Use the information in the network diagram to complete the table above by �lling in the shaded boxes.
b Draw and label activity X on the network diagram, including its direction and time.
c What is the critical path?d Determine the latest start time for activity H.
22 A school is building a new library. The separate stages required for construction and the number of weeks taken to complete them are shown on the directed network.
C, 5
StartFinish
A, 3 H, 3G, 6
D, 4
B, 3
E, 2 F, 5 I, 5
a What is the earliest start time for stage F?b What is the minimum time it will take to build the library?c What is the critical path?d What is the slack time for stage H?e If the overall time of the project was to be reduced, which stages could be
shortened?f If stage A was reduced to 2 weeks and stage F was also reduced to 2 weeks,
what would be the new critical path and the new minimum time for completion of the library?
MASTERA, 5
C, 4
D, 4 G, 8
H, 9K, 7
I, 4J, 5
F, 3
B, 3E, 2
506 MATHS QUEST 12 FURTHER MATHEMATICS VCE Units 3 and 4
c10DirectedGraphsAndNetworks.indd 506 12/09/15 4:16 AM
UNCORRECTED Draw and label activity X on the network diagram, including its
UNCORRECTED Draw and label activity X on the network diagram, including its
What is the critical path?
UNCORRECTED What is the critical path?Determine the latest start time for activity H.
UNCORRECTED Determine the latest start time for activity H.
A school is building a new library. The separate stages required for
UNCORRECTED A school is building a new library. The separate stages required for construction and the number of weeks taken to complete them are shown on the
UNCORRECTED
construction and the number of weeks taken to complete them are shown on the directed network.
UNCORRECTED
directed network.
PAGE
PAGE
PAGE
PAGE
PAGE
PAGE
PAGE
PAGE
PAGE
PAGE
PAGE
PAGE 17
PAGE 17
9
PAGE 9
PAGE Use the information in the network diagram to complete the table above by PAGE Use the information in the network diagram to complete the table above by
Draw and label activity X on the network diagram, including its PAGE
Draw and label activity X on the network diagram, including its
PROOFS
PROOFS
PROOFS

Network flowThere are many examples of networks throughout the modern world. The road and rail systems that link all parts of our country, such as the one in the image, and the airline �ight paths that not only link us to other places within the country but also to places overseas, are examples of networks that move people and products. Other networks such as the information superhighway (the internet), telephone lines and the postal system allow the transfer of information.
All these networks have common attributes. The attribute dealt with in this section is network flow. There are networks that allow for the �ow to be in both directions along a path and those that allow for �ow in one direction only. The direction of �ow needs to be displayed clearly on any diagram: simple arrows on the path suf�ce. The quantity of �ow is just as important.
Flow capacities and maximum flowThe network’s starting node(s) is called the source. This is where all �ows commence. The �ow goes through the network to the end node(s) which is called the sink.
The flow capacity (capacity) of an edge is the amount of �ow that an edge can allow through if it is not connected to any other edges.
The inflow of a node is the total of the �ows of all edges leading into the node.
The outflow of a node is the minimum value obtained when one compares the in�ow to the sum of the capacities of all the edges leaving the node.
Consider the following �gures.
Source SinkA B C
D
E
F
B
80
20100
30
B
10
2010030
10.4
InteractivityNetwork �ow int-6287
All �ow commences at A. It is therefore the source. All �ow converges on F indicating it is the sink.
B still has an in�ow of 100 but now the capacity of the edges leaving B is 130 (80 + 20 + 30). The out�ow from B is now 100.
B has an in�ow of 100. The �ow capacity of the edges leaving B is 30 + 20 + 10 = 60. The out�ow is the smaller of these two total values, which is 60.
Unit 4
AOS M2
Topic 2
Concept 3
Network �owConcept summary Practice questions
Topic 10 DIRECTED GRAPHS AND NETWORKS 507
c10DirectedGraphsAndNetworks.indd 507 12/09/15 4:16 AM
UNCORRECTED commence. The �ow goes through the network to the end node(s) which is
UNCORRECTED commence. The �ow goes through the network to the end node(s) which is
(capacity) of an edge is the amount of �ow that an edge can allow
UNCORRECTED (capacity) of an edge is the amount of �ow that an edge can allow
through if it is not connected to any other edges.
UNCORRECTED through if it is not connected to any other edges.
of a node is the total of the �ows of all edges leading into the node.
UNCORRECTED of a node is the total of the �ows of all edges leading into the node.
outflow
UNCORRECTED outflow of a node is the
UNCORRECTED of a node is the
to the sum of the capacities of all the edges leaving the node.
UNCORRECTED
to the sum of the capacities of all the edges leaving the node.
Consider the following �gures.
UNCORRECTED
Consider the following �gures.
Source
UNCORRECTED
Source
UNCORRECTED
UNCORRECTED
UNCORRECTED
A
UNCORRECTED
A
UNCORRECTED PAGE needs to be displayed clearly on any diagram: simple arrows on the path suf�ce. The
PAGE needs to be displayed clearly on any diagram: simple arrows on the path suf�ce. The
Flow capacities and maximum flow
PAGE Flow capacities and maximum flowThe network’s starting node(s) is called the PAGE The network’s starting node(s) is called the commence. The �ow goes through the network to the end node(s) which is PAGE
commence. The �ow goes through the network to the end node(s) which is
PROOFSAll these networks have common attributes. The attribute dealt with in this section
PROOFSAll these networks have common attributes. The attribute dealt with in this section
. There are networks that allow for the �ow to be in both directions
PROOFS
. There are networks that allow for the �ow to be in both directions along a path and those that allow for �ow in one direction only. The PROOFS
along a path and those that allow for �ow in one direction only. The needs to be displayed clearly on any diagram: simple arrows on the path suf�ce. The PROOFS
needs to be displayed clearly on any diagram: simple arrows on the path suf�ce. The PROOFS
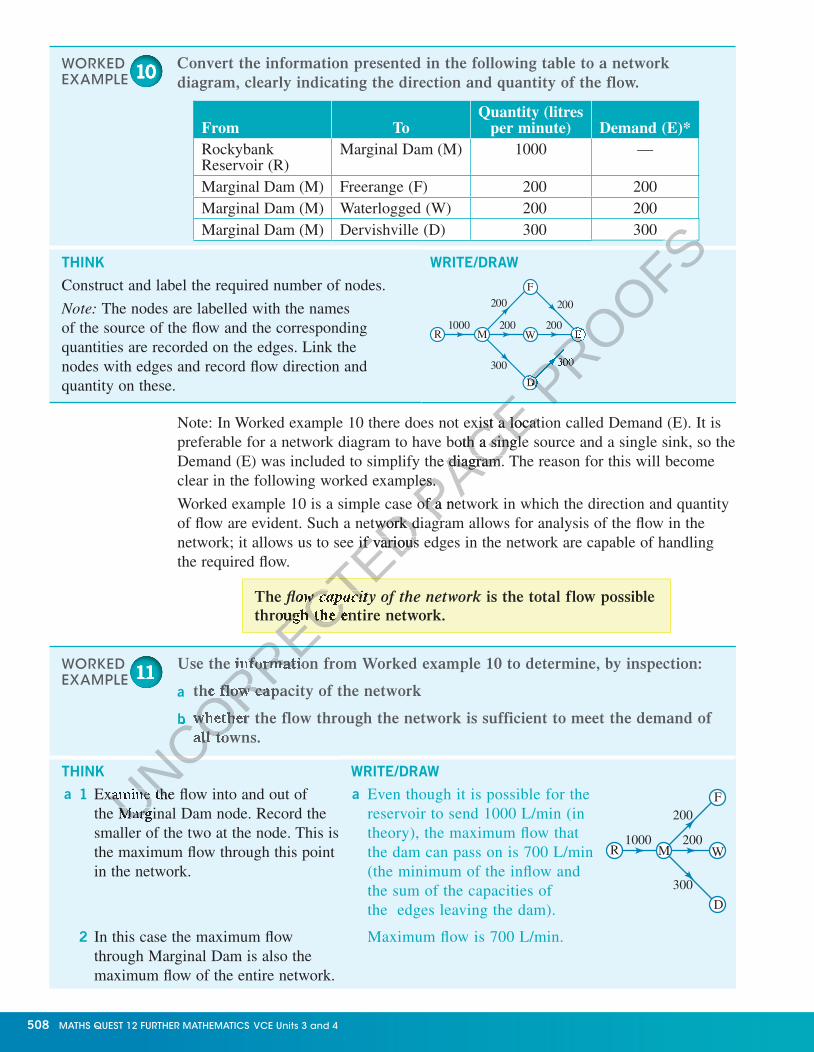
Convert the information presented in the following table to a network diagram, clearly indicating the direction and quantity of the flow.
From ToQuantity (litres
per minute) Demand (E)*Rockybank Reservoir (R)
Marginal Dam (M) 1000 —
Marginal Dam (M) Freerange (F) 200 200Marginal Dam (M) Waterlogged (W) 200 200Marginal Dam (M) Dervishville (D) 300 300
THINK WRITE/DRAW
Construct and label the required number of nodes.
Note: The nodes are labelled with the names of the source of the � ow and the corresponding quantities are recorded on the edges. Link the nodes with edges and record � ow direction and quantity on these.
R M W
F
D
E1000 200 200
300 300
200 200
WORKED EXAMPLE 101010
Note: In Worked example 10 there does not exist a location called Demand (E). It is preferable for a network diagram to have both a single source and a single sink, so the Demand (E) was included to simplify the diagram. The reason for this will become clear in the following worked examples.
Worked example 10 is a simple case of a network in which the direction and quantity of � ow are evident. Such a network diagram allows for analysis of the � ow in the network; it allows us to see if various edges in the network are capable of handling the required � ow.
The fl ow capacity of the network is the total flow possible through the entire network.
Use the information from Worked example 10 to determine, by inspection:
a the flow capacity of the network
b whether the flow through the network is sufficient to meet the demand of all towns.
THINK WRITE/DRAW
a 1 Examine the � ow into and out of the Marginal Dam node. Record the smaller of the two at the node. This is the maximum � ow through this point in the network.
a Even though it is possible for the reservoir to send 1000 L/min (in theory), the maximum � ow that the dam can pass on is 700 L/min (the minimum of the in� ow and the sum of the capacities of the edges leaving the dam).
2 In this case the maximum � ow through Marginal Dam is also the maximum � ow of the entire network.
Maximum � ow is 700 L/min.
R M W
F
D
1000 200
300
200
WORKED EXAMPLE 111111
508 MATHS QUEST 12 FURTHER MATHEMATICS VCE Units 3 and 4
c10DirectedGraphsAndNetworks.indd 508 12/09/15 4:16 AM
UNCORRECTED Worked example 10 is a simple case of a network in which the direction and quantity
UNCORRECTED Worked example 10 is a simple case of a network in which the direction and quantity of � ow are evident. Such a network diagram allows for analysis of the � ow in the
UNCORRECTED of � ow are evident. Such a network diagram allows for analysis of the � ow in the network; it allows us to see if various edges in the network are capable of handling
UNCORRECTED network; it allows us to see if various edges in the network are capable of handling
UNCORRECTED
UNCORRECTED
UNCORRECTED fl ow capacity of the network
UNCORRECTED fl ow capacity of the network
through the entire network.
UNCORRECTED through the entire network.
UNCORRECTED
Use the information from Worked example 10 to determine, by inspection:
UNCORRECTED
Use the information from Worked example 10 to determine, by inspection:
the flow capacity of the network
UNCORRECTED
the flow capacity of the network
b
UNCORRECTED
b whether the flow through the network is sufficient to meet the demand of
UNCORRECTED
whether the flow through the network is sufficient to meet the demand of all towns.
UNCORRECTED
all towns.
UNCORRECTED
UNCORRECTED
Examine the � ow into and out of UNCORRECTED
Examine the � ow into and out of the Marginal Dam node. Record the UNCORRECTED
the Marginal Dam node. Record the UNCORRECTED PAGE
PAGE
PAGE Note: In Worked example 10 there does not exist a location called Demand (E). It is
PAGE Note: In Worked example 10 there does not exist a location called Demand (E). It is preferable for a network diagram to have both a single source and a single sink, so the
PAGE preferable for a network diagram to have both a single source and a single sink, so the Demand (E) was included to simplify the diagram. The reason for this will become
PAGE Demand (E) was included to simplify the diagram. The reason for this will become clear in the following worked examples.
PAGE clear in the following worked examples.
Worked example 10 is a simple case of a network in which the direction and quantity PAGE
Worked example 10 is a simple case of a network in which the direction and quantity of � ow are evident. Such a network diagram allows for analysis of the � ow in the PAGE
of � ow are evident. Such a network diagram allows for analysis of the � ow in the
PROOFS
PROOFS
PROOFS
PROOFS
PROOFS
PROOFS
PROOFS
PROOFS
PROOFS
PROOFS
PROOFS
D PROOFS
D PROOFS
PROOFSE
PROOFSE
300
PROOFS
300
PROOFS
PROOFS

Excess fl ow capacityConsider what would happen to the system if Rockybank Reservoir continually discharged 1000 L/min into Marginal Dam while its output remained at 700 L/min.
Such � ow networks enable future planning. Future demand may change, the population may grow or a new industry that requires more water may come to one of the towns. Worked example 12 will examine such a case.
Excess flow capacity is the surplus of the capacity of an edge less the flow into the edge.
b 1 Determine that the maximum � ow through Marginal Dam meets the total � ow demanded by the towns.
b
M W
F
D
E200 200
300 300
200 200
Flow through Marginal Dam = 700 L/minFlow demanded = 200 + 300 + 200
= 700 L /min
2 If the requirements of step 1 are able to be met then determine that the � ow into each town is equal to the � ow demanded by them.
By inspection of the table in Worked example 10, all town in� ows equal town demands (capacity of edges leaving the town nodes).
A new dairy factory (Creamydale (C)) is to be set up on the outskirts of Dervishville. The factory will require 250 L/min of water.
a Determine whether the original flow to Dervishville is sufficient.
b If the answer to part a is no, is there sufficient flow capacity into Marginal Dam to allow for a new pipeline to be constructed directly to the factory to meet their demand?
c Determine the maximum flow through the network if the new pipeline is constructed.
THINK WRITE/DRAW
a 1 Add the demand of the new factory to Dervishville’s original � ow requirements. If this value exceeds the � ow into Dervishville then the new demand cannot be met.
a
R M W
F
D
E1000 200 200
300 300 + 250
200 200
2 The new requirements exceed the � ow.
The present network is not capable of meeting the new demands.
WORKED EXAMPLE 121212
M
D
E
300 550
Topic 10 DIRECTED GRAPHS AND NETWORKS 509
c10DirectedGraphsAndNetworks.indd 509 12/09/15 4:16 AM
UNCORRECTED
UNCORRECTED
UNCORRECTED an edge less the flow into the edge.
UNCORRECTED an edge less the flow into the edge.
UNCORRECTED A new dairy factory (Creamydale (C)) is to be set up on the outskirts of
UNCORRECTED A new dairy factory (Creamydale (C)) is to be set up on the outskirts of Dervishville. The factory will require 250 L/min of water.
UNCORRECTED Dervishville. The factory will require 250 L/min of water.
Determine whether the original flow to Dervishville is sufficient.
UNCORRECTED Determine whether the original flow to Dervishville is sufficient.
If the answer to part
UNCORRECTED
If the answer to part Dam to allow for a new pipeline to be constructed directly to the factory to
UNCORRECTED
Dam to allow for a new pipeline to be constructed directly to the factory to meet their demand?
UNCORRECTED
meet their demand?
c
UNCORRECTED
c Determine the maximum flow through the network if the new pipeline is
UNCORRECTED
Determine the maximum flow through the network if the new pipeline is constructed.
UNCORRECTED
constructed.
UNCORRECTED
UNCORRECTED
UNCORRECTED
Add the demand of the new
UNCORRECTED
Add the demand of the new factory to Dervishville’s
UNCORRECTED
factory to Dervishville’s original � ow requirements. UNCORRECTED
original � ow requirements. If this value exceeds the � ow UNCORRECTED
If this value exceeds the � ow UNCORRECTED PAGE discharged 1000 L/min into Marginal Dam while its output remained at 700 L/min.
PAGE discharged 1000 L/min into Marginal Dam while its output remained at 700 L/min.
Such � ow networks enable future planning. Future demand may change, the
PAGE Such � ow networks enable future planning. Future demand may change, the population may grow or a new industry that requires more water may come to one of
PAGE population may grow or a new industry that requires more water may come to one of the towns. Worked example 12 will examine such a case.
PAGE the towns. Worked example 12 will examine such a case.
PAGE
PAGE Excess flow capacityPAGE Excess flow capacity is the surplus of the capacity of PAGE
is the surplus of the capacity of an edge less the flow into the edge.PAGE
an edge less the flow into the edge.
PROOFS
Consider what would happen to the system if Rockybank Reservoir continually PROOFS
Consider what would happen to the system if Rockybank Reservoir continually discharged 1000 L/min into Marginal Dam while its output remained at 700 L/min.PROOFS
discharged 1000 L/min into Marginal Dam while its output remained at 700 L/min.PROOFS
PROOFSBy inspection of the table in Worked example 10, all
PROOFSBy inspection of the table in Worked example 10, all town in� ows equal town demands (capacity of edges
PROOFStown in� ows equal town demands (capacity of edges

b 1 Reconstruct the network including a new edge for the factory after Marginal Dam.
b
R M W
F
D
C
E1000 200 200
300
250 250
300
200 200
2 Repeat step 1 from Worked example 11 to � nd the out� ow of node M.
Marginal Dam in� ow = 1000Marginal Dam out� ow = 200 + 200 + 300 + 250 = 950
3 Determine if the � ow is suf� cient.
There is excess � ow capacity of 300 into Marginal Dam which is greater than the 250 demanded by the new factory. The existing � ow capacity to Marginal Dam is suf� cient.
c This answer can be gained from part b step 2 above.
c The maximum � ow through the new network is 950.
R M W
F
D
C
1000 200
300
250
200
The maximum � ow through most simple networks can be determined using these methods, but more complex networks require different methods.
Minimum cut–maximum flow methodTo determine the maximum � ow, the network � rst needs to be divided or cut into two parts.
A cut in a network diagram is a line drawn through a number of edges which stops all flow from the source to the sink.
The value of the cut is the total flow of the edges that are cut.The minimum cut is the cut with the minimum value.The maximum fl ow through a network is equal to the value of the minimum cut.
InteractivityNetwork � ow cutsint-6288
For the network diagram shown:
a make three cuts
b calculate the value of each cut
c determine the value of all possible cuts to give the value of the minimum cut and hence the maximum flow through the network.
WORKED EXAMPLE 131313 8
7
4
5
33A C
B
D
E
510 MATHS QUEST 12 FURTHER MATHEMATICS VCE Units 3 and 4
c10DirectedGraphsAndNetworks.indd 510 12/09/15 4:16 AM
UNCORRECTED
UNCORRECTED
UNCORRECTED
UNCORRECTED The maximum � ow through most simple networks can be determined using these
UNCORRECTED The maximum � ow through most simple networks can be determined using these methods, but more complex networks require different methods.
UNCORRECTED methods, but more complex networks require different methods.
Minimum cut–maximum flow method
UNCORRECTED Minimum cut–maximum flow methodTo determine the maximum � ow, the network � rst needs to be divided or
UNCORRECTED
To determine the maximum � ow, the network � rst needs to be divided or
UNCORRECTED
UNCORRECTED
UNCORRECTED
A
UNCORRECTED
A cut
UNCORRECTED
cut in a network diagram is a line drawn through a number of edges
UNCORRECTED
in a network diagram is a line drawn through a number of edges cut in a network diagram is a line drawn through a number of edges cut
UNCORRECTED
cut in a network diagram is a line drawn through a number of edges cutwhich stops
UNCORRECTED
which stops
The value of the cut is the total flow of the edges that are cut.
UNCORRECTED
The value of the cut is the total flow of the edges that are cut.The
UNCORRECTED
The
PAGE There is excess � ow capacity of 300 into Marginal Dam
PAGE There is excess � ow capacity of 300 into Marginal Dam which is greater than the 250 demanded by the new factory.
PAGE which is greater than the 250 demanded by the new factory. The existing � ow capacity to Marginal Dam is suf� cient.
PAGE The existing � ow capacity to Marginal Dam is suf� cient.
The maximum � ow through the new network is 950.PAGE The maximum � ow through the new network is 950.
PROOFS
PROOFS
PROOFS
PROOFS
PROOFS
PROOFS
PROOFS
PROOFSM
PROOFSM
PROOFS
PROOFSF
PROOFSF1000
PROOFS1000 200
PROOFS200
250
PROOFS
250
200
PROOFS200
PROOFS
PROOFS
PROOFS
PROOFS
PROOFS

THINK WRITE/DRAW
a 1 Isolate the source, A, by cutting any edges leaving it.
Cut 1 = {AB, AC, AD}
a Cut 18
7
4
5
33A C
B
D
E
2 Isolate the sink, E, by cutting any edges leading into it.
Cut 2 = {BE, CE, DE}
Cut 1 Cut 2
8
7
4
5
33A C
B
D
E
3 Place a cut through each of the three paths going from A to E.
Cut 3 = {AD, AC, BE}
Cut 1 Cut 2
Cut 3
8
7
4
5
33A C
B
D
E
b Add the values of the edges crossed by each of the cuts in a.
b Value of cut 1 = 8 + 3 + 7= 18
Value of cut 2 = 4 + 3 + 5= 12
Value of cut 3 = 7 + 3 + 4= 14
c 1 Identify the cuts in the diagram.
Cut 1 = {AB, AC, AD}
Cut 2 = {BE, CE, DE}
Cut 3 = {AD, AC, BE}
Cut 4 = {AD, CE, BE}
Cut 5 = {AB, CE, DE}
Cut 6 = {AB, AC, DE}
c Cut 1 Cut 5 Cut 2
Cut 3Cut 4 Cut 6
8
7
4
5
33A C
B
D
E
2 Calculate the value of all cuts. Value of cut 1 = 8 + 3 + 7= 18
Value of cut 2 = 4 + 3 + 5= 12
Value of cut 3 = 7 + 3 + 4= 14
Value of cut 4 = 7 + 3 + 4= 14
Value of cut 5 = 8 + 3 + 5= 16
Value of cut 6 = 8 + 3 + 5= 16
Topic 10 DIRECTED GRAPHS AND NETWORKS 511
c10DirectedGraphsAndNetworks.indd 511 12/09/15 4:16 AM
UNCORRECTED
{AD, AC, BE}
UNCORRECTED
{AD, AC, BE}
{AD, CE, BE}
UNCORRECTED
{AD, CE, BE}
{AB, CE, DE}
UNCORRECTED
{AB, CE, DE}
{AB, AC, DE}
UNCORRECTED
{AB, AC, DE}
Calculate the value of all cuts.
UNCORRECTED
Calculate the value of all cuts.
PAGE b
PAGE b Value of cut 1
PAGE Value of cut 1
PROOFS
PROOFS
PROOFS
PROOFSCut 2
PROOFSCut 2
Cut 3PROOFS
Cut 3
7PROOFS
7
4
PROOFS4
3
PROOFS3
PROOFS
PROOFS
PROOFS
PROOFS
PROOFS
PROOFS
PROOFS
PROOFS
PROOFS
PROOFS
PROOFSC
PROOFSC
PROOFS
PROOFSB
PROOFSB
PROOFS
PROOFS
PROOFS
PROOFS
PROOFS
PROOFS
PROOFS
PROOFS
PROOFS

As can be seen in Worked example 13, ensuring that all cuts have been made is a complicated procedure. The diagram becomes cluttered.
There are two cuts missing from the diagram. Can you � nd them?
Performing cuts at the source and sink � rst enables an upper limit for the value of the minimum cut to be set. In part b, it was clear that the value of the minimum cut in the diagram must be less than or equal to 12. In this case it was 12.
In some networks it is possible to produce a cut in which an edge actually heads back inside the cut rather than being directed out of the cut, as is required and as all edges in Worked example 13 do. If an edge does this, then its � ow value is ignored in the calculation of the cut value. The inside of a cut is the side on which the source node lies. Sometimes the inside of a cut is shaded.
The shaded section represents theinside of cut 1.
A B
D
E
C9 2
7
86 4
5 3
Cut 2
Cut 1
Source
Determine the values of the cuts made on the network diagram.
A B
D
E
C9 2
7
86 4
5 3
Cut 2
Cut 1
THINK WRITE
1 Determine the overall direction of the � ow. The � ow is from A to C, so the inside of the cut is on the left-hand side where the source node, A, is.
2 Determine the edges that are crossed by the cuts and identify any which head back into the cut.
Cut 1 = {AE, AB, BD, DC}BD heads back inside the cut, so ignore its � ow value.Cut 2 = {AD, BD, BC, BE, AE}BE heads back inside the cut, so ignore its � ow value. Note that for this cut, BD heads outside the cut.
3 Calculate the cut values. Cut 1 = 6 + 9 + 3= 18
Cut 2 = 5 + 7 + 2 + 6= 20
WORKED EXAMPLE 141414
3 Select the minimum value as the maximum � ow.
The value of the minimum cut is 12, therefore the maximum � ow through the network has a value of 12.
512 MATHS QUEST 12 FURTHER MATHEMATICS VCE Units 3 and 4
c10DirectedGraphsAndNetworks.indd 512 12/09/15 4:16 AM
UNCORRECTED
UNCORRECTED
UNCORRECTED
UNCORRECTED
UNCORRECTED
UNCORRECTED
UNCORRECTED
UNCORRECTED
UNCORRECTED
UNCORRECTED
UNCORRECTED
UNCORRECTED
UNCORRECTED
UNCORRECTED
UNCORRECTED
UNCORRECTED
UNCORRECTED
UNCORRECTED A
UNCORRECTED A
UNCORRECTED
UNCORRECTED D
UNCORRECTED D
9
UNCORRECTED 9
7
UNCORRECTED 7
5 3
UNCORRECTED 5 35 3
UNCORRECTED 5 35 3
UNCORRECTED 5 35 3
UNCORRECTED 5 35 3
UNCORRECTED 5 35 3
UNCORRECTED 5 35 3
UNCORRECTED 5 35 3
UNCORRECTED 5 35 3
UNCORRECTED 5 35 3
UNCORRECTED 5 35 3
UNCORRECTED 5 3
Cut 1
UNCORRECTED Cut 1
UNCORRECTED
UNCORRECTED
UNCORRECTED
UNCORRECTED
UNCORRECTED
UNCORRECTED
UNCORRECTED
UNCORRECTED
Determine the overall direction of the � ow.
UNCORRECTED
Determine the overall direction of the � ow.
Determine the edges that are crossed by
UNCORRECTED
Determine the edges that are crossed by the cuts and identify any which head back UNCORRECTED
the cuts and identify any which head back UNCORRECTED
into the cut.UNCORRECTED
into the cut.
PAGE in Worked example 13 do. If an edge does this, then its � ow value is ignored in the
PAGE in Worked example 13 do. If an edge does this, then its � ow value is ignored in the calculation of the cut value. The inside of a cut is the side on which the source node
PAGE calculation of the cut value. The inside of a cut is the side on which the source node lies. Sometimes the inside of a cut is shaded.
PAGE lies. Sometimes the inside of a cut is shaded.
PAGE Determine the values of the cuts made on the network diagram.PAGE Determine the values of the cuts made on the network diagram.
Cut 1 PAGE
Cut 1 PAGE PROOFS
In some networks it is possible to produce a cut in which an edge actually heads back
PROOFS
In some networks it is possible to produce a cut in which an edge actually heads back the cut rather than being directed out of the cut, as is required and as all edges PROOFS
the cut rather than being directed out of the cut, as is required and as all edges in Worked example 13 do. If an edge does this, then its � ow value is ignored in the PROOFS
in Worked example 13 do. If an edge does this, then its � ow value is ignored in the
The shaded section represents the
PROOFSThe shaded section represents the
inside of cut 1.
PROOFSinside of cut 1.
PROOFS
PROOFS
PROOFS
PROOFS
PROOFS
PROOFS
PROOFS
PROOFSE
PROOFSE
2
PROOFS2
4
PROOFS4Cut 2
PROOFSCut 2
PROOFS
PROOFS
PROOFS

Network flowConvert the �ow tables for questions 1 and 2 into network diagrams, clearly indicating the direction and quantity of the �ow.
1 WE10 2
3 WE11 From the network in question 1, determinea the �ow capacityb whether the �ow rate through the network is suf�cient to meet the demand.
4 From the network in question 2, determinea the �ow capacityb whether the �ow rate through the network is suf�cient to meet the demand.
For questions 5 and 6 a introduce new edges, as shown, to the network diagrams produced in
questions 1 and 2b calculate the new network �ow capacities.
5 WE12 6
7 WE13 Consider the network �ow diagram shown, representing the �ow of water between a reservoir (A) and a town (H). The other nodes (B, …, G) represent pumping stations.
Using the minimum cut method, determine the maximum �ow through the network.
EXERCISE 10.4
PRACTISE
From To Flow capacityR S 250S T 200T U 100T V 100U V 50
From To Flow capacityE F 8E G 8G H 5G J 3F H 2F J 6J K 8H K 8
From To Flow capacityR S 250S T 200T U 100T V 100U V 50S T 100
From To Flow capacityE F 8E G 8G H 5G J 3F H 2F J 6J K 8H K 8E K 10
A B G H
C
D
E
F
130 130
60
70
30
50
40
50
70
Topic 10 DIRECTED GRAPHS AND NETWORKS 513
c10DirectedGraphsAndNetworks.indd 513 12/09/15 4:16 AM
UNCORRECTED calculate the new network �ow capacities.
UNCORRECTED calculate the new network �ow capacities.
UNCORRECTED
UNCORRECTED
UNCORRECTED
UNCORRECTED
UNCORRECTED
UNCORRECTED
UNCORRECTED
UNCORRECTED
UNCORRECTED
UNCORRECTED
UNCORRECTED Flow capacity
UNCORRECTED Flow capacityR S 250
UNCORRECTED R S 250R S 250
UNCORRECTED R S 250S T 200
UNCORRECTED S T 200S T 200
UNCORRECTED S T 200S T 200
UNCORRECTED S T 200
UNCORRECTED
UNCORRECTED
UNCORRECTED
UNCORRECTED
UNCORRECTED
UNCORRECTED T U 100
UNCORRECTED T U 100T U 100
UNCORRECTED T U 100T V 100
UNCORRECTED T V 100T V 100
UNCORRECTED T V 100U V
UNCORRECTED
U VU V
UNCORRECTED
U VS T 100
UNCORRECTED
S T 100
PAGE , determine
PAGE , determine
whether the �ow rate through the network is suf�cient to meet the demand.
PAGE whether the �ow rate through the network is suf�cient to meet the demand.
introduce new edges, as shown, to the network diagrams produced in
PAGE introduce new edges, as shown, to the network diagrams produced in
calculate the new network �ow capacities.PAGE
calculate the new network �ow capacities.
PROOFS
whether the �ow rate through the network is suf�cient to meet the demand.
PROOFS
whether the �ow rate through the network is suf�cient to meet the demand.
PROOFS
PROOFS2
PROOFS26
PROOFS68
PROOFS8H K
PROOFSH K

8 a Which of the four cuts shown in the network at right are invalid?
b Determine the value of each cut.c What is the minimum cut and hence the
maximum �ow?For the networks in questions 9 and 10:
a draw in the line of minimum cutb state the maximum �ow.
9 WE14
10
11 Convert the following �ow tables into network diagrams, clearly indicating the direction and quantity of the �ow.a b
12 For node B in the network, state:
a the in�ow at Bb the edge capacities �owing out of Bc the out�ow from B.
13 Repeat question 12 for the network shown below.
14 For each of the networks in question 11, determine:
i the �ow capacityii whether the �ow through the network is suf�cient to meet the demand.
A D
B
C
E7 12
5
49 4
12 8
Cut 2
Cut 3
Cut 4
Cut 1
M N P
Q
O
R
35
20
55
40
1110
25 3525
M N P
Q
O
R
120
95
100
6060
145110
25 2545
CONSOLIDATE
From To Flow capacity
A B 100
A C 200
B C 50
C D 250
D E 300
From To Flow capacity
M N 20
M Q 20
N O 15
N R 5
Q R 10
O P 12
R P 12
A
B
C
D
27 34
23 16
4
3
3
62
245A C
B
D
E
514 MATHS QUEST 12 FURTHER MATHEMATICS VCE Units 3 and 4
c10DirectedGraphsAndNetworks.indd 514 12/09/15 4:16 AM
UNCORRECTED
UNCORRECTED A B 100
UNCORRECTED A B 100
A C 200
UNCORRECTED A C 200
50
UNCORRECTED 50
UNCORRECTED
UNCORRECTED
UNCORRECTED
UNCORRECTED
UNCORRECTED
For node B in the network, state:
UNCORRECTED
For node B in the network, state:
a
UNCORRECTED
a the in�ow at B
UNCORRECTED
the in�ow at Bb
UNCORRECTED
b the edge capacities �owing out of B
UNCORRECTED
the edge capacities �owing out of Bc
UNCORRECTED
c the out�ow from B.
UNCORRECTED
the out�ow from B.
UNCORRECTED C D 250
UNCORRECTED C D 250C D 250
UNCORRECTED C D 250
D E 300
UNCORRECTED D E 300D E 300
UNCORRECTED D E 300
PAGE Convert the following �ow tables into network diagrams, clearly indicating the
PAGE Convert the following �ow tables into network diagrams, clearly indicating the
b
PAGE b
PAGE Flow capacity
PAGE Flow capacity
PROOFS

15 Convert the following �ow diagrams to tables as in question 11.a b
c d
16 Calculate the capacity of each of the networks in question 15.
17 i Introduce new edges, as shown, to each of the network diagrams produced in question 11.
ii Calculate the new network �ow capacities.a b
18 In question 17b the out�ow from N is:
A 5 B 20 C 15 D 25 E 18
19 a Which, if any, of the �ve cuts in the network diagram are invalid?
b Determine the value of each cut.c What is the minimum cut and hence
the maximum �ow?
20 For each of the following networks:
i draw in the line of minimum cutii state the maximum �ow.
a b
4
3
3
62
245A C
B
D
E
4
3
3
62
245A C
B
D
E
4
3
7 8
3
62
5A
C
B
D
E
4
4
12
7
7
8
3
625A
C
F
B
D
E
From To Flow capacity
AABCDB
BCCDEE
100200 50250300100
From To Flow capacity
MMNNQORN
NQORRPPP
202015 5101212 5
A C
B F
ED
G9
1057
8 116 6
4
5
13
Cut 2
Cut 4
Cut 3
Cut 5
Cut 1
M N P
Q
O
R
12
13
12
141
1011
1 28
M N P
Q
O
R
12
9
10
87
49
5 46
Topic 10 DIRECTED GRAPHS AND NETWORKS 515
c10DirectedGraphsAndNetworks.indd 515 12/09/15 4:16 AM
UNCORRECTED In question
UNCORRECTED In question 17b
UNCORRECTED 17b the out�ow from N is:
UNCORRECTED the out�ow from N is:
Which, if any, of the �ve cuts in the
UNCORRECTED
Which, if any, of the �ve cuts in the network diagram are invalid?
UNCORRECTED
network diagram are invalid?
b
UNCORRECTED
b Determine the value of each cut.
UNCORRECTED
Determine the value of each cut.c
UNCORRECTED
c What is the minimum cut and hence
UNCORRECTED
What is the minimum cut and hence
UNCORRECTED 100
UNCORRECTED 100
PAGE Calculate the new network �ow capacities.
PAGE Calculate the new network �ow capacities.b
PAGE b
PAGE 200
PAGE 20050
PAGE 50
250PAGE 250300PAGE
300
PROOFSCalculate the capacity of each of the networks in question
PROOFSCalculate the capacity of each of the networks in question 15
PROOFS15.
PROOFS.
Introduce new edges, as shown, to each of the network diagrams produced in
PROOFSIntroduce new edges, as shown, to each of the network diagrams produced in
7
PROOFS7
8
PROOFS8
PROOFS

21 A network diagram of streets and freeways �owing into a city at peak hour is shown. Copy the diagram and clearly label the freeways.
22 Refer to the diagram in question 21 and explain what would happen to the traf�c at:
a node Eb node H.c Add a new edge to the diagram in question 21 so that bottlenecks would not
occur at peak hour.
Assignment problems and bipartite graphsWith network �ow problems, the task was to �nd the maximum �ow through a network. Another possible problem could be to determine the exact �ows through each path in a network, so that as much of the capacity of each edge as possible is used. This is a class of situation called assignment (or allocation) problems. For example, we could be generating electricity at three power plants for distribution to �ve towns, so that each town gets the required amount of electricity, regardless of the plant it came from. To start this technique we need to de�ne the concept of bipartite graphs.
Bipartite graphsIn the previous section on network �ow, the minimum cut method was introduced to help solve the �ow problem. Consider the cut through the network as dividing the network into two parts: ‘�ow in and �ow out’, or ‘supply and demand’. Imagine separating the graph along the cut into its two parts. This graph is known as a bipartite graph.
A bipartite graph is one where the nodes can be separated into two types of node — supply and demand.
Consider a typical network �ow problem with a cut de�ned in the �gure on the left. By separating the graph, as in the �gure on the right, we have divided the graph into two parts. The supply nodes are M and W, while the demand nodes are F, D and E.
Cut
M W
F
D
E200 200
300 300
200 200
M W
F
D
E200 200
300 300
200 200
MASTER
H
I
J
3060
50
A
B
C
D20
75150 10080
75
45 45
E
F
G
4550
K
60
50
10.5
Unit 4
AOS M2
Topic 2
Concept 4
Bipartite graphsConcept summary Practice questions
516 MATHS QUEST 12 FURTHER MATHEMATICS VCE Units 3 and 4
c10DirectedGraphsAndNetworks.indd 516 12/09/15 4:16 AM
UNCORRECTED In the previous section on network �ow, the minimum cut method was introduced
UNCORRECTED In the previous section on network �ow, the minimum cut method was introduced to help solve the �ow problem. Consider the cut through the network as dividing
UNCORRECTED to help solve the �ow problem. Consider the cut through the network as dividing the network into two parts: ‘�ow in and �ow out’, or ‘supply and demand’. Imagine
UNCORRECTED the network into two parts: ‘�ow in and �ow out’, or ‘supply and demand’. Imagine separating the graph along the cut into its two parts. This graph is known as a
UNCORRECTED
separating the graph along the cut into its two parts. This graph is known as a bipartite graph.
UNCORRECTED
bipartite graph.
UNCORRECTED
UNCORRECTED
UNCORRECTED
A bipartite graph is one where the nodes can be separated
UNCORRECTED
A bipartite graph is one where the nodes can be separated into two types of node — supply and demand.
UNCORRECTED
into two types of node — supply and demand.
Consider a typical network �ow problem with a cut de�ned in the �gure on the
UNCORRECTED
Consider a typical network �ow problem with a cut de�ned in the �gure on the left. By separating the graph, as in the �gure on the right, we have divided the
UNCORRECTED
left. By separating the graph, as in the �gure on the right, we have divided the graph into two parts. The supply nodes are M and W, while the demand nodes
UNCORRECTED
graph into two parts. The supply nodes are M and W, while the demand nodes
PAGE network. Another possible problem could be to determine the
PAGE network. Another possible problem could be to determine the each path in a network, so that as much of the capacity of each edge as possible
PAGE each path in a network, so that as much of the capacity of each edge as possible is used. This is a class of situation called assignment (or allocation) problems. For
PAGE is used. This is a class of situation called assignment (or allocation) problems. For example, we could be generating electricity at three power plants for distribution
PAGE example, we could be generating electricity at three power plants for distribution to �ve towns, so that each town gets the required amount of electricity, regardless
PAGE to �ve towns, so that each town gets the required amount of electricity, regardless of the plant it came from. To start this technique we need to de�ne the concept of PAGE of the plant it came from. To start this technique we need to de�ne the concept of
PROOFS so that bottlenecks would not
PROOFS so that bottlenecks would not
Assignment problems and bipartite graphs
PROOFSAssignment problems and bipartite graphsWith network �ow problems, the task was to �nd the maximum �ow through a PROOFS
With network �ow problems, the task was to �nd the maximum �ow through a network. Another possible problem could be to determine the PROOFS
network. Another possible problem could be to determine the

Representing information as bipartite graphsIn many practical situations not only � ows, but goods, money and even people can be represented by bipartite graphs.
The next section concerns the problem of allocating the ‘� ow’ of shoes between the suppliers and the distributors.
Sometimes the supply and demand nodes have quite distinct types. For example, the supply nodes might be students, while the demand nodes could be the subjects that they study, or even the sports they play. The key to bipartite graphs is that there is a separation between the two sides and that there is some sort of � ow from supply to demand. The separation does not always have to be literal, as in the next example.
The Shiny Shoe Company make shoes at two factories, one at Alphaville producing 200 pairs per day, the other at Beta City producing 300 pairs per day. It ships them to three distributors: Fartown, who want 50 pairs per day, Giver River, who want 250 pairs per day and Hamlet, who want 200 pairs per day. Represent this information as a bipartite graph.
THINK WRITE/DRAW
1 Determine all the supply nodes, starting with a single ‘supply’ node.
Supply nodes are S, A and B.
2 Represent the supply side of the graph.
S
A
B
300
200
3 Determine all the demand nodes, ending with a single ‘demand’ node.
Demand nodes are F, G, H and D.
4 Add the demand side of the graph.
S
A
B
300
200
DF
H
G
250
200
50
WORKED EXAMPLE 151515
Topic 10 DIRECTED GRAPHS AND NETWORKS 517
c10DirectedGraphsAndNetworks.indd 517 12/09/15 4:16 AM
UNCORRECTED
UNCORRECTED
UNCORRECTED
UNCORRECTED Determine all the demand nodes, ending
UNCORRECTED Determine all the demand nodes, ending with a single ‘demand’ node.
UNCORRECTED with a single ‘demand’ node.
Add the demand side of the graph.
UNCORRECTED
Add the demand side of the graph.
PAGE Supply nodes are S, A and B.
PAGE Supply nodes are S, A and B.
PAGE
PAGE
PAGE
PAGE SPAGE SPAGE
PAGE A
PAGE A
200
PAGE 200
PAGE
PAGE PROOFS
PROOFS
PROOFS
Supply nodes are S, A and B.PROOFS
Supply nodes are S, A and B.PROOFS

The following table lists four students and the four subjects offered in the Science program in Year 12.
a Represent this information as a bipartite graph.
b Determine whether the following statements are true or false.
i Alice studies more Science subjects than Carla does.
ii Between Carla and Betty, all Science subjects are studied.
iii Between Alice and Betty, more subjects are studied than by Carla.
THINK WRITE/DRAW
a 1 Determine the supply nodes and represent the supply side of the graph. In this case they are (arbitrarily) assigned to the students.
a Supply nodes are Alice, Betty, Carla and Diane.
2 Determine the demand nodes. Represent the demand side and show the connections as arrows joining supply nodes to demand nodes.
Note there is no quantity of � ow between supply and demand.
Demand nodes are Biology, Chemistry, Physics and Psychology.
b i 1 Determine the number of subjects studied by Alice and Carla.
b i Alice studies two subjects (Biology and Chemistry).
Carla studies three subjects (Biology, Chemistry, Psychology).
2 Determine the truth of the statement. Clearly, the statement is false.
ii 1 Determine the number of subjects studied by Betty and Carla.
ii Betty studies Chemistry and Physics. Carla studies Biology, Chemistry and Psychology.
2 Determine the truth of the statement. Clearly, the statement is true.
iii 1 Determine the subjects studied between Alice and Betty, and Carla.
iii Alice and Betty between them study three subjects (Biology, Chemistry and Physics).
Carla studies three subjects (Biology, Chemistry, Psychology).
2 Determine the truth of the statement. Clearly the statement is false (as both groups study three subjects).
Student Subjects taken
Alice Biology, Chemistry
Betty Chemistry, Physics
Carla Biology, Chemistry, Psychology
Diane Psychology
(Supply)
Alice •
Betty •
Carla •
Diane •
(Supply) (Demand)
Alice Biology
Diane
Carla
Betty
Psychology
Physics
Chemistry
WORKED EXAMPLE 161616
518 MATHS QUEST 12 FURTHER MATHEMATICS VCE Units 3 and 4
c10DirectedGraphsAndNetworks.indd 518 12/09/15 4:16 AM
UNCORRECTED
UNCORRECTED Note there is no quantity of � ow between supply
UNCORRECTED Note there is no quantity of � ow between supply
Determine the number of subjects studied
UNCORRECTED Determine the number of subjects studied
Determine the truth of the statement.
UNCORRECTED
Determine the truth of the statement.
Determine the number of subjects studied
UNCORRECTED
Determine the number of subjects studied by Betty and Carla.
UNCORRECTED
by Betty and Carla.
Determine the truth of the statement.
UNCORRECTED
Determine the truth of the statement.
Determine the subjects studied between UNCORRECTED
Determine the subjects studied between Alice and Betty, and Carla.UNCORRECTED
Alice and Betty, and Carla.
PAGE Demand
PAGE Demand nodes are
PAGE nodes are Biology, PAGE Biology, Chemistry, PAGE
Chemistry,
PROOFS
PROOFS
PROOFS
PROOFSSupply nodes are Alice,
PROOFSSupply nodes are Alice, Betty, Carla and Diane.
PROOFSBetty, Carla and Diane.
PROOFS
PROOFSBiology, Chemistry,
PROOFSBiology, Chemistry,
Diane Psychology
PROOFSDiane Psychology
(Supply)
PROOFS(Supply)

Note that in part b iii, the fact that Alice and Betty both studied Chemistry does not mean that two (distinct) subjects were studied.
The allocation problemConsider a situation where there are a number of jobs to be done and the same number of people to do them. However, each person can do each job in a different amount of time (or at a different cost). How can the jobs be allocated: one per person, so that time (or cost) is minimised? This is known as optimal allocation. Sometimes the optimal allocation may be obvious, but in most cases it is not, and may even require some trial and error work.
In the general case the jobs and people can be put in an allocation matrix as in the following worked example.
So, Alan would take 10 hours to do job X, 4 hours to do job Y and 9 hours to do job Z. Similarly, Bob would take 8 hours to do job X, … and so on.
The � rst step is to perform row reduction by subtracting the smallest value in each row from all the numbers in that row. This may produce the optimal allocation in one step.
This is the simplest possible case: the optimal allocation is almost obvious. Remember to calculate the total time (or cost) and ensure it is indeed the minimum.
Job X Job Y Job Z
Alan 10 4 9
Bob 8 11 10
Carl 9 8 7
A building site has three more jobs to be done by the three remaining workers, Alan, Bob and Carl. The times taken by each to do the three jobs are given in the following table. Determine the optimal allocation and hence state the minimum time.
THINK WRITE/DRAW
1 Generate or write the matrix of people against job times.
X Y Z
A 10 4 9
B 8 11 10
C 9 8 7
2 Step 1a. Perform row reduction. Find the smallest value in each row, and subtract it from all numbers in that row.
The smallest number in row A is 4.The smallest number in row B is 8.The smallest number in row C is 7.
3 Subtract 4 from each number in row A.
Subtract 8 from each number in row B.
Subtract 7 from each number in row C.
X Y Z
A 6 0 5
B 0 3 2
C 2 1 0
Job X Job Y Job Z
Alan 10 4 9
Bob 8 11 10
Carl 9 8 7
WORKED EXAMPLE 171717
Unit 4
AOS M2
Topic 2
Concept 5
Optimal allocationConcept summary Practice questions
Topic 10 DIRECTED GRAPHS AND NETWORKS 519
c10DirectedGraphsAndNetworks.indd 519 12/09/15 4:16 AM
UNCORRECTED This is the simplest possible case: the optimal allocation is almost obvious.
UNCORRECTED This is the simplest possible case: the optimal allocation is almost obvious. Remember to calculate the total time (or cost) and ensure it is indeed the minimum.
UNCORRECTED Remember to calculate the total time (or cost) and ensure it is indeed the minimum.
UNCORRECTED A building site has three more jobs to be
UNCORRECTED A building site has three more jobs to be done by the three remaining workers, Alan,
UNCORRECTED done by the three remaining workers, Alan, Bob and Carl. The times taken by each to do
UNCORRECTED Bob and Carl. The times taken by each to do the three jobs are given in the following
UNCORRECTED
the three jobs are given in the following table. Determine the optimal allocation
UNCORRECTED
table. Determine the optimal allocation and hence state the minimum time.
UNCORRECTED
and hence state the minimum time.
UNCORRECTED
UNCORRECTED
Generate or write the matrix of people
UNCORRECTED
Generate or write the matrix of people against job times.
UNCORRECTED
against job times.
UNCORRECTED PAGE So, Alan would take 10 hours to do job X, 4 hours to do job Y and 9 hours to do
PAGE So, Alan would take 10 hours to do job X, 4 hours to do job Y and 9 hours to do job Z. Similarly, Bob would take 8 hours to do job X, … and so on.
PAGE job Z. Similarly, Bob would take 8 hours to do job X, … and so on.
The � rst step is to perform row reduction by subtracting the smallest value in each
PAGE The � rst step is to perform row reduction by subtracting the smallest value in each row from all the numbers in that row. This may produce the optimal allocation
PAGE row from all the numbers in that row. This may produce the optimal allocation
This is the simplest possible case: the optimal allocation is almost obvious. PAGE
This is the simplest possible case: the optimal allocation is almost obvious.
PROOFSIn the general case the jobs and people can be put in an allocation matrix as in the
PROOFSIn the general case the jobs and people can be put in an allocation matrix as in the
So, Alan would take 10 hours to do job X, 4 hours to do job Y and 9 hours to do PROOFS
So, Alan would take 10 hours to do job X, 4 hours to do job Y and 9 hours to do PROOFS
PROOFSBob 8 11 10
PROOFSBob 8 11 10
Carl 9 8 7PROOFS
Carl 9 8 7Carl 9 8 7PROOFS
Carl 9 8 7

The Hungarian algorithmUnfortunately, there are two cases where the basic algorithm will not produce the optimal allocation:
1. when there are not enough zeros to draw the right number of straight lines in step 1b2. when there are too many zeros so that one person may be allocated more than
one job in step 2a.In either case, we need to use the Hungarian algorithm which involves the following steps, replacing step 2 of the previous example.
Step 2. Perform column reduction (when there are not enough zeros). This is similar to row reduction and is performed when step 1 has not produced an optimal allocation. This may produce an optimal allocation using the method of steps 1b and 1c. If not, proceed to step 3.
Step 3. Modify the original matrix according to the Hungarian algorithm. This involves an addition and subtraction operation involving various quantities in the matrix from step 2 and will be detailed in the worked example below. This should produce an optimal allocation.
Step 4. Produce a bipartite graph and list all possible allocations.
Unit 4
AOS M2
Topic 2
Concept 6
Hungarian algorithmConcept summary Practice questions
InteractivityThe allocation problem and the Hungarian algorithmint-6289
4 Step 1b. Attempt an allocation.
Cover all the zeroes with the smallest number of straight (horizontal/vertical, but not diagonal) lines. If the number of lines equals the number of jobs to be allocated, go to step 2.
If not, further steps to be taken will be shown in another worked example.
X Y Z
A 6 0 5
B 0 3 2
C 2 1 0
In this case there are three lines and three jobs.
5 Step 2a. Produce a bipartite graph.
Show all possible allocations, where there are zeroes connecting people to jobs.
A
B
C
X
Y
Z
6 Step 2b. List the possible allocations and determine the smallest total.
There is only 1 possible allocation:A → Y, B → X, C → ZTotal time = 4 + 8 + 7
= 19 hoursHence, the minimum time is 19 hours.
Amy, Beth, Cate and Dana offer quotes on how much each of them will charge to complete four different jobs, P, Q, R and S. The table summarises these charges (in dollars). Use the Hungarian algorithm to minimise the total cost to complete the four jobs, one job per person.
P Q R S
Amy 17 24 42 21
Beth 25 18 19 20
Cate 29 14 31 22
Dana 11 20 17 14
WORKED EXAMPLE
520 MATHS QUEST 12 FURTHER MATHEMATICS VCE Units 3 and 4
c10DirectedGraphsAndNetworks.indd 520 12/09/15 4:16 AM
UNCORRECTED when there are not enough zeros to draw the right number of straight lines in step 1b
UNCORRECTED when there are not enough zeros to draw the right number of straight lines in step 1bwhen there are too many zeros so that one person may be allocated more than
UNCORRECTED when there are too many zeros so that one person may be allocated more than
In either case, we need to use the
UNCORRECTED In either case, we need to use the Hungarian algorithm
UNCORRECTED Hungarian algorithm
following steps, replacing step 2 of the previous example.
UNCORRECTED following steps, replacing step 2 of the previous example.
Perform column reduction (when there are not enough zeros). This is
UNCORRECTED Perform column reduction (when there are not enough zeros). This is similar to row reduction and is performed when step 1 has not produced
UNCORRECTED
similar to row reduction and is performed when step 1 has not produced an optimal allocation. This may produce an optimal allocation using the
UNCORRECTED
an optimal allocation. This may produce an optimal allocation using the method of steps 1b and 1c. If not, proceed to step 3.
UNCORRECTED
method of steps 1b and 1c. If not, proceed to step 3.
Step 3.
UNCORRECTED
Step 3. Modify the original matrix according to the Hungarian algorithm. This
UNCORRECTED
Modify the original matrix according to the Hungarian algorithm. This involves an addition and subtraction operation involving various quantities
UNCORRECTED
involves an addition and subtraction operation involving various quantities in the matrix from step 2 and will be detailed in the worked example below.
UNCORRECTED
in the matrix from step 2 and will be detailed in the worked example below. This should produce an optimal allocation.
UNCORRECTED
This should produce an optimal allocation.
Step 4.
UNCORRECTED
Step 4.
UNCORRECTED
UNCORRECTED
WORKED UNCORRECTED
WORKEDEXAMPLEUNCORRECTED
EXAMPLEUNCORRECTED
UNCORRECTED
UNCORRECTED PAGE
Unfortunately, there are two cases where the basic algorithm will not produce the
PAGE Unfortunately, there are two cases where the basic algorithm will not produce the
when there are not enough zeros to draw the right number of straight lines in step 1bPAGE when there are not enough zeros to draw the right number of straight lines in step 1bwhen there are too many zeros so that one person may be allocated more than PAGE
when there are too many zeros so that one person may be allocated more than PAGE
PAGE Hence, the minimum time is 19 hours.
PAGE Hence, the minimum time is 19 hours.PROOFSThere is only 1 possible allocation:
PROOFSThere is only 1 possible allocation:
→
PROOFS→ Z
PROOFSZ
8
PROOFS
8 +
PROOFS
+ 7
PROOFS
7 19 hoursPROOFS
19 hoursHence, the minimum time is 19 hours.PROOFS
Hence, the minimum time is 19 hours.

THINK WRITE/DRAW
1 Step 1a. Perform row reduction. Row A: Subtract 17 Row B: Subtract 18 Row C: Subtract 14 Row D: Subtract 11
P Q R S
A 0 7 25 4
B 7 0 1 2
C 15 0 17 8
D 0 9 6 3
2 Step 1b. Attempt an allocation. Draw the minimum number of straight lines to cover all the zeros.
P Q R S
A 0 7 25 4
B 7 0 1 2
C 15 0 17 8
D 0 9 6 3
3 Step 2a. Perform column reduction. Column P: Subtract 0 (do nothing) Column Q: Subtract 0 (do nothing) Column R: Subtract 1 Column S: Subtract 2
P Q R S
A 0 7 24 2
B 7 0 0 0
C 15 0 16 6
D 0 9 5 1
4 Step 2b. Attempt an allocation. Draw the minimum number of straight lines to cross out all the zeros.
P Q R S
A 0 7 24 2
B 7 0 0 0
C 15 0 16 6
D 0 9 5 1
5 Step 3. Perform the Hungarian algorithm.Step 3a. Find the smallest uncovered number
from step 2b.Step 3b. Add this number to all covered
numbers in the matrix from step 2b. At the intersections of straight lines, add this number twice (circled at right).
The smallest uncovered number = 1.
P Q R S
A 1 8 24 2
B 9 2 1 1
C 16 1 16 6
D 1 10 5 1
6 Step 3c. Subtract the overall smallest number from all the numbers in the matrix.
P Q R S
A 0 7 23 1
B 8 1 0 0
C 15 0 15 5
D 0 9 4 0
Step 3d. Attempt an allocation. Repeat step 3 until a possible allocation is found.
P Q R S
A 0 7 23 1
B 8 1 0 0
C 15 0 15 5
D 0 9 4 0
Only 2 lines — cannot continue allocation.
Only 3 lines are required — cannot continue allocation.
The smallest overall number = 1.
In this case there are 4 lines and 4 jobs, so go to step 4.
Topic 10 DIRECTED GRAPHS AND NETWORKS 521
c10DirectedGraphsAndNetworks.indd 521 12/09/15 4:16 AM
UNCORRECTED Step 3. Perform the Hungarian algorithm.
UNCORRECTED Step 3. Perform the Hungarian algorithm.
the smallest uncovered number
UNCORRECTED
the smallest uncovered number from step 2b.
UNCORRECTED
from step 2b.this number to all covered
UNCORRECTED
this number to all covered numbers in the matrix from step 2b.
UNCORRECTED
numbers in the matrix from step 2b. At the intersections of straight
UNCORRECTED
At the intersections of straight lines, add this number twice
UNCORRECTED
lines, add this number twice (circled at right).
UNCORRECTED
(circled at right).
Step 3c.
UNCORRECTED
Step 3c. Subtract
UNCORRECTED
Subtract from all the numbers in the matrix.
UNCORRECTED
from all the numbers in the matrix.
PAGE
PAGE 7 0 0
PAGE 7 0 0
15 0 16
PAGE 15 0 16 6
PAGE 60 9 5 1
PAGE 0 9 5 1
P Q R S
PAGE P Q R S
APAGE A 0 7 24PAGE
0 7 24
BPAGE
BPAGE
PAGE
PAGE
PAGE
PAGE
PAGE
PAGE
PAGE PROOFS
2 PROOFS
2
0 PROOFS
0
Only 2 lines — cannot
PROOFSOnly 2 lines — cannot continue allocation.
PROOFScontinue allocation.

Step 4a. Produce a bipartite graph. Show all possible allocations, where there are zeros connecting people to jobs.
A
B
C
D
P
Q
R
S
7 Step 4b. List possible allocations and determine the smallest total.
• By inspection, Cate must be allocated Q (she’s the only one at Q).
• Beth must be allocated R (she’s the only one at R).
• Therefore Dana must be allocated S (she’s the only one left at S).
• Therefore Amy must be allocated P.
Amy → P, Beth → R, Cate → Q, Dana → SMinimum cost = 17 + 19 + 14 + 14
= $64(numbers from the original matrix in the question)
Sometimes the optimal allocation is carried out to maximise a quantity such as score. In this process, all elements in the matrix are subtracted from the largest one �rst, and in doing so, modifying the situation to a minimisation problem. From then on, the procedure is exactly the same as that set out in Worked example 18.
Assignment problems and bipartite graphs1 WE15 An electricity company produces 4000 kWh, 5000 kWh and 6000 kWh at its
three hydroelectric plants. This electricity is supplied to four towns as follows:20% to Town A, 25% to Town B, 15% to Town C and the rest to Town D. Represent this information with a bipartite graph.
2 An oil company supplies petrol to three towns, A, B and C. Within town A there are two sub-depots where petrol is stored temporarily before being delivered to service stations. The other two towns have only a single depot. Town A gets 30 000 and 40 000 litres per week for each of its sub-depots, while town B gets 10 000 litres and town C gets 25 000 litres for its depots. However, the demand for petrol is as follows; town A: 60 000, town B: 15 000 and town C: 30 000 litres.
a Represent this information in a bipartite graph.b Suggest a delivery system so that all towns get the required amount of
petrol each week.
3 WE16 Five diners (Albert, Brian, Chris, David and Earl) go to the pub for dinner and place the orders as shown in the table. Represent this information as a bipartite graph.
EXERCISE 10.5
PRACTISE
Diner Dishes
Albert Soup, �sh
Brian Fish
Chris Soup, beef, desert
David Beef, dessert
Earl Fish, dessert
522 MATHS QUEST 12 FURTHER MATHEMATICS VCE Units 3 and 4
c10DirectedGraphsAndNetworks.indd 522 12/09/15 4:16 AM
UNCORRECTED Assignment problems and bipartite graphs
UNCORRECTED Assignment problems and bipartite graphs An electricity company produces 4000 kWh, 5000 kWh and 6000 kWh at its
UNCORRECTED An electricity company produces 4000 kWh, 5000 kWh and 6000 kWh at its
three hydroelectric plants. This electricity is supplied to four towns as follows:
UNCORRECTED three hydroelectric plants. This electricity is supplied to four towns as follows:20% to Town A, 25% to Town B, 15% to Town C and the rest to Town D.
UNCORRECTED 20% to Town A, 25% to Town B, 15% to Town C and the rest to Town D. Represent this information with a bipartite graph.
UNCORRECTED
Represent this information with a bipartite graph.
An oil company supplies petrol to three towns, A, B and C. Within town A
UNCORRECTED
An oil company supplies petrol to three towns, A, B and C. Within town A there are two sub-depots where petrol is stored temporarily before being delivered
UNCORRECTED
there are two sub-depots where petrol is stored temporarily before being delivered
UNCORRECTED
to service stations. The other two towns have only a single depot. Town A gets
UNCORRECTED
to service stations. The other two towns have only a single depot. Town A gets 30
UNCORRECTED
30000
UNCORRECTED
000 and 40
UNCORRECTED
and 4010
UNCORRECTED
10000
UNCORRECTED
000 for petrol is as follows; town A: 60
UNCORRECTED
for petrol is as follows; town A: 60
PAGE
PAGE
PAGE Sometimes the optimal allocation is carried out to maximise a quantity such as
PAGE Sometimes the optimal allocation is carried out to maximise a quantity such as score. In this process, all elements in the matrix are subtracted from the largest
PAGE score. In this process, all elements in the matrix are subtracted from the largest one �rst, and in doing so, modifying the situation to a minimisation problem. From
PAGE one �rst, and in doing so, modifying the situation to a minimisation problem. From
PAGE then on, the procedure is exactly the same as that set out in Worked example 18.PAGE then on, the procedure is exactly the same as that set out in Worked example 18.
PROOFS
PROOFS
PROOFS→
PROOFS→ Q
PROOFSQ, Dana
PROOFS, Dana
+
PROOFS+ 14
PROOFS 14 +
PROOFS+ 14
PROOFS 14
(numbers from the original matrix in the
PROOFS
(numbers from the original matrix in the
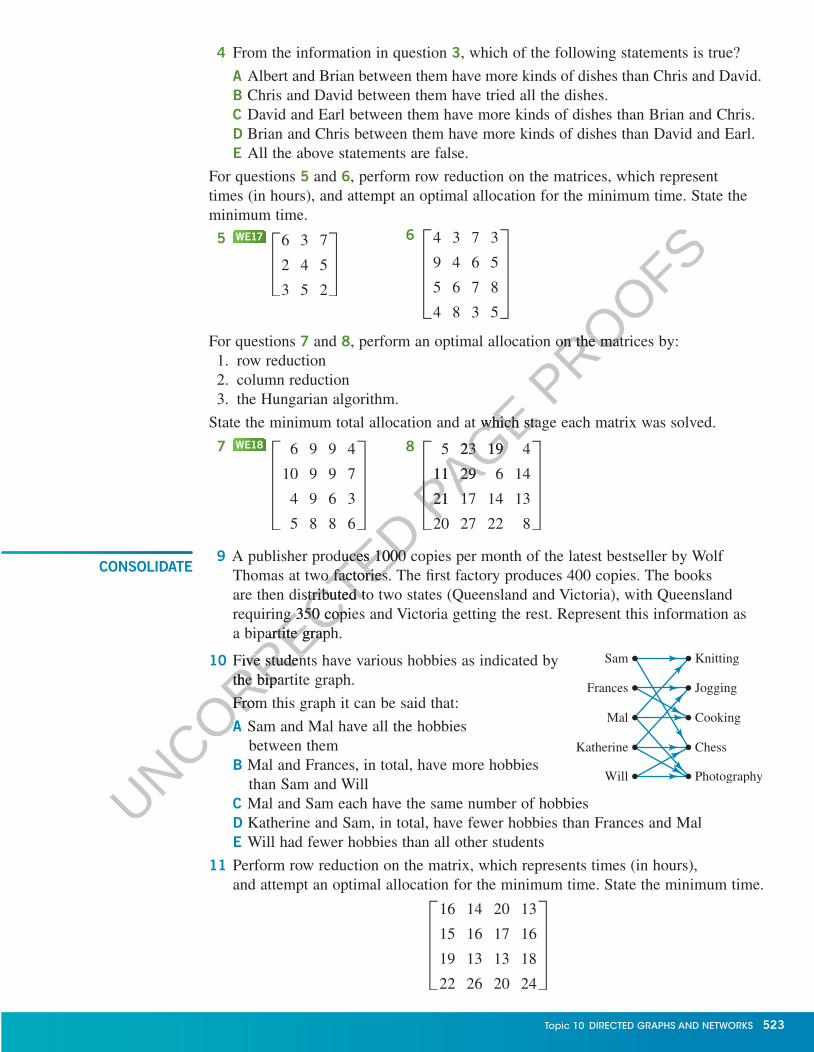
4 From the information in question 3, which of the following statements is true?
A Albert and Brian between them have more kinds of dishes than Chris and David.B Chris and David between them have tried all the dishes.C David and Earl between them have more kinds of dishes than Brian and Chris.D Brian and Chris between them have more kinds of dishes than David and Earl.E All the above statements are false.
For questions 5 and 6, perform row reduction on the matrices, which represent times (in hours), and attempt an optimal allocation for the minimum time. State the minimum time.
5 WE17
C6 3 7
2 4 5
3 5 2
S
6
D
4 3 7 3
9 4 6 5
5 6 7 8
4 8 3 5
T
For questions 7 and 8, perform an optimal allocation on the matrices by:1. row reduction2. column reduction3. the Hungarian algorithm.
State the minimum total allocation and at which stage each matrix was solved.
7 WE18
D
6 9 9 4
10 9 9 7
4 9 6 3
5 8 8 6
T
8
D
5 23 19 4
11 29 6 14
21 17 14 13
20 27 22 8
T
9 A publisher produces 1000 copies per month of the latest bestseller by Wolf Thomas at two factories. The �rst factory produces 400 copies. The books are then distributed to two states (Queensland and Victoria), with Queensland requiring 350 copies and Victoria getting the rest. Represent this information as a bipartite graph.
10 Five students have various hobbies as indicated by the bipartite graph.
From this graph it can be said that:
A Sam and Mal have all the hobbies between them
B Mal and Frances, in total, have more hobbies than Sam and Will
C Mal and Sam each have the same number of hobbiesD Katherine and Sam, in total, have fewer hobbies than Frances and MalE Will had fewer hobbies than all other students
11 Perform row reduction on the matrix, which represents times (in hours), and attempt an optimal allocation for the minimum time. State the minimum time.
D
16 14 20 13
15 16 17 16
19 13 13 18
22 26 20 24
T
CONSOLIDATE
Sam Knitting
Will
Katherine
Mal
Frances
Photography
Chess
Cooking
Jogging
Topic 10 DIRECTED GRAPHS AND NETWORKS 523
c10DirectedGraphsAndNetworks.indd 523 12/09/15 4:16 AM
UNCORRECTED A publisher produces 1000 copies per month of the latest bestseller by Wolf
UNCORRECTED A publisher produces 1000 copies per month of the latest bestseller by Wolf Thomas at two factories. The �rst factory produces 400 copies. The books
UNCORRECTED Thomas at two factories. The �rst factory produces 400 copies. The books are then distributed to two states (Queensland and Victoria), with Queensland
UNCORRECTED are then distributed to two states (Queensland and Victoria), with Queensland requiring 350 copies and Victoria getting the rest. Represent this information as
UNCORRECTED requiring 350 copies and Victoria getting the rest. Represent this information as a bipartite graph.
UNCORRECTED
a bipartite graph.
Five students have various hobbies as indicated by
UNCORRECTED
Five students have various hobbies as indicated bythe bipartite graph.
UNCORRECTED
the bipartite graph.
From this graph it can be said that:
UNCORRECTED
From this graph it can be said that:
A
UNCORRECTED
A
PAGE State the minimum total allocation and at which stage each matrix was solved.
PAGE State the minimum total allocation and at which stage each matrix was solved.
DPAGE D
5 23 19 4
PAGE 5 23 19 4
11 29 6 14
PAGE 11 29 6 14
21 17 14 13PAGE 21 17 14 13
20 27 22 8PAGE
20 27 22 8
PROOFS, perform an optimal allocation on the matrices by:
PROOFS, perform an optimal allocation on the matrices by:

12 Draw the bipartite graph from question 11.
13 A mother wishes to buy presents (a game, a doll and a toy truck) for her three children from three different stores. The game’s cost is ($30, $45, $40) from the three stores, the doll’s cost is ($50, $50, $60) while the truck’s cost is ($35, $30, $30). Show that the optimal allocation yields a total of $110.
14 Given the matrix shown, the total value of the optimal allocation is:
A 9B 11C 15D 16E 19
15 A government department wishes to purchase �ve different cars for its �eet. For reasons of fairness it must not purchase more than one car from any dealer. It receives quotes from the dealers according to the following table (cost in thousands of dollars).
a Perform row and column reduction.b Draw the bipartite graph after reduction.c i Find the optimal allocation.
ii State the minimum cost.
16 Perform an optimal allocation on the following matrices by:
1. row reduction2. column reduction3. the Hungarian algorithm.
State the minimum total allocation and at which stage each matrix was solved.a
D
10 15 12 17
17 21 19 14
16 22 17 19
23 26 29 27
T
b
E
12 10 11 13 11
11 11 13 12 12
12 16 13 16 12
9 10 9 11 9
14 11 11 11 11
U
17 A company wishes to hire four computer programmers (A, B, C and D) to develop four software packages. Because of time constraints each programmer can accept at most one job. The quotes (in weeks) given by the four programmers are shown in the following table.
C7 3 7
3 3 5
6 5 5
S
G
D1 D2 D3 D4 D5
Car 1 20 15 17 16 18
Car 2 17 15 19 17 16
Car 3 18 19 16 19 16
Car 4 19 19 17 21 17
Car 5 24 19 17 17 17
W
524 MATHS QUEST 12 FURTHER MATHEMATICS VCE Units 3 and 4
c10DirectedGraphsAndNetworks.indd 524 12/09/15 4:16 AM
UNCORRECTED Perform an optimal allocation on the following matrices by:
UNCORRECTED Perform an optimal allocation on the following matrices by:
w reduction
UNCORRECTED w reduction
reduction
UNCORRECTED reduction
Hungarian algorithm.
UNCORRECTED
Hungarian algorithm.
State the minimum total allocation and at which stage each matrix was solved.
UNCORRECTED
State the minimum total allocation and at which stage each matrix was solved.
D
UNCORRECTED
D
10 15 12 17
UNCORRECTED
10 15 12 17
17 21 19 14
UNCORRECTED
17 21 19 14
16 22 17 19
UNCORRECTED
16 22 17 19
PAGE It receives quotes from the dealers according to the following table
PAGE It receives quotes from the dealers according to the following table
Draw the bipartite graph after reduction.
PAGE Draw the bipartite graph after reduction.
PAGE G
PAGE G
Car 1 20 15 17 16 18
PAGE Car 1 20 15 17 16 18
PROOFSA government department wishes to purchase �ve different cars for its �eet.
PROOFSA government department wishes to purchase �ve different cars for its �eet. For reasons of fairness it must not purchase more than one car from any dealer. PROOFS
For reasons of fairness it must not purchase more than one car from any dealer. It receives quotes from the dealers according to the following table PROOFS
It receives quotes from the dealers according to the following table

a Perform row (and if necessary, column) reduction.
b Perform the Hungarian algorithm (if necessary).
c Display possible allocations using a bipartite graph.
d Determine:i the optimal allocationii the total time required to complete the four tasks.
18 Four workers (Tina, Ursula, Vicky, Wendy) need to be optimally allocated four tasks (one per worker). The times (in minutes) that each worker takes are shown in the table.
Perform an optimal allocation stating:
a the tasks allocated to each workerb the total time required to complete all tasks.
19 David Lloyd George High School will be competing in a Mathematics competition. There are four categories: Algebra, Calculus, Functions and Geometry and four possible competitors: Ken, Louise, Mark and Nancy — one per category. To determine the best competitor for each category, a test is given and the results (as percentages) for each student recorded.
a Determine the row-reduced matrix.b Determine the column-reduced matrix.c Determine the optimal allocation using a bipartite graph.d Determine the average score for the team.
20 In a Meals-on-Wheels program in a remote region of Victoria, there are four elderly people (P1, P2, P3, P4) who require meals to be delivered. There are four volunteers (V1, V2, V3, V4) who live at varying distances (speci�ed in kilometres) away.
a Determine the optimum allocation.b State the total distance travelled given that each
volunteer delivers exactly one meal.
Job 1 Job 2 Job 3 Job 4
T 100 50 35 55
U 60 45 70 55
V 40 70 50 30
W 70 50 70 70
MASTER
Algebra Calculus Functions Geometry
Ken 60 78 67 37
Louise 45 80 70 90
Mark 60 35 70 86
Nancy 42 66 54 72
P1 P2 P3 P4
V1 13 17 14 23
V2 8 12 17 9
V3 9 17 14 11
V4 21 16 13 14
Job 1 Job 2 Job 3 Job 4
A 30 40 50 60
B 70 30 40 70
C 60 50 60 30
D 20 80 50 70
Topic 10 DIRECTED GRAPHS AND NETWORKS 525
c10DirectedGraphsAndNetworks.indd 525 12/09/15 4:16 AM
UNCORRECTED
UNCORRECTED
UNCORRECTED
UNCORRECTED Algebra Calculus Functions Geometry
UNCORRECTED Algebra Calculus Functions Geometry
60 78 67 37
UNCORRECTED 60 78 67 37
UNCORRECTED
UNCORRECTED
UNCORRECTED
UNCORRECTED
Determine the row-reduced matrix.
UNCORRECTED
Determine the row-reduced matrix.Determine the column-reduced matrix.
UNCORRECTED
Determine the column-reduced matrix.c
UNCORRECTED
c Determine the optimal allocation using a bipartite graph.
UNCORRECTED
Determine the optimal allocation using a bipartite graph.d
UNCORRECTED
d Determine the average score for the team.
UNCORRECTED
Determine the average score for the team.
20
UNCORRECTED
20 In a Meals-on-Wheels program in a remote region
UNCORRECTED
In a Meals-on-Wheels program in a remote region of Victoria, there are four elderly people (P1, P2,
UNCORRECTED
of Victoria, there are four elderly people (P1, P2,
UNCORRECTED
UNCORRECTED Louise 45 80 70 90
UNCORRECTED Louise 45 80 70 90Louise 45 80 70 90
UNCORRECTED Louise 45 80 70 90
Mark 60 35 70 86
UNCORRECTED Mark 60 35 70 86Mark 60 35 70 86
UNCORRECTED Mark 60 35 70 86
Nancy 42 66 54 72
UNCORRECTED Nancy 42 66 54 72
PAGE David Lloyd George High School will be competing in a Mathematics
PAGE David Lloyd George High School will be competing in a Mathematics competition. There are four categories: Algebra, Calculus, Functions and
PAGE competition. There are four categories: Algebra, Calculus, Functions and Geometry and four possible competitors: Ken, Louise, Mark and Nancy — one
PAGE Geometry and four possible competitors: Ken, Louise, Mark and Nancy — one per category. To determine the best competitor for each category, a test is given
PAGE per category. To determine the best competitor for each category, a test is given and the results (as percentages) for each student recorded.
PAGE and the results (as percentages) for each student recorded.
PAGE
PAGE
Algebra Calculus Functions GeometryPAGE
Algebra Calculus Functions Geometry
PROOFS
the total time required to complete all tasks. PROOFS
the total time required to complete all tasks.
David Lloyd George High School will be competing in a Mathematics PROOFS
David Lloyd George High School will be competing in a Mathematics PROOFSJob 1 Job 2 Job 3 Job 4
PROOFSJob 1 Job 2 Job 3 Job 4
100 50 35 55
PROOFS100 50 35 55
45 70 55
PROOFS45 70 55
70 50 30
PROOFS70 50 30
70
PROOFS70 50 70 70
PROOFS50 70 70

ONLINE ONLY 10.6 Review www.jacplus.com.au
The Maths Quest Review is available in a customisable format for you to demonstrate your knowledge of this topic.
The Review contains:• Multiple-choice questions — providing you with the
opportunity to practise answering questions using CAS technology
• Short-answer questions — providing you with the opportunity to demonstrate the skills you have developed to ef� ciently answer questions using the most appropriate methods
• Extended-response questions — providing you with the opportunity to practise exam-style questions.
A summary of the key points covered in this topic is also available as a digital document.
REVIEW QUESTIONSDownload the Review questions document from the links found in the Resources section of your eBookPLUS.
studyON is an interactive and highly visual online tool that helps you to clearly identify strengths and weaknesses prior to your exams. You can then con� dently target areas of greatest need, enabling you to achieve your best results.
ONLINE ONLY ActivitiesTo access eBookPLUS activities, log on to
www.jacplus.com.au
InteractivitiesA comprehensive set of relevant interactivities to bring dif� cult mathematical concepts to life can be found in the Resources section of your eBookPLUS.
526 MATHS QUEST 12 FURTHER MATHEMATICS VCE Units 3 and 4
c10DirectedGraphsAndNetworks.indd 526 12/09/15 4:16 AM
UNCORRECTED
UNCORRECTED
UNCORRECTED
UNCORRECTED
UNCORRECTED
UNCORRECTED A comprehensive set of relevant interactivities
UNCORRECTED A comprehensive set of relevant interactivities to bring dif� cult mathematical concepts to life
UNCORRECTED to bring dif� cult mathematical concepts to life to bring dif� cult mathematical concepts to life
UNCORRECTED to bring dif� cult mathematical concepts to life can be found in the Resources section of your
UNCORRECTED can be found in the Resources section of your
UNCORRECTED PAGE
PAGE
PAGE
PAGE
PAGE
PAGE
PAGE
PAGE
PAGE
PAGE
PAGE studyON is an interactive and highly visual online
PAGE studyON is an interactive and highly visual online tool that helps you to clearly identify strengths PAGE tool that helps you to clearly identify strengths and weaknesses prior to your exams. You can PAGE
and weaknesses prior to your exams. You can then con� dently target areas of greatest need, PAGE
then con� dently target areas of greatest need, PAGE
PAGE PROOFS
PROOFS
PROOFS
PROOFS
PROOFSDownload the Review questions document from
PROOFSDownload the Review questions document from the links found in the Resources section of your
PROOFSthe links found in the Resources section of your
PROOFS
PROOFS

10 AnswersEXERCISE 10.21 30 minutes
2 147 days
3 10
4 58 days
5 a Critical path = A–B–L–M–N
b Float(D) = 30 – 19 – 10 = 1
Float(C) = 20 – 15 – 4 = 1
Float(H) = 30 – 11 – 10 = 9
Float(F) = 17 – 5 – 6 = 6
Float(G) = 21 – 11 – 4 = 6
Float(E) = 11 – 0 – 5 = 6
Float(K) = 21 – 5 – 8 = 8
Float(J) = 15 – 5 – 4 = 6
6 Float(C) = 25 – 6 – 11 = 8 days
Float(E) = 42 – 17 – 17 = 8 days
Float(F) = 90 – 41 – 23 = 26 days
Float(H) = 61 – 34 – 19 = 8 days
Float(J) = 93 – 34 – 21 = 38 days
Float(K) = 115 – 64 – 25 = 26 days
Float(M) = 117 – 55 – 24 = 38 days
Float(N) = 115 – 88 – 26 = 1 day
Float(Q) = 147 – 114 – 32 = 1 day
7 ED G
F
8 PON
RY
X Z
WVUQTS
9 a B b D
10 a 23 minutes b B, C, E, F, G
11 A–C–F
12 a E b D c A
13 a
B, 15
C, 12A, 10
D, 8G, 6
H, 10 M, 7
L, 8 K, 9
J, 11
E, 10
F, 25
0 10 22 49
52
6135
4125
b 61 minutes
14
15
16
17 a A–D–G
b Float (H) = 1, Float (J) = 3,
Float (E) = 1,
Float (B) = 10, Float (C) = 1,
Float (F) = 1
Activity letterImmediate predecessor Time
A — 7
B — 9
C A 12
D B 8
E B 4
F C, D 9
Activity letterImmediate predecessor Time
A — 3
B — 4
C — 5
D A 6
E B, F 5
F C 8
G D 18
H E 8
J E 6
Activity letterImmediate predecessor Time
A — 10
B A 15
C A 12
D B 8
E C 10
F A 25
G D, E, F 6
H D, E, F 10
J G 11
K J 9
L G 8
M H, L 7
Topic 10 DIRECTED GRAPHS AND NETWORKS 527
c10DirectedGraphsAndNetworks.indd 527 12/09/15 4:16 AM
UNCORRECTED
UNCORRECTED
UNCORRECTED
UNCORRECTED
UNCORRECTED
UNCORRECTED
UNCORRECTED
UNCORRECTED
UNCORRECTED
UNCORRECTED
X Z
UNCORRECTED
X Z
W
UNCORRECTED
WV
UNCORRECTED
VU
UNCORRECTED
UQ
UNCORRECTED
Q
UNCORRECTED
UNCORRECTED
UNCORRECTED
UNCORRECTED
UNCORRECTED
UNCORRECTED
UNCORRECTED
UNCORRECTED
UNCORRECTED
UNCORRECTED
b
UNCORRECTED
b D
UNCORRECTED
D
3 minutes
UNCORRECTED
3 minutes b
UNCORRECTED
b
E
UNCORRECTED
E
PAGE
PAGE
PAGE
PAGE
PAGE
PAGE
PAGE
PAGE
PAGE
PAGE
PAGE
PAGE C
PAGE C
D
PAGE D
E
PAGE E
PROOFS
PROOFS
PROOFS
PROOFS
PROOFS
PROOFS
PROOFS
PROOFS
PROOFS
PROOFS
PROOFS8
PROOFS8
C, D
PROOFSC, D
PROOFS
PROOFS
PROOFS
PROOFS
PROOFS
PROOFS
PROOFS
PROOFS
PROOFS
PROOFS
PROOFS
PROOFS
PROOFSImmediate
PROOFSImmediate predecessor Time
PROOFSpredecessor Time

c Activity B can be delayed 10 minutes,
activity C can be delayed 1 minute,
activity E can be delayed 1 minute,
activity F can be delayed 1 minute,
activity H can be delayed 1 minute,
activity J can be delayed 3 minutes.
18 a A–F–G–J–K
b M, L, H, C, E, B, D
19 a
A
B
C
b
EB
C D
A J I
HGF
20 a A, 2
C, 4
F, 5G, 10 H, 12
E, 3D, 5
B, 20
b 49 minutes
EXERCISE 10.31 Critical path = B–F–G; Float (C) = 3 h,
Float (E) = 5 h, Float (A) = 3 h,
Float (D) = 5 h
2 a The critical path is D–F–G–H–J.
b Float(K) = 8 – 5.5 – 2 = 0.5 hours
Float(C) = 5.5 – 3 – 1 = 1.5 hours
Float(B) = 4.5 – 1 – 2 = 1.5 hours
Float(A) = 2.5 – 0 – 1 = 1.5 hours
Float(E) = 5.5 – 0 – 3.5 = 2 hours
3 a
b B, 35 D, 20
C, 16
E, 12
A, 12
G, 18
F, 5
c 85 minutes
d 4747
6767
8585
2855
1212
00
B, 35D, 20
E, 12C, 16
F, 5
G, 18
A, 12
Critical path = A–B–D–G
4 C5
C
D D'
B EHA
FG G'
6 A, 7
B, 6 B', 0 E, 7 E', 0
C, 8 D, 12 F, 9
7
B, 5
A, 3
D, 7 F, 2
E, 1B', 0
C, 7
8
9 a 36 minutes
b A–C–D–F
c Float(E) = 27 – 15 – 7 = 5 minutes
Float(B) = 7 – 0 – 6 = 1 minute
10 A–B–D–G–L–P–R.
11 Critical path = B–D; Float (E) = 1 min,
Float (C) = 1 min, Float (A) = 1 min
12 a 31 days
b Critical path = A–C–E–G
c The completion time is reduced to 28 days.
The critical path is not affected.
13 D
G, 600
B, 600
A, 1000
C, 800
F, 100
H, 1600E, 400
B', 0
D, 1100
Activity letter Activity
Immediate predecessor Time
A Collect parts
— 12
B Paint frame
A 35
C Assemble brakes
A 16
D Assemble gears
B 20
E Install brakes
C 12
F Install seat
C 5
G Final assembly
D, E 18
528 MATHS QUEST 12 FURTHER MATHEMATICS VCE Units 3 and 4
c10DirectedGraphsAndNetworks.indd 528 12/09/15 4:16 AM
UNCORRECTED
1.5 hours
UNCORRECTED
1.5 hours
2 hours
UNCORRECTED
2 hours
7
UNCORRECTED 7
UNCORRECTED
UNCORRECTED
UNCORRECTED
UNCORRECTED
UNCORRECTED
UNCORRECTED
UNCORRECTED
UNCORRECTED
UNCORRECTED
UNCORRECTED
letter Activity
UNCORRECTED
letter ActivityImmediate
UNCORRECTED
Immediate predecessor Time
UNCORRECTED
predecessor Time
Collect
UNCORRECTED
Collect parts
UNCORRECTED
parts
Paint
UNCORRECTED
Paint frame
UNCORRECTED
frame
C UNCORRECTED
C Assemble UNCORRECTED
Assemble
PAGE
PAGE
PAGE
PAGE D
PAGE D D
PAGE D'
PAGE '
PAGE
PAGE
PAGE
PAGE A, 7
PAGE A, 7
B, 6
PAGE B, 6 B
PAGE B
PAGE
PAGE
PAGE
PAGE
PAGE
PAGE
PAGE
PAGE
PAGE
PAGE PROOFS
PROOFS
PROOFS
PROOFS
HPROOFS
HPROOFS
PROOFS
PROOFS
PROOFS
PROOFS
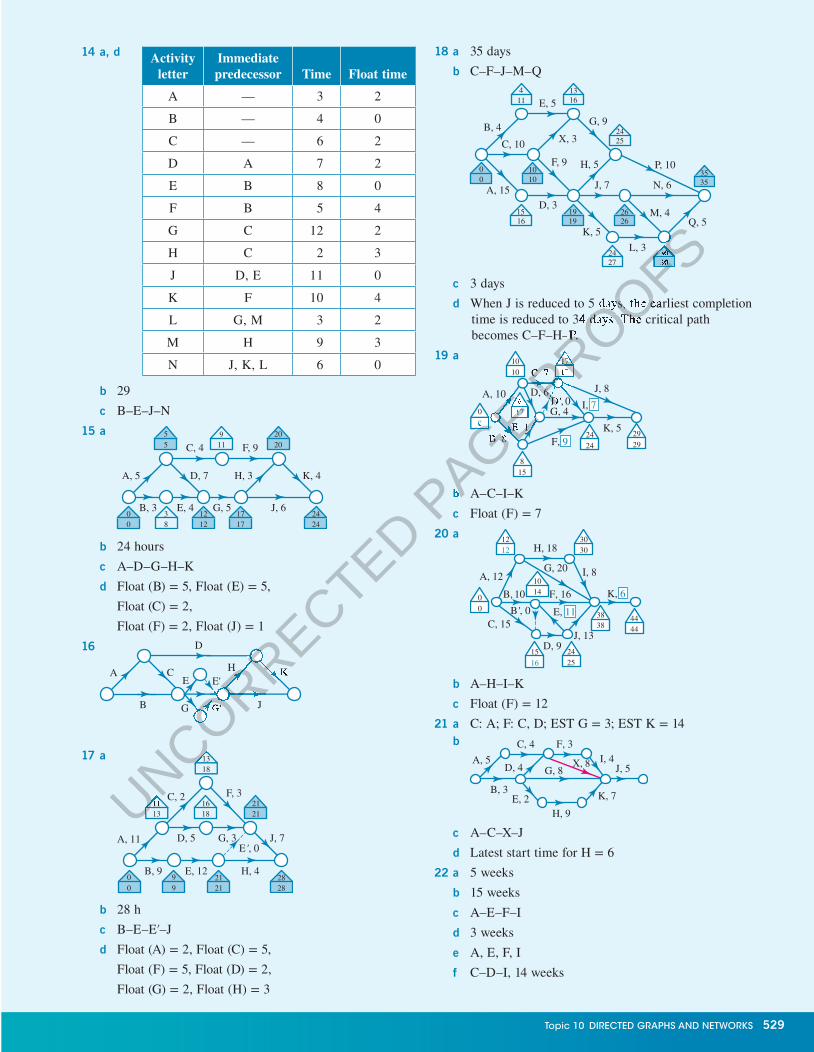
14 a, d
b 29
c B–E–J–N
15 a
B, 3 J, 6G, 5E, 4
A, 5 D, 7 H, 3 K, 4
C, 4 F, 955
2020
2424
1717
38
911
1212
00
b 24 hours
c A–D–G–H–K
d Float (B) = 5, Float (E) = 5,
Float (C) = 2,
Float (F) = 2, Float (J) = 1
16
B JG
A
D
EH KC
G'
E'
17 a
D, 5A, 11 J, 7
B, 9 E, 12 H, 4
G, 3E', 0
F, 3C, 2
1318
2121
2828
2121
99
00
1618
1113
b 28 h
c B–E–E′–J
d Float (A) = 2, Float (C) = 5,
Float (F) = 5, Float (D) = 2,
Float (G) = 2, Float (H) = 3
18 a 35 days
b C–F–J–M–Q
00
1010
1919
2626
3030
3535
1516
411
1316
2427
2425
A, 15
E, 5
G, 9
P, 10
N, 6J, 7
H, 5
K, 5
L, 3
M, 4Q, 5
D, 3
F, 9
X, 3B, 4
C, 10
c 3 days
d When J is reduced to 5 days, the earliest completion time is reduced to 34 days. The critical path becomes C–F–H–P.
19 a
A, 10
F, 9
C, 7
E, 1
I, 7
J, 8
K, 5
D', 0G, 4
B, 8
1717
1010
0
0
815
2424
2929
617
D, 6
b A–C–I–K
c Float (F) = 7
20 a
B', 0
1212
15
3030
4444
1410
00
3838
2425
A, 12
D, 9
H, 18
I, 8
J, 13
G, 20
F, 16B, 10
C, 15E, 11
K, 6
16
b A–H–I–K
c Float (F) = 12
21 a C: A; F: C, D; EST G = 3; EST K = 14b
A, 5
C, 4
D, 4 G, 8X, 8
H, 9
K, 7
I, 4J, 5
F, 3
B, 3E, 2
c A–C–X–J
d Latest start time for H = 6
22 a 5 weeks
b 15 weeks
c A–E–F–I
d 3 weeks
e A, E, F, I
f C–D–I, 14 weeks
Activity letter
Immediate predecessor Time Float time
A — 3 2
B — 4 0
C — 6 2
D A 7 2
E B 8 0
F B 5 4
G C 12 2
H C 2 3
J D, E 11 0
K F 10 4
L G, M 3 2
M H 9 3
N J, K, L 6 0
Topic 10 DIRECTED GRAPHS AND NETWORKS 529
c10DirectedGraphsAndNetworks.indd 529 12/09/15 4:16 AM
UNCORRECTED
UNCORRECTED
UNCORRECTED
UNCORRECTED
UNCORRECTED
UNCORRECTED
UNCORRECTED
UNCORRECTED
UNCORRECTED
UNCORRECTED
UNCORRECTED
UNCORRECTED
UNCORRECTED
UNCORRECTED
UNCORRECTED
J
UNCORRECTED
J
H
UNCORRECTED
H K
UNCORRECTED
K
UNCORRECTED
UNCORRECTED
UNCORRECTED
UNCORRECTED
G
UNCORRECTED
G'
UNCORRECTED
'
UNCORRECTED
UNCORRECTED
13
UNCORRECTED
13
UNCORRECTED
UNCORRECTED
11UNCORRECTED
11
PAGE A, 10
PAGE A, 10
E, 1
PAGE E, 1
B, 8
PAGE B, 8
PAGE
PAGE
PAGE
PAGE
PAGE
PAGE
PAGE
PAGE
PAGE
PAGE
PAGE
PAGE 0
PAGE 0
PAGE
PAGE
PAGE 6
PAGE 617
PAGE 17
PAGE
PAGE
PAGE bPAGE b APAGE
A
PROOFS
PROOFS
PROOFS
PROOFS30
PROOFS3030
PROOFS3030
PROOFS30
PROOFS
PROOFSWhen J is reduced to 5 days, the earliest completion
PROOFSWhen J is reduced to 5 days, the earliest completion time is reduced to 34 days. The critical path
PROOFStime is reduced to 34 days. The critical path
–
PROOFS–P.
PROOFSP.
PROOFS
C, 7PROOFS
C, 7
DPROOFS
D'PROOFS
', 0PROOFS
, 0PROOFS
PROOFS
PROOFS
PROOFS
PROOFS
PROOFS
PROOFS
PROOFS
17
PROOFS
1717PROOFS
17
D, 6PROOFS
D, 6PROOFS

EXERCISE 10.41
50100
V
250 200 100S T UR
2
8
8
3
F2
8
86
5E
H
G J
K
3 a 150
b Yes
4 a 15
b No
5 a
50100
V
250 200 100
100
S T UR
b 150
6 a
8
10
83
F2
8
86
5E
H
G J
K
b 25
7 Minimum cut = maximum �ow = 110
8 a Cut 2
b Cut 1 = 28, cut 3 = 28, cut 4 = 27
c Maximum �ow = 24
9 a
55 2525 35
20
35 40
10 11N P
O
Q
M R
b Maximum �ow = 71
10 a
100 4525 25
9560
120 60
110 145N P
O
Q
M R
b Maximum �ow = 240
11 a 100
50200
250 300
A B
D EC
b
20
20
Q
15 12
125
10
O
M
R
N P
12 a 23
b 16
c 16
13 a 6
b 3
c 3
14 a i 250
ii No
b i 24
ii Yes
15 a
b
c
From To Flow capacity
A B 4
A C 5
A D 3
B E 3
C B 2
C E 4
D C 2
D E 6
From To Flow capacity
A B 4
A C 5
A D 3
B E 3
B C 2
C E 4
D C 2
D E 6
From To Flow capacity
A B 4
A C 7
A D 3
A E 5
B E 3
C E 8
D B 2
D E 6
530 MATHS QUEST 12 FURTHER MATHEMATICS VCE Units 3 and 4
c10DirectedGraphsAndNetworks.indd 530 12/09/15 4:16 AM
UNCORRECTED
UNCORRECTED
71
UNCORRECTED
71
UNCORRECTED
UNCORRECTED
UNCORRECTED
100 UNCORRECTED
10025UNCORRECTED
25 25
UNCORRECTED
25
60
UNCORRECTED
60
110 145
UNCORRECTED
110 145
UNCORRECTED
UNCORRECTED
UNCORRECTED
UNCORRECTED
N
UNCORRECTED
N
UNCORRECTED
UNCORRECTED
P
UNCORRECTED
P
UNCORRECTED
UNCORRECTED
UNCORRECTED
UNCORRECTED
UNCORRECTED
UNCORRECTED
UNCORRECTED
UNCORRECTED
UNCORRECTED
UNCORRECTED PAGE
PAGE
PAGE
PAGE
PAGE
PAGE
PAGE A C
PAGE A C
PAGE
PAGE
PAGE
PAGE
PAGE
PAGE
PAGE
PAGE
PAGE
PAGE
PAGE
PAGE
PAGE
PAGE A D
PAGE A DA D
PAGE A D
B E
PAGE B EB E
PAGE B E
C B
PAGE C BC B
PAGE C B
C E
PAGE C E
PROOFS
PROOFS
PROOFS
PROOFS
PROOFS
PROOFS
PROOFS
PROOFS
PROOFSFlow capacity
PROOFSFlow capacity

d
16 a 10
b 10
c 18
d 22
17 a i
50200
C300250
100
100
E
A B
D
ii 300
b i
20
20
Q
15
5
12
125
10
O
M
R
N P
ii 29
18 B
19 a Cut 4
b Cut 1 = 25, cut 2 = 26, cut 3 = 24, cut 5 = 29
c Maximum �ow = 20
20 a i
12 81
2
13
12 14
11 10N P
O
Q
M R
1
ii Maximum �ow = 31
b i
10 654
9
12 8
9 4N P
O
Q
M R
7
ii Maximum �ow = 1821
75 75
150Freeway
100Freeway
45 45
C
B
20D
60 60
50 50
J
I
30K
50 45F
80GA E H
22 a There would be a traf�c jam.
b The traf�c should �ow smoothly as the in�ow is less than the capacity of �ows leading from H.
c
75 75
150Freeway
100Freeway
45 45
C
B
20D
60 60
5040
50
J
I
30K
50 45F
80GA E H
EXERCISE 10.51
6000
5000
4000
p3
p1
2250
3750
3000
6000C
B
A
D
DS p2
2 a
25 000
10 000 15 000
40 000
30 000
60 000
30 000s1
A
A
S
s2
B B D
CC
b Send 30 000 from S1 to A, 30 000 from S2 to A, 10 000 from S2 to B, 5000 from B to B, 5000 from B to C and 25 000 from C to C. (This may not be the cheapest method.)
3
D
B
B
F
SA
DS C
DE
4 D
5 7
6 15
7 24 — Hungarian algorithm
8 36 — column reduction9
600
400
f2
f1
650
350
V
Q
DS
10 B
11 61
From To Flow capacity
A B 4
A C 7
A D 12
A E 5
C F 7
D B 2
D E 6
D F 4
F E 8
Topic 10 DIRECTED GRAPHS AND NETWORKS 531
c10DirectedGraphsAndNetworks.indd 531 12/09/15 4:16 AM
UNCORRECTED
26, cut 3
UNCORRECTED
26, cut 3 =
UNCORRECTED
= 24, cut 5
UNCORRECTED
24, cut 5
UNCORRECTED
UNCORRECTED
12
UNCORRECTED
121
UNCORRECTED
12
UNCORRECTED
2
14
UNCORRECTED
14
11
UNCORRECTED
11 10
UNCORRECTED
10
UNCORRECTED
UNCORRECTED
UNCORRECTED
UNCORRECTED
UNCORRECTED
UNCORRECTED
P
UNCORRECTED
P
UNCORRECTED
UNCORRECTED
O
UNCORRECTED
O
UNCORRECTED
UNCORRECTED
UNCORRECTED
UNCORRECTED
UNCORRECTED
UNCORRECTED
UNCORRECTED
UNCORRECTED
Maximum �ow
UNCORRECTED
Maximum �ow
UNCORRECTED
i
UNCORRECTED
i
UNCORRECTED
12UNCORRECTED
12UNCORRECTED
UNCORRECTED
UNCORRECTED
MUNCORRECTED
M
PAGE 40 000
PAGE 40 000
30 000
PAGE 30 000
PAGE
PAGE
PAGE
PAGE s1
PAGE s1
PAGE
PAGE A
PAGE A
PAGE
PAGE S
PAGE S
PAGE
PAGE
PAGE
PAGE
PAGE PROOFS
6000
PROOFS
6000
PROOFS
PROOFS
PROOFS
DPROOFS
DPROOFS

12 1
2
3
4
1
2
3
4
13 Answers will vary.
14 B
15 a
E
3 0 2 1 3
0 0 4 2 1
0 3 0 3 0
0 2 0 4 0
5 2 0 0 0
U
b Car 1
Car 2
Car 3
Car 4
Car 5
D1
D2
D3
D4
D5
c i C1 → D2, C2 → D1, C5 → D4, C3 → D3, C4 → D5 or C1 → D2, C2 → D1, C5 → D4, C3 → D5, C4 → D3
ii Total = $82 000
16 a 67 — column reduction b 53 — row reduction
17 a
D
0 10 10 30
40 0 0 40
30 20 20 0
0 60 20 50
T
b
D
0 0 0 20
50 0 0 40
40 20 20 0
0 50 10 40
T
(one possible result)
c A
B
C
D
1
2
3
4
d i A → 2, B → 3, C → 4, D → 1 or A → 3, B → 2, C → 4, D → 1
ii Total = 130 minutes
18 a T → 3, U → 1, V → 4, W → 2
b 175 minutes
19 a A C F G
K
L
M
N
D
18 0 11 41
45 10 20 0
26 51 16 0
30 6 18 0
T
b A C F G
K
L
M
N
D
0 0 0 41
27 10 9 0
8 51 5 0
12 6 7 0
T
c Ken
Louise
Mark
Nancy
Algebra
Calculus
Functions
Geometry
Ken → Algebra, Louise → Geometry, Mark → Functions, Nancy → Calculus
d 71.5%
20 a V1 → P2, V2 → P4, V3 → P1, V4 → P3 or V1 → P3, V2 → P4, V3 → P1, V4 → P2
b Total = 48 km
532 MATHS QUEST 12 FURTHER MATHEMATICS VCE Units 3 and 4
c10DirectedGraphsAndNetworks.indd 532 12/09/15 4:16 AM
UNCORRECTED 53 — row reduction
UNCORRECTED 53 — row reduction
T
UNCORRECTED
T
one possible result)
UNCORRECTED
one possible result)
PAGE N
PAGE N
D
PAGE D
0 0 0 41
PAGE 0 0 0 41
27 10 9 0
PAGE 27 10 9 0
8 51 5 0
PAGE 8 51 5 0
12 6 7 0
PAGE 12 6 7 0
Ken
PAGE Ken
LouisePAGE
LouisePAGE
PAGE
PAGE
PAGE
PAGE
PAGE
PAGE PROOFS
T
PROOFST
A C F G PROOFS
A C F G
0 0 0 41 PROOFS
0 0 0 41
TPROOFS
T

c10DirectedGraphsAndNetworks.indd 533 12/09/15 4:16 AM
UNCORRECTED PAGE P
ROOFS