Embed Size (px)
Citation preview

Promoting the International Transfer of Low-Carbon Technologies: Evidence and Policy Challenges Report for the Commissariat général à la stratégie et à la prospective (French Center for Policy Planning) October 2013 This document has been prepared by Matthieu Glachant, Damien Dussaux, and Yann Ménière from MINES ParisTech and Antoine Dechezleprêtre from the London School of Economics. Contact : Matthieu GLACHANT, Cerna, MINES ParisTech. E-mail : [email protected] Dominique AUVERLOT, Commissariat général à la stratégie et à la prospective. E-mail : [email protected]


Table of contents
Executive summary ............................................................................................. 5
Introduction ........................................................................................................ 7
1 Conceptual framework ................................................................................. 9 1.1 Technology is information ........................................................................................................ 9 1.2 Appropriation strategies ............................................................................................................ 9 1.3 The channels of technology transfer ....................................................................................... 10
2 Current patterns of international technology diffusion ................................. 12 2.1 Presentation of the indicators .................................................................................................. 12 2.2 Data sources ............................................................................................................................ 14 2.3 The level of diffusion of climate-related technologies ........................................................... 17 2.4 The case of developing countries ............................................................................................ 18
3 Which technologies should be transferred and to which countries? ............ 24 3.1 Methodological approach ....................................................................................................... 24 3.2 Priority technologies at the world level .................................................................................. 25 3.3 Priority geographical areas in the developing world ............................................................... 27 3.4 A focus on coal-fired power generation .................................................................................. 29
4 Which policy instruments? .......................................................................... 31 4.1 GHG abatement policies as a prerequisite .............................................................................. 31 4.2 Technological capacity building ............................................................................................. 32 4.3 Intellectual property rights ...................................................................................................... 33 4.4 Barriers to trade and foreign direct investment ....................................................................... 36 4.5 The Clean Development Mechanism and other carbon market mechanisms ......................... 37 4.6 Business-led initiatives ........................................................................................................... 39 4.7 Natiolanny Appropriate Mitigation Actions (NAMAs) .......................................................... 41 4.8 The Technology Mechanism .................................................................................................. 42 4.9 Financing ................................................................................................................................ 44
5 Technology transfer and competitiveness ................................................... 44
Conclusion ........................................................................................................ 47
Steering Committee .......................................................................................... 51
References ........................................................................................................ 53

- Promoting the International Transfer of Low-Carbon Technologies -
Appendices ....................................................................................................... 59
1. Complete list of technologies described in the study’s patent dataset ........ 61
2 : Description and HS codes of low carbon goods considered in the study .... 63
3 : TOP 10 inventor countries (2007-2009) ........................................................ 64
4 : Imports of climate patented inventions as a share of world imports (2007-2009) ............................................................................ 65
5 : Imports of low carbon equipment goods as a share of world imports (2007-2009) ............................................................................ 65
6 : Country groupings ........................................................................................ 66
7 : Scenarios considered by the IEA in the ETP2012 ......................................... 67

October 2013 5
Executive summary
The international diffusion of technologies with a potential to reduce carbon emissions is at the core of current climate change negotiations. North-to-South technology transfer is of particular importance since technologies have so far been mostly developed in industrialized countries, but are urgently required to mitigate greenhouse gas (GHG) emissions in fast-growing emerging economies. Against this background, the primary objective of this study is to give recommendations on how the transfer of low-carbon technologies could be promoted. Our contribution to the current debate is threefold. First, we provide an up-to-date picture of the climate-related technology transfer landscape, based on a combination of patent data, bilateral trade data and foreign investment data. Second, we develop and implement a methodology to identify which technologies should be given priority and which recipient countries should be targeted. Third, we discuss the potential of different policy approaches and the instruments available to promote technology transfer. The picture of technology diffusion is totally different for emerging economies and least-developed countries. The latter group of countries are hardly visible in the data simply because they do not import climate-mitigation technologies. In contrast, technologies are already flowing into emerging economies through market channels such as the import of capital goods, local investment by multinational enterprises that own technologies, and the associated circulation of skilled workers (about 16-30% of global transfer flows, depending on the indicator, a percentage in line with their contribution to world GDP). South-South technology transfer is, however, very limited, as technology providers are mostly located in industrialized countries. Several countries – China, South Africa, Mexico and, to a lesser extent, Brazil – seem particularly well connected to global technology flows. Fewer technologies are transferred towards other emerging and transition countries, in particular Russia and India. Based upon the idea that priority technologies and countries are those with limited transfer today, but for large emission reduction potential (the amount of emission reduction that the technology or the country can achieve at a reasonable cost), we find that India is the top priority geographical area. As for technologies, priority should be given to renewable energy, in particular hydro, solar thermal and photovoltaic, wind and biomass, and heating technologies.

- Promoting the International Transfer of Low-Carbon Technologies -
6 October 2013
Looking finally at the effectiveness of various policy approaches in promoting technology transfer, the key message is again to distinguish the case of emerging economies and least-developed countries. For the most part, technology diffusion towards emerging economies is driven today by a demand for green technologies induced by environmental policies in industrialized countries (including the Clean Development Mechanism). Pushing further technology transfer towards these economies requires strengthening intellectual property rights and lowering barriers to trade and investment in order to further increase the market forces which encourage the import of knowledge, skills and technologies. More stringent environmental policies with proper enforcement at home (e.g., stricter emission standards, cap and trade schemes, pollution taxes) and higher technological absorptive capacities are also necessary. In contrast, low barriers to trade and foreign direct investment (FDI) or strict intellectual property rights are unlikely to trigger technology transfer towards least-developed countries as they lack the necessary capacities to absorb foreign technologies. In these countries, capacity building is the priority.

October 2013 7
Introduction
The international diffusion of technologies with a potential to reduce carbon emissions is at the core of current climate change negotiations. North-to-South technology transfer is of particular importance since technologies have so far been mostly developed in industrialized countries, but are urgently required to mitigate greenhouse gas (GHG) emissions in fast-growing emerging economies. Indeed, more than 75% of growth in CO2 emissions until 2050 is expected to come from developing countries, with India and China alone accounting for 50%. Fostering technology transfer involves considerable policy and economic challenges. On the one hand, developing countries see technology transfer as a costly process that should partially be taken care of by developed nations. On the other hand, innovative firms in developed countries fear that aggressive technology transfer policies might deprive them of vital intellectual assets. For these reasons, policy debates have so far revolved around the financing of technology transfer and the role of intellectual property rights (IPRs), which some countries view as a barrier to technology diffusion (ICSTD, 2008). Other important topics covered in the negotiations include developing countries’ capacity to absorb new technologies and the role of environmental policies that may create a demand for clean technologies. International discussions around technology transfer have led to the establishment of the so-called Technology Mechanism at the 16th session of the COP in Cancun in December 2010. The mechanism is expected to "facilitate the implementation of enhanced action on technology development and transfer in order to support action on mitigation and adaptation to climate change". It was officially launched in 2012 with the establishment of the Technology Executive Committee (TEC), a group of 20 experts whose role consists of identifying countries’ technological needs and providing governments with recommendations on policies that can promote technology transfer. Against this background, the primary objective of this study is to give recommendations on how the transfer of low-carbon technologies could be promoted. We hope that our results can contribute to the analysis currently carried out by the Technology Executive Committee. Our contribution to the current debate is threefold. First, we provide an up-to-date picture of the climate-related technology transfer landscape, based on a combination of patent data, bilateral trade data and foreign investment data. To the authors' knowledge, this is the first time that such a comprehensive database on climate-related technology transfer has been assembled. Second, we develop and implement
- Promoting the International Transfer of Low-Carbon Technologies -
8 October 2013
a methodology to identify which technologies should be given priority and which recipient countries should be targeted. Third, we discuss the potential of different policy approaches and instruments available to promote technology transfer: differentiating intellectual property rights for low carbon technologies, reforming the Clean Development Mechanism, removing barriers to trade and to foreign direct investment, increasing technological absorptive capacities, etc. In addition to the analysis of original data on patenting, trade and foreign investment data, our study draws on the extensive literature on the international diffusion of technologies, surveyed in Keller (2004). Our paper also relies on a growing body of work that examines the drivers of the international transfer of climate change mitigation technologies and discusses the merits of various policy instruments for enhancing technology diffusion (Dechezleprêtre et al., 2008; Schmid, 2012; Dekker et al., 2012; Haščič et al., 2010; Haščič and Johnstone, 2011; Popp et al., 2011; Verdolini and Galeotti, 2011). The structure of the report is as follows: We start by presenting the analytical framework on which our analysis is based. The third section describes current patterns and trends in technology transfer. We then seek to identify the technologies and geographical areas where transfer is mostly needed. In the following part, we review the policy instruments and approaches available. The next section is dedicated to the distributional aspect, and in particular to the impact of technology transfer on the national competitiveness of the countries which provide the technologies. We summarize the main findings in the conclusion.

October 2013 9
1 Conceptual framework
1.1 Technology is information From an economic perspective, technology is intangible; it primarily consists of a consistent set of information (such as technical specifications and related know-how) that can be materialized in tangible goods. Whether tacit (know-how) or coded (drawings, models, chemical formulas), this information is the key resource from which technical objects derive their value. For example, possessing tangible goods only allows using it (as long as it works), while possessing the knowledge from which it proceeds makes it possible to reproduce it (and, incidentally, to repair it). As intangible goods, technology has a property that economists call non-rivalry. Unlike ordinary tangibles, information is not exhausted in use: it can be disseminated to a wider audience, and re-used at almost zero cost without any limit in space or time. Accordingly, the social value of an invention may largely exceed the direct benefit it generates for the inventor (consider, for instance, the great career of the wheel, printing press, steam engine, or transistor...). Conversely, the fact that inventions can be easily imitated is also a major obstacle to their production by the market. Indeed, the development of an invention usually requires a (potentially large) upfront investment, which an inventor may be reluctant to incur if they cannot appropriate a sufficient part of the social value of the invention. The diffusion of technology is thus a crucial, but sensitive stage in the innovative process: It happens when the technology is used, and thus when it yields benefits on the ground. But it is also at this stage that others can imitate the technology, hindering inventors from exploiting their technology and benefitting from market exclusivity. Because the risk of imitation can cut incentives to innovate in the first place, any public policy has to find ways to encourage diffusion while preserving incentives to innovate.
1.2 Appropriation strategies In practice, innovators use various appropriation strategies to prevent third parties from imitating their technology (Cohen et al., 2000): Patent law. Patents confer upon their owner the exclusive right to make, use, and sell the protected invention for a maximum period of 20 years, during which the patent owner is able to extract profits from their invention. As a counterpart, the inventor must agree to publish their invention, which falls into the public domain at the expiration of the patent1. Besides the cost of the procedure for filing (about €30 000 for a European patent), this obligation to publish may be a deterrent to inventors since issued patents are a source of valuable information for competitors.
(1) In this respect, the patent system establishes a balance between the necessary rewards to inventors and the interest of society (that non-rival inventions be published and widely disseminated). On the one hand, the legal exclusivity conferred by patents induces a cost for society: it may result in price monopoly and artificially restrict access to inventions for third parties. On the other hand, the prospect of temporary monopoly rents is an effective means of generating incentives for potential inventors to invest in the development of new innovations.

- Promoting the International Transfer of Low-Carbon Technologies -
10 October 2013
Lead time. According to available surveys of R&D executives (Cohen et al., 2000), innovations are best protected when potential imitators have not yet understood and mastered the underlying technology. In that case, lead time may prevent imitation for a certain period of time even though the knowledge is public, for rivals need to invest in R&D in order to eventually replicate the innovation. Trade secret. Another effective way to appropriate technological assets is to avoid disclosing it to third parties – by keeping know-how uncodified or by keeping codified information secret. Investment in R&D can then be recouped through the production and marketing of tangible goods incorporating the technology1. However, the ability of an inventor to exploit their invention is not guaranteed by secrecy: it ultimately depends on the amount of time the inventor can expect to have at their disposal before competitors get the information they concealed. Reverse engineering (disassembling a product to identify inventions that it incorporates) is, for instance, widely practised in some sectors (e.g., mechanical engineering). The labor market also generates important leakage risks, since employees may share the know-how they have acquired during their previous positions. In practice, strategies for appropriating technology usually rely on a combination of secrecy, lead time and patents. In most cases, patents protect only a few key elements that can be isolated and patented as stand-alone inventions, while the rest of the technology consists of know-how that is kept secret. As a result, the information disclosed in patents is seldom sufficient to enable the immediate and effective use of the related technology by third parties.
1.3 The channels of technology transfer The notion of “technology transfer” can be confusing, for transfers may concern either intangible knowledge or the physical supports in which this knowledge is embedded. For the purpose of this study, we are mainly interested in the former type of transfer, as it enables the appropriation and exploitation of technological knowledge directly in the recipient country. However, we shall see that knowledge diffusion and the transfer of technological goods embodying this knowledge are often intertwined in practice. How does technology-related knowledge flow from one country to another? A first important distinction should be established between market channels for transfers, and knowledge transfers (or spillovers) that are not mediated by the market:
− On the one hand, technology and related knowledge may be transferred through voluntary transactions aiming at commercializing and/or exploiting technological products in the recipient country. Possible channels are international trade in manufactured goods, FDI and the licensing of patented technology.
− On the other hand, knowledge may also spill over more broadly in the recipient country without any market transaction. This may for example be the case if an inventor examines a patent published in a foreign country and builds upon this knowledge.
However, in most cases knowledge spillovers actually result from market transactions through reverse engineering, the circulation of skilled labor, or interactions with local suppliers and distributors (Keller, 2004). How much knowledge is transferred and
(1) Expertise may also be marketed in the form of services, without being disclosed to the client.

- Promoting the International Transfer of Low-Carbon Technologies -
October 2013 11
diffused in a recipient country thus primarily depends on the commercial channel through which the international technology transfer initially takes place. Although all channels involve some degree of knowledge diffusion, trade in goods is significantly less knowledge-intensive than FDI, and FDI than licensing. These differences are explained below and summarized in Table 1. International trade in manufactured goods induces little cross-border transfer of knowledge, simply because this knowledge remains in the originating country and is directly exploited there. Yet even in this case, there may be knowledge spillovers in the recipient country (Rivera-Batiz and Romer, 1991). Local firms can indeed reverse-engineer imported products, or acquire knowledge through business relationships (e.g., as customer or distributor) with the source company. Empirical evidence confirms that the import of capital goods, such as machines and equipment, improves productivity in the recipient country. Coe et al., (1997) show, for instance, that the share of machinery and equipment imports in GDP has a positive effect on total factor productivity of developing countries. In their descriptive paper, Lanjouw and Mody (1996) show that imported equipment is a major source of environmental technology for some countries. Foreign direct investment induces more knowledge transfer than trade in goods, for it aims at directly exploiting this knowledge in a local subsidiary of the source company – and not in the source country anymore. It also generates more spillovers, since local employees of the subsidiary have the opportunity to learn about the technology and may subsequently take up employment in other domestic firms. Local firms may also increase their productivity by observing nearby foreign-owned companies or becoming their suppliers or customers. Overall, the literature finds strong evidence that FDI is an important channel for technology diffusion, whereby multinational enterprises transfer firm-specific technology to their foreign affiliates (see for example, Lee and Mansfield, 1996; Branstetter et al., 2006). The very purpose of licensing is to carry out a full knowledge transfer to the licensor so as to enable them to directly exploit it. Accordingly, knowledge flows outside both the source country and the source company into the hands of a local third party. Imitation risks are highest in this case because the licensees can adopt opportunistic (possibly out-of-contract) behaviours for their own benefit, such as using the knowledge to develop their own rival technology, or sharing it subsequently with other local actors.
Table 1: Knowledge location and mechanisms of domestic diffusion in different transfer channels
Transfer channels Knowledge location Diffusion mechanism in the
recipient country Geographical Legal
Export of equipment goods
Source country Source company Reverse engineering
Foreign direct investment
Recipient country
Source company Reverse engineering + labour circulation
Licensing Recipient country
Customer Reverse engineering + labour circulation
+ Customer opportunism

- Promoting the International Transfer of Low-Carbon Technologies -
12 October 2013
2 Current patterns of international technology diffusion In this section, we present the current pattern of international transfer and its evolution since 1990. The goal of this description is to have the most possibly accurate view of where we stand now, in order to derive meaningful insights in the next sections on where to go and with which instruments. The task is difficult as we seek to describe flows of intangible assets and we focus specifically on developing countries, in which statistics tend to be of lower quality than elsewhere. Before presenting the results, we thus discuss in detail our indicators and the data sources we have used.
2.1 Presentation of the indicators The above channels suggest indicators to assess cross-country technology flow. In this study, we will use data on the international trade of low-carbon capital goods and on the flow of foreign direct investment made by companies active in the low carbon economy. Unfortunately, data on the international flow of royalty payments are lacking. Yet evidence shows that transfers via licensing are of a much smaller magnitude than trade and foreign direct investment, particularly for environment-related technologies in which we are interested. The international balance of payments provides a first indicator of international flows of transfer payments associated with intellectual property. Flows (sum of revenue and expenditure) of "technology balance of payments" in 2011 represented about 0.3% of GDP at the world scale, against only 2.4% and 29.3% respectively for Foreign Direct Investment and Exports of Goods and Services (World Bank Indicators, http://data.worldbank.org/). However this indicator should be considered as an upper bound for the weight of technology licensing. Indeed, it also includes items that are not related to technology, such as royalties on trademarks or copyrights. Moreover, part of the patent royalties reflects intra-group transfers between entities of the same corporations in different countries: they are likely to proceed from tax optimization strategies rather than actual technology transfers. A more accurate measure is provided by Smith (2001) who finds that licenses to unaffiliated firms represented less than 0.1% of the total value of licenses, FDI, and exports of manufactured products from the United States to the rest of the world in 1989 (Smith, 2001). Anand and Khanna (2000) also find that about 68% of licensing contracts take place in only two sectors—chemicals and drugs (46%) and electronics and electrical equipment (22%)—of which neither strongly overlaps with climate-mitigation technologies. A recent study on the Chinese solar photovoltaic industry also confirms that patent licensing does not play any role in this sector; the key vectors are FDI and the trade of manufacturing equipment (de la Tour et al., 2011). We can thus focus the entire analysis on trade and FDI. A drawback of these two indicators is that they do not directly measure cross-country information flow, but the flow of goods or capital with which they are presumably associated. The actual contribution to technology diffusion of trade in goods and foreign investment is likely to vary a lot across industries, markets and technologies. Empirical studies suggest that patent protection is relied upon for technology transfers along all three channels—trade, FDI and licensing—for each of them raises a risk of

- Promoting the International Transfer of Low-Carbon Technologies -
October 2013 13
leakage and imitation in recipient countries (Maskus, 2000; Smith, 2001; Dechezleprêtre et al., 2013). For this reason, we also use patent data. Patenting is a measure of technology transfer because it gives the exclusive right to exploit commercially the technology in the country where the patent is filed. As patenting is costly, inventors request protection when they have plans to use the technology locally. This approach has been used inter alia by Dechezleprêtre et al., (2011, 2013). The main advantage of using patents to measure technology diffusion is that they are available at a highly technologically disaggregated level. We can precisely identify innovations in various climate-related technologies whereas R&D investments, trade or foreign direct investment cannot always be disaggregated with the same level of granularity. Furthermore, patenting is more directly related to information and knowledge than trade and FDI statistics. Using patents as an indicator of technology transfer is nevertheless not without limitations. To start with, not all inventions are patented. However, a large fraction of the most economically significant innovations appears to have been patented (Dernis and Guellec 2001). The value of individual patents is also heterogeneous. This is less of an issue in the present study to the extent that we focus on “exported” inventions, which are typically more valuable (Harhoff et al., 2003; van Zeebroeck, 2011). Importantly, the propensity to patent differs between sectors, depending on the nature of the technology (Cohen et al., 2000). Therefore, when comparing technologies, we do not rely on absolute figures (e.g., the count of patents in a given country), but on relative indicators (e.g., the share of patents from that country in the total number of patents filed at the world level in the same technology). Another limitation is that, although a patent grants the exclusive right to use a technology in a given country, we do not have any information on whether the technology has actually been used. Yet, the high expense of patenting deters the filing for protection in countries where the technology is unlikely to be deployed. Patenting is costly – in terms of both the costs of preparation of the application, and the administrative costs and fees associated with the approval procedure (Van Pottelsberghe and François, 2009). For example, in 2005, filing a patent at the European Patent Office (EPO) cost around €30,000 (Roland Berger, 2005). Inventors are therefore unlikely to apply for patent protection in a particular economy unless they are relatively certain of the potential market value for the technology. Indeed, empirical evidence suggests that inventors do not patent widely and indiscriminately, with the average invention only patented in two countries (see Dechezleprêtre et al., 20111). In the following we also describe countries’ absorptive capacities. It starts from the observation that the world is full of examples of technology transfer projects that failed because of the absence of the right capacities in the recipient countries to implement the technology. Various factors – such as the availability of skilled technical personnel, information on available technologies, social institutions that reduce transactions costs – determine this ability to successfully absorb foreign technologies. They are usually referred to as a country’s absorptive capacities (Fagerberg, 1994; Keller, 1996; Worrell et al., 1997; Griffith et al., 2004; Kneller & Stevens, 2006). To measure these capacities, we rely on two indicators, which have been used in similar studies:
(1) 75% of patented inventions are protected in only one country.

- Promoting the International Transfer of Low-Carbon Technologies -
14 October 2013
− The percentage of tertiary enrolment (that is, the percentage of high school graduates that successfully enrol into university). This indicator measures capacities that are generic to all technologies.
− The stock of inventions (as measured by patents) developed by local inventors in the technology. This indicator captures the amount of knowledge available in a given technology field and is thus specific to each technology. More specifically, the indicator is the discounted stock of high-value inventions previously filed in the same technology area by local inventors which is calculated based on data from the PATSTAT database described below. Discounting reflects the progressive obsolescence of new inventions. The value chosen for the annual depreciation of R&D capital is 15%, a value commonly used in most literature (see Keller, 2004).We restrict inventions to high-value or exported inventions only, to screen out the many low-value patents only filed in one country.
2.2 Data sources We gathered data from four main sources: the EPO/OECD World Patent Statistical Database, the United Nations Commodity Trade Statistics Database, Bureau van Dijk's ORBIS database, and the World Bank World Development Indicators.
2.2.1 Patent data Patent data are drawn from the World Patent Statistical Database (PATSTAT) maintained by the European Patent Office. PATSTAT is the largest international patent database available to the research community with nearly 70 million patent documents included. Patent documents are categorized using the International Patent Classification (IPC) and national classification systems. This allows us to identify climate change mitigation technologies. In particular, we use the new “Y02” category developed by the European Patent Office to identify patents in PATSTAT pertaining to “technologies or applications for mitigation or adaptation against climate change”. This new category is the result of an unprecedented effort by the European Patent Office, whereby patent examiners specialized in each technology, with the help of external experts, developed a tagging system of patents related to climate change mitigation technologies. The Y02 category provides the most accurate tagging method of climate change mitigation patents available today, and is becoming the international standard for clean innovation studies. We identify patents transferred internationally as patents filed by an inventor from a country different from that in which protection is sought, e.g., patents filed in the US by a German inventor.
2.2.2 Trade data Trade data in US dollars comes from the United Nations COMTRADE database, which reports bilateral trade between countries at a highly disaggregated product level. Trade data in the COMTRADE database covers between 70% to 90% of world trade obtained from the WTO Statistics Database, depending on the year. As is the case with patent data, the very detailed classification system used in the COMTRADE database (a 6-digit classification of commodities) makes it possible to

- Promoting the International Transfer of Low-Carbon Technologies -
October 2013 15
specifically identify trade in equipment goods that incorporate technologies to cut greenhouse gas emissions (for example wind turbines). We then measure technology transfer by the value of trade in these goods between trading partners.
2.2.3 Foreign investment data To measure foreign direct investment, we rely on the financial database ORBIS, provided by Bureau Van Dijk under a commercial licence. The ORBIS database includes firm-level data on investment stocks in foreign countries (due to mergers and acquisitions, creation of a subsidiary, etc.). In order to identify foreign direct investment by firms involved in sectors related to climate change, we have matched the ORBIS database with the PATSTAT database and identified companies which own at least one patent in climate-related technology. The rationale for this restriction is twofold. First, it makes it possible to provide an indicator of FDI at the technology level. Economic sector classifications available at the company level are too aggregated to allow for meaningful analyses at the technology-level. For example, we can only identify companies in the "Production of Electricity" sector, but cannot identify renewable energy producers. Second, it allows us to identify foreign investment that potentially involves the transfer of climate-friendly technology. This explains why patent and FDI statistics have the same technology scope (see below). FDI data pose a specific challenge, as information on the volume of investments is frequently missing, in particular in developing countries. As an indicator of technology transfer, rather than measuring the volume of investment in ‘country B’ by companies located in ‘country A’, we use the number of capital links between companies in the source country and companies in the recipient country. This gives an indication of the intensity of capital links between country pairs.
2.2.4 Absorptive capacities date As explained above, we use patent data to calculate the technology-specific stock of inventions. Data on countries’ tertiary enrolment is available from the World Bank World Development Indicators.
2.2.5 Geographical coverage Table 2 presents the geographical coverage of the data along with their time dimension. Geographical coverage is almost comprehensive for trade and FDI data: the COMTRADE database includes all 192 United Nations member countries and the ORBIS database gathers information from 197 countries. With 80 patent offices in PATSTAT, patent data is not as comprehensive, but they include the major patent offices in the world. Given the geographical coverage of the combined dataset, we can confidently consider that if some countries (in particular least-developed countries) do not appear across all three dimensions of the data set, the reason is that they do not participate in the international diffusion of technologies. There are, however, a few important exceptions: India, Indonesia, the Philippines, Vietnam, Pakistan, Bangladesh, Nigeria and Thailand.

- Promoting the International Transfer of Low-Carbon Technologies -
16 October 2013
Table 2: Geographical coverage of various data sources
Definition Data source Geographical coverage
Period of coverage
Patents Volume of patents filed in the recipient country by inventors located in the source country
PATSTAT
80 patent offices Major exceptions : India, Indonesia, the Philippines, Vietnam, Pakistan, Bangladesh, Nigeria and Thailand
1990-2009
International trade
Volume of bilateral trade of low-carbon equipment goods (in value)
COMTRADE 205 countries 1990-2009
Foreign direct investment
Number of subsidiaries in the recipient country owned by companies from the source country having at least one low-carbon patent
ORBIS 197 countries 2011
Absorptive capacities
Discounted stock of recipient country’s patented inventions Percentage of tertiary enrollment
PATSAT World Bank Development Indicators
80 patent offices
2007-2009
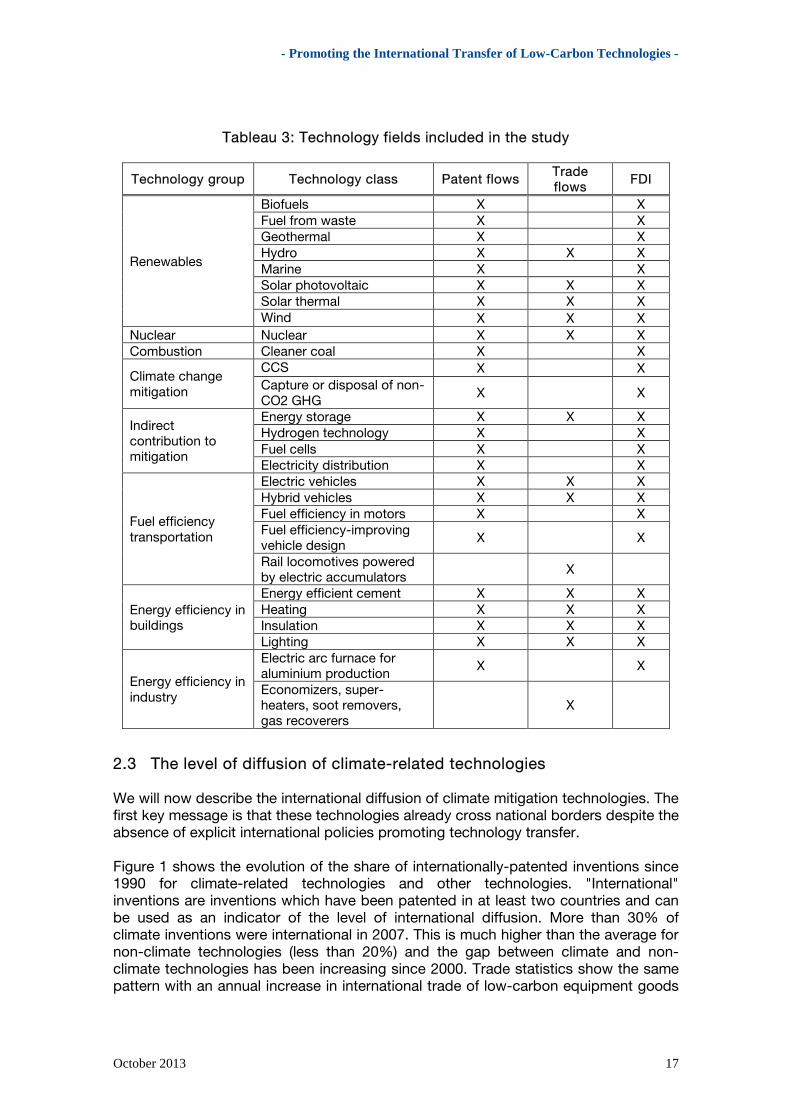
2.2.6 Technological scope Our study covers a wide range of technologies across most sectors of the economy. Table 3 presents the precise technology coverage of the study, and more detailed information can be found in Appendix 1 and 2. Obviously, not all technologies with a potential to mitigate climate change could be included in the analysis. The main reason is that their diffusion does not entail any patenting or international trade. This is the case for agriculture or forestry: technologies such as soil restoration, reforestation, rice or grassland management are simply not present in either trade or patent data. Another reason is that classifications used in trade and patent data do not allow us to identify some technologies, in particular technologies aiming at improving industrial energy efficiency. In practice, saving energy in the industrial sector mostly consists of using a more energy-efficient version of production equipment. It does not consist of adding a device which specifically saves energy in the production chain. The problem then is that patent or trade statistics are not detailed enough to distinguish between different versions of the same equipment. To give an example, the COMTRADE code 841780 describes “industrial/laboratory furnaces & ovens”, but no distinction is made between inefficient and energy-efficient furnaces. Nevertheless, the technologies in our data set represent 65% of the abatement potential until 2030 as identified in the McKinsey abatement curve. Patent and FDI data offer the most extensive coverage: they are comprehensive for energy production (including cleaner coal). They are also very good for transport and energy efficiency in buildings (insulation, heating, and lighting). Data on energy efficiency in industry are more limited (except for aluminum and certain equipment goods in heavy industries). Trade data are not as comprehensive, because product classifications used to organize trade data do not offer the same level of disaggregation, as illustrated above.
- Promoting the International Transfer of Low-Carbon Technologies -
October 2013 17
Tableau 3: Technology fields included in the study
Technology group Technology class Patent flows Trade flows
FDI
Renewables
Biofuels X X Fuel from waste X X Geothermal X X Hydro X X X Marine X X Solar photovoltaic X X X Solar thermal X X X Wind X X X
Nuclear Nuclear X X X Combustion Cleaner coal X X
Climate change mitigation
CCS X X Capture or disposal of non-CO2 GHG
X X
Indirect contribution to mitigation
Energy storage X X X Hydrogen technology X X Fuel cells X X Electricity distribution X X
Fuel efficiency transportation
Electric vehicles X X X Hybrid vehicles X X X Fuel efficiency in motors X X Fuel efficiency-improving vehicle design X X
Rail locomotives powered by electric accumulators
X
Energy efficiency in buildings
Energy efficient cement X X X Heating X X X Insulation X X X Lighting X X X
Energy efficiency in industry
Electric arc furnace for aluminium production
X X
Economizers, super-heaters, soot removers, gas recoverers
X
2.3 The level of diffusion of climate-related technologies We will now describe the international diffusion of climate mitigation technologies. The first key message is that these technologies already cross national borders despite the absence of explicit international policies promoting technology transfer. Figure 1 shows the evolution of the share of internationally-patented inventions since 1990 for climate-related technologies and other technologies. "International" inventions are inventions which have been patented in at least two countries and can be used as an indicator of the level of international diffusion. More than 30% of climate inventions were international in 2007. This is much higher than the average for non-climate technologies (less than 20%) and the gap between climate and non-climate technologies has been increasing since 2000. Trade statistics show the same pattern with an annual increase in international trade of low-carbon equipment goods

- Promoting the International Transfer of Low-Carbon Technologies -
18 October 2013
of 18% per year on average since 1990, compared to 13% for non-climate capital goods.
Figure 1: Share of internationally-patented inventions, 1990 – 2007
Source: Authors’ calculations based on PATSTAT data This relative intensity of international diffusion of climate-related technologies is fortunate as most inventions are generated in a limited set of industrialized countries. The USA, Germany and Japan together account for almost 60% of the world's inventions (more detail in Appendix 3). Moreover, innovation in climate-related technologies is more concentrated than innovation in non-climate technologies. Our data indicate that the relatively more intense diffusion may compensate for the more concentrated activity of innovation.
2.4 The case of developing countries La figure 2 montre que le transfert de technologies vers les pays du Sud a augmenté de façon importante entre 1990 et 2007 et, à l'instar de la situation mondiale décrite ci-dessus, la diffusion des technologies climatiques est en moyenne plus élevée que les autres technologies.
10%
15%
20%
25%
30%
35%
1990 1992 1994 1996 1998 2000 2002 2004 2006
Climate
Non-climate

- Promoting the International Transfer of Low-Carbon Technologies -
October 2013 19
Figure 2: Share of internationally-patented inventions filed in at least one developing country, 1990 – 2007
Source: Authors’ calculations based on PATSTAT data. As a result of this evolution, technology transfer towards fast growing economies is now significant (see Table 4). In particular, emerging countries play an active role in the international trade of low carbon equipment goods. They are also significant exporters: 14% of the international trade of such goods originates from emerging economies. This indicates the success of countries like China in the production of equipment for producing renewable energy (e.g., photovoltaic panels, wind turbines). Statistics also suggest significant transfer through foreign direct investment (30% of the world’s FDI links). The exchange of patents between the North and emerging economies is lower (16% of the world’s flows). A possible explanation is that technology owners are not so confident in the enforcement of IP rights in the South. The case of least-developed countries is totally different. The three indicators convey the same message: they do not import climate-mitigation technologies. What about South–South technology flows between emerging economies? The transfer of climate-related patents or FDI flows between developing countries hardly exists (less than 1% of cross-country patent flows, 1.9% of FDI links), but trade becomes significant (10% of the world total). Remember that trade embodies less knowledge than other channels of technology transfer.
0%
1%
2%
3%
4%
5%
6%
7%
1990 1992 1994 1996 1998 2000 2002 2004 2006
Climate
Non-climate

- Promoting the International Transfer of Low-Carbon Technologies -
20 October 2013
Table 4: Origin - destination matrix: distribution of exported patented inventions, international trade of low-carbon capital goods, and FDI links
Patent flows Destination
Origin OECD Emerging economies Least developed countries
OECD 75% 16% 2%
Emerging economies 5% <1% <1% Least developed countries 2% <1% <1%
Circulation des brevets Destination
Origine OCDE Économies émergentes
Pays les moins avancés
OCDE 75 % 16 % 2 %
Économies émergentes 5 % <1 % <1 %
Pays les moins avancés 2 % <1 % <1 %
Capital goods Destination
Origin OECD Emerging economies Least developed countries
OECD 55% 19% <1%
Emerging economies 14% 10% <1% Least developed countries <0.1% <0.1% <0.1%
FDI links Destination
Origin OECD Emerging economies Least developed countries
OECD 66% 30% 1% Emerging economies 2% 2% <0.1% Least developed countries 0% 0% 0%
Source: Authors’ calculations based on PATSTAT data, COMTRADE and ORBIS data. We use a 3-year average to mitigate the effect of annual fluctuations for trade and patents. In Table 5, we consider emerging economies individually. Along with the three channels of technology diffusion, as a comparison we report on the size of each country as a share in the world's GDP. The table suggests that the intensity of technology transfers in China, Mexico and South Africa is in line with the economic size of the country. In contrast, other emerging economies appear less integrated in the global flows of technology. Statistics on technology transfer through the Clean Development Mechanism find results in line with these patterns: China hosts about 45% of the world’s CDM projects (CDM Pipeline 2013) and 59% of the Chinese projects involve a technology transfer compared to 12% for projects located in India, or 40% in Brazil (Dechezleprêtre et al., 2009). Hence the analysis of technology transfer towards the South and the formulation of policy lessons require distinguishing three groups of developing countries:
− China, Mexico and South Africa: they already appear integrated in the global exchange of technologies. To a lesser extent, Brazil is also well connected to international flows of knowledge through FDI.

- Promoting the International Transfer of Low-Carbon Technologies -
October 2013 21
− Russia and India: much fewer technologies have been transferred to them until now. They account for 3.3% and 4.9% of the world’s GDP whereas, depending on the indicator used, the size of inward transfers represents between 1.3 and 2.2% for the former and about 1.5% for the latter.
− Least developed countries: receive little technology. The table also displays (in brackets) the percentage for all technologies - climate and non-climate. Interestingly, the patterns are different for patents and international trade.1 While the transfer through patents of climate-friendly technologies is higher than the average, the reverse is true for the international trade of equipment goods. This suggests that trade barriers exert a stronger influence than obstacles to patenting activity in the specific case of climate technologies.
Table 5: Low-carbon patent inflows, import of capital goods, foreign direct investment, economy size in selected emerging economies as a share of world
total
Country Patent inward flowsa
Import of low-carbon equipmentb
FD inward FDI linksc
Economy size (GDP)
China 15.5% (12.2%)
8.3% (15.3%)
7.1% 11.1%
Mexico 2.2% (1.6%)
1.7% (3.0%)
2.5% 2.2%
Russia 1.3% (0.9%)
1.4% (1.8%)
2.2% 3.3%
South Africa 1.2% (0.8%)
0.4% (0.6%)
0.9% 0.7%
India n.a. (n.a.)
1.5% (1.5%)
1.6% 4.9%
Brazil 0.7% (0.5%)
0.7% (1.1%)
2.5% 2.9%
Source: PATSTAT, COMTRADE and ORBIS data. Notes: Results for all technologies and equipment goods appear in parentheses. a Average of patent flows to the country as a share of world inward flows, covering 25 technology classes, except agriculture and forestry (2007-2009). b Average of the import of low-carbon equipment as a share of world imports, covering 18 products/sectors: hydro, wind, solar photovoltaic and thermal, nuclear, energy storage, electric and hybrid vehicles, rail locomotives, cement, insulation, lighting, economizers, super-heaters, soot removers, gas recoverers (2007-2009). c Capital links between a source company owning at least one low-carbon patent and a foreign company in 2011 as a share of world total.
Table 5 also gives an indication about the relative importance of the two main market channels of technology diffusion (FDI and trade of capital goods). Certain countries, like Mexico, Russia and Brazil, tend to rely more on FDI, which is good news as direct investment potentially entails larger knowledge transfer as explained in Section 2. More generally, there exists a lot of heterogeneity in the mechanism leading to technology transfer across sectors. In Box 1, we compare how transfer towards China occurred in the wind and photovoltaic sectors. Although the outcome is similar - China’s companies became world leaders in a few years - stories are completely different: PV companies became the largest exporters of PV cells and modules by
(1) Data for FDI links are not available.

- Promoting the International Transfer of Low-Carbon Technologies -
22 October 2013
purchasing western turnkey production lines and hiring top executives among the Chinese diaspora. Wind producers focused on the domestic market and accessed technologies through joint-venture and licensing agreements with western and Japanese producers. However, in both cases, competition played a key positive role by maintaining low prices (in the market of equipment goods in the PV sector, in licensing markets in the wind industry).
Box 1: Technology transfer towards China in the wind and photovoltaic sectors In just a few years, China became a world leader in the manufacturing of both photovoltaic panels and wind turbines. Following the Danish wind turbine maker Vestas, four Chinese manufacturers could be found in the top 10 manufacturers in 2011 (including Sinovel and Goldwind, which respectively rank 2nd and 3rd, each with a market share of about 9% worldwide). In the PV sector, their success is even more impressive: China now manufactures almost half of the world’s solar photovoltaic panels and is the home country of the world's leading corporation, Suntech. How did Chinese companies acquire the necessary technologies? What factors can explain their economic success? Chinese PV producers have acquired the technologies and skills necessary to produce cells and modules through two main channels: the purchase of manufacturing equipment in a competitive international market and the recruitment of skilled executives from the Chinese diaspora who built pioneer PV firms (de la Tour et al., 2011). This development has been driven by foreign demand: Until very recently, Chinese cell and panel production was almost entirely exported in industrialized countries. The Chinese wind industry has followed a very different developmental path, with limited international trade and domestic firms producing turbines installed at home, which is now the world largest market (Kirkegaard et al., 2009). Most Chinese wind farms are, however, registered under the Clean Development Mechanism, meaning that domestic demand has been (partly) financed by foreign buyers of emissions’ reduction credits. In early projects, turbines were initially provided by companies located in OECD countries, but more recent projects use locally produced turbines. Cross-border investment rather than trade has been the dominant mode of technology transfer. Licensing arrangements have also played a key positive role, one reason being that strong technological competition has maintained rather low licence royalties. What makes the wind industry so different from the PV industry? Two major reasons come to mind; the first is technological. Compared to solar modules or cells, wind equipment - such as blades and towers - is costly to transport over long distances. Direct investment is thus necessary to enter foreign markets. The second reason is political: China has made more effort to promote domestic installations of turbines, complementing CDM funding with domestic incentive schemes (e.g., feed-in tariffs), most probably because wind is a much cheaper source of renewable energy than PV. The success of these firms is, however, not reflected in their performance in terms of innovation. Between 2007 and 2009, Chinese inventors only generated about 5% and 3% of the world's PV and wind patented inventions, respectively.
The level of diffusion towards the South varies a lot across technologies as shown in Figure 3. While around 10% of the inventions related to CCS or cleaner coal are protected in at least one developing country, the rate is only about 2% for insulation,

- Promoting the International Transfer of Low-Carbon Technologies -
October 2013 23
geothermal and hydroelectric technologies. We will examine in the next section whether this fits with emissions’ reduction potential available in the developing world. For most technologies, the rate is higher than that of the average non-climate technology (see the red bar in Figure 3). Figure 3: Share of international inventions filed in at least one developing country,
by technology (2007-2009)
Source: Authors’ calculations based on PATSTAT data. ‘No climate’ is the average across all technologies that we have identified as not climate-related. The data suggest a negative correlation between the level of patented technology transfer towards developing countries and the stage of technology development (Figure 4). This pattern is surprising as it means that developing countries are more likely to attract more advanced technologies than mature ones. A possible explanation lies in the weakness of domestic climate policies in the South today, which do not encourage the transfer of ready-to-use technologies. This is less of a concern for more advanced technologies that might be used in the next decade, at which time climate policies might have been implemented in the South.
0%
1%
2%
3%
4%
5%
6%
7%
8%
9%
10%
Clea
ner c
oal
Non
CO
2 cs
CCS
Nuc
lear
Fuel
eff.
Biof
uels
Ligh
ting
Stor
age
Elec
. hyb
.
Hydr
ogen
Win
d
Fuel
cel
l veh
icle
s
Alum
inum
Was
te
Cem
ent
Sola
r PV
Non
-clim
ate
Elec
. dist
rib.
Sola
r the
rmal
Mar
ine
Heat
ing
Insu
latio
n
Geo
ther
mal
Hydr
o

- Promoting the International Transfer of Low-Carbon Technologies -
24 October 2013
Figure 4: International inventions patented in developing countries by stage of technology development
Source: Authors’ calculations based on PATSTAT data; World Development Report (2011) for development stages. 3 Which technologies should be transferred and to which
countries?
3.1 Methodological approach A key goal of the study is to make recommendations as to which technologies and which geographical areas should be given priority. In this section, we use a very simple criterion. A technology should be given priority if:
• Its abatement potential – the amount of emissions’ reductions that the implementation of the technology can achieve at a reasonable cost – is high.
• Transfer is limited today Similarly, a priority region is one for which the inward technology flow is low whereas the abatement potential is high. The choice of this unique criterion stems from the rather narrow normative perspective adopted in the analysis: We assume that the objective of climate policy is to maximize climate change mitigation at the global level, and we look at the most effective way to achieve this. In doing so, we rule out general economic criteria, such as the recipient countries’ economic and development, co-benefits of technology transfer, and

- Promoting the International Transfer of Low-Carbon Technologies -
October 2013 25
distributional aspects across countries, which, in practice, decisively influence source and recipient countries’ political acceptability of technology transfer. Importantly, this is desk research. In this respect, the approach is in sharp contrast with that of the Technology Needs Assessments (TNAs, hereafter) encouraged under the UN Framework Convention on Climate Change. TNAs are bottom-up assessments by individual developing countries of the technologies they need to mitigate greenhouse gas emissions and adapt to climate change.1 Seventy countries have now produced their TNA, most of them being Least Developed Countries. From a methodological point of view2, our approach differs in three respects. First, we do not cover all the criteria listed in the TNA guidelines. In particular, we ignore the economic and development co-benefits of technology transfer as mentioned previously. The level of analysis is also different. TNAs look at technologies which are a priority in a given country. We look globally at technologies which are a priority and at the priority countries for all technologies. A final difference is procedural. TNAs are the outcome of consultative processes involving interested parties and the process is probably as important as its outcome for it involves actors who are supposed to play a key role in the implementation of the TNAs' recommendations. We use two major sources for measuring abatement potential: the McKinsey global greenhouse gas abatement curve describing abatement potential by 2030 at a cost less than USD 80/tCO2 and the International Energy Agency's Energy Technology Perspectives 2012. To calculate emission reductions, we compare the 2DS and the 6DS scenarios3.
3.2 Priority technologies at the world level In Figure 5, we plot climate change technologies in a graph where the horizontal axis is the quantity of emissions that can be abated worldwide by 2050 with the technology and the vertical axis is the share of inventions patented in at least two countries4 in the same technology. Note that Figure 5 does not describe the specific case of developing countries, as data on abatement potential in the South at the technology level is not available. The graph shows a positive correlation, which suggests that the larger the technology’s abatement potential, the wider its international diffusion. Using the Ordinary-Least-Squares (OLS) method, we are able to estimate a linear function which best represents the relationship between the two variables. We obtain the following function which is plotted in Figure 5:

- Promoting the International Transfer of Low-Carbon Technologies -
26 October 2013
We are now able to identify priority technologies; they are located below the line as they are those with little transfer and significant abatement potential in relative terms1:
− Hydro energy (hydro power stations; hydraulic turbines; submerged units incorporating electric generators; devices for controlling hydraulic turbines)
− Heating equipment in buildings (hot-water and hot-air central heating systems using heat pumps; energy recovery systems in air conditioning, ventilation or screening; heat pumps)
− Solar thermal technologies (use of solar heat for heating and cooling)
− Biomass (solid fuels based on materials of non-mineral origin, including waste)
− Wind energy
− Solar photovoltaic energy
Figure 5: Abatement potential and share of international inventions, by technology (2007-2009)
Source: Authors’ calculations based on PATSTAT data and ETP 2012 describing abatement potential by 2050 in the 2DS scenario in comparison with the 6DS (ETP, 2012, p. 480, Table 15.1). Solar PV = solar photovoltaic; CCS = carbon capture and storage. The straight line is estimated with the OLS method (R² = 0.617). Does the South have the capacities necessary to implement priority technologies? Remember that we measured technology-specific capacities with the stock of patented inventions developed by local inventors in the technology. Figure 6 compares the absorptive capacities for the 6 priority technologies with that of the
(1) Note that this assessment strategy relies on benchmarking: priority should be given to technology fields with high abatement potential relative to other technologies. But it is worth keeping in mind that, in absolute terms, the level of diffusion may still be too low even in technology areas which exhibit the largest potential in relative terms.
Biofuels
CCS
Elec. hyb. vehicles
Fuel Cell Vehicles
Fuel efficiency
Geothermal
Heating
Hydro
Building insulation + lighting
Nuclear
Solar PV
Solar thermal
Biomass
Wind
y = 0,1878x - 0,3615 R² = 0,617
10%
15%
20%
25%
30%
35%
40%
45%
2,5 2,75 3 3,25 3,5 3,75 4
Perc
ent o
f int
erna
tiona
l pat
ent f
amily
Log (annual CO2 savings in 2050)

- Promoting the International Transfer of Low-Carbon Technologies -
October 2013 27
average climate-friendly technology. The graph shows that more effort should be made to improve capabilities related to biomass and heating technologies.
Figure 6: Absorptive capacities in the South for priority technologies
Source: Authors’ calculations based on PATSTAT data.
3.3 Priority geographical areas in the developing world We follow the same procedure to establish priorities among geographical areas. Figure 7 shows a positive correlation between technology diffusion and the geographical distribution of abatement potential is positive: the size of technology imports captured by an index which is the average of the three indicators – patent imports, FDI links and trade of low-carbon equipment goods – is higher in countries with larger abatement potential. Using an OLS, the relationship between the size of transfer and the size of the abatement potential is best described by the following equation:
transfer index = 0.0735 log CO2 savings – 0.0063 Figure 7 indicates priority regions which are plotted below the regression line: India and the rest of developing Asia. Africa, which is very close to the regression line, can also be included. Figure 8 shows that these three regions also need enhanced technological absorptive capacities.
0.0%
0.2%
0.4%
0.6%
0.8%
1.0%
1.2%
Biomass Heating Average alltechno
Solar PV Wind SolarThermal
Hydro
Shar
e of
Sou
ther
n re
gion
's ab
sorp
tive
capa
citie
s by
tech
nolo
gy

- Promoting the International Transfer of Low-Carbon Technologies -
28 October 2013
Figure 7 : Potentiel de réduction et indice de transfert de technologies, par technologie (2007-2009), par région
Source: Authors’ calculations based on McKinsey (2010), PATSTAT, COMTRADE and ORBIS data. The straight line is estimated with the OLS method (R² = 0.7708). The index of technology transfer is the average of the share of imports to the region through trade, and FDI. The patent indicator is not used because data are not available for India.
Figure 8: Absorptive capacities in the developing world as a share of world
capacities
Source: Authors’ calculations based on PATSTAT and World Bank data. For each region, we compute the average percentage of technology-specific patent stocks located in the region and the average rate of tertiary enrolment in the region’s countries. The list of countries by region is given in Appendix 6.
China
Rest of developing
Asia
Latin America
Africa
India
Eastern Europe
Middle East
y = 0,0735x + 0,0063 R² = 0,7708
0%
1%
2%
3%
4%
5%
6%
7%
8%
9%
0 0,2 0,4 0,6 0,8 1 1,2
Inde
x of
clim
ate
tech
nolo
gy tr
ansf
er
Log(annual CO2 savings in 2050)
0%5%10%15%20%25%30%35%40%45%50%
0,0%
0,5%
1,0%
1,5%
2,0%
2,5%
3,0%
Africa China EasternEurope
India LatinAmerica
MiddleEast
Rest ofdeveloping
Asia
share of global absorptive capacities of climate technologies
average region tertiary enrollment (right axis)

- Promoting the International Transfer of Low-Carbon Technologies -
October 2013 29
3.4 A focus on coal-fired power generation The above analyses give an average view for each technology, ignoring country specificities (subsection 4.2) or by recipient geographical area without distinguishing the different technologies (subsection 4.3). In this section, we go one step further by looking at geographical priorities for a more specific set of two technologies. They aim at curbing emissions from coal-fired power generation: carbon capture and storage and cleaner coal -- that is, technologies such as coal gasification, improved burners, fluidized bed combustion, improved steam engines, superheaters which improve thermal efficiency and limit polluting emissions. Coal-fired power generation is crucial because abatement potential is considerable. For instance, the International Energy Agency estimates the coal sector would account for about 20 % of the total reductions required in the 2DS Scenario, which describes an energy system consistent with an emissions trajectory that would give an 80% chance of limiting average global temperature increase to 2°C (see Appendix 7 for more detail). Figure 9 describes the installed production capacities which are in line with that trajectory. It shows that, until 2030, technological needs mostly concern cleaner coal. Only the addition of CCS can deliver the needed cuts beyond this date. Importantly, plants fitted with CCS will also rely on cleaner coal technologies, as a high thermal efficiency is required to reduce the energy penalty resulting from the installation of carbon capture.
Figure 9: The evolution of production capacities of coal-fired power generation under the 2°C Scenario (2DS)
Source: IEA (2012) Technology Roadmap: High-Efficiency, Low-Emissions Coal-Fired Power Generation. Figure 10a shows capacities with cleaner coal technologies installed in the developing world under the 2DS Scenario as a function of the degree of technology transfer measured by the global share of FDI links. The latter is the only indicator of technology transfer available for the sample covered (all developing countries and cleaner coal technologies). The graph suggests that, in the short or mid-term, India and South Africa are the two priority targets for the transfer of cleaner coal technologies.
0
200
400
600
800
1000
1200
1400
1600
1800
2000
2015 2020 2030 2050
Capa
city
(GW
) cleaner coal with CCS
cleaner coal w/o CCS
coal-fired capacity w/o cleanercoal

- Promoting the International Transfer of Low-Carbon Technologies -
30 October 2013
Figure 10b is similar, except that it describes capacities with both cleaner coal and CCS technologies, most of which will be installed after 2030. In addition to India and South Africa, the list of priority countries includes China.
Figure 10a: Cleaner coal-fired power generation capacities without CCS and index of technology transfer, by region of the developing world
Figure 10b: Cleaner coal-fired power generation capacities with CCS and index
of technology transfer, by region of the developing world
Source: IEA (2012) Technology Roadmap: High-Efficiency, Low-Emissions Coal-Fired Power Generation for capacities. Authors’ calculations based on PATSTAT and ORBIS data for FDI links. Rest of developing countries includes 76 countries such as Brazil, Taïwan, Argentina and Venezuela.
ASEAN China Eastern
Europe/Eurasia
India
Rest of developing countries
South Africa
0%
2%
4%
6%
8%
10%
12%
14%
1 1,5 2 2,5 3
Glo
bal s
hare
of F
DI re
late
d to
cle
aner
coa
l te
chno
logi
es
Log (capacity of cleaner coal in 2050)
ASEAN China
Eastern Europe/Eurasia
India
Rest of developing countries
South Africa 0%
2%
4%
6%
8%
10%
12%
14%
16%
1 1,2 1,4 1,6 1,8 2 2,2 2,4 2,6 2,8
Glo
bal s
hare
of F
DI re
late
d to
CCS
te
chno
logi
es
Log (capacity of cleaner coal with CCS in 2050)

- Promoting the International Transfer of Low-Carbon Technologies -
October 2013 31
4 Which policy instruments? In this section, we review and discuss the different policy instruments and approaches available to promote international transfers of knowledge related to low carbon technology. We consider both the role of generic policy approaches that affect all technologies, such as Intellectual Property Rights, trade and FDI policies, and technological capacity building, as well as instruments specifically designed to address climate-related technologies such as project mechanisms, the Technology Mechanism, etc. ‘Enabling environment’ is the expression used in UNFCCC parlance to describe government policies and conditions that create and maintain an overall macroeconomic environment favourable to innovation and technology diffusion. The goal of this section is to identify and assess various components of such environments. The review is essentially based on economic literature on technology diffusion, which has produced a broad set of results on these issues.
4.1 GHG abatement policies as a prerequisite Creating the demand for low carbon technologies through policies that directly target climate change mitigation is a prerequisite for technology transfer. The reason is that cutting emissions is generally not yet profitable under standard market conditions. In the absence of public policies providing incentives for and imposing constraints on emissions, households and corporations are unlikely to adopt climate-friendly technologies. This conveys what is probably the most important message of this discussion of policy instruments. Increasing diffusion of technologies towards the South can only occur in the presence of ambitious climate policies (e.g., carbon taxes, cap-and-trade system, emission standards). Demand for climate technologies in developing countries can be locally created by domestic policies. This claim is supported by several econometric studies. Lanjouw and Mody (1996) find evidence that strict vehicle emission regulations in the US led to the transfer of up-to-date technology from Japan and Germany into the US. Popp et al., (2007) examine the case of chlorine-free technology in the pulp and paper industry and find an increase in the number of patents filed by US inventors in Finland and Sweden after passage of tighter regulations in these countries. Verdolini and Galeotti (2011) look at the diffusion of energy-efficient technologies across 38 countries. Dekker et al., (2012) study the impact of the Convention on Long-Range Transboundary Air Pollution on innovation and international technology diffusion. They show that signatory countries experience an increase in the inflow of foreign patents (as well as in domestic innovation). Of course, in a globalized world, domestic policies are not a necessary condition in order for technology transfer to happen. Corporations located in emerging countries can also import technologies with a view to serving foreign demand driven by climate policies implemented in western countries. This is illustrated by the photovoltaic industry, where Chinese PV companies acquired the necessary technologies abroad before exporting back PV cells and solar panels to countries such as Germany, Spain,

- Promoting the International Transfer of Low-Carbon Technologies -
32 October 2013
or the US where feed-in tariffs and renewable portfolio standards trigger massive installations of PV production capacities. Peters et al., (2012) investigate this question econometrically and find that domestic demand-pull policies in the solar PV sector induce innovation in foreign countries (while technology-push policies do not), thereby suggesting that domestic environmental policies also induce foreign innovation. Other econometric studies (Dechezleprêtre and Glachant, 2011; Berthelemy, 2012) find similar results for the wind and the nuclear industries. However, empirical evidence suggests that an additional benefit of domestic demand-pull policies is that they not only induce technology transfer by foreign manufacturers, but they also enhance domestic technology capacities. Promoting innovation is crucial for technology transfer as it increases the capacities to adopt foreign technologies, but also, once imported, to diffuse these technologies in the local economy. On a longer term, it is also prepares the country to export technologies. There is robust evidence that domestic environmental policies induce green innovation. Brunnermeier and Cohen (2003) show, for instance, that higher Pollution Abatement Control Expenditures have a positive effect on the number of environment-related patents. Other papers show that higher energy prices induce innovation in energy efficient technologies (Newell et al., 1999; Popp, 2002; Crabb and Johnson, 2010), which suggest that market-based instruments, such as taxes or cap-and-trade systems, have the same effect. Another advantage of abating pollution at home is that it is the only way to reap so-called learning-by-doing benefits. It has been acknowledged for years that innovation does not only result from activities located in research labs, but also from the mere fact of using the technologies in the field (through accumulation of experience, economies of scale, etc.).
4.2 Technological capacity building As Blomström et al., (1994) put it, ‘‘the rate of economic growth of a backward country […] depend[s] on the extent of technology transfers from the leading countries and the efficiency with which they are absorbed and diffused’’. Various factors – such as availability of skilled technical personnel, information on available technologies, social institutions that reduce transactions costs – determine this ability to successfully absorb foreign technologies. They are usually referred to as a country’s absorptive capacities (Fagerberg, 1994; Keller, 1996; Worrell et al., 1997; Griffith et al., 2004; Kneller and Stevens, 2006). There is strong evidence in trade literature that absorptive capacities in recipient countries are a key condition for cross-border transfers of advanced technology (Keller, 2004). Eaton and Kortum (1996) show, for instance, that countries with strong absorptive capacities such as Japan and European OECD countries derive almost all of their productivity growth from R&D carried out abroad. Absorptive capacities also facilitate local knowledge spillovers from international trade and FDI, and thus wider diffusion of this knowledge within the recipient country. Borensztein et al., (1998) find, for example, that FDI has a stronger effect on economic growth than domestic investment, if the host country has a minimum threshold of human capital. Similarly, the flow of advanced technology brought by FDI can increase the growth rate of the host economy only by interacting with that country’s absorptive capability (Keller, 2004). These general studies have been confirmed in studies looking specifically at

- Promoting the International Transfer of Low-Carbon Technologies -
October 2013 33
low-carbon technologies (e.g., Dechezleprêtre et al., 2013, Verdolini and Galeotti, 2011). Helping developing countries to build absorptive technological capacities should thus be given priority through various means, including cooperative research, development and demonstration programs. As shown in Figure 11, green technologies draw on scientific knowledge from many sciences, among which energy and environmental sciences only account for about 12 percent. It suggests that encouraging education and training in narrow technology fields may be less important than generic programs addressing a broad range of disciplines. As an illustration, Chinese PV companies have benefitted a lot from knowledge spilling over from the semi-conductors industry, a sector which has little to do with climate change − at first glance.
Figure 11: The innovation-science link in green technologies (2000-2007)
Source: Measuring Innovation: A New Perspective, OECD (2010)
4.3 Intellectual property rights Whether a stronger IP regime fosters the transfer of climate-mitigation technology to developing countries is a controversial issue in international discussions. There are serious arguments with opposite conclusions:
− IPR is a property right, and the existence of property rights is a precondition for the emergence of markets that will diffuse technologies across market participants.
− IPR confer legal exclusivity to inventors for 20 years. If the technology does not have efficient and reliable substitutes, the inventor can thus use his market power to raise price barriers, thereby hindering the diffusion of the technology itself or the goods in which the technology is embedded.
− In return for legal exclusivity, patenting requires the inventor to publicly disclose information on the technology. This publication generates positive knowledge spillovers as other inventors may draw inspiration to develop new technologies. This characteristic of IPR is in sharp contrast with other tools used by innovators

- Promoting the International Transfer of Low-Carbon Technologies -
34 October 2013
to keep control over their technologies, such as trade secrecy, which generally slows down knowledge diffusion.
As a result, there is no definite answer based on theoretical arguments as to whether IPR promote technology diffusion or not and it is thus necessary to rely on empirical studies which have tested the different hypotheses. General studies not dealing specifically with climate change technologies suggest that strict IPR have an overall positive effect on the volume of foreign technology transfers to developing countries. This effect is especially clear when the recipient country is technologically advanced and open to international trade (Sampath and Roffe, 2012). In this case, strong local absorptive capacities enable effective transfers, but also create a serious threat of imitation for foreign innovators (Maskus, 2000; Smith, 2001; Hoekman, Maskus, and Saggi, 2005; Mancusi, 2008; Parello, 2008). Because it provides a safeguard against such imitation, strong IP protection then facilitates technology transfers in the recipient country. There is also empirical evidence that it encourages the use of knowledge-intensive channels such as FDI and licences, instead of the mere export of equipment goods (Smith, 2001). Since the positive effect of IPR depends on the existence of a threat of local imitation, it mostly concerns those recipient countries that already have technology capabilities, such as emerging economies. By contrast, stronger IP protection may not induce transfers in countries that lack such capacities – since in that case the threat of imitation is not a serious deterrent for foreign firms – and could generate stronger monopoly rents for foreign firms (Maskus, 2000; Smith, 2001). A few studies confirm these insights in the specific case of climate-friendly technologies. For example, Dechezleprêtre et al., (2013) find that lax intellectual property laws have a negative impact on inward flow of foreign patents for various types of climate-mitigation technologies. This impact is stronger than that of barriers to trade or FDI: on a common 1-to-10 scale, increasing IPR strictness by one unit raises patent transfers by 27–60%, whereas lowering trade barriers by one unit leads to 7–15 % more patent transfers, and relaxing barriers to FDI by one unit increases patent flows by only 4.5–8 %. Case studies suggest that IPR do not eliminate competition in environmental technologies’ markets: Barton (2007) shows that patenting has so far not been a barrier to the transfer of solar PV, wind power, and biofuel technologies to emerging economies. This result is confirmed by other papers: see in particular the analysis of the wind sector by Kirkegaard et al., (2009), that of the PV sector by Dechezleprêtre et al., (2011), and the study of the transfer of integrated gasification combined cycle—the most efficient coal power technology—to India (Ockwell et al., 2008). These results are driven by the fact that climate-friendly technologies mostly exist in mature sectors where numerous substitutes can compete at the global scale. In this respect, the situation for low carbon technologies is not comparable today with the pharmaceutical industry in which certain drugs have no substitutes, or with information technologies in which the existence of technical complementarity and compatibility issues can result in so-called “patent thickets”. One can, however, not exclude that the discovery of a “breakthrough” invention in technology fields such as CCS, smart grids, or biofuels leans towards the pharmaceuticals or IT patterns in the future.

- Promoting the International Transfer of Low-Carbon Technologies -
October 2013 35
A general drawback of the patent system is that it is a one-size-fits-all approach: although it applies to very different technologies and sectors, rules are uniform (e.g., the same duration). Box 2 lists and discusses the potential of various solutions, which have been put forward to introduce flexibility in patent law for climate-friendly technologies.
Box 2. Specific IP instruments for climate technologies (Maskus, 2010)
A large array of proposals has been put forward to introduce flexibility in IP law for climate technologies and/or promote specific IP-based instruments to encourage the diffusion of knowledge in developing countries. These proposals have been reviewed in detail in a recent OECD study by Keith Maskus (2010). We summarize here his main conclusions.
i) Exclusions from patentability. This option has been suggested by some developing countries to facilitate access to climate inventions. However, it is likely to be counterproductive because suppressing patents would cut incentives to innovate and subsequently diffuse the technology through market channels. Exclusion from patenting would also prevent knowledge spillovers from the disclosure of patents. Finally, suppressing patents would not help in diffusing the know-how that is usually a necessary complement to patented inventions.
ii) Compulsory licensing. This option draws on the flexibility of the TRIPS agreement1 allowing countries to unilaterally force the transfer of patented inventions under a series of conditions (listed in Article 31). It is unlikely to bring significant results in the case of climate technology. It is complex to administrate and requires enough domestic capacity to produce the licenced technology. Moreover, compulsory licensing does not give access to the know-how required to effectively use most climate technologies, and may, on the contrary, deter a foreign inventor from transferring this knowledge through e.g., FDI.
iii) Competition policy. Since patents are unlikely to represent significant barriers to technology transfers in the field of climate technology, Maskus (2010) suggests that establishing antitrust safeguards against their potential abuse would be more sensible than drastic measures such as patent exemptions of compulsory licensing. This would mainly imply investing in capacity building and training of competition authorities in targeted developing countries.
iv) Patent landscaping. Patent databases and recent patent landscaping software represent a huge source of information on available technologies in a given field: to find inspiration for R&D projects (spillovers), to identify potential blocking patents, or to buy existing technology. However, using these software and databases is difficult and costly, and requires specific know-how. Developing such instruments and making them accessible for a large public could therefore be a very useful step for promoting the circulation of knowledge in climate technology.
v) Voluntary patent pools. This option consists in inviting firms, universities and research institutions to put all their patents related to a particular technology in a single pool, so as to propose to users a single packaged licence and thereby reduce both transaction costs and cumulative royalty rates. Since such patent pools make sense only for technologies that include a large number of patented elements (typically in electronics and information technology), it is unclear yet to which type of climate technology they could apply, with the exception perhaps of new emerging technologies based on biotechnologies and synthetic fuels. Another difficulty is that private inventors are often reluctant to put their patents in a pool.
(1) The Agreement on Trade Related Aspects of Intellectual Property Rights (TRIPS) is an international agreement administered by the World Trade Organization (WTO) that sets down minimum standards for many forms of intellectual property (IP) regulation as applied to nationals of other WTO members.
- Promoting the International Transfer of Low-Carbon Technologies -
36 October 2013
The Eco- Patent Commons pool launched by IBM, Nokia, Pitney Bowes and Sony may be viewed as a counter-example, but a recent study suggests that it includes 238 patents with little value (Hall and Helmers, 2011). Yet, pooling patents from universities and public research institutions could represent a powerful leverage to promote the development and diffusion of key emerging technologies.
4.4 Barriers to trade and foreign direct investment As argued before, international technology transfers take place through market channels such as trade or FDI. As a result, they tend to occur more frequently in open economies (Saggi, 2002; Hoekman et al., 2005). Moreover, open trade tends to increase competition and remove unproductive rent-seeking activities (see Keesing, 1967; Bhagwati and Krueger, 1973; Kreuger, 1974; Bhagwati, 1982), thereby enhancing the recipient country’s efficiency and absorptive capacities (Henry et al., 2009). Accordingly, lowering barriers to trade and FDI is an effective policy leverage to foster the transfer of climate-mitigation technologies. Duke, Jacobson, and Kammen (2002) show, for example, that the reduction of tariffs on solar modules in Kenya increased imports of PV systems. Regarding FDI, evidence suggests that foreign investment responds to an adequate business environment, including governance and economic institutions (Maskus, 2004). Dechezleprêtre et al., (2013) show that higher barriers to trade (tariff rates) and FDI (capital control) also hamper the international diffusion of patented knowledge. Depending on the technology, a 1-unit increase in trade barriers on a common 1-to-10 scale leads to 7–15% fewer imports of patents, while a 1-unit increase in FDI barriers leads to 4.5–8% fewer imports. The same study also shows that climate-mitigation technologies do not differ in this respect from other technology fields. It is, however, worth discussing further the design of these regulations in more detail. Non-tariff barriers such as local content requirements – which make it mandatory to give preference to local contractors and locally manufactured materials and equipment – or regulations promoting joint ventures with a local partner instead of greenfield investments or mergers and acquisitions, are widespread practices in climate-related industries. They have been implemented in the wind industry in countries including Canada, China, Spain, Brazil, India, Australia and Portugal with varying levels of success. Another example is the Chinese law on Clean Development Mechanism projects which states that foreign ownership of a CDM project shall not exceed 49%. Such provisions have ambiguous effects on technology transfer and diffusion. On the one hand, they obviously lower the incentives for foreign companies to invest locally and reduce imports of equipment goods. On the other hand, they may help the diffusion of technologies within the economy. This is the main goal of regulations promoting joint ventures, whose objective is to encourage the transmission of knowledge and skills to local partners. The net result of these two effects is likely to vary a lot across sectors and countries. But, it can be positive in sectors and countries where the size of the market and the absorptive capacities are sufficient to attract foreign investors despite these constraints.

- Promoting the International Transfer of Low-Carbon Technologies -
October 2013 37
However, reducing these barriers raises specific issues in the case of climate-friendly technologies. A first issue concerns the potential existence of carbon leakage and the role of border tax adjustment. Governments in developed countries fear that strict domestic climate policies, by raising production costs of domestic companies relative to competitors located in foreign countries with laxer policies, may damage the competitiveness of domestic companies. Climate policies would then not only fail to achieve their environmental objective through an increase in carbon emissions abroad – a phenomenon called carbon leakage – but also destroy jobs at home. This concern has led some countries, including the European Union and the United States, to consider introducing border measures which would essentially aim at levelling the playing field by imposing the same costs on imported goods and on domestic products. To level the playing field on world markets, exports could also be exempted from domestic carbon regulations. In practice, border tax adjustment could be achieved through a carbon tax based on the carbon content of the imported product, the rate of which rate would bridge the gap between the domestic and the foreign carbon price. In the European Union, preference is given to a scheme whereby importers would need to acquire allowances in cases where carbon leakage is occurring in the competing domestic sector. If properly designed, such schemes could be compatible with WTO rules as environmental objectives are part of general exceptions to the GATT in Article XX (see WTO/UNEP, 2009, or Pauwelyn, 2012). What about the potential impact of border tax adjustment measures on technology transfer? In the short term, they cannot but have a negative impact, by lowering western companies’ incentives to locate part of their activities in the developing world. They can also trigger trade wars, leading certain developing countries to impose trade restrictions in retaliation for these measures. Long-term impacts are more uncertain: an implicit goal of these measures is to provide emerging economies’ governments with an incentive to strengthen domestic climate policies. As argued before, this could boost the local demand for low carbon technologies.
4.5 The Clean Development Mechanism and other carbon market mechanisms
The Kyoto Protocol’s Clean Development Mechanism (CDM) allows industrialized countries that have accepted emission reduction targets (Annex 1 countries) to develop or finance projects that reduce greenhouse gas (GHG) emissions in other countries in exchange for emission reduction credits. While its primary goal is to save abatement costs, the CDM also provides technical and financial support for the diffusion of climate technology in non-Annex 1 countries1. If the technology used in the project is not available in the host country, the project leads de facto to a cross-border technology transfer. Several empirical studies have been conducted in order to assess whether the CDM has encouraged North-South technology transfer (de Coninck et al., 2007; Haites et al., 2006; Seres, 2007; Dechezleprêtre et al., 2008; Schneider et al., 2008; Doranova et al., 2009). They conclude that roughly 40% of CDM projects induce a technology transfer. These transfers mostly concern technical equipment and/or know-how, (1) Note that the CDM did not originally have an explicit technology transfer requirement in the Kyoto Protocol. This was included later in the 2001 Marrakech Agreement.
- Promoting the International Transfer of Low-Carbon Technologies -
38 October 2013
rather than patented inventions1 (Dechezleprêtre et al., 2008). Transfer is more frequent in large projects, and in projects directly involving Annex 1 companies either through local subsidiaries or as credit buyers (Dechezleprêtre et al., 2008). Technology transfers are not evenly distributed across CDM recipient countries, due to their different profiles in terms of abatement opportunities and absorptive capacities. As of 2007, Mexico, China, Brazil and India – which together accounted for 75% of validated projects – benefited from transfers in respectively 60%, 59%, 40% and 12% of their projects (Dechezleprêtre et al., 2009). These differences are partly due to the specialization of countries in some particular type of project, such as breeding biogas recovery in Mexico and Brazil, or wind power in China. However, transfers to Mexico and Brazil have mainly been driven by the strong involvement of foreign partners and good technological capabilities, while investment opportunities generated by fast-growing economies played a more important role in China and India. The high rate of international transfer in China also reflects its strong absorptive capabilities. By contrast, India has lower absorptive capacities and most Indian CDM projects use locally available technologies. Despite these achievements, it is widely admitted that the CDM falls short of achieving the full potential of developing countries in terms of both GHG abatements and technology diffusion. A first general explanation lies in the high transaction costs that result from the tight evaluation methodologies and monitoring procedures required for each project (see e.g., Hampton et al., 2008). The CDM framework is also inappropriate when the scale of the project cannot account for all the economic mechanisms at stake – for instance, when there are synergies or economies of scale between different projects2 (Glachant and Ménière, 2011). CDM methodologies similarly prove ill-suited to complex projects involving capacity building and/or public policy actions (e.g., a modal shift in the transport sector, or smart-grid transition). Against this background, several evolutions of the CDM have been envisaged so far, which all consist in relaxing the mechanism by widening the scope of projects. A first modest step in this direction has been made with the implementation of programmatic CDM, which consists of pooling different CDM projects within one single "program" so as to reduce the transaction costs linked to their formal validation. More importantly, the Durban Platform adopted in the 2011 COP commits parties to formulate a so-called New Market Mechanism (NMM) under the 2015 agreement. The nature of this mechanism remains vague and rule-setting has been deferred to the 2013 COP in Warsaw. In contrast with the CDM, the NMM could be sectoral in nature. It would go beyond the pure offsetting of emissions and produce a net atmospheric benefit. It could also include sectoral crediting or trading, forming a stepping-stone towards a system of globally linked economy-wide cap-and-trade systems.
(1) Technology transfers mainly concern two areas, namely i) wind power and ii) end-of-pipe destruction of non-CO2 GHG with high global warming potential (such as HFCs, CH4 and N2O) in the chemical, agricultural and waste management sectors. Other projects, such as electricity production from biomass or energy-efficiency measures in the industry sector, mainly rely on local technologies (Dechezleprêtre et al., 2008). (2) The CDM project led by Indocement in Indonesia is an example (Glachant and Ménière, 2007). With the help of Germany’s Heidelberg Cement, Indocement has borne the cost of initial development and certification of a new hybrid type of cement, based on locally available components whose production requires less energy. Subsequently, this first project triggered other similar projects in the country.

- Promoting the International Transfer of Low-Carbon Technologies -
October 2013 39
Like the CDM, the prime goal of the NMM would not be technology transfer. But there are good reasons to think that it can perform better than the CDM in this dimension. The sectoral scope allows economies of scale and better coordination in the removal of common technological and financial barriers. It enhances the possibility of using public policy levers at the sectoral level, which can focus on infrastructure investment and the development of the technical capacity needed to achieve projects (capacity building). It could also facilitate the internalization of learning spillovers. Since 2010, Japan has advocated in favour of the so-called Bilateral Offset Crediting Mechanism (BOCM). The mechanism is similar to the CDM in that a funding country (Japan) invests in emission reduction projects – and potentially programs – in developing countries and gains offsetting credits. The key difference lies in a simplified procedure which stays mostly at the bilateral level, whereas the CDM is administered by the UNFCCC. The BOCM is viewed by many as an instrument for Japan to export its technologies abroad in a framework allowing the sharing of economic benefits between the two participating countries.
4.6 Business-led initiatives
Business-led initiatives are broad international agreements between companies belonging to the same sector, whose objective is to better coordinate their GHG mitigation actions through information sharing, technology sharing, or joint technology development.
There currently exist three main examples of such agreements, namely the Cement Sustainability Initiative, the International Aluminium Institute, and Worldsteel (See Box 3 below). Other agreements between manufacturers differ from these initiatives because of their smaller geographic scale and/or the participation of public authorities. This is, for example, the case of voluntary agreements between industry associations and the Japanese government or the European Commission. The Asia Pacific Partnership on Clean Development and Climate is another original type of agreement, insofar as it involves several states and industrial sectors in the framework of a public-private partnership. However, these activities are similar to the ones carried out within the steel, cement and aluminium sectors agreements.
Box 3: Three examples of business-led initiatives
Launched in 2000 by the WBCSD (World Business Council for Sustainable Development), the Cement Sustainability Initiative (CSI) aims to develop a sustainable development strategy for the cement industry, and therefore incorporates climate change mitigation into its objectives. In February 2011, this initiative included 23 major cement groups, present in more than 100 countries, and accounting for more than 40% of the world's production. In the aluminium sector, the International Aluminium Institute (IAI) includes 27 industrial companies that represent about 80% of the world's production. Under the program Aluminium for Future Generations, IAI members agreed in 2009 on a list of voluntary targets to improve environmental sustainability in the production of aluminium: i) cutting emissions of PFCs (perfluorocarbons); ii) reducing the energy needed to melt a ton of aluminium in 2010 by 10%

- Promoting the International Transfer of Low-Carbon Technologies -
40 October 2013
compared to 1990; and iii) contributing to the reduction of emissions in transport by reducing the weight of aluminium components.
In the steel industry, the World Steel Association was established in 1967 and comprises 180 steel producers, including 19 of the 20 largest producers. Members cover 85% of the world's production, including major emerging countries (China, India, Brazil). The association aims to promote a sustainable development of the industry. It has labelled the fight against climate change as a priority.
The sectors concerned by these initiatives share several notable features. The aluminium, cement, and steel industries rank among the highest GHG emitting sectors. They are therefore identified as priority candidates1 for setting up carbon abatement mechanisms at the sector level (Egenhoffer and Fujiwara, 2008). Despite different degrees of exposure to international competition, these sectors are also highly concentrated at the international level, and dominated by a limited number of multinational companies present in many countries2. These characteristics imply a certain degree of homogeneity between firms in different countries, which reinforces the relevance of a sectoral approach. The limited number of players and their international scope is also likely to facilitate coordination in joint initiatives (Olson, 1965).
These joint initiatives usually pursue two main objectives:
1. They firstly develop benchmarks and collect data on their respective GHG emissions (Baron and Ellis, 2006; Fujiwara, 2010). Producing and disclosing such information is both costly and risky for companies, for it may encourage public regulation. However, the benchmarking of measurement methods and collection of data by the industry can also be a way to anticipate new regulations by public authorities, and so influence them in a favorable direction (CCAP, 2008). Companies in developed countries also perceive the collaborative approach as a means to facilitate the involvement of firms from developing countries in climate change mitigation. Indeed, a common approach to benchmarking makes it possible to identify in advance issues pertaining to data collection and the need for capacity building in some countries.
2. They also aim to encourage the development and dissemination of technologies across the industry, which is also likely to attract manufacturers from developing countries (CCAP, 2008). This can take place through three types of action, requiring an increasing degree of cooperation (Baron and Ellis, 2006; Fujiwara, 2010), namely:
a. Technological benchmarking to identify and compare low-carbon technologies that are – or may be – used by manufacturers;
b. Sharing best practices and/or know how;
c. Cooperation to develop new technologies that could be used by all partners.
(1) Other candidates include a small number of large producers in the chemical, pulp and paper and energy sector whose activity is particularly energy-intensive. (2) As of 2007, the 10 largest actors accounted respectively for 26%, 25% and 54% of global production in the steel, cement and aluminium industries (Viellefosse, 2007; Baron et al., 2007; Egenhoffer and Fujiwara, 2008).

- Promoting the International Transfer of Low-Carbon Technologies -
October 2013 41
Yet, so far industry-led initiatives do not seem to have resulted in major achievements in terms of carbon abatement and technology development and diffusion. Most of the action initiated by the CSI, IAI and World Steel are limited to benchmarking and sharing best practices. Only World Steel has launched a long-term R&D cooperation program, while the ambitions of CSI in the matter have apparently not materialized yet. These modest achievements pertain to the lack of incentives for firms to actively cooperate in sharing strategic information and technology with their rivals. Since industry-led initiatives are primarily meant to anticipate the implementation of binding sector regulations in a large enough number of countries, they may yet come to play a more important role were such regulations to be adopted (or the threat thereof to be serious). In that case, they could prove an interesting instrument to shape and harmonize these regulations at the international level – including by facilitating the participation of developing countries in such policy schemes – and to organize joint compliance through the development and diffusion of climate technologies.
4.7 Natiolanny Appropriate Mitigation Actions (NAMAs) Up to 2020 at least, developing countries will not be subject to a binding emissions cap under the UNFCCC. Until then, developing countries are asked to undertake voluntary Nationally Appropriate Mitigation Actions (NAMAs) in order to reduce their GHG emissions below the business-as-usual scenario. Various potential measures can fall under a NAMA and these can become a mix of policies, measures and programs over various sectors. NAMA’s framework thus allows developing countries’ governments to define differentiated sectoral strategies depending on the local context (Helme, 2010). Such strategies may combine private investment with regulatory measures and/or public investment in capacity building. Accordingly, NAMAs can be divided into three broad categories of action (Helme et al., 2010):
− Unilateral NAMAs developed with domestic resources without any compensation from the developed countries.
− Supported NAMAs involve developed countries ex ante through funding, technology transfer or capacity building. Financing is supposed to be channelled through bilateral or multilateral donors or through facilities officially approved by the Conference of the Parties (COP), such as the Green Climate Fund or the Global Environmental Facility.
− Credited NAMAs – which are not officially recognized in the negotiations – in which action can be funded through ex post mechanisms of carbon credits. In this case, the contribution of developed countries is less straightforward as it involves the purchase of carbon credits, either directly by the Government or by actors subject to the system of tradable permits.
Roughly speaking, NAMAs are domestic climate policies in developing countries. There is thus nothing general to say about their links with technology transfer. But there are interesting concepts of NAMAs with a technology focus. As an example, China has been considering sectoral technology-based NAMAs (Box 4). The key idea is to express NAMA’s objectives in terms of types of technologies, instead of emissions targets. This would facilitate monitoring and reporting, make the link

- Promoting the International Transfer of Low-Carbon Technologies -
42 October 2013
between funding and business activity clearer, and fit with industrial policy tools implemented in China. Box 4: Technology-Based Sectoral NAMAs: a Preliminary Case Study of China’s Cement
and Iron and Steel Sectors (Klein et al., 2009) Experts from the Center for Clean Air Policy (CCAP) in cooperation with Tsinghua University have developed a model of technology-based NAMAs which could contribute to emissions’ cuts by 2020 in the Chinese power, steel and cement sectors. They propose a technological approach that they deem suitable for verification problems inherent in developing countries. According to their estimates, the production of these industries is expected to increase considerably in the coming years: +136% from 2009 to 2020 for steel, +230% between 2009 and 2025 for the electricity sector, and +393% between 2007 and 2025 for the cement sector. NAMAs can then be a source of adequate funding to slow down emissions’ growth, including through market mechanisms. But, given the lack of data about the performance of industries in terms of emission reduction, as well as uncertainties regarding the BAU growth scenarios in these areas, monitoring such NAMAs would be very difficult. Under these conditions, an alternative could be to base the design of NAMAs on technology (either specific technologies, production processes, or their performance equivalents) and future market penetration goals, rather than in terms of quantified targets and verification of emission reductions. The acceleration of market penetration compared to a BAU scenario could well be a quantifiable and verifiable objective. In addition, this approach would have the advantage of establishing a clear link between funding and business activity: in the standard case, the only possible verification is the overall result, whereas the means to achieve this result are more easily observable. Such NAMAs would also fit well with the broader planning process in China, including Industrial Development plans for key sectors and policy mandates. Depending on the origin and funding modalities, such NAMAs could take the form of unilateral action, supported action, or carbon credit systems for technologies that are more expensive to implement.
4.8 The Technology Mechanism The existing policy instruments presented in the previous subsections leave unaddressed some key components of future policies to promote the diffusion of climate technology at the global scale. In particular, the way different instruments could be articulated with each other remains an open question as of today. The Technology Mechanism can help solve that question. The Mechanism was established as an institutional entity in 2010 by the 16th session of the Conference of the Parties (COP) in Cancun, Mexico. It is meant to facilitate the implementation of enhanced action on technology development and transfer in order to support action on the mitigation of and adaptation to climate change. It consists of two components:
− A policy-making body called the Technology Executive Committee (TEC) comprising 20 high level independent expert members, elected by the COP. The

- Promoting the International Transfer of Low-Carbon Technologies -
October 2013 43
mandate of the TEC is to support the design and coordination of inclusive action programs for technology transfer and diffusion, based on a thorough review of priority needs and barriers in recipient countries (see its detailed functions in Box 5).
− A Climate Technology Center and Network (CTC&N). The CTC&N currently exists only on paper until it is hosted by another pre-existing organization. It will implement actual transfer of technologies and perform its functions as mandated by the Conference of Parties of the UNFCCC. The Climate Technology Centre shall facilitate a network of national, regional, sectoral and international technology networks, organizations and initiatives with a view to engaging the participants of the Network in effectively carrying out technology development and diffusion.
Box 5: Functions of the Technology Executive Committee
a) Provide an overview of technological needs and analysis of policy and technical issues
related to the development and transfer of technologies for climate change mitigation and adaptation;
b) Consider and recommend actions to promote technology development and transfer, in order to accelerate action on mitigation and adaptation;
c) Recommend guidance on policies and program priorities related to technology development and transfer with special consideration given to the least developed country;
d) Promote and facilitate collaboration on the development and transfer of technologies for the mitigation of and adaptation between governments, the private sector, non-profit organizations and academic and research communities;
e) Recommend actions to address the barriers to technology development and transfer in order to enable enhanced action on mitigation and adaptation;
f) Seek cooperation with relevant international technology initiatives, stakeholders and organizations, and promote coherence and cooperation across technology activities, including activities under and outside of the Convention;
g) Catalyse the development and use of technology road maps or action plans at the international, regional and national levels through cooperation between relevant stakeholders, particularly governments and relevant organizations or bodies, including the development of best practice guidelines as facilitative tools for action on mitigation and adaptation.
The Technology Mechanism is still in an inception phase and has not yet officially issued technology road maps or action plans. Hence it is not possible at this stage to carry out an ex post assessment of its actual impact on international technology transfer. Still, we may already discuss the relevance of its creation as a new administrative body in the current international architecture. In contrast with the COP’s Expert Group on Technology Transfer, the TEC is firstly an independent body whose members’ legitimacy proceeds from their technical expertise, rather than from being the representatives of one or more parties in the COP. As such, it is in a much better position to produce objective analyses and recommendations for the consideration of political bodies such as the COP or individual country governments. The existence of such an independent source of expertise is particularly useful given the highly technical and controversial nature of the subject of technology transfers and diffusion.

- Promoting the International Transfer of Low-Carbon Technologies -
44 October 2013
The Technological Mechanism also explicitly has a large enough mandate to effectively activate all levers pertaining to technology transfer, including capacity building in the broadest sense. Accordingly, it is in position to competently guide and support Least Developed countries in taking up the basic steps (including e.g., the acquisition of regulatory expertise) towards capacity building policies, and to enable the ample participation of business actors, as well as technological, scientific and academic institutions in these actions.
4.9 Financing Financing is a key element in international discussions over technology and we have already evoked this issue previously when mentioning the role of carbon markets. Roughly speaking, financial resources to support technology diffusion might come from three sources:
− The private sector
− National, bilateral or multilateral public funds (including the Green Climate Fund)
− Carbon market mechanisms Whereas technological development and diffusion is primarily a business matter, there is a strong case in economic literature in favour of public intervention to subsidize these activities. The reason is that technology adoption and diffusion entails positive externalities, that is, benefits which are not appropriated by the technology providers and adopters. In particular, learning-by-doing benefits tend to spill over in the economy. In this case, economic theory recommends subsidizing these activities in order to align private benefits with the social value of their adoption. Symmetrically, the same theory recommends taxing carbon emissions for they generate negative externalities. Carbon market mechanisms can be an option as indicated in Box 4, which describes a possible model of technology-based NAMA where the quantity of credits would be related to technology adoption indicators. However, current discussions on the New Market Mechanism suggest that future mechanisms are likely to keep focusing on mitigation objectives (although they would induce technology diffusion as a side-benefit, like the CDM today). Furthermore, market mechanisms may not be well adapted to risky projects such as technological demonstration programs as they generate additional uncertainties: The program’s economic return would depend on carbon market price, which fluctuates a lot as experience shows. In this respect, the European Union’s NER 300 program perfectly illustrates that risk. Under this program, 300 million allowances will be sold in order to subsidize installations of innovative renewable energy technology and carbon capture and storage (CCS). But the dramatic decrease of the carbon price has led to the withdrawal of all CCS projects. 5 Technology transfer and competitiveness For the most part, the evaluation conducted in this report adopts the point of view of a benevolent global regulator seeking to maximize the international diffusion of climate mitigation technologies. But this regulator does not exist in the real world. Policies promoting technology transfer are either made at the national or global level through negotiations between national governments which pursue their national interests. In

- Promoting the International Transfer of Low-Carbon Technologies -
October 2013 45
this institutional context, the allocation of costs and benefits between countries1 is as important as the overall effectiveness of the proposed policy solutions. Views obviously differ in countries which are supposed to supply the technologies (that is, mostly industrialized countries) and recipient countries (emerging economies and least-developed countries). The latter are obviously favourable to the development of technology transfer. In contrast, industrialized countries in which many technologies are located have more ambiguous preferences. Many are aware that it can generate environmental benefits by helping developing countries to curb their emissions. But they also fear competitive losses. The political discussion over “green growth” which has developed in recent years emphasizes that achieving leadership in green technologies may be a powerful tool to boost the competitiveness of national economies. From this perspective, the interest of transferring high-value technologies abroad is far from being an obvious national policy goal to pursue. In fact, the impact of technology transfer on the welfare of technology-providing countries is far from being straightforward as shown in Table 6:
− The environmental benefit is positive only if recipient countries implement sufficiently strict environmental and climate policies at home. Otherwise, certain polluting activities may relocate in less-regulated countries, inducing an overall increase in emissions (carbon leakages).
− Economic impacts arise from the fact that, in many economic sectors, local firms operate in international markets, so that they compete with producers located in the countries receiving the technologies. In this context, technology transfer can generate benefits at home by increasing their exports towards the recipient countries - Remember that many technologies flow across countries through trade. It can also generate benefits overseas in the case where domestic firms invest in recipient countries (the FDI channel of technology diffusion). Reaping these benefits however require a proper enforcement of IP rights and low barriers to trade and FDI. The former limits technology spillovers towards competitors once the technology is introduced in recipient countries and the latter creates opportunities to make profits in recipient countries. In the case where IP rights are lax and where barriers are high, economic impacts are likely to be negative.
− The sales of technology through licensing can generate some benefits, but it is a tiny market as previously explained. Again, the benefit increases with the strictness of IP rights.
− Technology transfer increases global competition, thereby reducing the price of goods produced with climate-mitigation technologies. This is obviously good news for buyers. The dramatic fall of photovoltaic panels provides a good illustration.
The general message is that the development of technology transfer can be jointly profitable for the industrialized and the developing world if policies create favourable market conditions for the international diffusion of knowledge and skills. This is necessary in two respects: to make the transfer of high value technologies acceptable to industrialized countries and to provide private actors – who own the technology – with incentives to do so.
(1) We restrict here the analysis of distributional issues across countries. The distributional impact within the countries is also decisive, but is left out for further research.
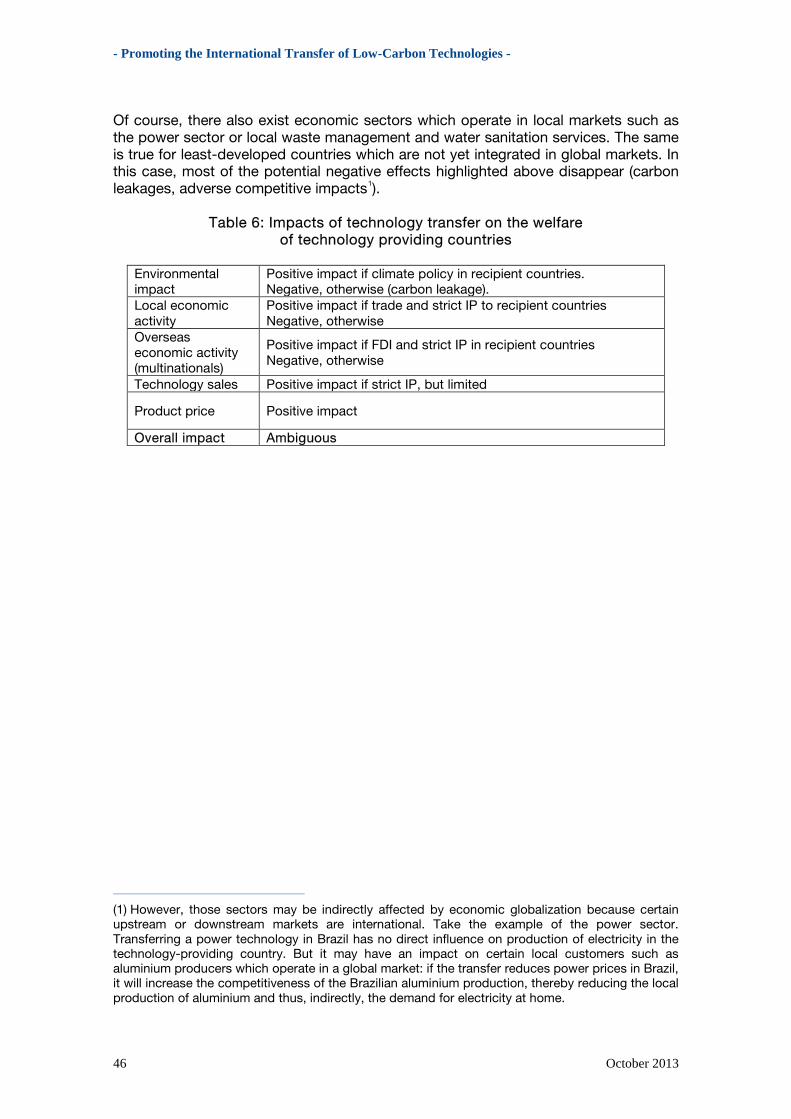
- Promoting the International Transfer of Low-Carbon Technologies -
46 October 2013
Of course, there also exist economic sectors which operate in local markets such as the power sector or local waste management and water sanitation services. The same is true for least-developed countries which are not yet integrated in global markets. In this case, most of the potential negative effects highlighted above disappear (carbon leakages, adverse competitive impacts1).
Table 6: Impacts of technology transfer on the welfare of technology providing countries
Environmental impact
Positive impact if climate policy in recipient countries. Negative, otherwise (carbon leakage).
Local economic activity
Positive impact if trade and strict IP to recipient countries Negative, otherwise
Overseas economic activity (multinationals)
Positive impact if FDI and strict IP in recipient countries Negative, otherwise
Technology sales Positive impact if strict IP, but limited
Product price Positive impact
Overall impact Ambiguous
(1) However, those sectors may be indirectly affected by economic globalization because certain upstream or downstream markets are international. Take the example of the power sector. Transferring a power technology in Brazil has no direct influence on production of electricity in the technology-providing country. But it may have an impact on certain local customers such as aluminium producers which operate in a global market: if the transfer reduces power prices in Brazil, it will increase the competitiveness of the Brazilian aluminium production, thereby reducing the local production of aluminium and thus, indirectly, the demand for electricity at home.

October 2013 47
Conclusion
This report seeks to offer policy lessons on the best ways to promote the international diffusion of low-carbon technologies, with a specific focus on emerging economies with fast-growing carbon emissions. We hope that these recommendations can serve as an input to the on-going international discussions on technology transfer, in particular within the Technology Executive Committee. The report offers three main contributions. First, we provide an up-to-date description of international technology transfer today and its evolution over the last 20 years. Second, we develop and implement a methodology to identify which technologies and countries should be targeted by policy as a matter of priority. Third, we review the effectiveness of various policy approaches and instruments available to achieve these objectives. For the most part, our evaluation adopts the point of view of a global regulator who pursues the general interest, neglecting considerations of national interest. Given the necessity of reaching a consensus among countries to move forward on these issues, we are fully aware that cross-country distributional issues will be a key aspect in the negotiations.
Current patterns and trends The description is based on a unique data set that combines nearly one million patent applications protecting climate-related technologies, bilateral trade data between over 200 countries and information on foreign direct investment by around 10,000 companies active in low-carbon innovation. To the best of our knowledge, this is the first time that a database covering the main channels of technology diffusion for climate change mitigation has been put together. The lack of reliable data has, however, led us to exclude agriculture and forestry from the scope of the study. The first important result of our study is that the diffusion of climate-friendly technologies across national borders is already under way. Moreover, this diffusion has been steadily increasing despite the absence of explicit international policies promoting technology transfer and strong climate change mitigation policies. In practice, technologies flow to developing countries through two main channels: foreign direct investment and trade in equipment goods. Although robust evidence is lacking, international licence markets seem to play a minor role. Cross-border patent flows tend to occur between industrialized countries. But technology transfer from developed countries towards emerging economies becomes significant with 16-30% of global transfer flows, depending on the indicator. Technology transfer towards least developed countries is hardly perceptible in the data.

- Promoting the International Transfer of Low-Carbon Technologies -
48 October 2013
Among major emerging economies, several countries, including China, South Africa and Mexico, and, to a lesser extent, Brazil, seem to be well connected to global technology flows. In contrast, fewer technologies are transferred towards other emerging countries, in particular Russia and India.
Transferring which technologies? To which countries? Based on an analysis of the current intensity of technology transfer and emissions’ reduction potential, we identify the technologies and geographical areas/countries which should be given priority by policy makers in order to make the most of new technology transfer policies. Note that we do not take into account other priorities such as the co-benefits of development, poverty alleviation, equity issues, or competitive impact, which should also enter into policy discussions. Our data indicate that India is a country of top priority. The development of technology transfer towards this country should be coupled with important efforts in building technological absorptive capacities. As for technologies, we find that priority should be given to renewable energy, in particular solar, wind, biomass and hydro technologies and to heating technologies, as they combine large emissions’ reduction potential and low rates of current technology transfer.
Which policy instruments? The evaluation of different policy approaches is based on a thorough review of economic literature on cross-border technology diffusion. This review first highlights the need for strong climate change mitigation policies with proper enforcement in the South in order to enhance technology transfer, as these policies constitute the only sustainable mechanism to create a local demand for climate-related technologies. In emerging economies with strong absorptive capacities and advanced integration in global markets, lowering barriers to trade and FDI is an effective strategy to increase cross-country technology flows. Strengthening the IP system is also a very effective tool in boosting technology flows towards these countries. The potential adverse effects of IP are limited because of sufficient competition today between rival carbon emissions’ reduction technologies. In this respect, climate-friendly technologies are not comparable either to pharmaceuticals – a new drug may have no substitute – nor to information technologies in which the existence of technical complementarity and compatibility issues induce “blocking” patents. However, there is no reason why low-carbon technologies would be forever immune to similar difficulties. In particular, the discovery of a “breakthrough” technology in certain sectors (e.g., CCS, smart grids, and biofuels) can change the landscape. This calls for a careful monitoring of patenting issues. Least advanced countries with weak absorptive capacities are not able to effectively absorb foreign technology in a globalized environment. Lowering barriers to trade and FDI and strengthening domestic IP law is thus unlikely to induce a significant increase in knowledge and technology transfer. Capacity building is required as a priority in these countries.

- Conclusion -
October 2013 49
Further lessons concern new climate-specific instruments currently debated in international negotiations. In contrast with the project-based CDM approach, sectoral approaches like the New Market Mechanism (NMM), business-led initiatives and certain NAMAs are going in the right direction by allowing intra-sectoral coordination, the internalization of leaning spillovers, and collective learning. However, carbon market mechanisms may not be the best option to finance technology diffusion for they add uncertainties to the economic return of these activities through carbon price fluctuation.

October 2013 51
Steering Committee
The Steering Committee set up by the General Commission for Strategy and Prospective Planning has gathered six times in order to review and enrich the findings of the study commissioned to the Centre of Industrial Economics (CERNA). Its members are listed below. Jean-Claude ANDREINI, Chair, Association for the promotion and the international development of French eco-industries (PEXE)
Dominique AUVERLOT, Head of the sustainable development department, General Commission for Strategy and Prospective Planning
Blandine BARREAU, Policy analyst, sustainable development department, General Commission for Strategy and Prospective Planning
Noam BOUSSIDAN, Policy officer, French Ministry for foreign affairs
Jean-Yves CANEILL, Head of Climate policy, EDF
Stéven CURET, Director, Energy Policies France and Business Intelligence, Alstom International
François DASSA, Head of Global Prospective and International Relations, Corporate Strategy and Prospective, EDF
Christine FAURE-FEDIGAN, Director climate strategy, GDF Suez
Gaëlle HOSSIE, Policy analyst, sustainable development department, General Commission for Strategy and Prospective Planning
Florence JASMIN, Head of Development, Association for the promotion and the international development of French eco-industries (PEXE)
Rémi LALLEMENT, Policy analyst, Finance & Economics department, General Commission for Strategy and Prospective Planning
Françoise ROURE, Chair, Committee "Technologies and society", French High Council for Economy, Industry, Energy and Technologies
Claire TUTENUIT, General Secretary, Entreprises pour l'Environnement


October 2013 53
References
Anand B., Khanna T. (2000) “The Structure of Licensing Contracts”. Journal of Industrial Economics, 48 (1) : 103–135
Baron R., Buchner B., Ellis J. (2009) “Sectoral Approaches and the Carbon Market” OCDE/AIE, Paris.
Baron R., Buchner B., Ellis J. (2006) “Sectoral Crediting Mechanisms for Greenhouse Gas Mitigation: Institutional and Operational Issues” OCDE/AIE, Paris.
Barton J. (2007) “Intellectual Property and Access to Clean Energy Technologies in Developing Countries. An Analysis of Solar Photovoltaic, Biofuel and Wind Technologies”. ICTSD Programme on Trade and Environment, Issue Paper n° 2
Bhagwati J. (1982) “Directly unproductive, profit seeking (DUP) activities” Journal of Political Economy, 90, pp. 988–1002.
Bhagwati J., Krueger A.O. (1973) “Exchange control, liberalisation and economic development” American Economic Review.
Berthélemy M. (2012), "What drives innovation in nuclear power technologies? An empirical study based on patent counts", Cerna Working Paper 2012:01.
Blomström M., Lipsey R.E., Zejan M. (1994) “What explains developing country growth?” in W. Baumol, R. Nelson, E. Wolff (Eds.), Convergence of Productivity: Cross-National Studies and Historical Evidence, Oxford University Press, London (1994).
Borensztein E., De Gregorio J., Lee J.W. (1998) “How does foreign direct investment affect economic growth?” Journal of International Economics, 45, pp. 115–35.
Branstetter L. G., Fisman R., Foley C. F. (2006) “Do stricter intellectual property rights increase international technology transfers? Empirical evidence from U.S. firm-level panel data”. Quarterly Journal of Economics, 121(1), pp. 321–49.
Brunnermeier S.B., Cohen M.A. (2003) "Determinants of environmental innovation in US manufacturing industries," Journal of Environmental Economics and Management, 45(2), pp. 278-293.
Center for Clean Air Policy (2008) “Sectoral Approaches: A Pathway to Nationally Appropriate Mitigation Actions” http://mitigationpartnership.net/ccap-2008-sectoral-approaches-pathway-nationally-appropriate-mitigation-actions.
Climate Technology Initiative (2002) “Methods for Climate Change Technology Transfer Needs Assessments and Implementing Activities Developing and Transition Country Approaches and Experiences.

- Promoting the International Transfer of Low-Carbon Technologies -
54 October 2013
Coe D., Helpman E., Hoffmaister A. (1997) "North-South R&D Spillovers," Economic Journal, Royal Economic Society, vol.107(440), pp. 134-49.
Cohen WM, Nelson RR, Walsh JP (2000) “Protecting their Intellectual Assets: Appropriability Conditions and Why U.S. Manufacturing Firms Patent (or Not)”. NBER Working Paper 7552
Crabb J., Johnson D. (2010) “Fueling Innovation: The Impact of Oil Prices and CAFE Standards on Energy‐Efficient Automotive Technology”. The Energy Journal, 31(1).
De la Tour A., Glachant M., Ménière Y. (2011) “Innovation and International Technology Transfer: the Case of the Chinese Photovoltaic Industry”. Energy Policy, 39(2), pp. 761–770.
Dechezleprêtre A., Glachant M. (2011) “Does foreign environmental policy influence domestic innovation? Evidence from the wind industry” Cerna Working Paper.
Dechezleprêtre A., Glachant M., Hascic I., Johnstone N., Ménière Y. (2011) “Invention and Transfer of Climate Change Mitigation Technologies: a Global Analysis”. Review of Environmental Economics and Policy, 5(1), pp. 109–130.
Dechezleprêtre A., Glachant M., Ménière Y. (2008) “The Clean Development Mechanism and the international diffusion of technologies: An empirical study”. Energy Policy 36(4), pp. 1273–1283.
Dechezleprêtre A., Glachant M., Ménière Y. (2009) “Technology transfer by CDM projects: a comparison of Brazil, China, India and Mexico”. Energy Policy, 37(2), pp. 703–711.
Dechezleprêtre A., Glachant M., Ménière Y. (2013) “What Drives the International Transfer of Climate Change Mitigation Technologies? Empirical Evidence from Patent Data” Environmental and Resources Economics, 54(2), pp. 161-178.
deConinck, H., Haake, F., van der Linden, N. (2007), “Technology transfer in the Clean Development Mechanism”. Climate Policy, 7, pp. 444–456.
Dekker T., Vollebergh H.R.J., De Vries F.P., Withagen C. (2009) “Inciting protocols”. Journal of Environmental Economics and Management, 64(1), pp. 45-67.
Dernis H., Guellec D. (2001) “Using Patent Counts for Cross-Country Comparisons of Technology Output”. STI Review, 27, pp. 129–146.
Doranova A., Costa I., Duysters G. (2009) “Knowledge Base Determinants of Technology Sourcing in the Clean Development Mechanism Projects”, UNU-MERIT Working Paper 2009-015.
Duke R., Jacobson A., Kammen D. (2002) “Photovoltaic module quality in the Kenyan solar home systems market”. Energy Policy, 30, pp. 477–99.
Eaton J., Kortum S. (1996) Trade in ideas Patenting and productivity in the OECD. Journal of International Economics, 40(3–4), pp. 251–278.
Egenhofer, C., et N. Fujiwara (2008) "Transnational Sectoral Industry Agreements," Centre for European Policy Studies.

- References -
October 2013 55
Enkvist, P.A., Nauclér T., Rosander J. (2007) “A cost curve for greenhouse gas reduction”, The McKinsey Quaterly n° 1, 38.
Fagerberg, J. (1994) “Technology and International Differences in Growth Rates”, Journal of Economic Literature, XXXII(3), pp. 1147-1175.
Fujiwara N. (2010a) “The Merit of Sectoral Approaches in Transitioning towards a Global Carbon Market?”CEPS Special Report.
Fujiwara N. (2010b) “Sectoral Approaches to Climate Change: What Can Industry Contribute?” CEPS Special Report.
Glachant M., Ménière Y. (2011) "Project Mechanisms and Technology Diffusion in Climate Policy," Environmental & Resource Economics, 49(3), pp. 405-423.
Griffith R., Redding S., Van Reenen J. (2004) "Mapping the Two Faces of R&D: Productivity Growth in a Panel of OECD Industries," The Review of Economics and Statistics, 86(4), pp. 883-895.
Gross R., Dougherty W., Kumarsingh K. (2004) “Conducting Technology Needs Assessments for Climate Change” UNDP, New York, US.
Haites E., Duan M., Seres, S. (2006) “Technology Transfer by CDM Projects”. Margaree Consultants et Tsinghua University. Basic Project
Hall B., Helmers C. (2011) “Innovation and Diffusion of Clean/Green Technology: Can Patent Commons Help?” NBER Working Paper n° 16920.
Hampton K., Gray S., Barata P.M. (2008) “Sectoral CDM” CCAP Discussion Paper.
Helme N. (2010) “NAMAs in Key Sectors: The Way Forward” CCAP Presentation at COP-16, Cancun, Mexico.
Helme N., Whitesell W., Houdashelt M., Osornio J., Ma H., Lowe A., Polzin T. (2010) “Global Sectoral Study: Final Report” Center for Clean Air Policy.
Henry M., Kneller R., Milner C. (2009) “Trade, technology transfer and national efficiency in developing countries” European Economic Review, 53, pp. 237–254.
Hoekman B.M., Maskus K.E., Saggi K. (2005) “Transfer of technology to developing countries: Unilateral and multilateral policy options. World Development, 33(10), pp. 1587–602.
ICSTD (2008) “Climate Change, Technology Transfer and Intellectual Property Rights“. Background paper of the Trade and Climate Change Seminar, 18–20 juin, Copenhague, Danemark
IEA (2012) “Energy Technology Prospective 2012”
Keesing (D.B. 1967) “Outward-looking policies and economic development” Economic Journal, 77, pp. 303–320.
Keller W. (1996) “Absorptive capacity: On the creation and acquisition of technology in development“. Journal of Development Economics, 49, pp. 199–227.

- Promoting the International Transfer of Low-Carbon Technologies -
56 October 2013
Keller W. (2004) “International Technology Diffusion“, Journal of Economic Literature, 42, pp. 752–782.
Kirkegaard J.F., Hanemann T., Weischer L. (2009) "It Should Be a Breeze: Harnessing the Potential of Open Trade and Investment Flows in the Wind Energy Industry" Working Paper Series WP09-14, Peterson Institute for International Economics.
Klein D., Helme N., Ma H., Wang C. (2009) "Technology-based Sectoral NAMAs: A Preliminary Case Study of China's Cement and Iron & Steel Sectors," Center for Clean Air Policy.
Kneller R., Stevens P.A. (2006) "Frontier Technology and Absorptive Capacity: Evidence from OECD Manufacturing Industries," Oxford Bulletin of Economics and Statistics, 68(1), pp. 1-21.
Kreuger A. (1974) “The political economy of the rent-seeking society” American Economic Review, 64, pp. 291–303.
Lanjouw J.O., Mody A. (1996) “Innovation and the International Diffusion of Environmentally Responsive Technology”. Research Policy, 25, pp. 549–571.
Lee J.-Y., Mansfield E. (1996) “Intellectual property protection and U.S. foreign direct investment”.Review of Economics and Statistics, 78, pp.181–5.
Li J., Colombier M. (2009) “Managing carbon emissions in China through building energy efficiency”, Journal of Environmental Management, 90(8), pp. 2436-2447.
Major Economies Forum (2009) “Technology Action Plan: Buildings Sector Energy Efficiency”, Report to the Major Economies Forum on Energy and Climate prepared by the United States
Mancusi M. (2008) “International spillovers and absorptive capacity: A cross-country cross-sector analysis based on patents and citations”. Journal of International Economics, 76(2), pp. 155–65.
Maskus K.E. (2000) Intellectual Property Rights in the Global Economy. Institute for International Economics, Washington, D.C.
Maskus K.E. (2010) “Differentiated Intellectual Property Regimes for Environmental and Climate Technologies”, OECD Environment Working Papers, n° 17, Editions OECD. http://dx.doi.org/10.1787/5kmfwjvc83vk-en.
Newell R.G., Jaffe A.B., Stavins R.N. (1999) “The induced innovation hypothesis and energy- saving technological change”. Quarterly Journal of Economics, 114, pp. 941–75.
NRDC (2012), “Constructing Change: Accelerating Energy Efficiency in India’s Buildings Market”, technical report, Administrative Staff College of India and Natural Resources Defense Council.
Ockwell, D.G., Watson J., MacKerron G., Pal P., Yamin F. (2008) “Key policy considerations for facilitating low carbon technology transfer to developing countries”. Energy Policy, 36, pp. 4104–15.

- References -
October 2013 57
OECD (2010) Measuring Innovation: A New Perspective. Directorate for Science, Technology and Industry
Olson M. (1965) Logic of Collective Action, Harvard University Press, 1965 (1971 2nd ed.).
Parello C. (2008) “A North–South model of intellectual property rights protection and skill Accumulation”.Journal of Development Economics, 85, pp. 253–81.
Pauwelyn (2013) “Carbon Leakage Measures and Border Tax Adjustments Under WTO Law”. in D. Prevost and G. Van Calster (eds.), Research Handbook on Environment, Health and the WTO (Edward Elgar).
Peters M., Schneider M., Griesshaber T., Hoffmann V.H. (2012) “The impact of technology-push and demand‐pull policies on technical change–Does the locus of policies matter?” Research Policy, 41(8), pp. 1296‐1308.
Popp D. (2002) “Induced innovation and energy prices”.American Economic Review, 92(1), pp. 160–80.
Popp D., Hafner T., Johnstone N. (2007) “Policy vs. consumer pressure: Innovation and diffusion of alternative bleaching technologies in the pulp industry”. NBER Working Paper n° 13439.
Institute for building efficiency (2010) “Energy efficiency technology exchange and capacity building: a private sector perspective”, Issue Brief, Johnson Controls
Rivera-Batiz L., Romer P. (1991) "International trade with endogenous technological change," European Economic Review, Elsevier, vol. 35(4), pp. 971-1001.
Saggi K. (2002) “Trade, foreign direct investment, and international technology transfer: A survey”. World Bank Research Observer, 17(2), pp. 191–235.
Sampath G., Roffe P. (2012) “Unpacking the International Technology Transfer Debate” ICTSD Programme on Innovation, Technology and Intellectual Property, Issue Paper n° 36.
Schneider M., Holzer A., Hoffmann V.H. (2008) "Understanding the CDM's contribution to technology transfer", Energy Policy, 36(8), pp. 2920-2928.
Seres S. (2007) “Analysis of technology transfer in CDM Projects” Prepared for UNFCCC Registration & Issuance Unit CDM/SDM.
Shapiro, C. (2001) “Navigating the Patent Thicket: Cross Licenses, Patent Pools, and Standard-Setting,” in Innovation Policy and the Economy, ed. by A. B. Jaffe, J. Lerner, and S. Stern, Cambridge, Mass.: MIT Press, vol. 1, 119–150.
Smith P.J. (2001) “How do foreign patent rights affect U.S. exports, affiliate sales, and licenses?” Journal of International Economics, 55, pp. 411–439.
UNDP / UNFCCC (2010) “Handbook on conducting technology needs assessment for climate change”.

- Promoting the International Transfer of Low-Carbon Technologies -
58 October 2013
Ürge-Vorsatz (2008) “Climate change mitigation in the buildings sector: the findings of the 4th Assessment Report of the IPCC”, presentation at the Poznań Conference of the Parties to the UNFCCC, IPCC
Verdolini E., Galeotti M. (2011) “At home and abroad: An empirical analysis of innovation and diffusion in energy technologies”. Journal of Environmental Economics and Management, 61, pp. 119‐134.
Vieillefosse A. (2007) « Des accords sectoriels dans les engagements post-2012 ». Etude du ministère français de l’écologie, du développement et de l’aménagement durables.
Worrell E., Levine M., Price L., Martin N., Van Den Broek R., Blok K. (1997) “Potentials and policy implications of energy and material efficiency improvement”.New York: United Nations Division for Sustainable Development.
OMC/FUNU (2009) Trade and climate change, http://www.wto.org/english/res_e/ booksp_e/trade_climate_change_e.pdf.

October 2013 59
Appendices


October 2013 61
1. Complete list of technologies described in the study’s patent dataset
1. Energy generation from renewable and non-fossil sources
Technology field Description
Wind energy Wind motors (mechanisms for converting the energy of natural wind into mechanical power, and transmission of such power to its point of use); blades; devices aimed at controlling wind motors
Geothermal Use of geothermal heat; devices for producing mechanical power from geothermal energy
Hydro energy Hydro power stations; hydraulic turbines; submerged units incorporating electric generators; devices for controlling hydraulic turbines
Marine energy Tide or wave power plants; mechanisms using ocean thermal energy conversion; water wheels
Solar photovoltaic
Solar photovoltaic (conversion of light radiation into electrical energy), incl. solar panels
Solar thermal Use of solar heat for heating & cooling Nuclear energy Nuclear reactors, fusion reactors, nuclear power plants
Biofuels Solid fuels based on materials of non-mineral origin (i.e., bio-diesel, bio-ethanol); engines operating on such fuels (CHP or gas turbines for biofeed)
Fuel from waste Solid fuels based on industrial residues or waste materials; recovery of heat from waste incineration; production of energy from waste or waste gases; recovery of waste heat from exhaust gases
2. Combustion technologies with mitigation potential (e.g., using fossil fuels, biomass, waste, etc.) Technology field
Description
Cleaner coal
Coal gasification, improved burners, fluidized bed combustion, improved steam engines, superheaters, improved gas turbines, combined cycle power plant [CCPP], combined cycle gas turbine [CCGT], cogeneration, efficient combustion or heat usage (oxyfuel combustion, etc.,), heat recovery
3. Technologies Specific to Climate Change Mitigation
Technology field
Description
CCS CO2 capture or storage
Capture or disposal of non-CO2 GHG
Destruction of nitrous oxide (N2O), methane, perfluorocarbons [PFC], hydrofluorocarbons [HFC] or sulfur hexafluoride [SF6]

- Promoting the International Transfer of Low-Carbon Technologies -
62 October 2013
4. Technologies with Potential or Indirect Contribution to Emissions Mitigation
Technology field
Description
Energy storage Battery technology (lithium-ion batteries, alkaline secondary batteries, lead-acid batteries); ultracapacitors, supercapacitors, double-layer capacitors; thermal storage; pumped storage
Hydrogen technology
Hydrogen storage; hydrogen distribution; hydrogen production (by chemical reaction with metal hydrides, by decomposition of inorganic compounds, by electrolysis of water or by photo-electrolysis)
Fuel cells Fuel cells (electrochemical generators wherein the reactants are supplied from outside)
Electricity distribution
Technologies for an efficient electrical power generation, transmission or distribution
5. Emissions abatement and fuel efficiency in transportation
Technology field Description
Electric vehicles Electric propulsion of vehicles; arrangement of batteries
Hybrid vehicles Hybrid propulsion systems comprising electric motors and internal combustion engines
Fuel efficiency in motors
Motor fuel-injection apparatus (allowing reduced fuel consumption)
Fuel efficiency-improving vehicle design
Vehicle bodies characterised by streamlining; devices for measuring tyre pressure; braking elements utilising wheel movement for accumulating energy; vehicle fittings for automatically controlling vehicle speed
6. Energy Efficiency in Buildings and Lighting
Technology field Description
Energy efficient cement
Natural pozzuolana cements; cements containing slag; iron ore cements; cements from oil shales, residues or waste; calcium sulfate cements
Heating Hot-water and hot-air central heating systems using heat pumps; energy recovery systems in air conditioning, ventilation or screening; heat pumps
Insulation Elements or materials used for heat insulation; double-glazed windows Lighting Compact fluorescent lamps; electroluminescent light sources (LED)
7. Energy Efficiency in industrial processes
Technology field Description
Aluminium production
Electric arc furnace

- Appendices -
October 2013 63
2 : Description and HS codes of low carbon goods considered
in the study Technology
class HS code Description
Hydro energy
841011 Hydraulic turbines & water wheels, of a power not >1000kW
841012 Hydraulic turbines & water wheels, of a power >1000kW but not >10000kW
841013 Hydraulic turbines & water wheels, of a power >10000kW
841090 Parts (incl. regulators) of the hydraulic turbines & water wheels of 8410.11-8410.13
Nuclear energy
840110 Nuclear reactors
840120 Machinery and apparatus for isotopic separation, and parts thereof
840140 Parts of nuclear reactors
Solar photovoltaic 854140
Photosensitive semiconductor devices, incl. photovoltaic cells whether/not assembled in modules/made up into panels; light emitting diodes
Solar thermal 841919 Instantaneous/storage water heaters, non-electric (excl. of 8419.11)
Wind energy 850231 Wind-powered electric generating sets
Energy storage
850710 Lead-acid electric accumulators (vehicle)
850720 Lead-acid electric accumulators except for vehicles
850730 Nickel-cadmium electric accumulators
850740 Nickel-iron electric accumulators
850780 Electric accumulators
850790 Parts of electric accumulators, including separators
853224 Fixed electrical capacitors, other than those of 8532.10, ceramic dielectric, multilayer
Electric and hybrid vehicles
870390 Vehicles principally designed for the transport of persons (excl. of 87.02 & 8703.10-8703.24), with C-I internal combustion piston engine (diesel/semi-diesel), n.e.s. in 87.03
Energy efficient cement
252390 Hydraulic cements (e.g., slag cement, supersulphate cement), whether not coloured/in the form of clinkers (excl. cement clinkers, Portland cement & aluminous cement)
Heating
903210 Thermostats
841861 Compression-type refrigerating/freezing equip. whose condensers are heat exchangers, heat pumps other than air conditioning machines of heading 84.15
841950 Heat exchange units, whether/not electrically heated

- Promoting the International Transfer of Low-Carbon Technologies -
64 October 2013
Technology class HS code Description
Insulation
680610 Slag wool, rock wool & similar mineral wools (incl. intermixtures thereof ), in bulk/sheets/rolls
680690 Mixtures & articles of heat-insulating/sound-insulating/sound-absorbing mineral materials (excl. of 68.11/68.12/Ch.69)
700800 Multiple-walled insulating units of glass
701939 Webs, mattresses, boards & similar non-woven products of glass fibres
Lighting
853120 Indicator panels incorporating. liquid crystal devices (chemically defined)/light emitting diodes (LED)
853931 Electric discharge lamps (excl. ultra-violet lamps), fluorescent, hot cathode
Transportation 860120 Rail locomotives powered by electric accumulators
Energy efficiency in heavy industries
840410 Economizers, super-heaters, soot removers, gas recoverers and condensers for steam or other vapour power units
3 : TOP 10 inventor countries (2007-2009)
Rank Country Share of world climate
inventions* 1 USA 19.0% 2 Germany 18.7% 3 Japan 17.5% 4 South Korea 5.6% 4 France 4.8% 6 UK 3.6% 7 Italy 3.4% 8 Canada 2.7% 9 China 1.7% 10 The Netherlands 1.6% Total top 10 78.6%
Source: Authors’ calculations based on PATSTAT data. International patents invented in the country as a share of world international patents. Mean of all climate technology shares.

- Appendices -
October 2013 65
4 : Imports of climate patented inventions as a share of world
imports (2007-2009)
Rank Countries Average import share Top 10
1 USA 23.4% 2 China 15.5% 3 European Patent Office 15.4% 4 South Korea 10.3% 5 Japan 9.5% 6 Canada 8.4% 7 Australia 6.4% 8 Mexico 2.2% 9 Russia 1.3% 10 Norway 1.2%
Selected emerging countries 11 South Africa 1.2% 14 Argentina 0.7% 15 Brazil 0.7% 18 Chile 0.2%
Source: Authors’ calculations based on PATSTAT data. 5 : Imports of low carbon equipment goods as a share of world
imports (2007-2009)
Rank Countries Average import share Top 10
1 United States 12.1% 2 Germany 8.8% 3 China 8.3% 4 France 6.0% 5 Netherlands 4.3% 6 United Kingdom 3.3% 7 Italy 3.2% 8 South Korea 3.1% 9 Spain 3.1% 10 Belgium 2.7%
Selected emerging countries 16 India 1.5% 19 Russian 1.4% 32 Brazil 0.7% 45 South Africa 0.4%
Source: Authors’ calculations based on COMTRADE data

- Promoting the International Transfer of Low-Carbon Technologies -
66 October 2013
6 : Country groupings
Africa Algeria, Angola, Benin, Botswana, Burkina Faso, Burundi, Cameroon, Cape Verde, Central African Rep., Chad, Comoros, Congo, Côte d'Ivoire, Dem. Rep. of the Congo, Djibouti, Egypt, Equatorial Guinea, Eritrea, Ethiopia, Gabon, Gambia, Ghana, Guinea, Guinea-Bissau, Kenya, Lesotho, Liberia, Libya, Madagascar, Malawi, Mali, Mauritania, Mauritius, Morocco, Mozambique, Namibia, Niger, Nigeria, Rwanda, Sao Tome and Principe, Senegal, Seychelles, Sierra Leone, Somalia, South Africa, Sudan, Swaziland, Togo, Tunisia, Uganda, United Rep. of Tanzania, Western Sahara, Zambia, Zimbabwe
ASEAN (Association of Southeast Asian Nations)
Brunei Darussalam, Cambodia, Indonesia, Laos, Malaysia, Myanmar, Philippines, Singapore, Thailand and Vietnam
China Refers to the People’s Republic of China, including Hong Kong Emerging countries
Refers to Non-OECD countries that are not LDC
Eastern Europe/Eurasia
Albania, Armenia, Azerbaijan , Belarus, Bosnia and Herzegovina, Bulgaria, Croatia, Georgia, Kazakhstan, Kyrgyzstan, Latvia, Lithuania, Former Yugoslav Republic of Macedonia, Montenegro, Rep. of Moldova, Russian Federation, Serbia, Tajikistan, Turkmenistan, Ukraine and Uzbekistan. For statistical reasons, this region also includes Cyprus, Gibraltar and Malta
Latin America Argentina, Belize, Bolivia, Brazil, Chile, Colombia, Costa Rica, Cuba, Dominican Rep., Ecuador, El Salvador, Guatemala, Guyana, Haiti, Honduras, Mexico, Nicaragua, Panama, Paraguay, Peru, Suriname, Uruguay, Venezuela
LDC (Least Developed Countries)
Afghanistan, Angola, Bangladesh, Benin, Bhutan, Burkina Faso, Burundi, Cambodia, Central African Rep., Chad, Comoros, Dem. Rep. of the Congo, Djibouti, Equatorial Guinea, Eritrea, Gambia, Guinea, Guinea-Bissau, Haiti, Kiribati, Lao People’s Dem. Rep., Lesotho, Liberia, Madagascar, Malawi, Maldives, Mali, Mauritania, Mozambique, Myanmar, Nepal, Niger, Rwanda, Samoa, Sao Tome and Principe, Senegal, Sierra Leone, Solomon Islands, Somalia, Sudan, Timor-Leste, Togo, Tuvalu, Uganda, United Rep. of Tanzania, Vanuatu, Yemen, Zambia
Middle East Afghanistan, Bahrain, Iran, Iraq, Israel, Jordan, Kuwait, Lebanon, Oman, Qatar, Saudi Arabia, Syria, United Arab Emirates, Yemen
OECD countries1
Australia, Austria, Belgium, Canada, Chile, Czech Rep., Denmark, Finland, France, Germany, Greece, Hungary, Iceland, Ireland, Italy, Japan, Luxembourg, Mexico, Netherlands, New Zealand, Norway, Poland, Portugal, Rep. of Korea, Slovakia, Spain, Sweden, Switzerland, Turkey, United Kingdom, USA
Rest of developing Asia
Bangladesh, Bhutan, Brunei Darussalam, Cambodia, Dem. People's Rep. of Korea, East and West Pakistan, Indonesia, Lao People's Dem. Rep., Malaysia, Maldives, Mongolia, Myanmar, Nepal, Pakistan, Peninsula Malaysia, Philippines, Sarawak, Singapore, Sri Lanka, Thailand, Timor-Leste, Viet Nam
Rest of developing countries
Every Non-OECD countries except ASEAN countries, China, Eastern Europe/Eurasia countries, India and South Africa
(1) Members in 2007.

- Appendices -
October 2013 67
7 : Scenarios considered by the IEA in the ETP2012
The 6°C Scenario (6DS) is largely an extension of current trends. By 2050, energy use almost doubles (compared with 2009) and total greenhouse gas (GHG) emissions rise even more. In the absence of efforts to stabilise atmospheric concentrations of GHGs, average global temperature rise is projected to be at least 6°C in the long term. The 4°C Scenario (4DS) takes into account recent pledges made by countries to limit emissions and step up efforts to improve energy efficiency. It serves as the primary benchmark in ETP 2012 when comparisons are made between scenarios. Projecting a long-term temperature rise of 4°C, the 4DS is already an ambitious scenario that requires significant changes in policy and technologies. Moreover, capping the temperature increase at 4°C requires significant additional cuts in emissions in the period after 2050. The 2°C Scenario (2DS) is the focus of ETP 2012. The 2DS describes an energy system consistent with an emissions’ trajectory that recent climate science research indicates would give an 80% chance of limiting average global temperature increase to 2°C. It sets the target of cutting energy-related CO2 emissions by more than half in 2050 (compared with 2009) and ensuring that they continue to fall thereafter. Importantly, the 2DS acknowledges that transforming the energy sector is vital, but not the sole solution: the goal can only be achieved provided that CO2 and GHG emissions in non-energy sectors are also reduced.


