Embed Size (px)
Citation preview
1
Promoting Smallholder Market Engagement (PSME) Project
in Manicaland Province of Zimbabwe
Final Report
Lighton Dube, BenjamineT. Hanyani-Mlambo,Wonder Dube, Emmanuel Guvheya
and Madeira Chipunza
16 April 2016
This document details the context, process and results of an end-of-project evaluation of Practical
Action’s Promoting Smallholder Market Engagement (PSME) project in Manicaland with a focus on
assessment of the relevance, effectiveness, efficiency, impact and the sustainability of the project
initiative.

2
Acknowledgements
The end of project evaluation information, focus group discussions, household survey data, and
insights contained in this report have been contributed by many stakeholders directly or indirectly
involved in the Practical Action’s “Promoting Smallholder Market Engagement” {PSME} project in
Manicaland province, implemented in partnership with Farm Community Trust Zimbabwe (FCTZ) and
Zambuko Trust with financial support from the Big Lottery Fund (BLF)
The consultants would like to thank Practical Action and BLF for initiating and supporting this end-of-
project evaluation. Sincere gratitude also goes to AGRITEX, lead farmers, projectbeneficiaries, other
development agency partners, private sector partners, other stakeholders, and other community
members who participated in the key informant interviews and focus group discussions for their
contributions during the field data collection exercise. Sincere gratitude also goes to Practical Action,
FCTZ and Zambuko Trust team for facilitating the fieldwork and reviewing and giving feedback on the
Draft Report. The team comprised of Reginald Sithole, Killron Dembe, Zibusiso Ncube, Hopewell
Zheke, Ryan Ndadzungira, Augustine Masomera, Julian Gondongwe, Pharoah Chiwanza, Rutendo
Kamudyariwa, Richard Huchena, team of field data enumerators and data entry team;
The views expressed in this report, however, are those of the consultants, and do not necessarily represent the views of Practical Action, the BLF, FCTZ or Zambuko Trust. A list of all the consulted informants is provided at the end of this report as an annex.
3
Contents Table of Contents
ACKNOWLEDGEMENTS ....................................................................................................................................... 2 CONTENTS ................................................................................................................................................................... 3 TABLE OF CONTENTS ................................................................................................................................................. 3 LIST OF TABLES ..................................................................................................................................................................... 4
LIST OF FIGURES .................................................................................................................................................................... 5
LIST OF PLATES ..................................................................................................................................................................... 5
ABBREVIATIONS AND ACRONYMS ................................................................................................................................ 7
EXECUTIVE SUMMARY ......................................................................................................................................... 8 1. INTRODUCTION .......................................................................................................................................... 16 1.1 BACKGROUND .................................................................................................................................................... 16
1.2 THE PSME PROJECT ..................................................................................................................................... 16
1.3 EVALUATION STUDY OBJECTIVES ...................................................................................................................... 16
1.4 PROJECT OUTCOMES ........................................................................................................................................... 16
1.5 EVALUATION PURPOSE ........................................................................................................................................ 16
1.6 SCOPE OF WORK (SOW) .................................................................................................................................... 17
1.7 KEY ACTIVITIES ..................................................................................................................................................... 17
1.8 KEY DELIVERABLES ............................................................................................................................................... 17
2. EVALUATION DESIGN ............................................................................................................................ 18 2.1 ANALYTICAL FRAMEWORK ............................................................................................................................ 18
2.2 ANALYTICAL APPROACH ...................................................................................................................................... 18
2.3 EVIDENCE ............................................................................................................................................................... 19
2.4 METHODOLOGY, ACTIVITIES AND SAMPLING ................................................................................................... 20
3. KEY FINDINGS ................................................................................................................................................. 28 3.1. RELEVANCE ............................................................................................................................................................ 28
3.2. EFFECTIVENESS .............................................................................................................................................. 30 3.2.1. OUTCOME 1 ...................................................................................................................................................... 30
3.2.2. OUTCOME 2 ...................................................................................................................................................... 34
3.2.3. OUTCOME 3 ...................................................................................................................................................... 38
3.2.4. OUTCOME 4 ...................................................................................................................................................... 41

4
3.3. EFFICIENCY & VFM ....................................................................................................................................... 43 3.4. IMPACT ............................................................................................................................................................... 46 3.4.1. TECHNOLOGY ADOPTION ............................................................................................................................... 46
3.4.2. INCOME .............................................................................................................................................................. 48
3.4.3. ASSET ACQUISITION ........................................................................................................................................ 51
3.4.4. EMPLOYMENT CREATION ................................................................................................................................ 52
3.4.5. FOOD SECURITY ............................................................................................................................................... 52
3.4.6. PSME PERCEIVED IMPACT BY SAMPLE HOUSEHOLDS ................................................................................ 54
3.5. GENDER MAINSTREAMING ......................................................................................................................... 56 3.6. SUSTAINABILITY............................................................................................................................................. 60 4. BEST PRACTICES & LESSONS LEARNT ................................................................................................. 63 5. RECOMMENDATIONS .................................................................................................................................... 64 6. CONCLUSION ................................................................................................................................................... 67 7. ANNEXES ........................................................................................................................................................... 68 7.1. ANNEX 1: MOST SIGNIFICANT CHANGE (MSC) / CASE STUDIES ................................................................ 68
7.2. ANNEX 2: LIST MEETINGS, INTERVIEWS AND FOCUS GROUP DISCUSSIONS .............................................. 79
7.3. ANNEX 3: BOND EVIDENCE PRINCIPLES CHECKLIST ...................................................................................... 81
7.4. ANNEX 4: TERMS OF REFERENCE (TORS) ....................................................................................................... 83
7.5. ANNEX 5: KEY INFORMANT INTERVIEW (KII) CHECKLIST ............................................................................. 97
7.7. ANNEX 7: HOUSEHOLD (HH) SURVEY QUESTIONNAIRE.............................................................................. 106
7.8. ANNEX 8: MOST SIGNIFICANT CHANGE (MSC) CASE STUDY TOOL ......................................................... 118
List of Tables Table 1: Evaluation Quality Assessment Based on Bond Evidence Principles .................................... 19
Table 2: Sample Selection .................................................................................................................... 21
Table 3: Household Sample Distribution .............................................................................................. 22
Table 4: Household Demographics ....................................................................................................... 23
Table 5: Highest level of Education Attained by HH Heads .................................................................. 24
Table 6: Household Status .................................................................................................................... 24
Table 7: IPTT for Outcome 1................................................................................................................. 30
Table 8 : Proportion of farmers bulking their produce for marketing by district .................................... 31
Table 9: Proportion of farmers bulking their produce disaggregated by gender ................................... 31
Table 10: Average time contributed by HH per month by district ......................................................... 32
Table 11: IPTT For Outcome 2 ............................................................................................................. 34
Table 12: Proportion of Farmers participating in improved market channels disaggregated by gender
.............................................................................................................................................................. 35
Table 13: Main sources of income for the HH....................................................................................... 37
Table 14: IPTT for Outcome 3 .............................................................................................................. 38
Table 15 : IPTT for Outcome 4 ............................................................................................................. 41
Table 16: Sources of Agricultural Information by District ...................................................................... 42

5
Table 17: Proportion by Which Income Has Increased Compared to Period after PSME by District ... 49
Table 18: Proportion by Which Income Has Increased Compared to Period after PSME by Gender .. 50
Table 19: Impact of PSME on employment .......................................................................................... 52
Table 20 : Household GSSI by district .................................................................................................. 53
Table 21 : Proportion of HHs that are Grain Sufficient (GSSI>1) ......................................................... 53
Table 22 : Evaluation of Project Impact – Perceived Impact by HHs ................................................... 54
Table 23 : HHs’ Satisfaction with support received from PSME project by district ............................... 55
Table 24: Farmer perceptions on whether PSME Project has affected relations between men and
women ................................................................................................................................................... 56
Table 25: Influence of PSME Project on Status of Women .................................................................. 57
Table 26: Influence of PSME Project on Status of Women .................................................................. 58
List of Figures Figure 1: Proportion of HH Heads actively involved in Farming and HH Heads Off-Farm Employed. . 25
Figure 2: Age Distribution of HH Members by Age ............................................................................... 25
Figure 3: Average Number of HH Members Active on Farm and Off Farm Employed ........................ 26
Figure 4 :Proportion of HHS contributing to management of shared resources by gender .................. 32
Figure 5 : HHs’ Access to Inputs for Crop Production by District ......................................................... 35
Figure 6: HHs’ Access to Inputs for Crop Production by District .......................................................... 35
Figure 7: Households’ Access to Finance {VSLG/ Micro Finance Institutions} by District ................... 39
Figure 8: Households’ Access to Finance {VSLG/ Micro Finance Institutions} by Gender .................. 40
Figure 9: Adoption of Improved Production and CA Technologies as a Result of PSME by District ... 46
Figure 11: Proportion of HHs Practicing Record keeping and Adoption of practice due to PSME
intervention ............................................................................................................................................ 47
Figure 10: Word Cloud: Technologies adopted by farmers as a result of the PSME Project ............... 47
Figure 12: Proportion of HHs Who realized a change in income after receiving PSME support by
District ................................................................................................................................................... 48
Figure 13: Proportion of HHs Who realized a change in income after receiving PSME support by
Gender .................................................................................................................................................. 49
Figure 14: Uses of additional income realized after PSME Support ..................................................... 50
Figure 15: Households indicating acquiring new assets as a result of PSME ...................................... 51
Figure 16: Major assets acquired by households as a result of PSME project .................................... 51
Figure 17: Farmer perception on whether PSME project brought about any negative impact by
Gender .................................................................................................................................................. 55
Figure 18: Word Cloud: How the PSME has affected the relations between men and women ........... 57
Figure 19:Ability to purchase the PSME introduced technologies on the market without PSME support
.............................................................................................................................................................. 60
Figure 20: Proportion of HHs who have Developed Linkages with Agro-dealers or Input Suppliers as a
Result of PSME ..................................................................................................................................... 61
Figure 21: Whether farmers think market linkages with agro-dealers will help to maintain new
agricultural activities in the future .......................................................................................................... 61
List of Plates Plate 1: One of the Focus Group Discussions held with smallholder farmers ...................................... 21
Plate 2: An enumerator conducting a household survey with one of the farmers ................................ 23
Plate 3: Farmers bulking their tomatoes preparing for the market ....................................................... 31
Plate 4: Proportion of HH members contributing the management of shared land and water resources
.............................................................................................................................................................. 33
Plate 5: Farmers showcasing their produce at Nyakomba Agricultural Show {above} ......................... 36
Plate 6: Horticulture farmers taking part in Nyakomba Agricultural Show ............................................ 37
6
Plate 7: A farmer showing a record of his maize crop at a maize field day at Chakohwa irrigation
scheme .................................................................................................................................................. 40
Plate 8: Lead farmers training on onion farming at Nyarumvure irrigation scheme.............................. 43
Plate 9: Nyabombwe farmers calculating water losses at an irrigation maintenance workshop .......... 44
7
Abbreviations and Acronyms AGRITEX Agriculture Technical and Extension Services
CAADP Comprehensive African Agricultural Development Programme
CA Conservation Agriculture
COMESA Common Market for Eastern and Southern Africa
CSA Climate Smart Agriculture
DoI Department of Irrigation
EPE End of Project Evaluation
EU European Union
FAO Food and Agriculture Organization
FCTZ Farm Community Trust of Zimbabwe
FGD Focus Group Discussions
HH Household
KII Key Informant Interviews
M4P Markets Work for the Poor
MOU Memorandum of Understanding
MSC Most Significant Change
OECD/DAC Organization for Economic Cooperation and Development/ Development Assistance Committee
PMSD Participatory Market Systems Development
PSME Promoting Smallholder Market Engagement
SADC Southern Africa Development Community
ToT Training of Trainers
TFT Training for Transformation
TLT Training Leaders for Transformation
USAID United States Aid
ZIMASSET Zimbabwe for Agenda for Sustainable Socio-Economic Transformation
ZT Zambuko Trust of Zimbabwe

8
Executive Summary
Introduction Practical Action Southern Africa’s Sustainable Agriculture and Livelihoods programme with funding from Big Lottery Fund (BLF) implemented a three year project entitled “Promoting Smallholder Market Engagement (PSME)” in Manicaland province of Zimbabwe. The project sought to build strong market relationships with key stakeholders in strengthening the livelihoods of 7,490 smallholder farmers (5,250 women), in 11 irrigation schemes across Manicaland (six from Nyanga, four from Chimanimani, one each from Mutasa and Mutare). The project was premised on the fact that over the past decade, public and private sector agricultural extension services have deteriorated; yet without access to the necessary inputs and the opportunity to develop their business knowledge and farming skills, farmers have been finding it difficult to be able to build their farms and attain a sustainable livelihood for their families. The project was also aimed at mainstreaming gender and people living with disabilities issues, as well as promoting sustainable environmental practices. Practical Action partnered with the Farm Community Trust of Zimbabwe (FCTZ) and Zambuko Trust of Zimbabwe in implementing the project was implemented from April 2013 to March 2016. The PSME Project outcomes were:- Outcome 1: Men and women farmers are better able to manage their shared resources and act collectively in improving their livelihoods. Outcome 2: The livelihoods of 7,490 men and women farmers are strengthened and incomes increased through improved participation and engagement in horticulture markets. Outcome 3: The business capacity of men and women farmers is enhanced through skills development and access to credit enabling them to operate their farms more profitably. Outcome 4: Horticulture farmers in Manicaland province are able to access high quality, relevant and timely extension and market engagement advice for a wider range of crops from district and provincial extension services and private sector providers. Purpose of the Evaluation The purpose of this end of term evaluation as articulated in the Terms of Reference (ToRs),was to systematically and independently assess the achievement of the expected outcomes as described in the project documents. Evidence and findings from the evaluation will actively be used after the life of the project for various purposes such as accountability to stakeholders such as communities who were the targeted beneficiaries, government through the AGRITEX, Department of Irrigation (DoI), donors, in particular, the BLF so as to satisfy donor contractual obligations, as well as the internal audiences such as the leadership and trustees of the implementing organisations on the benefits attained from the delivery of the project. According to the ToRs, evidence and findings of the evaluation will be used for learning, reinforcing or redirecting programmes’ strategies and approaches to increase efficiency, effectiveness as well as investigating whether the project achieved its anticipated outcomes, and what impact (intended and unintended) has occurred as a result of the project. The evaluation evidence and findings will provide useful information for upscaling projects, replication of projects, and for influencing policy or Practice reforms among policy makers/decision makers, donors, UN Agencies and other regional and international bodies. Lastly evaluation evidence and findings will be used for documentation of impacts and lessons that have become a powerful tool for fundraising and communicating the work of Practical Action and those of partners to the wider public. Approach and Methodology The evaluation adopted both quantitative and qualitative methods of enquiry to improve analytical vigour, facilitate both technical and socio-economic analysis, and it was carried out in different but integrated phases. In interpreting the existing scope of work for the project end of term evaluation, the team applied the OECD/DAC principles and criteria for the evaluation of development assistance projects viz: relevance; effectiveness; efficiency; impact; and sustainability. Cross-cutting issues particularly
9
gender disaggregation (men, women, youth), HIV and AIDS, and the environment were also taken into account. Other additional issues considered included a look at the best practices, lessons learnt and recommendations. The evaluation also tracked and analysed indicators in the monitoring and evaluation framework making comparisons between evaluation results, end of project targets and baseline benchmarks. In addition, the Sustainable Livelihood Approach (SLA) framework was also used as a complementary approach and tool for assessing the contribution that project activities have made to sustaining livelihoods. Specific field data collection tools included desk studies, key informant interviews, focus group discussions, a household questionnaire survey, and case studies. The household survey interviewed a total of 184 households, conducted 8 focus group discussions with beneficiary farmers and 15 key informant interviews. In addition the evidence gathered was assessed for robustness using the five Bond Principles which are voice and inclusion, appropriateness, triangulation, contribution and transparency.

10
Evaluation Findings and Conclusions The project is innovative because it is introducing changes in systems and individuals’ mindsets about smallholder irrigated agriculture at multiple levels: farmers, agricultural input suppliers, agricultural produce buyers, association leaders, public extension agents and private players in the sector. The lessons learned can be useful for the projects and beyond when the sector normalizes. Relevance The PSME project was found to be relevant because its aims and design are well in tandem with the objectives of the national food security policies, the beneficiaries’ needs, Practical Actions development priorities as well as BLF’s supported programme outcomes as explained below: The PSME project was found to be relevant as its four outcomes are well aligned with ZIMASSET’s Food Security and Nutrition Cluster whose thrust is to create a self- sufficient and food surplus economy and see Zimbabwe re-emerge as the “Bread Basket of Southern Africa”. In particular the PSME contributes to the cluster’s key result areas of crop production and marketing, infrastructure development, environmental management, protection and conservation and nutrition. The project’s outcomes are also aligned to the Comprehensive African Agricultural Development Programme (CAADP), Draft Comprehensive Agriculture Policy Framework (2012-2032), the Food and Nutrition Security Policy, the Zimbabwe Agriculture Investment Plan (2013-2017), SADC and COMESA Food and Nutrition Frameworks and it represented a move from emergency relief to a much broader and sustainable recovery following the political and economic crisis. The PSME project was found to be relevant to the beneficiaries as it was implemented at a time when the country was recovering from one of its worst macro-economic crisis, which had affected agricultural production and productivity levels particularly smallholder farmers who are highly susceptible to shocks. The macro-economic crises had also negatively affected both the input and output markets, leaving the farmers worse off. The project, therefore, provided a platform upon which farmers would increase their production, productivity, market engagement, incomes as well as food security situation of beneficiaries. The relevance of the project was also echoed by one FDG participant who said: “Neproject tave nekwekutengesera uye mitengo yatavekuwana iri nani pane zvataiwana kare. Project isati yauya tainetseka nepekutengesera (With the PSME project, we now have markets for our produce and are also getting better prices for our produce. Before PSME we were struggling to find buyers for our produce)”. The PSME is primarily aimed at improving livelihoods of smallholder farmers and this is in line with BLF’s outcome 5 which focuses on improved livelihoods for the most disadvantaged people. The PSME undertook a systematic approach to improving the livelihoods of poor smallholder farmers through building understanding and strengthening the market linkages which enabled smallholder farmers to identify and engage with market actors on more favourable terms. PMSE’s Outcome 1 on men and women are better able to manage their shared resources and act collectively in improving their livelihoods also addresses outcome 3 of BLF which focuses on improved access to and use of natural resources to benefit the most disadvantaged. PSME promoted better natural resources management in all the 11 supported irrigation schemes by focusing on soil and water conservation, soil fertility management practices and capacity building of farmers in improved and environmental friendly and sustainable production practices. The project also fits well with Practical Action’s goal on sustainable systems of agriculture and natural resource management which seeks to build on Practical Action’s experience of working with women and men in poor communities to adopt and adapt technologies for small-scale, ecologically sustainable food provision.
11
Efficiency The bulk of planned activities were implemented in time based on activity scheduling and when activities were actually implemented on the ground. The only difference in some areas was the scale, where less numbers were reached. Effectiveness Overall the project achieved most of its targets and effectiveness of the project was high as seen by the achievements of the indicators for the four outcomes with the exception of a few as shown below. Outcome 1: Men and women farmers are better able to manage their shared resources and act collectively in improving their livelihoods Of the six indicators under this outcome five were achieved and one surpassed target. As an example the proportion of farmers using improved production and conservation agriculture (CA) principles is 98% against a target of 90% and this gives an achievement of 109%. This was attributed to intensive training and awareness of the techniques during the project’s lifespan. According to the HH survey, some of the innovations adopted by the farmers included extension, crop rotation, irrigation scheme maintenance, use of contours, water conservation techniques, zero tillage dubbed “dhigaudye”, compost making, Farming as a Business {FaaB}, farm record keeping, VSLGs, planning, group marketing, organic manure preparation and application, post-harvest management as well as good livestock management. However there was an underachievement on the number of farmers bulking and marketing their produce as groups. Only 44% of the target was achieved with 1658 farmers out of a target of 3750 farmers bulking their produce. Conversely, according to the household survey, results showed that 62.8% of the farmers are bulking their produce for marketing whilst 68.5% of the households reported having established markets for their crops. Outcome 2: The livelihoods of 7,490 men and women farmers are strengthened and incomes increased through improved participation and engagement in horticulture markets. The achievement under this indicator was quite high with an overachievement in four of the six indicators and an underachievement in one indicator. For example 34 buyers were identified and engaged against a set target of 10 giving a percent achievement of 340% and 12 agro dealers were contracted as agriculture stockists by big commercial companies against a set target of 4 giving an achievement of 300%. However, there was an underachievement of 68.2% on the proportion of farmers participating in improved marketing channels. Despite this underachievement, results also show that more female farmers are participating in agricultural market channels and also enjoy membership to inputs procurement group compared to their male counterparts. In total, 86% of farmers have access to inputs for crop production, thus increasing farmers’ productivity and marketed surplus. Outcome 3: The business capacity of men and women farmers is enhanced through skills development and access to credit enabling them to operate their farms more profitably. Of the 5 indicators under this outcome, there was an overachievement in 3 and an underachievement in 2 of the indicators. The project only managed to have 29% of the beneficiary farmers accessing loans from micro finance institutions against a set target of 50%. This underachievement was as a result of initial identified micro finance institutions deciding not to extend loans to the beneficiary farmers after due diligence exercises. Micro finance institutions were too cautious given the persistent droughts the country has been experiencing. The project did exceptionally well in establishing VSL groups which offered an alternative source of agricultural finance and 100% of the VSLG members accessed loans from the VSL scheme.
12
Outcome 4: Horticulture farmers in Manicaland are able to access high quality, relevant and timely extension and market engagement advice for a wider range of crops from district and provincial extension services and private sector providers. The project has managed to increase extension reach to the farmers in the irrigation schemes from a ratio of 1:18 according to the project design documents to the current 1:10 which is a fair proportion. The training of 366 lead farmers and use of podcasting technology increased cascading of training to the farmers, and timely extension and market engagement advice. However, only a 5% achievement rate was attained on the number of extension officers (EOs) outside the project using Participatory Market Systems Development (PMSD) as a market facilitation approach. This is attributed to the project’s budget constraints and cost implications as the resources available could not be stretched too far to capacity build extension officers outside the beneficiary irrigation schemes. Impact Overall the farmers perceived the PSME project to have significantly led to positive impact on all key areas addressed by the interventions with 80% of the respondents rating the impact of the project to be high to very high. The respondents reported an overall increase of 101% for seasonal employment and 26% for permanent employment. Overall 84% of the households indicated that they acquired new assets as a result of PSME project and 93% of the respondents indicated that they were now realizing more income when compared to the periods before receiving PSME support. Overall 40% of the households had realized an increase in income of more than 50%. Farmers also indicated that they were using the additional income for improving their homesteads and farm infrastructure, purchasing agricultural inputs and livestock and for paying school fees and medical bills or repayment of outstanding loans and bills. Gender Women have been consciously incorporated into and are deriving real benefits from the project. A review of the project documents revealed that women were actively included and involved in all activities and are reporting statistics disaggregated by male and female. Ninety-seven percent of the female headed households indicated that the PSME support was easily accessible. Ninety-seven percent of the survey farmers indicated that the PSME positively affected relations between men and women and none of the survey farmers indicated that the PSME project worsened the relations between men and women. Overall, the PSME project had a strong positive effect on women’s economic status as shown by a Women’s Empowerment in Agriculture Index (WEAI) of 0.87. The Women’s Empowerment in Agriculture Index (WEAI) tracks the change in women’s empowerment levels that occurs as a direct or indirect result of an intervention. It also measures women’s empowerment relative to men within their households. A WEAI of 0.87 shows that women’s control over critical parts of their lives in the households, community and economy has significantly improved with the PSME project. Sustainability The PSME project implementation was strongly participatory and there was strong cooperation of all community stakeholders and this is a good indicator of sustainability. The direct participation of AGRITEX, Department of Irrigation (DoI) and Irrigation Management Committees (IMCs) from the very first day of implementation of the program ensured a good exit strategy and greater institutionalisation after the project is terminated. The Mukando (Voluntary savings and Loan groups) and practice, market linkages with input suppliers and produce markets, marketing committees, and community management of shared resources and irrigation infrastructure are more likely to be sustainable beyond the life of the PSME. Farmers’ contribution towards the management of shared resources has been overwhelming according to the HH interviews conducted. Farmers are contributing an average of 4.5 hours per month towards management of shared resources and 96.4% of the interviewed households are actively involved in management of shared resources. The evaluation also found that both male and female HH members in a household contribute almost equally to the management of irrigation schemes.

13
The results indicate that the farmers are more likely to extremely likely to afford to purchase the technologies after the PSME project has ended. Overall 47% of the respondents indicated that they are more likely to sustain the technologies on their own while 35% of the respondents indicated that they are extremely likely to sustain the technologies on their own. The ability of the farmers to continue to use the technologies from their own resources is one strong indicator of sustainability. Also 78% percent of the farmers indicated that PSME project has helped them develop linkages with agro-dealers and input suppliers. Market linkages are an important strategy for ensuring perpetuity of benefits from smallholder farmers. The readily available and accessible loans from the VSL groups will also further enhance the farmers’ capacity to sustain their farming operations. Despite the PSME interventions having a great potential for sustainability, the evaluation also found that the perpetuity of benefits is threatened by the ever increasing influx of imported fresh produce from neighbouring countries, and the high costs for electricity and water which are rendering most agricultural activities in smallholder irrigation schemes unviable. Best Practices & Lessons Learnt The evaluation established the following best practices and lessons that should be considered in designing future similar projects:
i) The participatory approach employed by the project through the involvement of all stakeholders (Agritex, RDCs, DoI, beneficiary farmers, project staff, private companies and community leaders) and a good rapport ensures smooth project implementation and increases chances of project success.
ii) In an economic environment where access to formal sources of finance for agricultural activities are limited, Voluntary Savings and Lending Schemes offer a viable alternative for financing smallholder agriculture and also increasing financial inclusion for the marginalised farmers. PSME established 104 VSL groups and 100% of the VSL members accessed loans from the groups for their farming operations.
iii) Being gender sensitive and adopting a more targeted integrated approach ensures greater success in women empowering than promoting the issues as a separate aim as shown by the WEAI of 0.87.
iv) Practical learning experiences through demonstration plots, farmers field schools, agricultural shows, exchange visits, study tours, field days and market research and intelligence activities are better means of learning for farmers than those that focus on theoretical impartation of knowledge.
v) Constant monitoring and feedback of projects through regular review meetings with all stakeholders will ensure quick responses and solutions and hence greater success of projects.
vi) The establishment of separate farmer committees for marketing and infrastructure and maintenance from the main irrigation management committee increases the chances of success for projects mainly focussed on promoting enhanced market participation and management of shared resources.
vii) The farmer to farmer extension approach through use of lead farmers offers an alternative viable farmer extension method for increasing extension coverage especially in an environment where the traditional public extension system is struggling to raise enough resources to fund its extension programs.
Conclusions The PSME project performance has been exceptional and has achieved or nearly achieved all its targets. There has been significant traction in establishing systems (production, market linkages, credit), and the systems are showing great potential for sustainability. The project activities were and remain relevant to addressing the major challenges the smallholder irrigated agricultural sector continues to confront — improving management of shared infrastructure and resources and enhancing market engagement and participation. The PSME has had a significant impact on technology adoption by the beneficiary farmers with 98% of the farmers now using improved production and conservation agriculture principles. Women have

14
been consciously incorporated into and are deriving real benefits from the project. Women make up 70% of the total beneficiaries and actively participated in all activities of the project. Significant progress was made in enhancing the business capacity of the beneficiary farmers and in establishing fundamental trust among the actors and repair broken systems: access to basic agricultural inputs, production, market linkages for sales, credit, enabling environment. The establishment of VSL groups has offered beneficiaries an alternative source of finance for their farming operations when needed and the project managed to set up 104 VSL groups which have managed to offer loans to 100% of the VSL group members. Recommendations The major recommendations based on the key evaluation criteria are:
Description Gaps Recommendations
Relevancy None None
Effectiveness 1. Fewer farmers bulking and marketing their produce as groups (44% of target achieved)
2. Low percentage of farmers with increased income from horticulture production (Cumulative achievement was 30% against a target of 40% of beneficiary farmers)
3. Low percentage of farmers accessing loans from microfinance institutions (Cumulative achievement was 29% against a target of 50% of beneficiary farmers)
4. Fewer farmers reporting improved business confidence through recording and analyzing business transactions (75% of target achieved)
5. Fewer farmers whose major extension needs were met by the lead farmers (69% of target achieved)
6. Fewer extension officers outside the project using PMSD as a market facilitation approach (5% of target achieved)
1. Promote more contract farming arrangements
2. Protect local farmers from competition brought by imported produce
3. Involve more microfinance institutions as implementing partners
4. Explore group collateral schemes and group lending schemes
5. Improve monitoring of the ToT approach to ensure all farmers are trained by lead farmers
6. Increase farming as a business training to cover all beneficiary farmers
7. Adopt pluralistic extension approach to increase extension coverage
8. Train all extension workers in beneficiary schemes to ensure maximum diffusion of technologies. In some schemes like Nyanyadzi, not all extension workers were trained.
9. Provide training to extension staff outside the project and promote innovation sharing platforms for extension staff and lead farmers.
Efficiency None None
Impact No baseline indicators on key impact outcomes like food security, nutrition, employment etc
Develop a comprehensive baseline position with higher level outcome indicators

15
Gender mainstreaming None None
Other
The other recommendations from this evaluation are:
1. Input vouchers: Although all farmers in the beneficiary schemes were considered to be beneficiaries, only a few were selected to receive the input vouchers which were given at the start of the project. This to some extent created tensions between the farmers who received the vouchers and those that did not receive. Future programming should target all farmers for input vouchers or else adopt a revolving voucher support programme to ensure that all farmers benefit.
2. Aging irrigation infrastructure: It was noted that most irrigation schemes had some hardware challenges arising from an aging irrigation infrastructure. Some farmers did not adequately practice what they learnt from the capacity building activities because they did not have adequate water to irrigate as a result of silted canals and reservoirs or leaking canals. The PSME project was predominantly a software project with limited funding for repairing irrigation infrastructure. Future software projects should be complemented by a hardware component so that farmers maximize the benefits they derive from the software components. One way is for future projects to focus on a smaller geographic area and then be more holistic in their support. A limited geographic coverage not only allows for a more holistic approach, but can also increase efficiency, effectiveness and impact of an intervention.
3. Water conflicts and sub-catchment issues: The evaluation noted that water is increasing becoming a scarce resource and a major source of community conflicts between independent irrigators, non-irrigators and irrigators in organized irrigation schemes. A good example is the Chipindeke Irrigation scheme which competes with the mini hydro-electricity plant for water. A lot of the siltation of water sources in most irrigation is mainly caused by the poor management of the sub-catchment areas and focusing of managing the problem only in irrigation schemes will not help much if the sub-catchment issues are not addressed as well. Future projects should pay increasing attention to the management of shared resources beyond just the irrigation scheme but also involve all users who derive a livelihood from the same water source.
4. Clear enabling irrigation policy: The current prevailing utility costs for water and electricity are hampering the development of smallholder irrigation schemes and especially those that are predominantly food security focused. In most irrigation schemes, the irrigation plots are too small to be able to produce enough to pay for water and electricity costs. There is therefore a need for a clear policy that distinguishes food security schemes from horticultural commercial schemes. Farmers in food security schemes should be charged lower tariffs than farmers in horticultural commercial schemes.
5. Project implementation period: Changing attitudes and mindsets of smallholder farmers often take long to see notable changes. Also, getting approvals for activities takes time especially with Government institutions and this reduces implementation time. Future programming should consider extending the period of implementation to 5 years minimum.
6. Integrating VSLs with formal finance institutions: The VSLs have proved to be an effective alternative approach to financing smallholder agriculture in the beneficiary schemes. There is need to strengthen VSLs and explore mechanisms for linking them with micro finance institutions and the formal banking system.
7. Imported fresh agricultural produce: There is need for the country to protect the agricultural sector from the influx of imported fresh agricultural produce from neighboring countries. Not only are the imports threatening the viability of the local agricultural sector, but they also pose a serious threat of introducing new pests and diseases if adequate sanitary and phytosanitary measures are not applied as some of the imports come into the country illegal.
8. Value addition: There is need to develop value addition capacity at local level. This way, farmers can realize more returns for their produce and this creates more opportunities for rural based employment creation and poverty reduction.

16
1. Introduction
1.1 Background Food and nutrition insecurity at national and household levels remains a key challenge for the majority of people in developing countries. Within Sub Saharan Africa, food and nutrition security during the last decade has been adversely affected by rising populations, increasing incidences of erratic and extreme weather conditions, rising energy costs, and economic and financial crisis.
1.2 The PSME Project In Zimbabwe, Practical Action Southern Africa’s Sustainable Agriculture and Livelihoods programme with funding from Big Lottery Fund (BLF) implemented a three year project (April 2013 to March 2016) entitled “Promoting Smallholder Market Engagement (PSME)” in Manicaland province of Zimbabwe. The partners Farm Community Trust of Zimbabwe (FCTZ) and Zambuko Trust of Zimbabwe were joint implementers with different roles such as community mobilization, selection of beneficiaries and with shared responsibility for implementation and daily monitoring. In essence, the project sought to build strong market relationships with key stakeholders in strengthening the livelihoods of 7,490 smallholder farmers (5,250 women), in 11 irrigation schemes across Manicaland (six from Nyanga, four from Chimanimani, one each from Mutasa and Mutare). The project was premised on the fact that over the past decade, public and private sector agricultural extension services have deteriorated; yet without access to the necessary inputs and the opportunity to develop their business knowledge and farming skills, farmers have been finding it difficult to be able to build their farms and attain a sustainable livelihood for their families. The program was also aimed at mainstreaming gender and people living with disabilities issues, as well as promoting sustainable environmental practices. The project was implemented from April, 2013 to March 2016.
1.3 Evaluation Study Objectives The main assignment objective is to document the impacts (intended or unintended) results of the PSME Project considering project design, project targets and the results realized. As part of this objective, the assessment will generate project results, key lessons and best practices that will inform implementation of other projects, programmes, new interventions, and innovation strategies. Finally, lessons learned will be made available to all the Practical Action projects and stakeholders who may continue to implement similar support strategies.
1.4 Project Outcomes The Project outcomes were:- Outcome 1:Men and women farmers are better able to manage their shared resources and act collectively in improving their livelihoods. Outcome 2: The livelihoods of 7,490 men and women farmers are strengthened and incomes increased through improved participation and engagement in horticulture markets. Outcome 3: The business capacity of men and women farmers is enhanced through skills development and access to credit enabling them to operate their farms more profitably. Outcome 4: Horticulture farmers in Manicaland are able to access high quality, relevant and timely extension and market engagement advice for a wider range of crops from district and provincial extension services and private sector providers.
1.5 Evaluation Purpose The TORs entailed the evaluation of the design and implementation of the PSME Programme, and the determination of whether program implementation effectively addressed the stated objectives of the intervention. The purpose of this end of term evaluation was to systematically and independently assess the achievement of the expected outcomes as described in the project documents. Evidence
17
and findings from the evaluation will actively be used after the life of the project for various purposes such as accountability to stakeholders such as government through the AGRITEX, Department of Irrigation (DoI), donors, in particular, the BLF so as to satisfy donor contractual obligations, as well as communities who were the targeted beneficiaries. Evidence and findings of the evaluation will be used for learning, reinforcing or redirecting programme’s strategies and approaches to increase efficiency, effectiveness and impact as well as investigating whether the project achieved its anticipated outcomes, and what impact (intended and unintended) has occurred as a result of the project. The evaluation evidence and findings will provide useful information for upscaling projects, replication of projects, and for influencing policy or Practice reforms among policy makers/decision makers, donors, UN Agencies and other regional and international bodies. Lastly evaluation evidence and findings will be used for documentation of impacts and lessons that have become a powerful tool for fundraising and communicating the work of Practical Action and those of partners to the wider public.
1.6 Scope of Work (SOW) The evaluation was expected to focus on assessing the relevance, the effectiveness, the efficiency, the impact and the sustainability of the programme. The evaluation also assessed the appropriateness and adequacy of the institutional framework that operated throughout the life of the program to deliver the expected results.
1.7 Key Activities
Desk review of relevant documentation. Developing framework, methodology and work plan for study. Developing evaluation instruments based on Bond Evidence principles. Recruiting, organizing and training of suitable staff and enumeration team. Conducting field data collection. Developing a draft evaluation report. Presenting preliminary results/findings. Review, revision and submission of a final evaluation report.
1.8 Key Deliverables
Inception Report. Evaluation tools. Draft evaluation report addressing the evaluation objectives as outlined in the TORs. Final evaluation report incorporating comments and input from Practical Action; FCTZ,
Zambuko Trust and Big Lottery Fund.
18
2. Evaluation Design
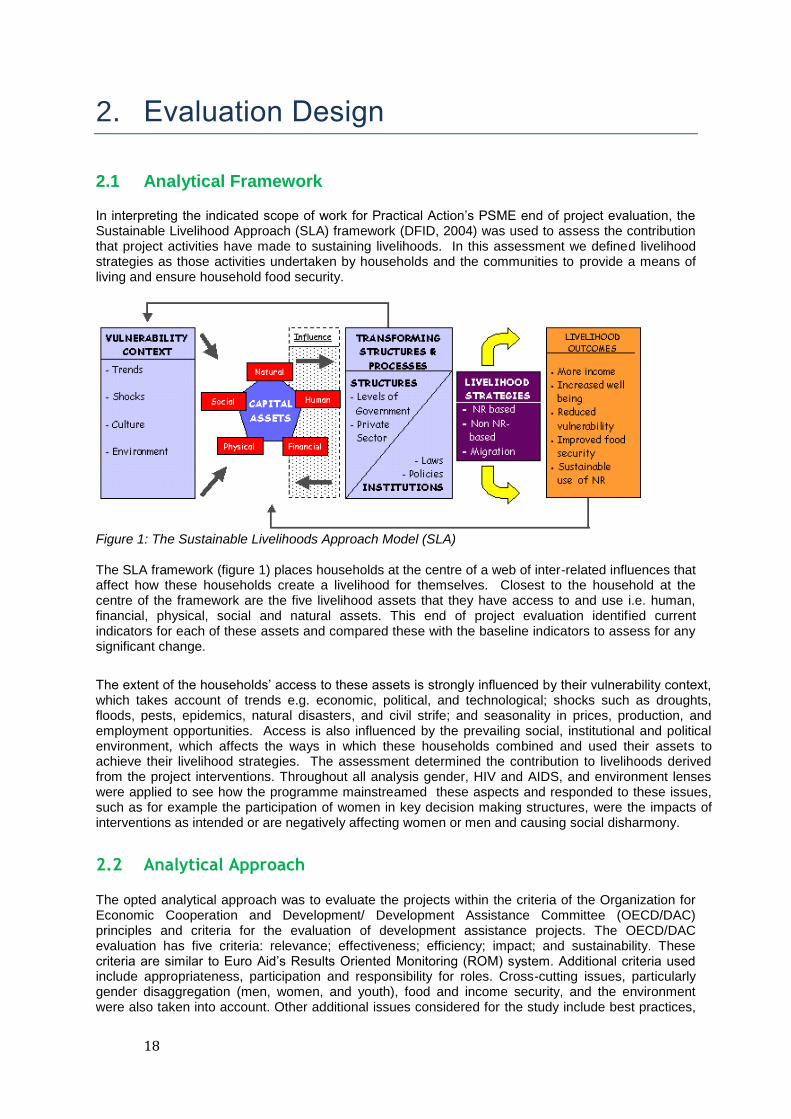
2.1 Analytical Framework In interpreting the indicated scope of work for Practical Action’s PSME end of project evaluation, the Sustainable Livelihood Approach (SLA) framework (DFID, 2004) was used to assess the contribution that project activities have made to sustaining livelihoods. In this assessment we defined livelihood strategies as those activities undertaken by households and the communities to provide a means of living and ensure household food security.
Figure 1: The Sustainable Livelihoods Approach Model (SLA) The SLA framework (figure 1) places households at the centre of a web of inter-related influences that affect how these households create a livelihood for themselves. Closest to the household at the centre of the framework are the five livelihood assets that they have access to and use i.e. human, financial, physical, social and natural assets. This end of project evaluation identified current indicators for each of these assets and compared these with the baseline indicators to assess for any significant change.
The extent of the households’ access to these assets is strongly influenced by their vulnerability context, which takes account of trends e.g. economic, political, and technological; shocks such as droughts, floods, pests, epidemics, natural disasters, and civil strife; and seasonality in prices, production, and employment opportunities. Access is also influenced by the prevailing social, institutional and political environment, which affects the ways in which these households combined and used their assets to achieve their livelihood strategies. The assessment determined the contribution to livelihoods derived from the project interventions. Throughout all analysis gender, HIV and AIDS, and environment lenses were applied to see how the programme mainstreamed these aspects and responded to these issues, such as for example the participation of women in key decision making structures, were the impacts of interventions as intended or are negatively affecting women or men and causing social disharmony.
2.2 Analytical Approach The opted analytical approach was to evaluate the projects within the criteria of the Organization for Economic Cooperation and Development/ Development Assistance Committee (OECD/DAC) principles and criteria for the evaluation of development assistance projects. The OECD/DAC evaluation has five criteria: relevance; effectiveness; efficiency; impact; and sustainability. These criteria are similar to Euro Aid’s Results Oriented Monitoring (ROM) system. Additional criteria used include appropriateness, participation and responsibility for roles. Cross-cutting issues, particularly gender disaggregation (men, women, and youth), food and income security, and the environment were also taken into account. Other additional issues considered for the study include best practices,

19
lessons learnt and recommendations. The evaluation also tracked and analyzed indicators in the intervention logic (log frame) making comparison between evaluation results and baseline benchmarks (before and after scenarios). The evaluation was thus built upon a focus on assessing the following issues: (i) Relevance and quality of program design – review of whether the project addressed real
problems, needs and priorities of its target groups and the quality of the design, continued appropriateness and relevance of the design and relevance of program activities to communities and the environment. It also included relevance of program activities taking into account cross-cutting issues such as gender, food and income security, and the environment.
(ii) Effectiveness assessment – an assessment of how the project was delivered to target beneficiaries, technical support provided to partners, and the programming of cross-cutting issues.
(iii) Efficiency of planning and implementation - this is an assessment of how well inputs and activities were converted into outputs. It is an assessment of the input-output relationship, looking at resources such as expenditure, work plans, monitoring systems, and the Value for Money (VfM).
(iv) Assessing program impact and outputs – these are long term effects to both the recipients and environment and the achievements of the stated goals. It addresses the issue of whether the observed changes can be attributed to project activities.
(v) Sustainability of the project – This is the extent to which the project has established and built institutional capacity that ensures the continuation and maintenance of the project outcomes after the period of external support has ended. Issues addressed are the environment, stakeholder participation, technology and approach utilized in the intervention, potential scaling up and replication, ownership, and exit strategies.
2.3 Evidence The evaluation team also examined the robustness of the evidence collected and used for the PSME end of term evaluation by assessing it against the five Bond Principles which are voice and inclusion, appropriateness, triangulation, contribution and transparency. The overall assessment was done by answering the following questions:
Voice and Inclusion: Are the perspectives of the people living in poverty, including the most marginalised, included in the evidence, and a clear picture is provided of who is affected and how?
Appropriateness: Is the evidence generated through methods that are justifiable given the nature of the purpose of the inquiry?
Triangulation: Is the evidence generated using a mix of methods, data sources, and perspectives?
Contribution: Does the evidence explore how change happened, the contribution of the intervention and factors outside the intervention in explaining change?
Transparency: Does the evidence disclose the details of the data sources and methods used, the results achieved, and any limitations in the data or conclusions?
Quality assessment results are as in Table below and the full the assessment and checklist are presented in an annex attached. Table 1: Evaluation Quality Assessment Based on Bond Evidence Principles
Principle Total Score Weight Weighted Score Quality Assessment
Voice and Inclusion 13/16 20% 13/16 81%
Appropriateness 16/16 20% 16/16 100%
Triangulation 15/16 20% 15/16 94%
Contribution 14/16 20% 14/16 88%
Transparency 16/16 20% 16/16 100%

20
Overall, the results in Table 1 show that the evidence used for the PSME evaluation was robust as the quality of assessment on all the 5 Bond principles was very high with a minimum score of 81% for voice and inclusion and a maximum score of 100% for appropriateness and transparency.
2.4 Methodology, Activities and Sampling The evaluation adopted both quantitative and qualitative methods of enquiry to improve analytical vigour, facilitate both technical and socio-economic analysis, and it was carried out in different but integrated phases.
Phase 1: Review of Background Material and Development of Evaluation Tools This stage was a desk study and involved the review of project documents including approved project proposal, the logframe, work plans, progress reports, monitoring data, field/monitoring visit reports, baseline reports, contribution agreement, contract documents and other documents produced by the project, BLF Strategy documents among others. Information collected at this stage was used to develop evaluation tools.
Phase 2: Harare, Provincial, District and Ward-level Data Collection
Field data collection was based on information collected from BLF, Practical Action, FCTZ, AGRITEX, Zambuko Trust, RDCs, and other various stakeholders. The following evaluation tools were utilized:- 1. Key Informant Interviews (KIIs)
KIIs were guided by a pre-prepared checklist. The KIIs were targeted at key project staff, notably representatives of the BLF, Practical Action, FCTZ, Zambuko Trust, AGRITEX, RDCs, lead farmers, project beneficiaries, other stakeholders, and other community members as needed to collect qualitative information for the evaluation. A total of 15 Key Informant Interviews (KIIs) were conducted in the selected irrigation schemes.
2. Focus Group Discussions (FGDs)
FGDs were conducted with PSME project beneficiaries in the selected irrigation schemes. A semi-structured questionnaire (FGD checklist) was developed and used to assess farmers’ perceptions on program design, implementation processes, extent to which they are receiving services as planned as well as effectiveness of activities to date. FGDs were carried out with both men and women together and women and youth only groups to gather as much information as possible (women and youth are sometimes reluctant to speak out in the presence of men and adults).

21
Plate 1: One of the Focus Group Discussions held with smallholder farmers
From the selected irrigation schemes, eight FGDs were conducted. Of these, six FGDs were with farmers while two were with Irrigation Marketing Committee members (IMCs).
3. Household Questionnaire Survey The household survey collected quantitative data for a sample 283 households of the total number of project beneficiaries across the four districts through a formal semi-structured household questionnaire. Independent field based enumerators {Plate 2} were identified and trained by the evaluation team before administering the questionnaire. Household interviews were conducted concurrently with FGDs Limitations of the survey: The Country is experiencing the worst drought in a decade and farmers tend to under report production and performance figures anticipating to qualify for drought support from government and NGOs. The biggest limitation was the time allocated to the study. Although the team of consultants agreed to five days of field work, the allocated time was not enough as most farmers were busy in the fields taking advantage of the rains that coincided with the field work. As a result the consultants failed to achieve the original sample size. However, the limitations did not affect the outcomes of the study. Selection Process Irrigation schemes highlighted in green in Table 2 below were selected for the End of Project Evaluation {EPE}.
Table 2: Sample Selection
District Irrigation Scheme
No of farmers
Major crops Natural region
Type of irrigation
Source of irrigation water pumping
Target sample
Nyanga Bende 303 potatoes, maize wheat, cabbage
1 Overhead
Gravity
Nyabombwe 231 Sugar beans, maize & onions
3 Flood Gravity
Nyakomba 652 Maize, sugar beans, 3 Flood Electricity 95
22
wheat
Nyamarimbira
400 Potatoes, maize 1 Overhead
Gravity 60
Nyamaropa 530 Maize, sugar beans, wheat & tomatoes
3 Flood Gravity
Nyarumvurwe
236 Onions, maize 2a Flood Gravity 35
Mutasa Domborutunhira
300 Maize, potatoes, peas, sugar beans & fruits (peaches, plums)
1 Overhead
Gravity 45
Mutare Chipendeke 49 Sugar beans, green mealies, tomatoes
2b Overhead
Gravity 20
Chimanimani
Nyanyadzi 547 Maize, sugar beans, wheat & tomatoes
4 Flood Electricity 80
Chakohwa/Nechitima
335 Maize, sugar beans, wheat & tomatoes
4 Flood Gravity
Svinurai 344 Sugar beans, wheat, tomatoes, cabbages & maize
1 Flood and overhead
Gravity 50
Selection was done with consideration of factors below:
a. All crops grown across the 11 irrigation schemes were covered; b. Natural region in which schemes are located were considered c. Type of irrigation used by the schemes d. Source of irrigation water (pumping)
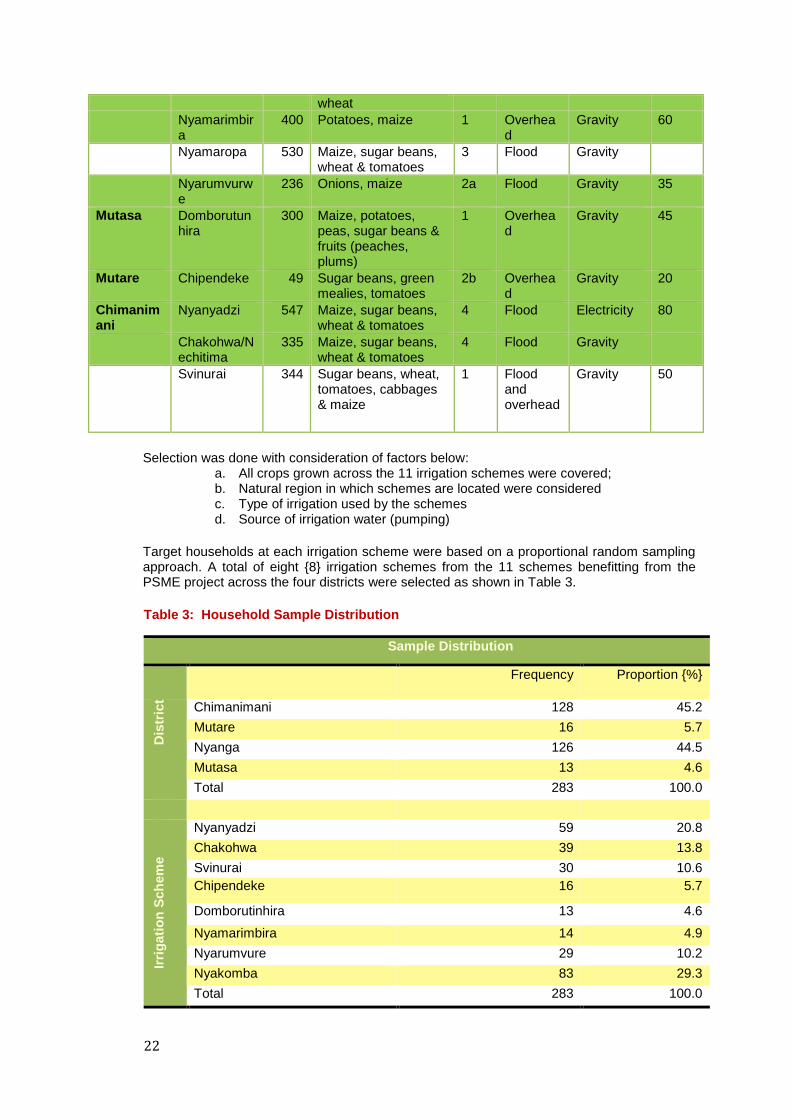
Target households at each irrigation scheme were based on a proportional random sampling approach. A total of eight {8} irrigation schemes from the 11 schemes benefitting from the PSME project across the four districts were selected as shown in Table 3.
Table 3: Household Sample Distribution
Sample Distribution
Frequency Proportion {%}
Dis
tric
t
Chimanimani 128 45.2
Mutare 16 5.7
Nyanga 126 44.5
Mutasa 13 4.6
Total 283 100.0
Irri
gati
on
Sch
em
e
Nyanyadzi 59 20.8
Chakohwa 39 13.8
Svinurai 30 10.6
Chipendeke 16 5.7
Domborutinhira 13 4.6
Nyamarimbira 14 4.9
Nyarumvure 29 10.2
Nyakomba 83 29.3
Total 283 100.0

23
Plate 2: An enumerator conducting a household survey with one of the farmers
Out of the 283 households interviewed 37.5% were female headed while 62.5% were male headed households, see Table 3. Most household heads were married {75.2%} followed by widowed household heads at 19.5% while the remaining 5.3% were either never married {single} or divorced {Table 4}. Table 4: Household Demographics
Chimanimani Mutare Nyanga Mutasa Total
{n} {%} {n} {%} {n} {%} {n} {%} {n} {%}
Sex of HH Head
Female 51 39.8% 6 4.7% 45 35.2% 4 3.1% 106 37.5
Male 77 60.2% 10 62.5% 81 64.3% 9 69.2% 177 62.5
Total 128
16
126
13
283 100
Marital Status of HH Head
Single 9 7.0% 0 0.0% 3 2.4% 0 0.0% 12 4.3%
Married 86 67.2% 11 68.8% 103 82.4% 12 92.3% 212 75.2%
Divorced 1 0.8% 0 0.0% 2 1.6% 0 0.0% 3 1.1%
Widowed/ Widower
32 25.0% 5 31.3% 17 13.6% 1 7.7% 55 19.5%
128
16
125
13
282
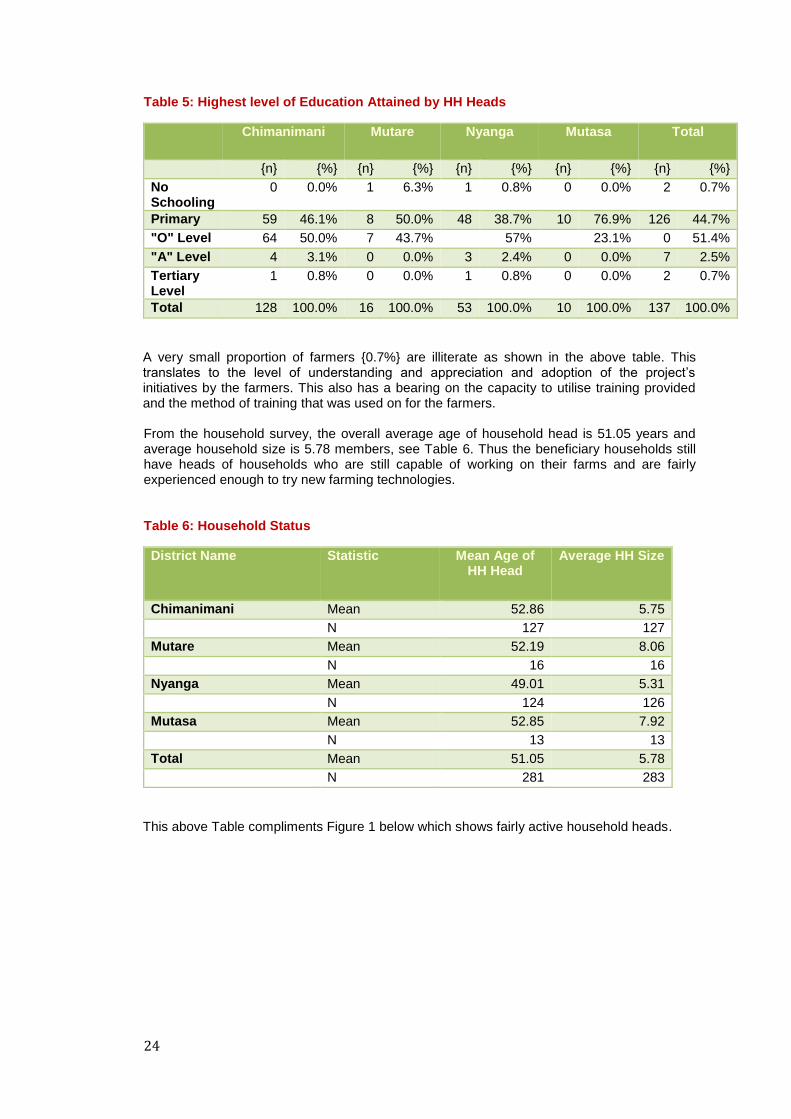
The highest level of education attained by the households heads is high schools with 51.4% of the farmers having gone up to Ordinary Level {51.4%} followed by Primary level with 44.7% of the household heads. {Table 5}
24
Table 5: Highest level of Education Attained by HH Heads
Chimanimani Mutare Nyanga Mutasa Total
{n} {%} {n} {%} {n} {%} {n} {%} {n} {%}
No Schooling
0 0.0% 1 6.3% 1 0.8% 0 0.0% 2 0.7%
Primary 59 46.1% 8 50.0% 48 38.7% 10 76.9% 126 44.7%
"O" Level 64 50.0% 7 43.7% 57% 23.1% 0 51.4%
"A" Level 4 3.1% 0 0.0% 3 2.4% 0 0.0% 7 2.5%
Tertiary Level
1 0.8% 0 0.0% 1 0.8% 0 0.0% 2 0.7%
Total 128 100.0% 16 100.0% 53 100.0% 10 100.0% 137 100.0%
A very small proportion of farmers {0.7%} are illiterate as shown in the above table. This translates to the level of understanding and appreciation and adoption of the project’s initiatives by the farmers. This also has a bearing on the capacity to utilise training provided and the method of training that was used on for the farmers. From the household survey, the overall average age of household head is 51.05 years and average household size is 5.78 members, see Table 6. Thus the beneficiary households still have heads of households who are still capable of working on their farms and are fairly experienced enough to try new farming technologies.
Table 6: Household Status
District Name Statistic Mean Age of HH Head
Average HH Size
Chimanimani Mean 52.86 5.75
N 127 127
Mutare Mean 52.19 8.06
N 16 16
Nyanga Mean 49.01 5.31
N 124 126
Mutasa Mean 52.85 7.92
N 13 13
Total Mean 51.05 5.78
N 281 283
This above Table compliments Figure 1 below which shows fairly active household heads.

25
Figure 1: Proportion of HH Heads actively involved in Farming and HH Heads Off-Farm Employed.
HH survey results indicate that most household heads are actively involved in farming activities with less than 30% of the household heads employed off farm. Figure 2 below also illustrates that household composition is mainly composed of the active age group {15-64 years} making up 52.9% of the household while children below 15 make up 43.4% of the household. Only 4% of the household members are the elderly and physically and mentally challenged members who are not normally considered for household labour {Figure 2}.
Figure 2: Age Distribution of HH Members by Age
Of note is that out of the household members, only about 50% of the members are active on
farm with an average of 5.78 members per family, an average of only 3.6 members are in
0.0%
10.0%
20.0%
30.0%
40.0%
50.0%
60.0%
70.0%
80.0%
90.0%
100.0%97.7%
93.8% 92.7%
100.0% 95.7%
20.2%
28.6% 27.0% 22.2% 23.9%
Pro
po
rtio
n o
f H
H H
ead
s
District
ActivelyInvolved inFarming
Employed OffFarm
43.4%
52.9%
3.5%
0.3%
0-14 Years
15-64 Years
65+ Years
Physically Challenged
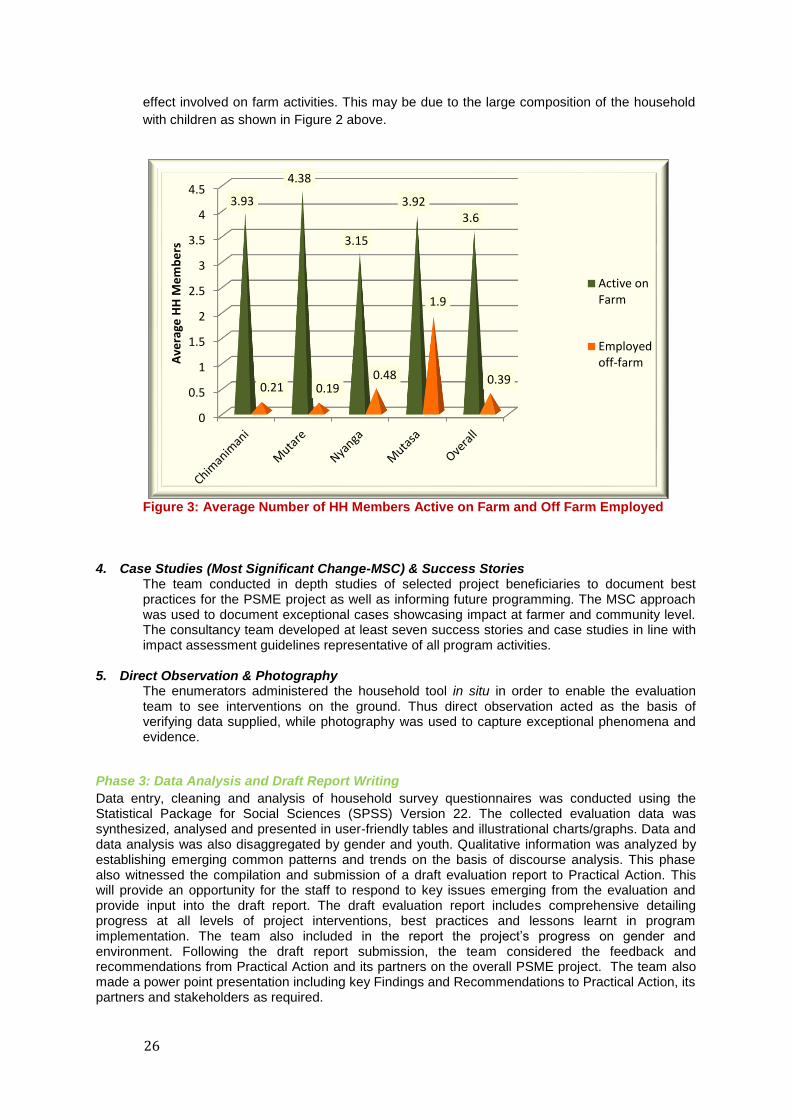
26
effect involved on farm activities. This may be due to the large composition of the household
with children as shown in Figure 2 above.
Figure 3: Average Number of HH Members Active on Farm and Off Farm Employed
4. Case Studies (Most Significant Change-MSC) & Success Stories The team conducted in depth studies of selected project beneficiaries to document best practices for the PSME project as well as informing future programming. The MSC approach was used to document exceptional cases showcasing impact at farmer and community level. The consultancy team developed at least seven success stories and case studies in line with impact assessment guidelines representative of all program activities.
5. Direct Observation & Photography The enumerators administered the household tool in situ in order to enable the evaluation team to see interventions on the ground. Thus direct observation acted as the basis of verifying data supplied, while photography was used to capture exceptional phenomena and evidence.
Phase 3: Data Analysis and Draft Report Writing
Data entry, cleaning and analysis of household survey questionnaires was conducted using the Statistical Package for Social Sciences (SPSS) Version 22. The collected evaluation data was synthesized, analysed and presented in user-friendly tables and illustrational charts/graphs. Data and data analysis was also disaggregated by gender and youth. Qualitative information was analyzed by establishing emerging common patterns and trends on the basis of discourse analysis. This phase also witnessed the compilation and submission of a draft evaluation report to Practical Action. This will provide an opportunity for the staff to respond to key issues emerging from the evaluation and provide input into the draft report. The draft evaluation report includes comprehensive detailing progress at all levels of project interventions, best practices and lessons learnt in program implementation. The team also included in the report the project’s progress on gender and environment. Following the draft report submission, the team considered the feedback and recommendations from Practical Action and its partners on the overall PSME project. The team also made a power point presentation including key Findings and Recommendations to Practical Action, its partners and stakeholders as required.
0
0.5
1
1.5
2
2.5
3
3.5
4
4.53.93
4.38
3.15
3.92 3.6
0.21 0.19 0.48
1.9
0.39
Ave
rage
HH
Me
mb
ers
Active onFarm
Employedoff-farm

27
Phase 4: Dissemination of Findings
This phase will be devoted to the presentation of preliminary findings and wider dissemination of the evaluation findings by Practical Action and its partners.
28
3. Key Findings
3.1. Relevance The PSME project was found to be relevant because its aims and design are well in tandem with the
objectives of the national food security policies, the beneficiaries’ needs, Practical Actions
development priorities as well as BLF’s supported programme outcomes. The PSME project was
implemented at a time when the country was recovering from one of its worst macro-economic crisis,
which had affected agricultural production and productivity levels particularly smallholder farmers who
are highly susceptible to shocks. The macro-economic crises had also negatively affected both the
input and output markets, leaving the farmers worse off. The project, therefore, provided a platform
upon which farmers would increase their production, productivity, market engagement, incomes as
well as food security situation. The project represents a move from emergency relief to a much
broader and sustainable recovery following the political and economic crisis. The project discouraged
an over reliance on aid and supported smallholder farmers with the confidence, knowledge and skills
to work together to develop a culture of interdependence where they now collaborate together to
make informed choices that promote a sustainable future for them and generations to come.
The PSME was primarily aimed at improving livelihoods of smallholder farmers and this is in line with
BLF’s outcome 5 which focused on improved livelihoods for the most disadvantaged people. The
PSME undertook a systematic approach to improving the livelihoods of poor smallholder farmers
through building understanding and strengthening the market linkages which enabled smallholder
farmers to identify and engage with market actors on more favourable terms. The development and
strengthening of smallholder marketing groups enabled them to plan and negotiate collectively to take
advantage of market opportunities realized through economies of scale. The project’s emphasis on
developing and strengthening agricultural input systems through development of a demand driven
supply of inputs enabled farmers to substantially and sustainably improve the quality and yield of their
crops as well as grow high value crops that are most in demand and profitable.
PMSE’s Outcome 1 on men and women are better able to manage their shared resources and act
collectively in improving their livelihoods also addresses Outcome 3 of BLF which focuses on
improved access to and use of natural resources to benefit the most disadvantaged. One of the
major challenges identified by the farmers during the needs assessment surveys was siltation of
water reservoirs, dams and canals due to soil erosion. PSME promoted better natural resources
management in all the 11 supported irrigation schemes by focusing on soil and water conservation,
soil fertility management practices and capacity building of farmers in improved and environmental
friendly and sustainable production practices.
The project also fits well with Practical Action’s goal on sustainable systems of agriculture and natural
resource management which seeks to build on Practical Action’s experience of working with women
and men in poor communities to adopt and adapt technologies for small-scale, ecologically
sustainable food provision. The overall strategy also focused on two cross-cutting theses – Climate
Change and Making Markets Work for the Poor (M4P) both of which are central to addressing the
challenges facing smallholder farmers in Zimbabwe today.
The PSME project was also found to be relevant as its four outcomes well aligned with ZIMASSET’s Food Security and Nutrition Cluster whose thrust is to create a self- sufficient and food surplus economy and see Zimbabwe re-emerge as the “Bread Basket of Southern Africa”. In particular the PSME contributes to the cluster’s key result areas of crop production and marketing, infrastructure development, environmental management, protection and conservation and nutrition. The project’s

29
outcomes are also aligned to the Comprehensive African Agricultural Development Programme (CAADP), Draft Comprehensive Agriculture Policy Framework (2012-2032), the Food and Nutrition Security Policy, the Zimbabwe Agriculture Investment Plan(2013-2017), SADC and COMESA Food and Nutrition Frameworks. We also found that the project was informed by findings of two feasibility assessment surveys conducted in 2010 and October 2011. In addition, evidence from works by other development partners working in Zimbabwe and in particular FAO, FCTZ, EU, USAID, AGRITEX and the Department of Irrigation were also consulted. There was strong evidence of the need for the project which recognized the priority areas for intervention as improvements in (1) irrigation schemes – the maintenance and rehabilitation and maximizing the use of the limited supply of water available, (2) farming practices – extension information and advice, quality of crops produced, access to seeds and fertilizer, harvesting methods, distribution costs, and (3) business skills – support for smallholders to work collaboratively, negotiation skills, coordinated marketing activities, budgeting and record keeping skills. Lastly we also found the delivery approach to be quite relevant in delivering the project. The project was delivered through a number of key partners each with specific core competences relevant to each of the identified four outcome areas. These included the FCTZ which was the main implementing partner and has hands-on skills in developing farmer groups and leadership development, Practical Action whose main function was to build capacity of farmers in market engagement through the Participatory Market Systems Development (PMSD), Zambuko Trust whose main thrust was for delivering business training and establishing and overseeing the VSLGs, AGRITEX and Department of Irrigation whose main responsibility was to provide day-to-day hands-on technical extension support to farmers. The project also sought to promote diversity, inclusivity, alliances with other key players and active participation of all beneficiaries. The relevance of the project was also echoed by one FDG participant who said: “Neproject tave nekwekutengesera uye mitengo yatavekuwana iri nani pane zvataiwana kare. Project isati yauya tainetseka nepekutengesera (With the PSME project, we now have markets for our produce and are also getting better prices for our produce. Before PSME we were struggling to find buyers for our produce)”

30
3.2. Effectiveness Effectiveness relates to how well outputs are converted to outcomes and impacts. Despite mixed results from the Indicator Progress Tracking Table (IPTT),
this project has achieved overall success. The details of the different outcomes and indicators are as elaborated below.
3.2.1. Outcome 1 Men and women farmers are better able to manage their shared resources and act collectively in improving their livelihoods
Table 7: IPTT for Outcome 1
Outcome 1 INDICATORS
Performance
Cumulative Target
Cumulative Achievement
Percent Achievement
Men and women farmers are better able to manage their shared resources and act collectively in improving their livelihoods
# of marketing committees established and active 11 11 100
Community based plans produced and implemented 11 11 100
% of farmers using improved production and conservation agriculture principles 90 98 109
# of farmers bulking and marketing their produce as groups, cumulative (yr 2) 3750 1658 44
# of irrigation schemes improved (improved canals and reduced water loss) 11 11 100
% of farmers involved in management of shared resources 95 89 94
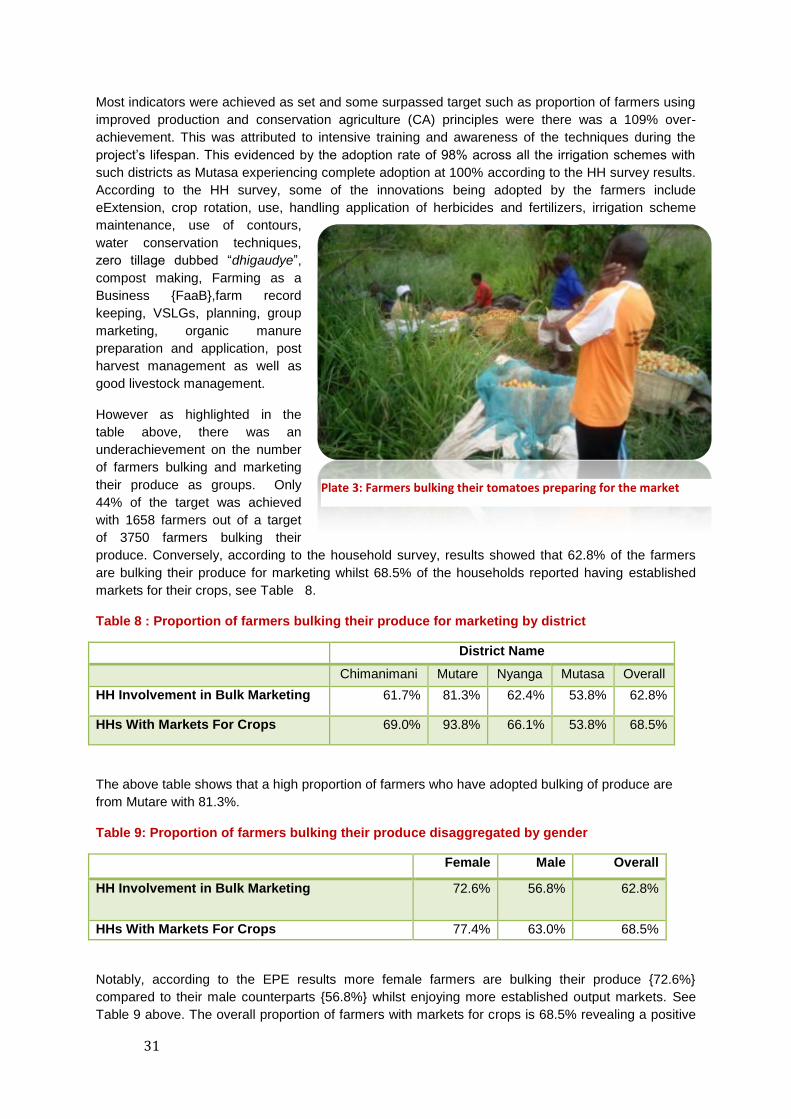
31
Most indicators were achieved as set and some surpassed target such as proportion of farmers using
improved production and conservation agriculture (CA) principles were there was a 109% over-
achievement. This was attributed to intensive training and awareness of the techniques during the
project’s lifespan. This evidenced by the adoption rate of 98% across all the irrigation schemes with
such districts as Mutasa experiencing complete adoption at 100% according to the HH survey results.
According to the HH survey, some of the innovations being adopted by the farmers include
eExtension, crop rotation, use, handling application of herbicides and fertilizers, irrigation scheme
maintenance, use of contours,
water conservation techniques,
zero tillage dubbed “dhigaudye”,
compost making, Farming as a
Business {FaaB},farm record
keeping, VSLGs, planning, group
marketing, organic manure
preparation and application, post
harvest management as well as
good livestock management.
However as highlighted in the
table above, there was an
underachievement on the number
of farmers bulking and marketing
their produce as groups. Only
44% of the target was achieved
with 1658 farmers out of a target
of 3750 farmers bulking their
produce. Conversely, according to the household survey, results showed that 62.8% of the farmers
are bulking their produce for marketing whilst 68.5% of the households reported having established
markets for their crops, see Table 8.
Table 8 : Proportion of farmers bulking their produce for marketing by district
District Name
Chimanimani Mutare Nyanga Mutasa Overall
HH Involvement in Bulk Marketing 61.7% 81.3% 62.4% 53.8% 62.8%
HHs With Markets For Crops 69.0% 93.8% 66.1% 53.8% 68.5%
The above table shows that a high proportion of farmers who have adopted bulking of produce are
from Mutare with 81.3%.
Table 9: Proportion of farmers bulking their produce disaggregated by gender
Female Male Overall
HH Involvement in Bulk Marketing 72.6% 56.8% 62.8%
HHs With Markets For Crops 77.4% 63.0% 68.5%
Notably, according to the EPE results more female farmers are bulking their produce {72.6%}
compared to their male counterparts {56.8%} whilst enjoying more established output markets. See
Table 9 above. The overall proportion of farmers with markets for crops is 68.5% revealing a positive
Plate 3: Farmers bulking their tomatoes preparing for the market
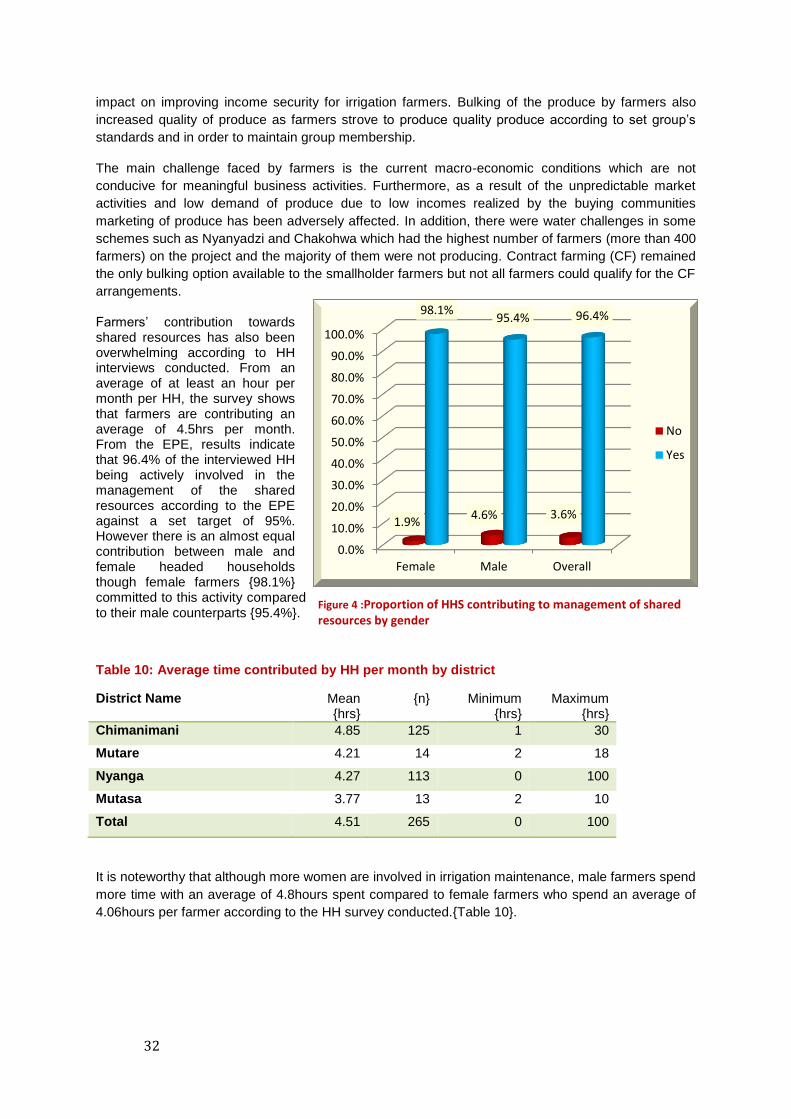
32
impact on improving income security for irrigation farmers. Bulking of the produce by farmers also
increased quality of produce as farmers strove to produce quality produce according to set group’s
standards and in order to maintain group membership.
The main challenge faced by farmers is the current macro-economic conditions which are not
conducive for meaningful business activities. Furthermore, as a result of the unpredictable market
activities and low demand of produce due to low incomes realized by the buying communities
marketing of produce has been adversely affected. In addition, there were water challenges in some
schemes such as Nyanyadzi and Chakohwa which had the highest number of farmers (more than 400
farmers) on the project and the majority of them were not producing. Contract farming (CF) remained
the only bulking option available to the smallholder farmers but not all farmers could qualify for the CF
arrangements.
Farmers’ contribution towards shared resources has also been overwhelming according to HH interviews conducted. From an average of at least an hour per month per HH, the survey shows that farmers are contributing an average of 4.5hrs per month. From the EPE, results indicate that 96.4% of the interviewed HH being actively involved in the management of the shared resources according to the EPE against a set target of 95%. However there is an almost equal contribution between male and female headed households though female farmers {98.1%} committed to this activity compared to their male counterparts {95.4%}.
Table 10: Average time contributed by HH per month by district
District Name Mean {hrs}
{n} Minimum {hrs}
Maximum {hrs}
Chimanimani 4.85 125 1 30
Mutare 4.21 14 2 18
Nyanga 4.27 113 0 100
Mutasa 3.77 13 2 10
Total 4.51 265 0 100
It is noteworthy that although more women are involved in irrigation maintenance, male farmers spend
more time with an average of 4.8hours spent compared to female farmers who spend an average of
4.06hours per farmer according to the HH survey conducted.{Table 10}.
0.0%
10.0%
20.0%
30.0%
40.0%
50.0%
60.0%
70.0%
80.0%
90.0%
100.0%
Female Male Overall
1.9% 4.6% 3.6%
98.1% 95.4% 96.4%
No
Yes
Figure 4 :Proportion of HHS contributing to management of shared resources by gender
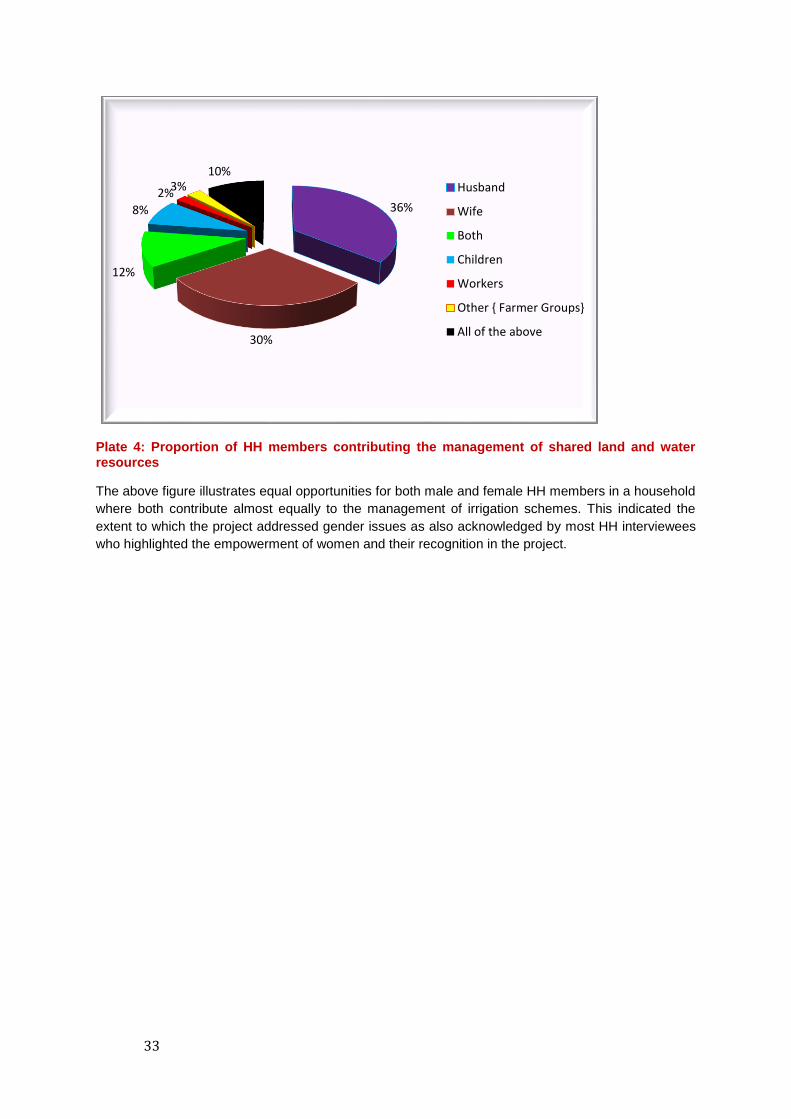
33
Plate 4: Proportion of HH members contributing the management of shared land and water resources
The above figure illustrates equal opportunities for both male and female HH members in a household
where both contribute almost equally to the management of irrigation schemes. This indicated the
extent to which the project addressed gender issues as also acknowledged by most HH interviewees
who highlighted the empowerment of women and their recognition in the project.
36%
30%
12%
8%
2% 3% 10%
Husband
Wife
Both
Children
Workers
Other { Farmer Groups}
All of the above
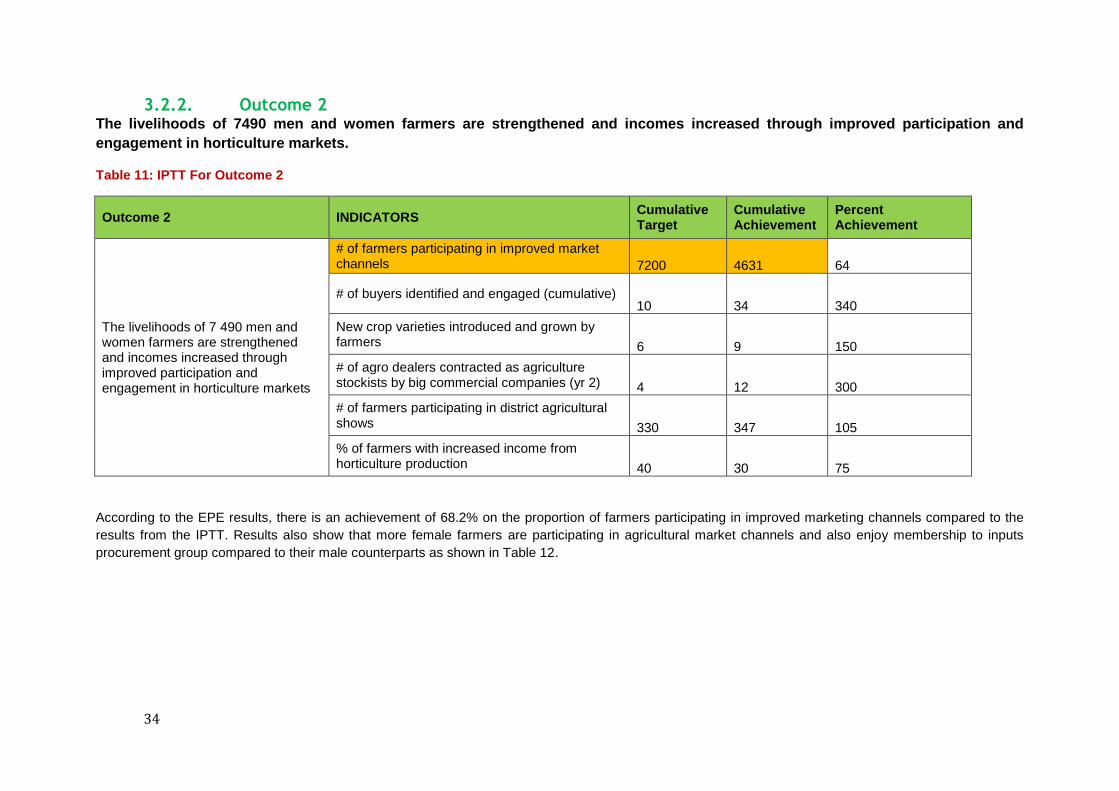
34
3.2.2. Outcome 2 The livelihoods of 7490 men and women farmers are strengthened and incomes increased through improved participation and
engagement in horticulture markets.
Table 11: IPTT For Outcome 2
Outcome 2 INDICATORS Cumulative Target
Cumulative Achievement
Percent Achievement
The livelihoods of 7 490 men and women farmers are strengthened and incomes increased through improved participation and engagement in horticulture markets
# of farmers participating in improved market channels 7200 4631 64
# of buyers identified and engaged (cumulative) 10 34 340
New crop varieties introduced and grown by farmers 6 9 150
# of agro dealers contracted as agriculture stockists by big commercial companies (yr 2) 4 12 300
# of farmers participating in district agricultural shows 330 347 105
% of farmers with increased income from horticulture production 40 30 75
According to the EPE results, there is an achievement of 68.2% on the proportion of farmers participating in improved marketing channels compared to the
results from the IPTT. Results also show that more female farmers are participating in agricultural market channels and also enjoy membership to inputs
procurement group compared to their male counterparts as shown in Table 12.
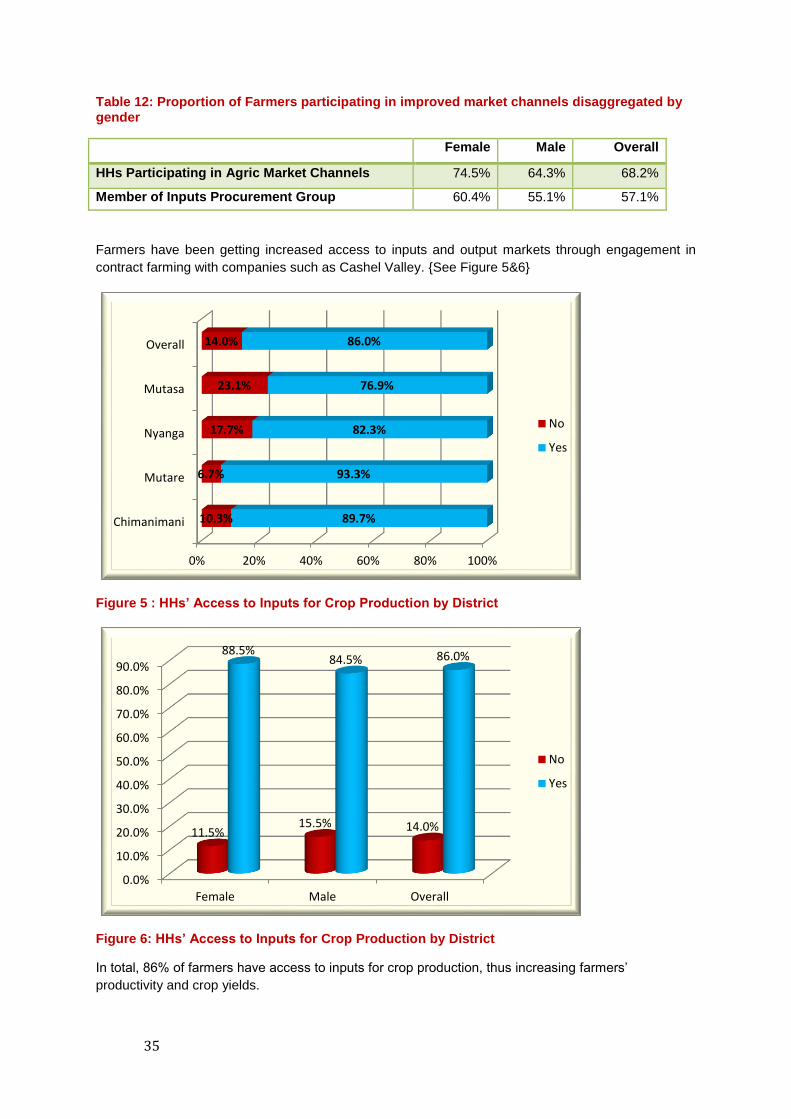
35
Table 12: Proportion of Farmers participating in improved market channels disaggregated by gender
Female Male Overall
HHs Participating in Agric Market Channels 74.5% 64.3% 68.2%
Member of Inputs Procurement Group 60.4% 55.1% 57.1%
Farmers have been getting increased access to inputs and output markets through engagement in
contract farming with companies such as Cashel Valley. {See Figure 5&6}
Figure 5 : HHs’ Access to Inputs for Crop Production by District
Figure 6: HHs’ Access to Inputs for Crop Production by District
In total, 86% of farmers have access to inputs for crop production, thus increasing farmers’
productivity and crop yields.
0% 20% 40% 60% 80% 100%
Chimanimani
Mutare
Nyanga
Mutasa
Overall
10.3%
6.7%
17.7%
23.1%
14.0%
89.7%
93.3%
82.3%
76.9%
86.0%
No
Yes
0.0%
10.0%
20.0%
30.0%
40.0%
50.0%
60.0%
70.0%
80.0%
90.0%
Female Male Overall
11.5% 15.5% 14.0%
88.5% 84.5% 86.0%
No
Yes

36
Besides the prevailing macro-economic challenges, the proportion of farmers participating in
improved market channels is higher (64%) than the proportion of farmers bulking their produce (44%)
as alluded to earlier. This is a result of better markets enjoyed by some farmers. The improved
markets include CF arrangements and supplying supermarkets such as Pick n Pay. Under this
outcome it is notable that most targets were overwhelmingly surpassed.
A number of new crop varieties were introduced during the life of the project which included pigeon
peas and different onion varieties.
A number of schemes adopted the cultivation of new crops which were being produced by other
schemes, for instance a scheme which was not producing pigeon pea produced by another scheme
would be considered a new crop in that scheme. Thus an achievement of 150% was attained under
this indicator. On the other hand a number of agro-dealers were contracted as agro-stockists by big
companies such as Svinurai (Cashel Valley}. Therefore, a 300% overachievement was attained from
a target of four agro-dealers to a total of 12 at the end of the PSME project.
The survey revealed that farmers’ are still facing challenges on horticultural marketing from stiff
competition offered by smuggled produce from neighbouring South Africa. These illegal products are
smuggled through trucks and buses and sold at below market prices. As a result, income generated
from horticultural produce sales on such products as onions and potatoes at especially Sakubva
market in Mutare has been negatively affected. To boost market linkages, a local company, Cairns is
in the process of contacting 40 hectares of horticultural products as a direct result of the project
intervention. Cairns was previously importing tomato paste from Egypt but now it is producing locally
as a result of the PSME project and hence increasing sustainable markets for the smallholder
farmers.
From Outcome 2 IPTT Table above, the proportion of farmers with increased income from horticulture
production is 30% making up an achievement rate of 75% but according to results from the EPE on
the selected irrigation schemes, more there is an overall proportion of 92.9%.
The initial target of number of farmers participating in district agricultural shows was 33, but this was revised internally to 330.
Plate 5: Farmers showcasing their produce at Nyakomba Agricultural Show {above}
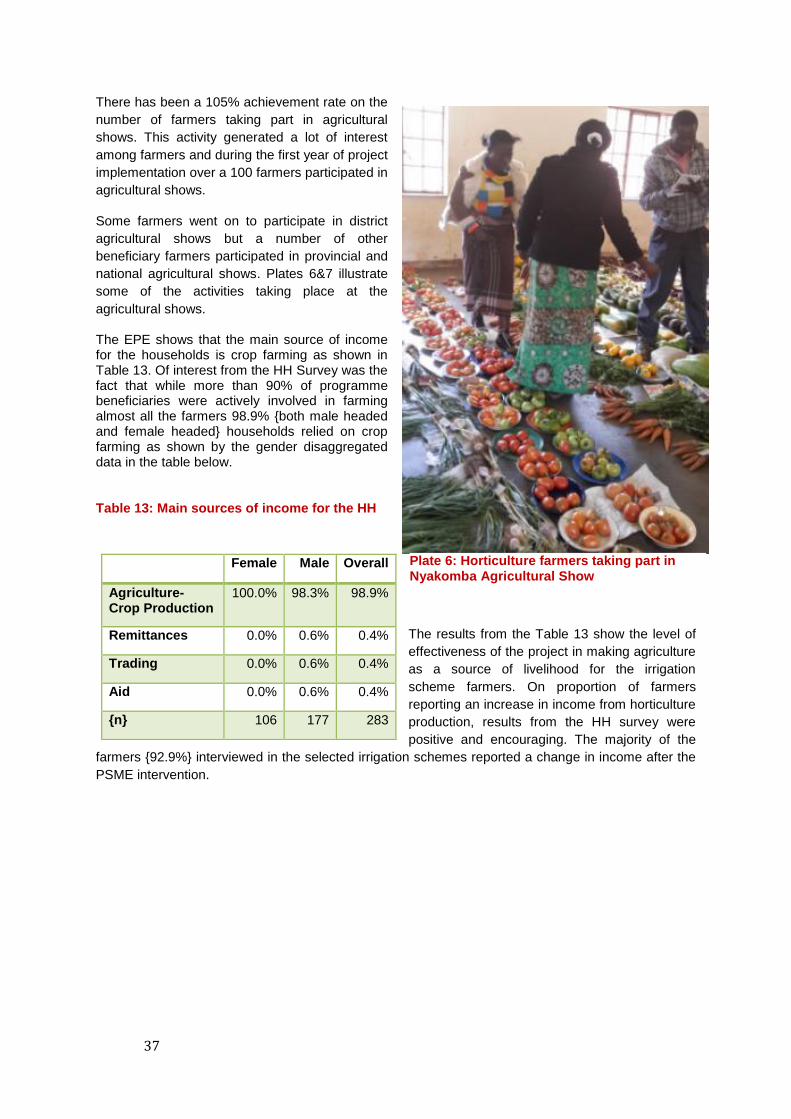
37
There has been a 105% achievement rate on the
number of farmers taking part in agricultural
shows. This activity generated a lot of interest
among farmers and during the first year of project
implementation over a 100 farmers participated in
agricultural shows.
Some farmers went on to participate in district
agricultural shows but a number of other
beneficiary farmers participated in provincial and
national agricultural shows. Plates 6&7 illustrate
some of the activities taking place at the
agricultural shows.
The EPE shows that the main source of income for the households is crop farming as shown in Table 13. Of interest from the HH Survey was the fact that while more than 90% of programme beneficiaries were actively involved in farming almost all the farmers 98.9% {both male headed and female headed} households relied on crop farming as shown by the gender disaggregated data in the table below.
Table 13: Main sources of income for the HH
The results from the Table 13 show the level of
effectiveness of the project in making agriculture
as a source of livelihood for the irrigation
scheme farmers. On proportion of farmers
reporting an increase in income from horticulture
production, results from the HH survey were
positive and encouraging. The majority of the
farmers {92.9%} interviewed in the selected irrigation schemes reported a change in income after the
PSME intervention.
Female Male Overall
Agriculture- Crop Production
100.0% 98.3% 98.9%
Remittances 0.0% 0.6% 0.4%
Trading 0.0% 0.6% 0.4%
Aid 0.0% 0.6% 0.4%
{n} 106 177 283
Plate 6: Horticulture farmers taking part in Nyakomba Agricultural Show
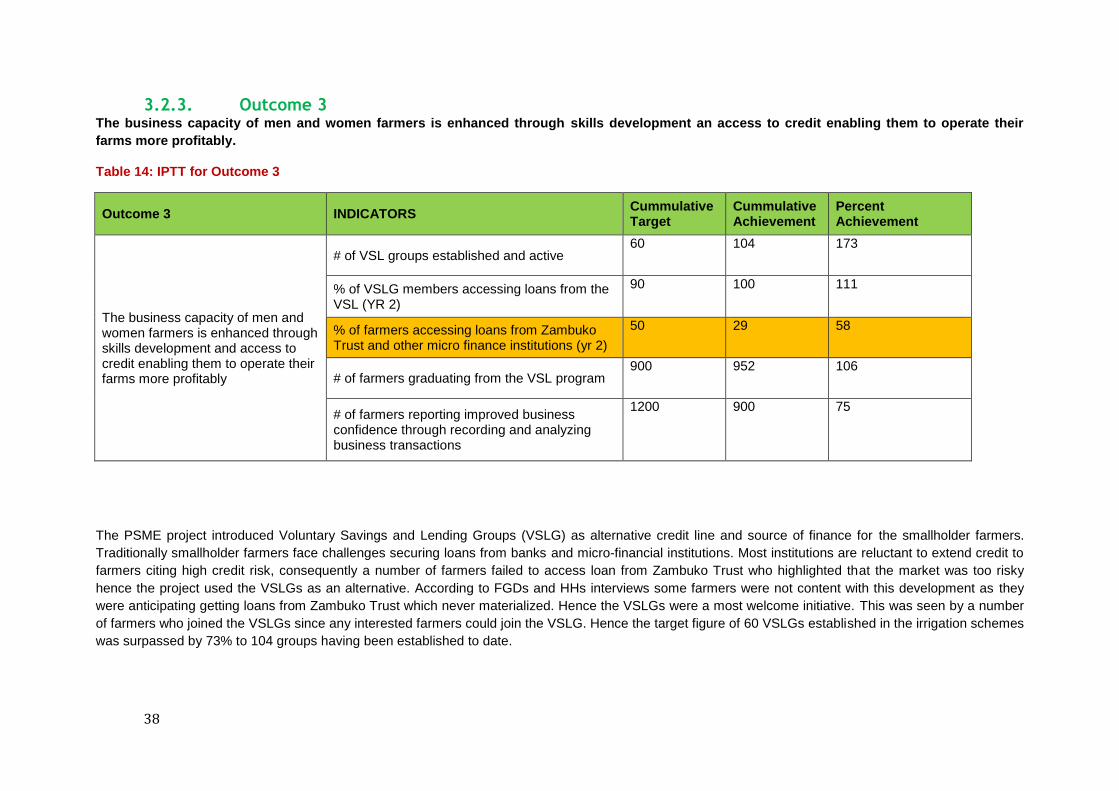
38
3.2.3. Outcome 3 The business capacity of men and women farmers is enhanced through skills development an access to credit enabling them to operate their
farms more profitably.
Table 14: IPTT for Outcome 3
Outcome 3 INDICATORS Cummulative Target
Cummulative Achievement
Percent Achievement
The business capacity of men and women farmers is enhanced through skills development and access to credit enabling them to operate their farms more profitably
# of VSL groups established and active 60 104 173
% of VSLG members accessing loans from the VSL (YR 2)
90 100 111
% of farmers accessing loans from Zambuko Trust and other micro finance institutions (yr 2)
50 29 58
# of farmers graduating from the VSL program 900 952 106
# of farmers reporting improved business confidence through recording and analyzing business transactions
1200 900 75
The PSME project introduced Voluntary Savings and Lending Groups (VSLG) as alternative credit line and source of finance for the smallholder farmers.
Traditionally smallholder farmers face challenges securing loans from banks and micro-financial institutions. Most institutions are reluctant to extend credit to
farmers citing high credit risk, consequently a number of farmers failed to access loan from Zambuko Trust who highlighted that the market was too risky
hence the project used the VSLGs as an alternative. According to FGDs and HHs interviews some farmers were not content with this development as they
were anticipating getting loans from Zambuko Trust which never materialized. Hence the VSLGs were a most welcome initiative. This was seen by a number
of farmers who joined the VSLGs since any interested farmers could join the VSLG. Hence the target figure of 60 VSLGs established in the irrigation schemes
was surpassed by 73% to 104 groups having been established to date.

39
From the EPE results only abput 20% of the farmers received loans from Zambuko Trust and other
micro-finace institutions as illustrated in Figure 7.
Figure 7: Households’ Access to Finance {VSLG/ Micro Finance Institutions} by District
An analysis on HHs’ access to finance and membership to VSLGs was also conducted by gender.
Results show that overall female farmers had more access to finance than male farmers with more
than 68% of the female farmers having accessed loan from a VSLG and 64% being members of
“mikando” {VSLGs}. In comparison, only 55% male farmers have accessed loans from VSLG and
have membership to such credit groups as shown in Figure 8.
0.0% 20.0% 40.0% 60.0% 80.0%
Chimanimani
Mutare
Nyanga
Mutasa
Overall
18.0%
62.5%
57.6%
69.2%
40.4%
18.0%
50.0%
62.1%
61.5%
41.8%
52.3%
62.5%
63.2%
61.5%
58.2%
59.2%
64.3%
59.3%
66.7%
59.9%
25.0%
31.3%
15.2%
7.7%
20.1% Accessed loans fromZambuko/ MicroFinance
HH Acessed Loanfrom VSLG
VSLG Membership
Accessed Loans ForCrop Production
Member of Farmers'credit Group

40
Figure 8: Households’ Access to Finance {VSLG/ Micro Finance Institutions} by Gender
The VSLGs are the most cost effective sources, and offer an easy access to much needed finance for
the farmers. The mechanisms generated a lot of interest among the farmers for instance, at
Nyanyadzi irrigation scheme, even Agricultural Extension Officers (AEOs) formed their own VSLG.
The alternative source of finance that was engaged by the project was CABS to increase farmers’
access to loans and finance. This has just been approved and they have not started lending yet.
The project failed to meet its target on the number of farmers reporting improved business confidence
through recording and analyzing business transactions. This was mainly due to the inherent
weakness of the Training of Trainers
(ToT) and lead farmer approach adopted.
The project could only make follow ups on
the initial training but it had no control
over the entire process.
According to the HH survey, 71.4% record
and analyse business transactions. This
contributes to the under achievement of
this indicator as shown in the IPTT as
there has not been wholesome adoption
of this innovation where 900 out of the
targeted 1200 farmers {75%} have
reported improved business confidence
through recording and analysing business
transactions. This is attributable to
farmers who still need to appreciate the
concept of FaaB.
0%
10%
20%
30%
40%
50%
60%
70%
Member ofFarmers'
credit Group
AccessedLoans For
CropProduction
VSLGMembership
HH AcessedLoan from
VSLG
Accessedloans fromZambuko/
Micro Finance
44% 44%
64% 68%
18%
38% 40%
55% 55%
22%
40% 42%
58% 60%
20%
Female
Male
Overall
Plate 7: A farmer showing a record of his maize crop at a maize field day at Chakohwa irrigation scheme

41
3.2.4. Outcome 4 Horticulture farmers in Manicaland are able to access high quality relevant and timely extension and market engagement advice for a wider range
of crops from district and provincial extension services and private sector providers.
Table 15 : IPTT for Outcome 4
Outcome 4 INDICATORS Cumulative Target
Cumulative Achievement
Percent Achievement
Horticulture farmers in Manicaland are able to access high quality, relevant and timely extension and market engagement advice for a wider range of crops from district and provincial extension services and private sector providers
# of farmers identified supported and active as lead farmers 375 366 98
# of farmers' major extension needs met by the lead farmers (cumulative)
6750 4631 69
# of extension officers using PMSD as a market facilitation approach, cumulative (yr 2)
22 25 114
# of lessons shared through podcasting (cumulative)
264 287 109
# of extension officers outside the project using PMSD as a market facilitation approach
140 7 5
The project has managed to increase extension reach to the farmers in the irrigation schemes from a ratio of 1:18 according to the project design to the
current 1:10 which is a fair proportion. Less lead farmers were trained than anticipated, hence an underachievement on this indicator. This has also increased
cascading of training to the farmers, and timely extension and market engagement advice. Extension advice and marketing information dissemination to the
farmers has also been facilitated through podcasting. This is where short messages (less than five minutes) are recorded on any agricultural related
information and advice and farmers meet and listen to these messages on cassette from radios.
Only a 5% achievement rate was attained on the number of extension officers (EOs) outside the project using Participatory Market Systems Development
(PMSD) as a market facilitation approach. Out of a target of 140 EOs, only seven are using the PSMD approach. This is attr ibuted to the project’s budget
constraints and cost implications as the resources available could not be stretched too far. The total number of EOs trained outside the project was and of
these only seven (50%) are using the PMSD approach and this even though it is a small proportion of EOs trained the adoption rate is quite positive and
encouraging.
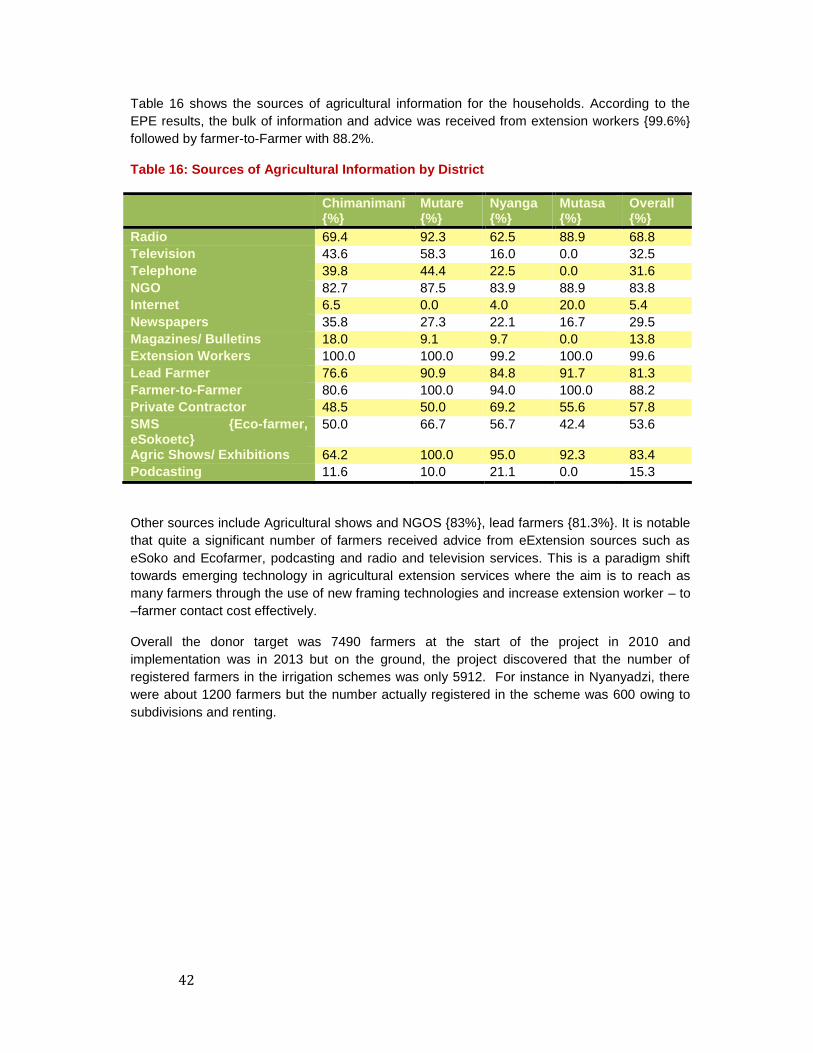
42
Table 16 shows the sources of agricultural information for the households. According to the
EPE results, the bulk of information and advice was received from extension workers {99.6%}
followed by farmer-to-Farmer with 88.2%.
Table 16: Sources of Agricultural Information by District
Chimanimani {%}
Mutare {%}
Nyanga {%}
Mutasa {%}
Overall {%}
Radio 69.4 92.3 62.5 88.9 68.8
Television 43.6 58.3 16.0 0.0 32.5
Telephone 39.8 44.4 22.5 0.0 31.6
NGO 82.7 87.5 83.9 88.9 83.8
Internet 6.5 0.0 4.0 20.0 5.4
Newspapers 35.8 27.3 22.1 16.7 29.5
Magazines/ Bulletins 18.0 9.1 9.7 0.0 13.8
Extension Workers 100.0 100.0 99.2 100.0 99.6
Lead Farmer 76.6 90.9 84.8 91.7 81.3
Farmer-to-Farmer 80.6 100.0 94.0 100.0 88.2
Private Contractor 48.5 50.0 69.2 55.6 57.8
SMS {Eco-farmer, eSokoetc}
50.0 66.7 56.7 42.4 53.6
Agric Shows/ Exhibitions 64.2 100.0 95.0 92.3 83.4
Podcasting 11.6 10.0 21.1 0.0 15.3
Other sources include Agricultural shows and NGOS {83%}, lead farmers {81.3%}. It is notable
that quite a significant number of farmers received advice from eExtension sources such as
eSoko and Ecofarmer, podcasting and radio and television services. This is a paradigm shift
towards emerging technology in agricultural extension services where the aim is to reach as
many farmers through the use of new framing technologies and increase extension worker – to
–farmer contact cost effectively.
Overall the donor target was 7490 farmers at the start of the project in 2010 and
implementation was in 2013 but on the ground, the project discovered that the number of
registered farmers in the irrigation schemes was only 5912. For instance in Nyanyadzi, there
were about 1200 farmers but the number actually registered in the scheme was 600 owing to
subdivisions and renting.
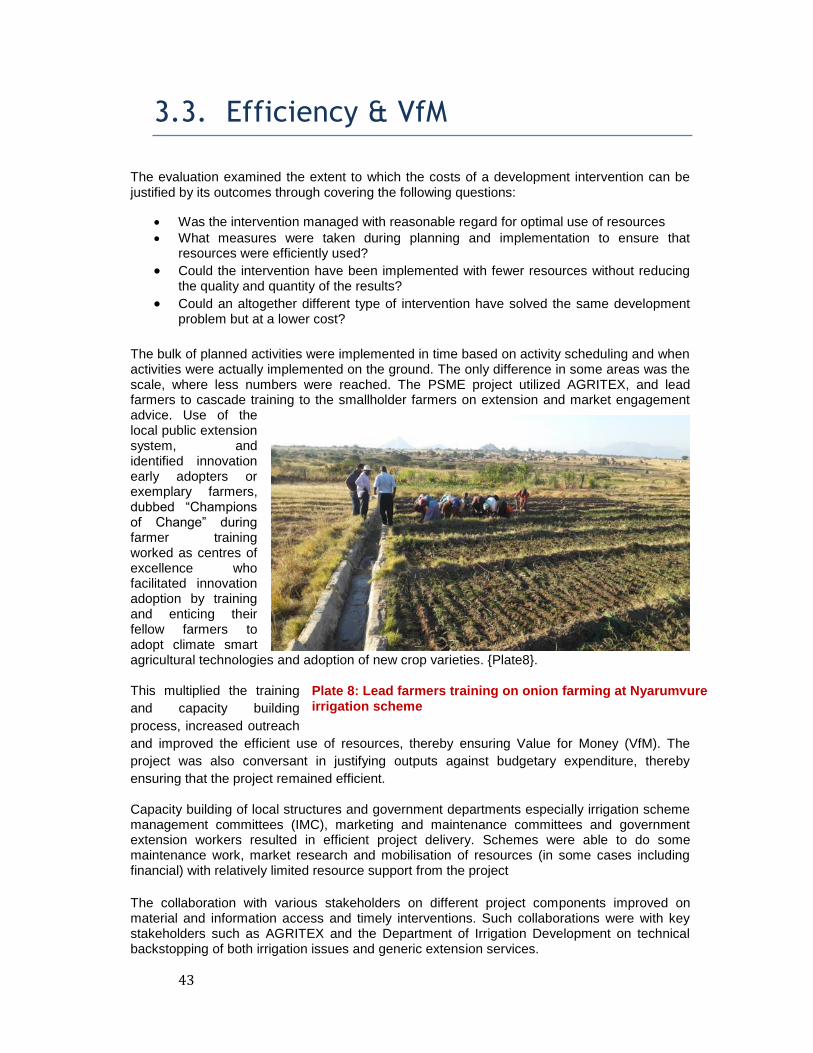
43
3.3. Efficiency & VfM
The evaluation examined the extent to which the costs of a development intervention can be justified by its outcomes through covering the following questions:
Was the intervention managed with reasonable regard for optimal use of resources
What measures were taken during planning and implementation to ensure that resources were efficiently used?
Could the intervention have been implemented with fewer resources without reducing the quality and quantity of the results?
Could an altogether different type of intervention have solved the same development problem but at a lower cost?
The bulk of planned activities were implemented in time based on activity scheduling and when activities were actually implemented on the ground. The only difference in some areas was the scale, where less numbers were reached. The PSME project utilized AGRITEX, and lead farmers to cascade training to the smallholder farmers on extension and market engagement advice. Use of the local public extension system, and identified innovation early adopters or exemplary farmers, dubbed “Champions of Change” during farmer training worked as centres of excellence who facilitated innovation adoption by training and enticing their fellow farmers to adopt climate smart agricultural technologies and adoption of new crop varieties. {Plate8}. This multiplied the training
and capacity building
process, increased outreach
and improved the efficient use of resources, thereby ensuring Value for Money (VfM). The
project was also conversant in justifying outputs against budgetary expenditure, thereby
ensuring that the project remained efficient.
Capacity building of local structures and government departments especially irrigation scheme management committees (IMC), marketing and maintenance committees and government extension workers resulted in efficient project delivery. Schemes were able to do some maintenance work, market research and mobilisation of resources (in some cases including financial) with relatively limited resource support from the project
The collaboration with various stakeholders on different project components improved on material and information access and timely interventions. Such collaborations were with key stakeholders such as AGRITEX and the Department of Irrigation Development on technical backstopping of both irrigation issues and generic extension services.
Plate 8: Lead farmers training on onion farming at Nyarumvure irrigation scheme
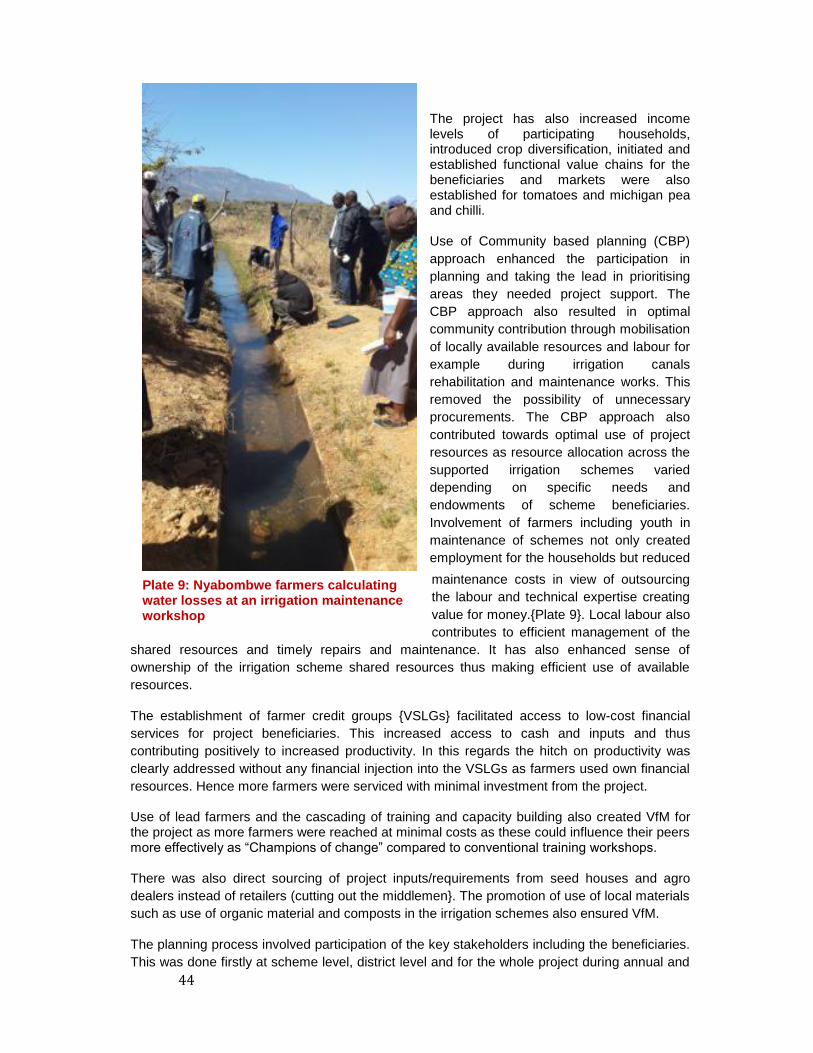
44
The project has also increased income levels of participating households, introduced crop diversification, initiated and established functional value chains for the beneficiaries and markets were also established for tomatoes and michigan pea and chilli. Use of Community based planning (CBP)
approach enhanced the participation in
planning and taking the lead in prioritising
areas they needed project support. The
CBP approach also resulted in optimal
community contribution through mobilisation
of locally available resources and labour for
example during irrigation canals
rehabilitation and maintenance works. This
removed the possibility of unnecessary
procurements. The CBP approach also
contributed towards optimal use of project
resources as resource allocation across the
supported irrigation schemes varied
depending on specific needs and
endowments of scheme beneficiaries.
Involvement of farmers including youth in
maintenance of schemes not only created
employment for the households but reduced
maintenance costs in view of outsourcing
the labour and technical expertise creating
value for money.{Plate 9}. Local labour also
contributes to efficient management of the
shared resources and timely repairs and maintenance. It has also enhanced sense of
ownership of the irrigation scheme shared resources thus making efficient use of available
resources.
The establishment of farmer credit groups {VSLGs} facilitated access to low-cost financial
services for project beneficiaries. This increased access to cash and inputs and thus
contributing positively to increased productivity. In this regards the hitch on productivity was
clearly addressed without any financial injection into the VSLGs as farmers used own financial
resources. Hence more farmers were serviced with minimal investment from the project.
Use of lead farmers and the cascading of training and capacity building also created VfM for the project as more farmers were reached at minimal costs as these could influence their peers more effectively as “Champions of change” compared to conventional training workshops. There was also direct sourcing of project inputs/requirements from seed houses and agro
dealers instead of retailers (cutting out the middlemen}. The promotion of use of local materials
such as use of organic material and composts in the irrigation schemes also ensured VfM.
The planning process involved participation of the key stakeholders including the beneficiaries.
This was done firstly at scheme level, district level and for the whole project during annual and
Plate 9: Nyabombwe farmers calculating water losses at an irrigation maintenance workshop

45
planning reviews. This multi stakeholder planning process contributed towards efficient
resource utilisation.
Based on these observations it is highly likely that same results could have been achieved with
less resources with compromising on quality of project delivery and number of beneficiaries
reached.

46
3.4. Impact Assessment of impact involved the systematic analysis of changes brought in the lives of beneficiaries. The evaluation attempted to determine the extent to which the project achieved the intended effects (positive and negative, intended and unintended) on beneficiaries (extreme poor, women, and men, children, disabled), institutions and the environment. It also sought to find out the extent to which changes can be attributed to program implementation for target groups and the level of partner organizations. The results of the evaluation are presented to answer four major questions:
● What are the intended and unintended, positive and negative, effects of the intervention on people, institutions and the physical environment?
● What do the beneficiaries and other stakeholders affected by the intervention perceive to be the effects of the intervention on themselves (different subgroups and looked at differential impacts on extreme poor, women, men, children, disabled?)
● To what extent does the intervention contribute to capacity development and the strengthening of institutions?
● To what extent can identified changes be attributed to the intervention? Farmers were asked to reflect on the overall changes they had seen as a result of the PSME project both positive and negative.
3.4.1. Technology Adoption Technology adoption is critical for the improvement of the farmers’ livelihoods and well-being. Overall 92% of the households indicated that they adopted improved production and conservation agriculture technologies as a result of PSME (Figure 9). This compares with a baseline target of 90%. The percent households adopting improved production and conservation agriculture technologies is highest in Mutasa district with 100% of the sampled farmers indicating adoption and lowest in Chimanimani district where 88% of the farmers indicated adoption. The percent female headed households who adopted improved production and conservation agriculture technologies is 89% compared to 96% for male headed households.
Figure 9: Adoption of Improved Production and CA Technologies as a Result of PSME by District

47
The Word Cloud presented in Figure 10below presents a summary of the most important technologies adopted by the farmers. From the Word Cloud the most widely adopted technologies stands out as conservation agriculture, record keeping, crop rotation, mulching amongst others.
71% of the interviewed farmers indicated that they were practicing record keeping and analyzing business transactions regularly (Figure 11). Of these, 82% indicated that they adopted the practice as a result of the PSME project.
Figure 11: Proportion of HHs Practicing Record keeping and Adoption of practice due to PSME intervention
Figure 10: Word Cloud: Technologies adopted by farmers as a result of the PSME Project
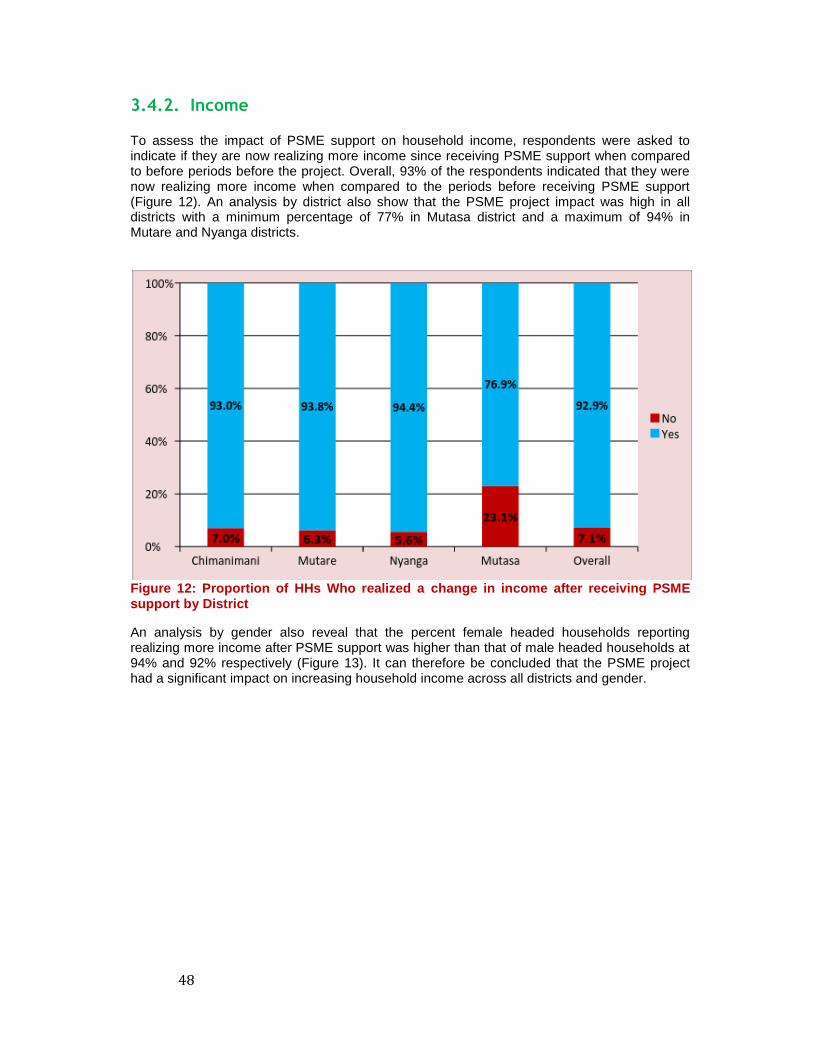
48
3.4.2. Income To assess the impact of PSME support on household income, respondents were asked to indicate if they are now realizing more income since receiving PSME support when compared to before periods before the project. Overall, 93% of the respondents indicated that they were now realizing more income when compared to the periods before receiving PSME support (Figure 12). An analysis by district also show that the PSME project impact was high in all districts with a minimum percentage of 77% in Mutasa district and a maximum of 94% in Mutare and Nyanga districts.
Figure 12: Proportion of HHs Who realized a change in income after receiving PSME support by District
An analysis by gender also reveal that the percent female headed households reporting realizing more income after PSME support was higher than that of male headed households at 94% and 92% respectively (Figure 13). It can therefore be concluded that the PSME project had a significant impact on increasing household income across all districts and gender.
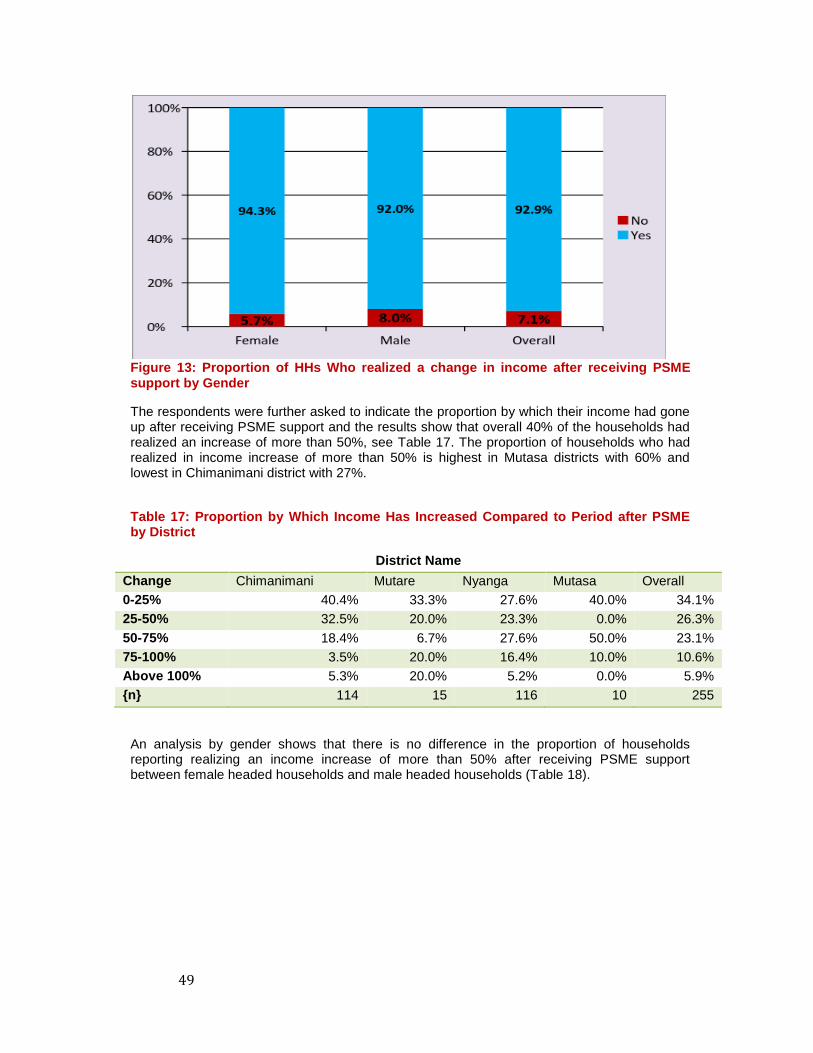
49
Figure 13: Proportion of HHs Who realized a change in income after receiving PSME support by Gender
The respondents were further asked to indicate the proportion by which their income had gone up after receiving PSME support and the results show that overall 40% of the households had realized an increase of more than 50%, see Table 17. The proportion of households who had realized in income increase of more than 50% is highest in Mutasa districts with 60% and lowest in Chimanimani district with 27%.
Table 17: Proportion by Which Income Has Increased Compared to Period after PSME by District
District Name
Change Chimanimani Mutare Nyanga Mutasa Overall
0-25% 40.4% 33.3% 27.6% 40.0% 34.1%
25-50% 32.5% 20.0% 23.3% 0.0% 26.3%
50-75% 18.4% 6.7% 27.6% 50.0% 23.1%
75-100% 3.5% 20.0% 16.4% 10.0% 10.6%
Above 100% 5.3% 20.0% 5.2% 0.0% 5.9%
{n} 114 15 116 10 255
An analysis by gender shows that there is no difference in the proportion of households reporting realizing an income increase of more than 50% after receiving PSME support between female headed households and male headed households (Table 18).
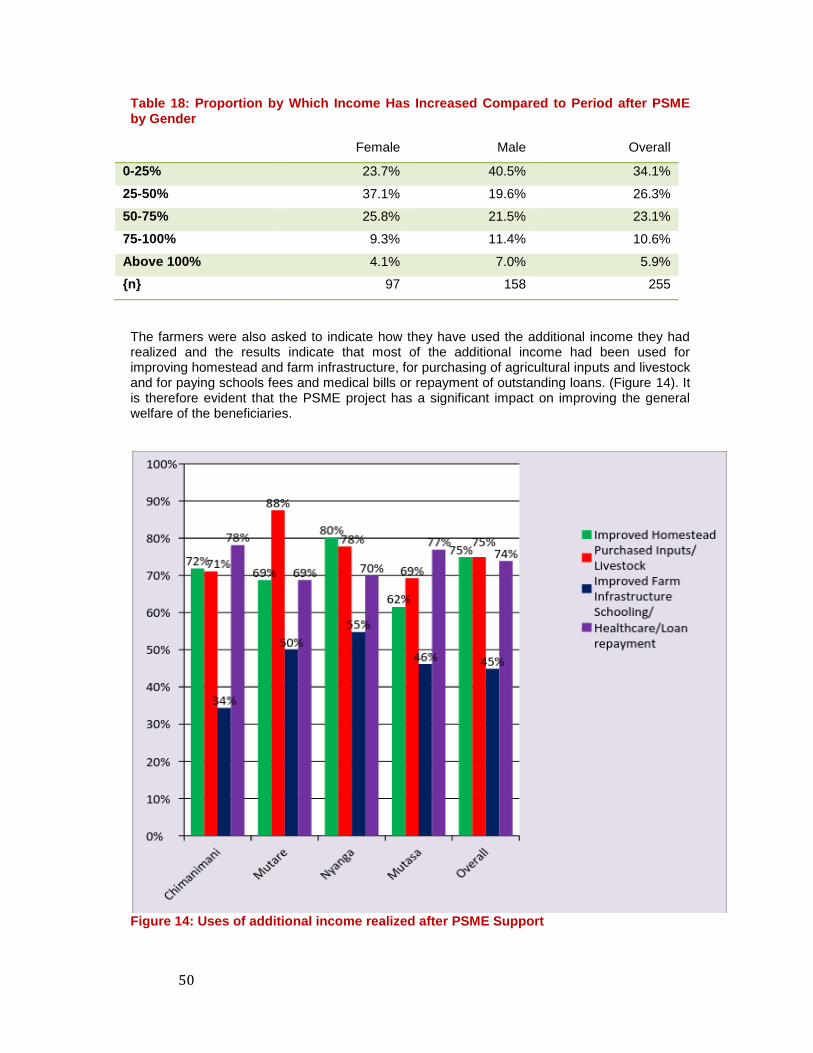
50
Table 18: Proportion by Which Income Has Increased Compared to Period after PSME by Gender
Female Male Overall
0-25% 23.7% 40.5% 34.1%
25-50% 37.1% 19.6% 26.3%
50-75% 25.8% 21.5% 23.1%
75-100% 9.3% 11.4% 10.6%
Above 100% 4.1% 7.0% 5.9%
{n} 97 158 255
The farmers were also asked to indicate how they have used the additional income they had realized and the results indicate that most of the additional income had been used for improving homestead and farm infrastructure, for purchasing of agricultural inputs and livestock and for paying schools fees and medical bills or repayment of outstanding loans. (Figure 14). It is therefore evident that the PSME project has a significant impact on improving the general welfare of the beneficiaries.
Figure 14: Uses of additional income realized after PSME Support
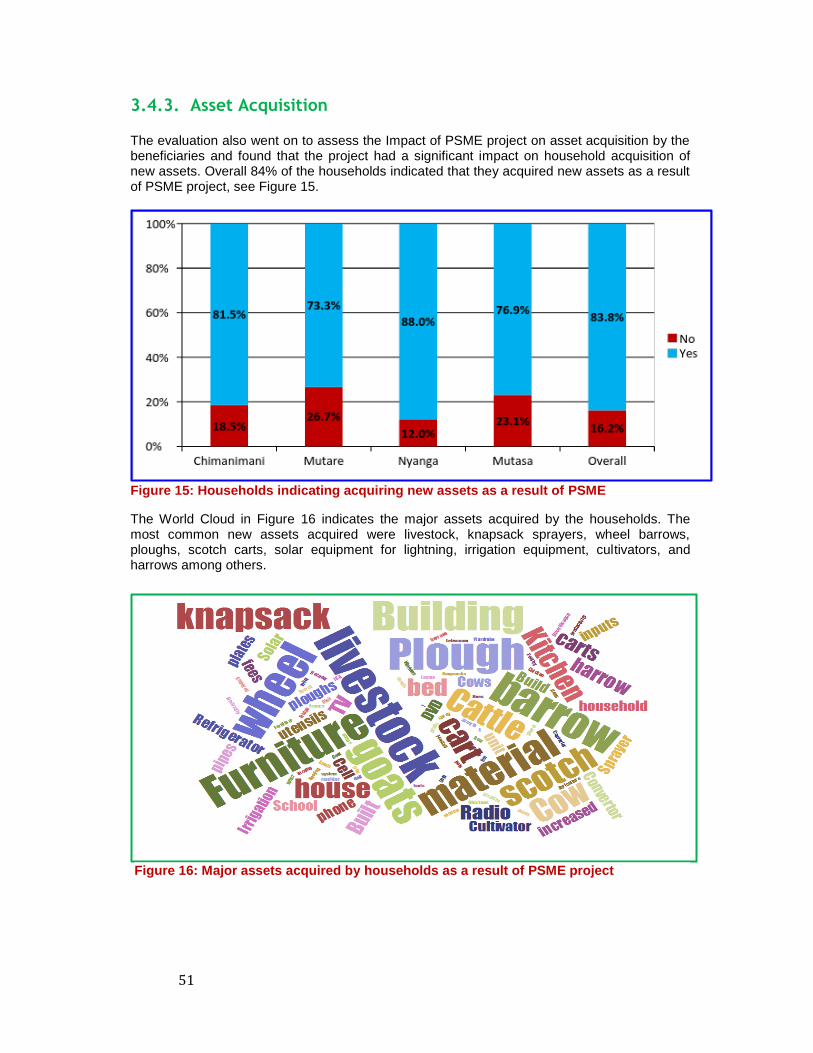
51
3.4.3. Asset Acquisition The evaluation also went on to assess the Impact of PSME project on asset acquisition by the beneficiaries and found that the project had a significant impact on household acquisition of new assets. Overall 84% of the households indicated that they acquired new assets as a result of PSME project, see Figure 15.
Figure 15: Households indicating acquiring new assets as a result of PSME
The World Cloud in Figure 16 indicates the major assets acquired by the households. The most common new assets acquired were livestock, knapsack sprayers, wheel barrows, ploughs, scotch carts, solar equipment for lightning, irrigation equipment, cultivators, and harrows among others.
Figure 16: Major assets acquired by households as a result of PSME project

52
3.4.4. Employment Creation One of the major challenges facing Zimbabwe today is unemployment and any intervention that contributes towards addressing this challenge is most welcome. Creating rural employment also reduces outward migration of labour from the farms to farms and in some cases to neighbouring countries. The evaluation found that the PSME had a significant impact on seasonal employment and permanent employment with respondents reporting an overall increase of 101% for seasonal employment and 26% for permanent employment (Table 19). Households in Mutasa, Mutare and Nyanga reported the highest changes in seasonal employment with increases of 211%, 174% and 154% respectively.
Table 19: Impact of PSME on employment
Before PSME Support
{number}
After PSME Support
{number}
Percentage Change
HH Members
Chimanimani 440 417 -5.2% Mutare 53 49 -7.5%
Nyanga 348 341 -2.0% Mutasa 51 51 0.0%
Overall 892 858 -3.8%
Permanent Workers
Chimanimani 26 29 11.50% Mutare 0 1 Nyanga 9 14 55.60% Mutasa Overall 35 44 25.70%
Seasonal / Part time Workers
Chimanimani 211 336 59.2% Mutare 31 85 174.2% Nyanga 105 267 154.3% Mutasa 9 28 211.1% Overall 356 716 101.1%
3.4.5. Food Security The evaluation also looked at the project’s impact on food security. This was assessed using the household grain self- sufficiency index (GSSI) for those households producing grain crops. Given the total adult equivalents (TAE) per household and the grain requirements per adult equivalent (AE), the minimum grain requirements for a household per year is calculated as:
TAE*145kg
Given the total grain production per household (GRAINP), the grain self-sufficient index (GSSI) is calculated as:
The evaluation used 145 kg as the grain requirements per year for an adult equivalent. The evaluation decided to report on results for the TAE by age group as this takes into account the
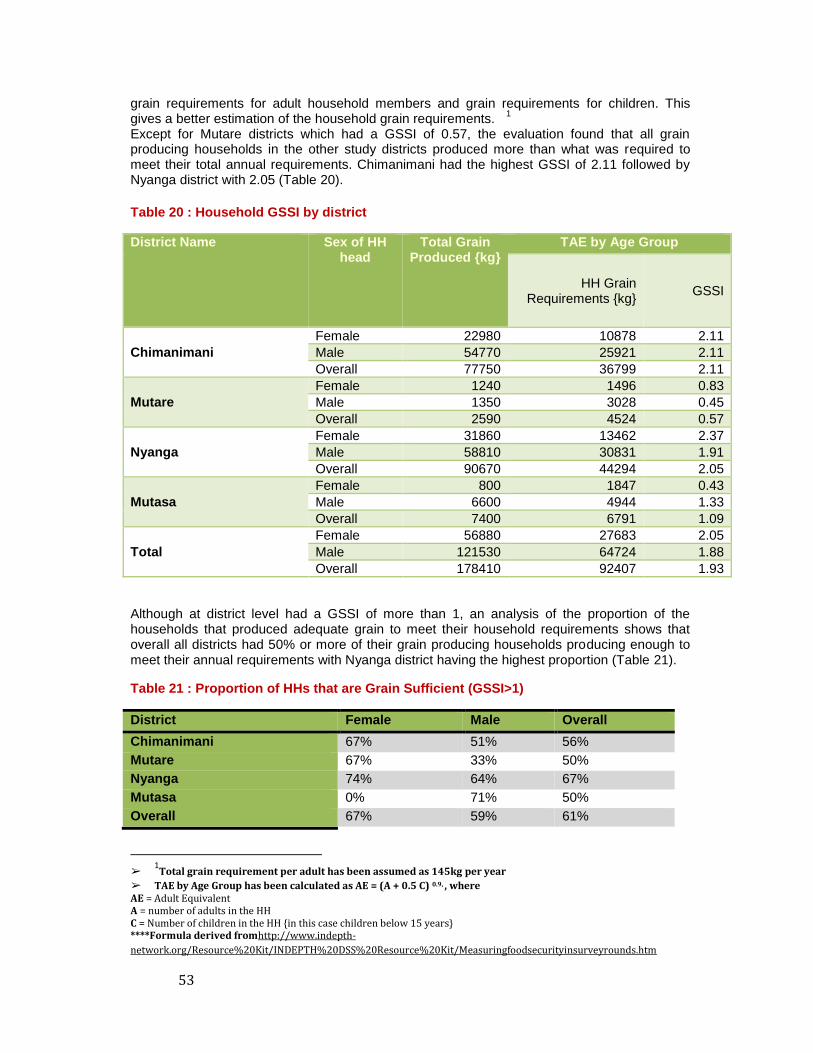
53
grain requirements for adult household members and grain requirements for children. This gives a better estimation of the household grain requirements.
1
Except for Mutare districts which had a GSSI of 0.57, the evaluation found that all grain producing households in the other study districts produced more than what was required to meet their total annual requirements. Chimanimani had the highest GSSI of 2.11 followed by Nyanga district with 2.05 (Table 20).
Table 20 : Household GSSI by district
District Name Sex of HH head
Total Grain Produced {kg}
TAE by Age Group
HH Grain Requirements {kg}
GSSI
Chimanimani
Female 22980 10878 2.11
Male 54770 25921 2.11
Overall 77750 36799 2.11
Mutare
Female 1240 1496 0.83
Male 1350 3028 0.45
Overall 2590 4524 0.57
Nyanga
Female 31860 13462 2.37
Male 58810 30831 1.91
Overall 90670 44294 2.05
Mutasa
Female 800 1847 0.43
Male 6600 4944 1.33
Overall 7400 6791 1.09
Total
Female 56880 27683 2.05
Male 121530 64724 1.88
Overall 178410 92407 1.93
Although at district level had a GSSI of more than 1, an analysis of the proportion of the households that produced adequate grain to meet their household requirements shows that overall all districts had 50% or more of their grain producing households producing enough to meet their annual requirements with Nyanga district having the highest proportion (Table 21).
Table 21 : Proportion of HHs that are Grain Sufficient (GSSI>1)
District Female Male Overall
Chimanimani 67% 51% 56%
Mutare 67% 33% 50%
Nyanga 74% 64% 67%
Mutasa 0% 71% 50%
Overall 67% 59% 61%
➢
1Total grain requirement per adult has been assumed as 145kg per year
➢ TAE by Age Group has been calculated as AE = (A + 0.5 C) 0.9, , where AE = Adult Equivalent A = number of adults in the HH C = Number of children in the HH {in this case children below 15 years} ****Formula derived fromhttp://www.indepth-
network.org/Resource%20Kit/INDEPTH%20DSS%20Resource%20Kit/Measuringfoodsecurityinsurveyrounds.htm
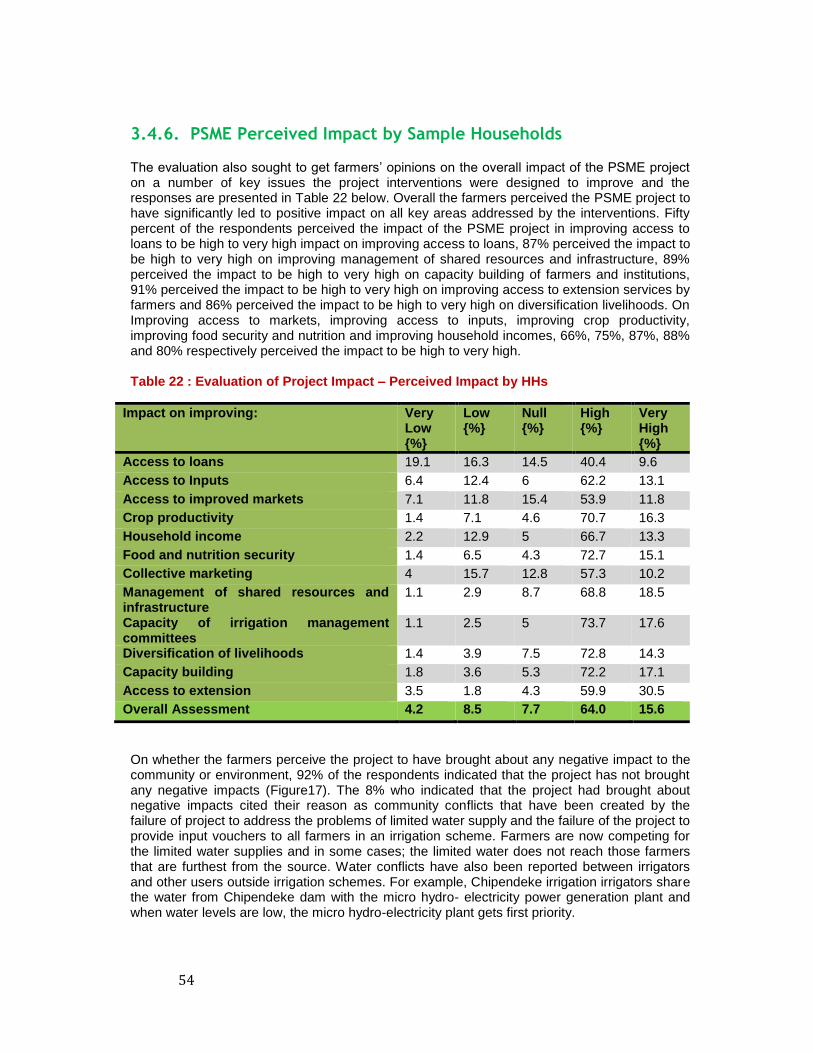
54
3.4.6. PSME Perceived Impact by Sample Households The evaluation also sought to get farmers’ opinions on the overall impact of the PSME project on a number of key issues the project interventions were designed to improve and the responses are presented in Table 22 below. Overall the farmers perceived the PSME project to have significantly led to positive impact on all key areas addressed by the interventions. Fifty percent of the respondents perceived the impact of the PSME project in improving access to loans to be high to very high impact on improving access to loans, 87% perceived the impact to be high to very high on improving management of shared resources and infrastructure, 89% perceived the impact to be high to very high on capacity building of farmers and institutions, 91% perceived the impact to be high to very high on improving access to extension services by farmers and 86% perceived the impact to be high to very high on diversification livelihoods. On Improving access to markets, improving access to inputs, improving crop productivity, improving food security and nutrition and improving household incomes, 66%, 75%, 87%, 88% and 80% respectively perceived the impact to be high to very high. Table 22 : Evaluation of Project Impact – Perceived Impact by HHs
Impact on improving: Very Low {%}
Low {%}
Null {%}
High {%}
Very High {%}
Access to loans 19.1 16.3 14.5 40.4 9.6
Access to Inputs 6.4 12.4 6 62.2 13.1
Access to improved markets 7.1 11.8 15.4 53.9 11.8
Crop productivity 1.4 7.1 4.6 70.7 16.3
Household income 2.2 12.9 5 66.7 13.3
Food and nutrition security 1.4 6.5 4.3 72.7 15.1
Collective marketing 4 15.7 12.8 57.3 10.2
Management of shared resources and infrastructure
1.1 2.9 8.7 68.8 18.5
Capacity of irrigation management committees
1.1 2.5 5 73.7 17.6
Diversification of livelihoods 1.4 3.9 7.5 72.8 14.3
Capacity building 1.8 3.6 5.3 72.2 17.1
Access to extension 3.5 1.8 4.3 59.9 30.5
Overall Assessment 4.2 8.5 7.7 64.0 15.6
On whether the farmers perceive the project to have brought about any negative impact to the community or environment, 92% of the respondents indicated that the project has not brought any negative impacts (Figure17). The 8% who indicated that the project had brought about negative impacts cited their reason as community conflicts that have been created by the failure of project to address the problems of limited water supply and the failure of the project to provide input vouchers to all farmers in an irrigation scheme. Farmers are now competing for the limited water supplies and in some cases; the limited water does not reach those farmers that are furthest from the source. Water conflicts have also been reported between irrigators and other users outside irrigation schemes. For example, Chipendeke irrigation irrigators share the water from Chipendeke dam with the micro hydro- electricity power generation plant and when water levels are low, the micro hydro-electricity plant gets first priority.
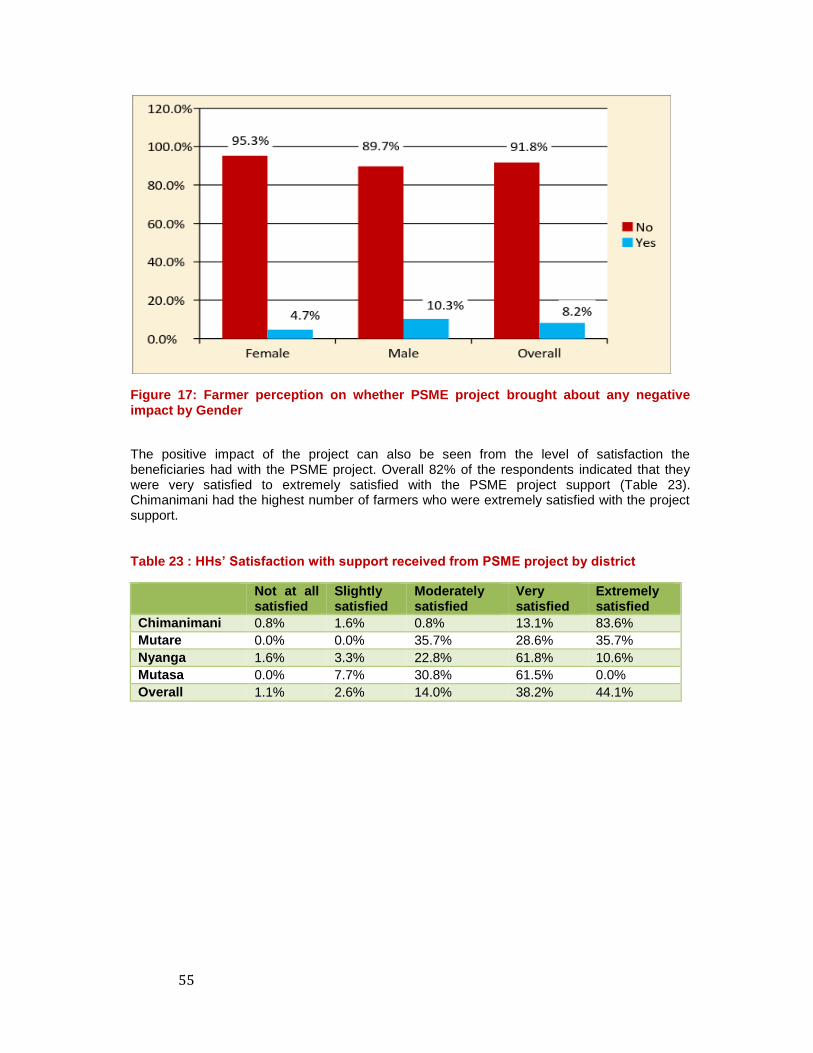
55
Figure 17: Farmer perception on whether PSME project brought about any negative impact by Gender
The positive impact of the project can also be seen from the level of satisfaction the beneficiaries had with the PSME project. Overall 82% of the respondents indicated that they were very satisfied to extremely satisfied with the PSME project support (Table 23). Chimanimani had the highest number of farmers who were extremely satisfied with the project support. Table 23 : HHs’ Satisfaction with support received from PSME project by district
Not at all satisfied
Slightly satisfied
Moderately satisfied
Very satisfied
Extremely satisfied
Chimanimani 0.8% 1.6% 0.8% 13.1% 83.6%
Mutare 0.0% 0.0% 35.7% 28.6% 35.7%
Nyanga 1.6% 3.3% 22.8% 61.8% 10.6%
Mutasa 0.0% 7.7% 30.8% 61.5% 0.0%
Overall 1.1% 2.6% 14.0% 38.2% 44.1%
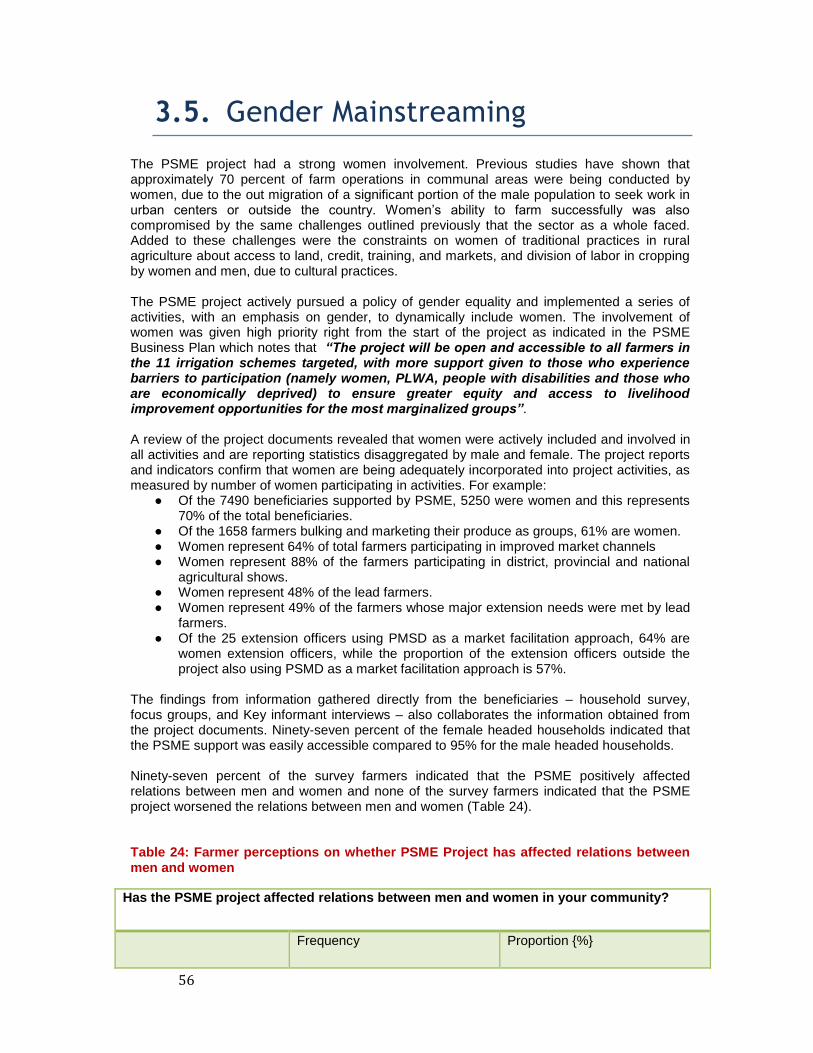
56
3.5. Gender Mainstreaming The PSME project had a strong women involvement. Previous studies have shown that approximately 70 percent of farm operations in communal areas were being conducted by women, due to the out migration of a significant portion of the male population to seek work in urban centers or outside the country. Women’s ability to farm successfully was also compromised by the same challenges outlined previously that the sector as a whole faced. Added to these challenges were the constraints on women of traditional practices in rural agriculture about access to land, credit, training, and markets, and division of labor in cropping by women and men, due to cultural practices. The PSME project actively pursued a policy of gender equality and implemented a series of activities, with an emphasis on gender, to dynamically include women. The involvement of women was given high priority right from the start of the project as indicated in the PSME Business Plan which notes that “The project will be open and accessible to all farmers in the 11 irrigation schemes targeted, with more support given to those who experience barriers to participation (namely women, PLWA, people with disabilities and those who are economically deprived) to ensure greater equity and access to livelihood improvement opportunities for the most marginalized groups”. A review of the project documents revealed that women were actively included and involved in all activities and are reporting statistics disaggregated by male and female. The project reports and indicators confirm that women are being adequately incorporated into project activities, as measured by number of women participating in activities. For example:
● Of the 7490 beneficiaries supported by PSME, 5250 were women and this represents 70% of the total beneficiaries.
● Of the 1658 farmers bulking and marketing their produce as groups, 61% are women. ● Women represent 64% of total farmers participating in improved market channels ● Women represent 88% of the farmers participating in district, provincial and national
agricultural shows. ● Women represent 48% of the lead farmers. ● Women represent 49% of the farmers whose major extension needs were met by lead
farmers. ● Of the 25 extension officers using PMSD as a market facilitation approach, 64% are
women extension officers, while the proportion of the extension officers outside the project also using PSMD as a market facilitation approach is 57%.
The findings from information gathered directly from the beneficiaries – household survey, focus groups, and Key informant interviews – also collaborates the information obtained from the project documents. Ninety-seven percent of the female headed households indicated that the PSME support was easily accessible compared to 95% for the male headed households. Ninety-seven percent of the survey farmers indicated that the PSME positively affected relations between men and women and none of the survey farmers indicated that the PSME project worsened the relations between men and women (Table 24). Table 24: Farmer perceptions on whether PSME Project has affected relations between men and women
Has the PSME project affected relations between men and women in your community?
Frequency Proportion {%}
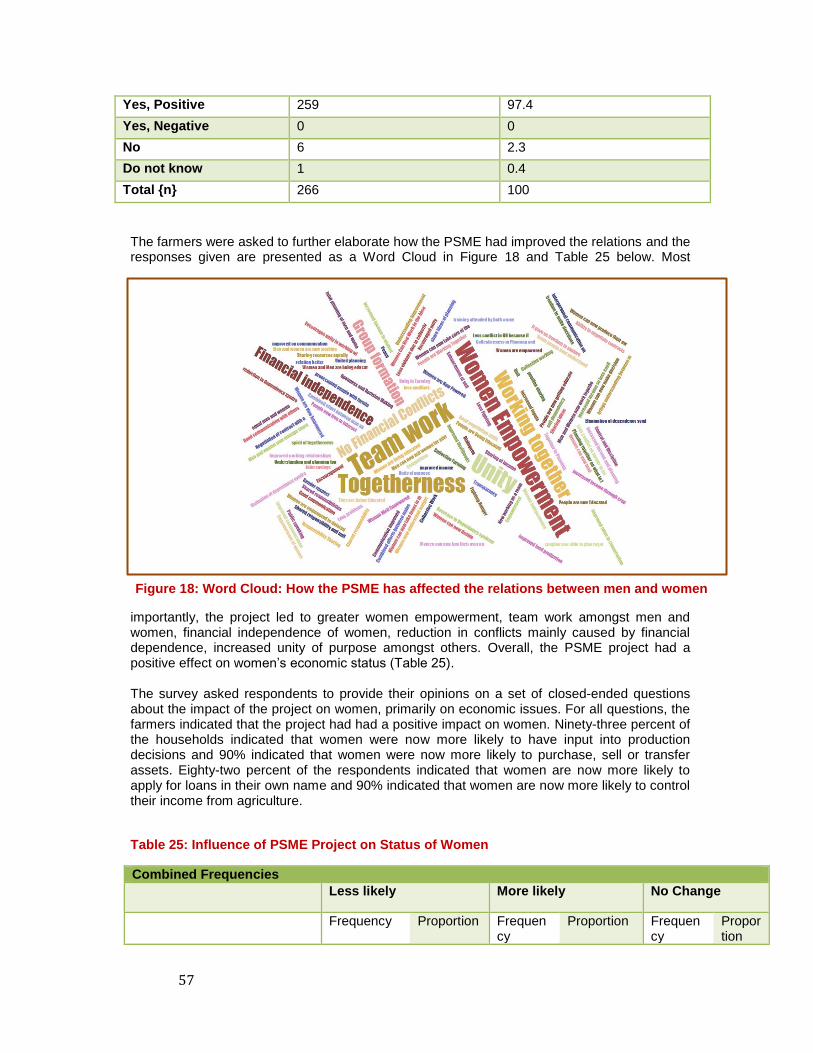
57
Yes, Positive 259 97.4
Yes, Negative 0 0
No 6 2.3
Do not know 1 0.4
Total {n} 266 100
The farmers were asked to further elaborate how the PSME had improved the relations and the responses given are presented as a Word Cloud in Figure 18 and Table 25 below. Most
importantly, the project led to greater women empowerment, team work amongst men and women, financial independence of women, reduction in conflicts mainly caused by financial dependence, increased unity of purpose amongst others. Overall, the PSME project had a positive effect on women’s economic status (Table 25). The survey asked respondents to provide their opinions on a set of closed-ended questions about the impact of the project on women, primarily on economic issues. For all questions, the farmers indicated that the project had had a positive impact on women. Ninety-three percent of the households indicated that women were now more likely to have input into production decisions and 90% indicated that women were now more likely to purchase, sell or transfer assets. Eighty-two percent of the respondents indicated that women are now more likely to apply for loans in their own name and 90% indicated that women are now more likely to control their income from agriculture.
Table 25: Influence of PSME Project on Status of Women
Combined Frequencies
Less likely More likely No Change
Frequency Proportion Frequency
Proportion Frequency
Proportion
Figure 18: Word Cloud: How the PSME has affected the relations between men and women

58
Women have input into production decisions
18 6.4% 263 92.9% 2 0.7%
Women make their own decisions about what to produce
22 7.9% 254 91.4% 2 0.7%
Women may own productive assets
28 10.1% 246 88.8% 3 1.1%
Women may purchase, sell or transfer assets
25 9.0% 251 90.3% 2 0.7%
Women have acquired agricultural skills
22 7.8% 260 91.9% 1 0.4%
Women have control over their income from agriculture
29 10.4% 248 88.9% 2 0.7%
Women have control over their workload
27 9.7% 248 89.5% 2 0.7%
Women have control over their leisure activities
3 19.0% 218 78.7% 6 2.2%
Women can apply for loans in their own name
39 14.1% 227 82.2% 10 3.6%
Women can be members of community/ farmer groups
22 7.9% 255 91.7% 1 0.4%
Women can speak in public forums and contribute to public debates
27 9.7% 250 89.9% 1 0.4%
The responses from the influence of the PSME project on the economic status of women was then used to derive a Women’s Empowerment in Agriculture Index (WEAI) and the results are presented in Table 26 below showing an overall index of 0.87. The Women’s Empowerment in Agriculture Index (WEAI) tracks the change in women’s empowerment levels that occurs as a direct or indirect result of an intervention. It measures the role and extent of women’s engagement in the agriculture sector in five domains: (1) decisions about agricultural production, (2) access to and decision making power over productive resources, (3) control over use of the income, (4) leadership in the community, and (5) time use. It also measures women’s empowerment relative to men within their households.
Table 26: Influence of PSME Project on Status of Women
Weight Frequency Weighted Score
Women have input into production decisions
0.10 263 26.30
Women make their own decisions about what to produce
0.10 254 25.40
Women may own productive assets 0.07 246 16.40 Women may purchase, sell or transfer assets
0.07 251 16.73
Women have acquired agricultural skills 0.00 260 0.00 Women have control over their income from agriculture
0.20 248 49.60
Women have control over their workload 0.10 248 24.80 Women have control over their leisure activities
0.10 218 21.80
Women can apply for loans in their own name
0.07 227 15.13
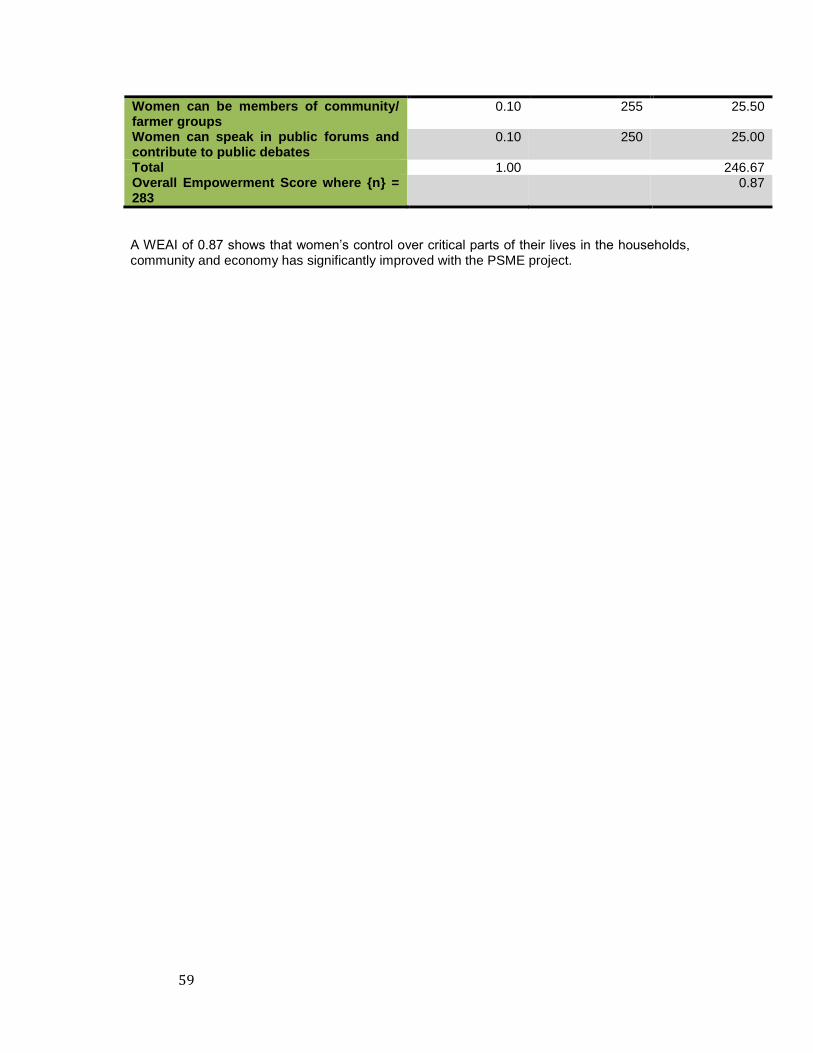
59
Women can be members of community/ farmer groups
0.10 255 25.50
Women can speak in public forums and contribute to public debates
0.10 250 25.00
Total 1.00 246.67 Overall Empowerment Score where {n} = 283
0.87
A WEAI of 0.87 shows that women’s control over critical parts of their lives in the households, community and economy has significantly improved with the PSME project.
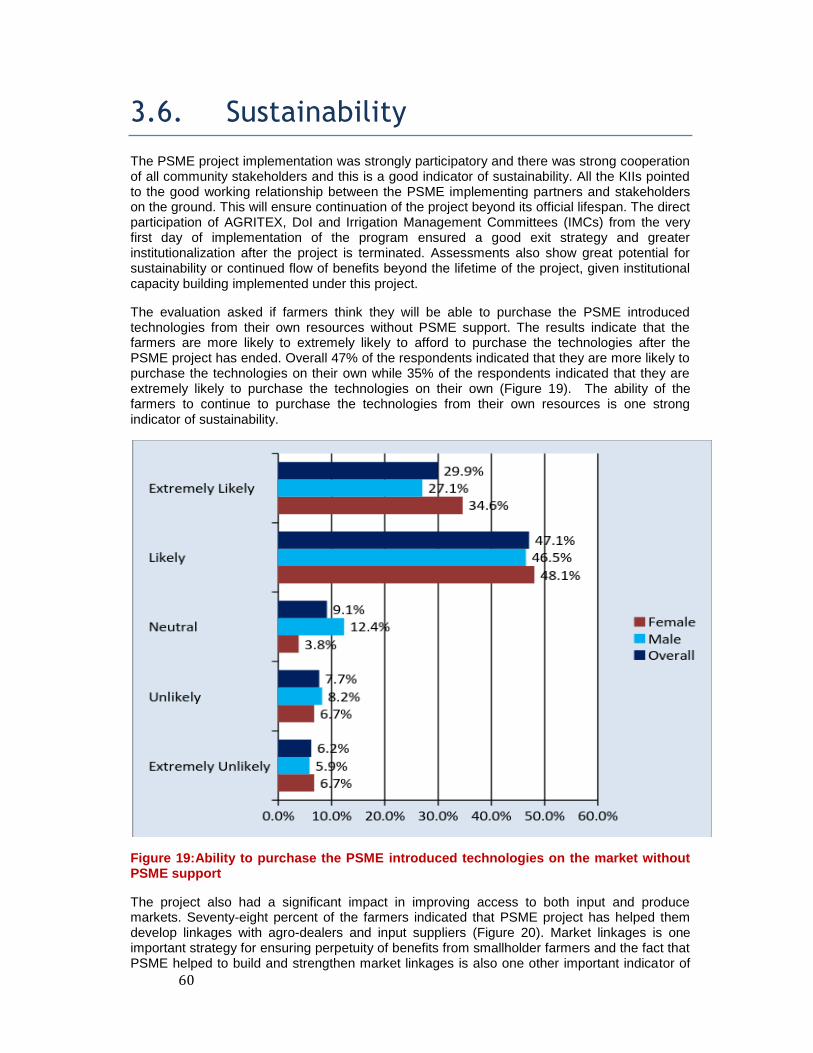
60
3.6. Sustainability The PSME project implementation was strongly participatory and there was strong cooperation of all community stakeholders and this is a good indicator of sustainability. All the KIIs pointed to the good working relationship between the PSME implementing partners and stakeholders on the ground. This will ensure continuation of the project beyond its official lifespan. The direct participation of AGRITEX, DoI and Irrigation Management Committees (IMCs) from the very first day of implementation of the program ensured a good exit strategy and greater institutionalization after the project is terminated. Assessments also show great potential for sustainability or continued flow of benefits beyond the lifetime of the project, given institutional capacity building implemented under this project.
The evaluation asked if farmers think they will be able to purchase the PSME introduced technologies from their own resources without PSME support. The results indicate that the farmers are more likely to extremely likely to afford to purchase the technologies after the PSME project has ended. Overall 47% of the respondents indicated that they are more likely to purchase the technologies on their own while 35% of the respondents indicated that they are extremely likely to purchase the technologies on their own (Figure 19). The ability of the farmers to continue to purchase the technologies from their own resources is one strong indicator of sustainability.
Figure 19:Ability to purchase the PSME introduced technologies on the market without PSME support
The project also had a significant impact in improving access to both input and produce markets. Seventy-eight percent of the farmers indicated that PSME project has helped them develop linkages with agro-dealers and input suppliers (Figure 20). Market linkages is one important strategy for ensuring perpetuity of benefits from smallholder farmers and the fact that PSME helped to build and strengthen market linkages is also one other important indicator of
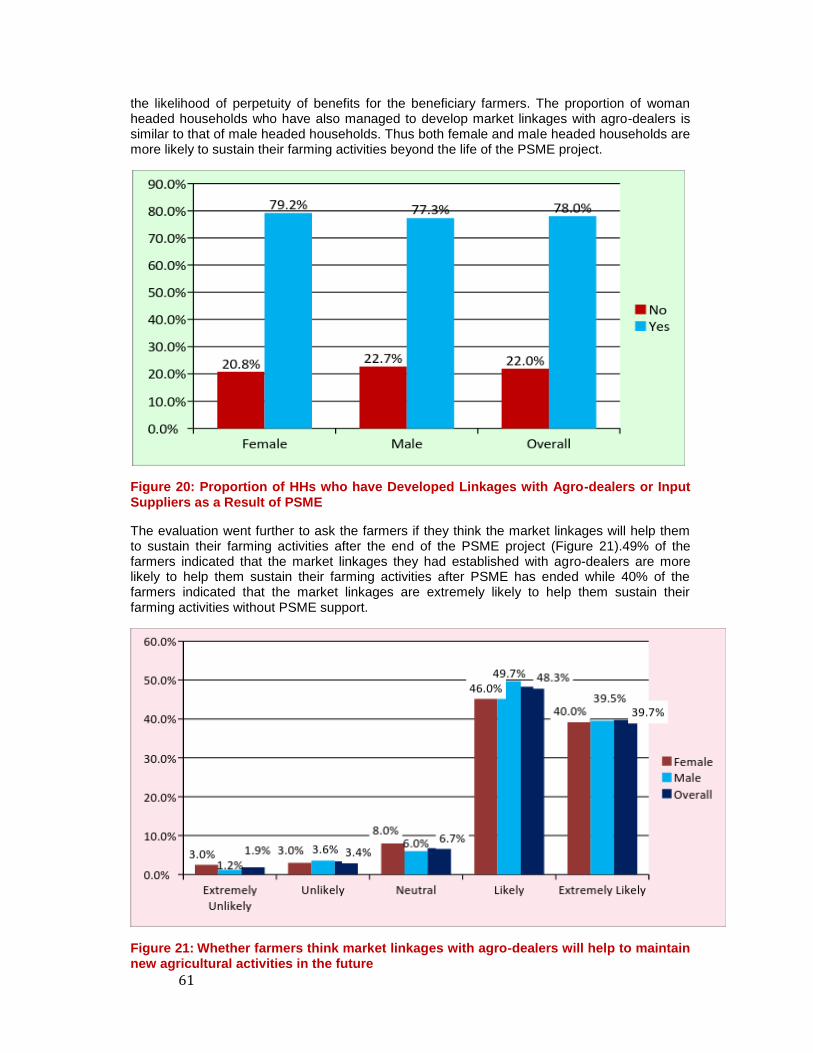
61
the likelihood of perpetuity of benefits for the beneficiary farmers. The proportion of woman headed households who have also managed to develop market linkages with agro-dealers is similar to that of male headed households. Thus both female and male headed households are more likely to sustain their farming activities beyond the life of the PSME project.
Figure 20: Proportion of HHs who have Developed Linkages with Agro-dealers or Input Suppliers as a Result of PSME
The evaluation went further to ask the farmers if they think the market linkages will help them to sustain their farming activities after the end of the PSME project (Figure 21).49% of the farmers indicated that the market linkages they had established with agro-dealers are more likely to help them sustain their farming activities after PSME has ended while 40% of the farmers indicated that the market linkages are extremely likely to help them sustain their farming activities without PSME support.
Figure 21: Whether farmers think market linkages with agro-dealers will help to maintain new agricultural activities in the future
62
The key informant interviews and focus group discussions also revealed that the Mukando (Voluntary savings and Loan groups) and practice, market linkages with input suppliers and produce markets, marketing committees, and community management of shared resources and irrigation infrastructure are more likely to be sustainable beyond the life of the PSME. The VSLs groups has over the three years of PSME support build up a loan portfolio of over USD 500,000 and has become the single major source of agricultural farmers for the farmers. The readily available and accessible of loans from the VSL groups will also further enhance the farmers’ capacity to sustain their farming operations.
Despite the PSME interventions having a great potential for being sustainable beyond the official life of the project, the perpetuity of benefits is threatened by the ever increasing influx of imported fresh produce from neighbouring countries, some of which is smuggled into the country, the growing scarcity of water brought about by climate change and the unsustainable high utility costs for water and electricity. The imports of fresh produce do not only pose serious competition to the local fresh produce markets and the horticultural sector in general, but there are also serious threats of the introduction of new diseases and pests as most of the imported produce is brought into the country through illegal channels without adequate sanitary and phytosanitary controls. Climate change has also seriously affected rainfall patterns and the quality of the rainfall season in Zimbabwe resulting in most water bodies drying up. This coupled with soil erosion and siltation has led to the limited water supplies drying up just before the start of the next rain season. This has led to a shutdown of some irrigation schemes for some months of the year and Chakohwa irrigation scheme is one such scheme that has suffered in the past year from the drying up of its water supply. The high utility bills have rendered some irrigation schemes unviable especially those that rely on electricity for pumping water and those that are still not growing high value crops which have low returns.

63
4. Best Practices & Lessons Learnt The evaluation established the following best practices and lessons that should be considered in designing future similar projects:
i) The participatory approach employed by the project through the involvement of all stakeholders (Agritex, RDCs, DoI, beneficiary farmers, project staff, private companies and community leaders) and a good rapport ensures smooth project implementation and increases chances of project success.
ii) In an economic environment where access to formal sources of finance for agricultural activities are limited, Voluntary Savings and Lending Schemes offer a viable alternative for financing smallholder agriculture and also increasing financial inclusion for the marginalised farmers. PSME established 104 VSL groups and 100% of the VSL members accessed loans from the groups for their farming operations.
iii) Being gender sensitive and adopting a more targeted integrated approach ensures greater success in women empowering than promoting the issues as a separate aim as shown by the WEAI of 0.87.
iv) Practical learning experiences through demonstration plots, farmers field schools, agricultural shows, exchange visits, study tours, field days and market research and intelligence activities are better means of learning for farmers than those that focus on theoretical impartation of knowledge.
v) Constant monitoring and feedback of projects through regular review meetings with all stakeholders will ensure quick responses and solutions and hence greater success of projects.
vi) The establishment of separate farmer committees for marketing and infrastructure and maintenance from the main irrigation management committee increases the chances of success for projects mainly focussed on promoting enhanced market participation and management of shared resources.
vii) The farmer to farmer extension approach through use of lead farmers offers an alternative viable farmer extension method for increasing extension coverage especially in an environment where the traditional public extension system is struggling to raise enough resources to fund its extension programs.
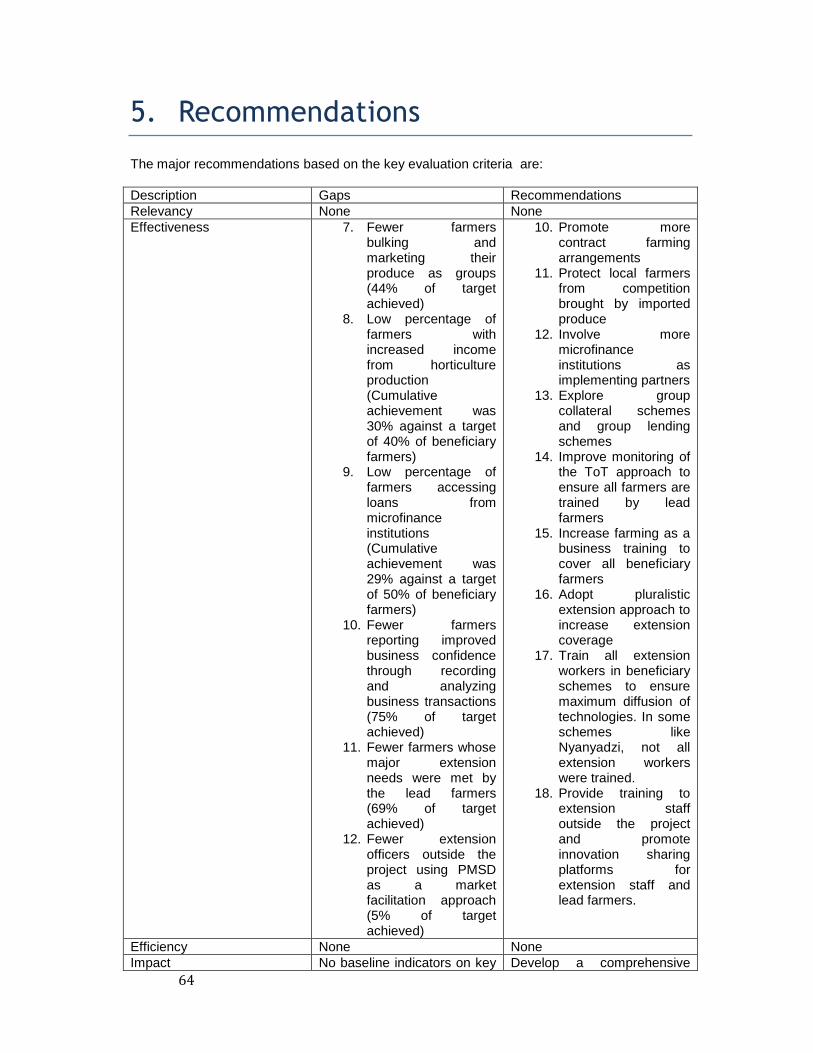
64
5. Recommendations The major recommendations based on the key evaluation criteria are:
Description Gaps Recommendations
Relevancy None None
Effectiveness 7. Fewer farmers bulking and marketing their produce as groups (44% of target achieved)
8. Low percentage of farmers with increased income from horticulture production (Cumulative achievement was 30% against a target of 40% of beneficiary farmers)
9. Low percentage of farmers accessing loans from microfinance institutions (Cumulative achievement was 29% against a target of 50% of beneficiary farmers)
10. Fewer farmers reporting improved business confidence through recording and analyzing business transactions (75% of target achieved)
11. Fewer farmers whose major extension needs were met by the lead farmers (69% of target achieved)
12. Fewer extension officers outside the project using PMSD as a market facilitation approach (5% of target achieved)
10. Promote more contract farming arrangements
11. Protect local farmers from competition brought by imported produce
12. Involve more microfinance institutions as implementing partners
13. Explore group collateral schemes and group lending schemes
14. Improve monitoring of the ToT approach to ensure all farmers are trained by lead farmers
15. Increase farming as a business training to cover all beneficiary farmers
16. Adopt pluralistic extension approach to increase extension coverage
17. Train all extension workers in beneficiary schemes to ensure maximum diffusion of technologies. In some schemes like Nyanyadzi, not all extension workers were trained.
18. Provide training to extension staff outside the project and promote innovation sharing platforms for extension staff and lead farmers.
Efficiency None None
Impact No baseline indicators on key Develop a comprehensive

65
impact outcomes like food security, nutrition, employment etc
baseline position with higher level outcome indicators
Gender mainstreaming None None
Other
The other recommendations from this evaluation are:
9. Input vouchers: Although all farmers in the beneficiary schemes were considered to be beneficiaries, only a few were selected to receive the input vouchers which were given at the start of the project. This to some extent created tensions between the farmers who received the vouchers and those that did not receive. Future programming should target all farmers for input vouchers or else adopt a revolving voucher support programme to ensure that all farmers benefit.
10. Aging irrigation infrastructure: It was noted that most irrigation schemes had some hardware challenges arising from an aging irrigation infrastructure. Some farmers did not adequately practice what they learnt from the capacity building activities because they did not have adequate water to irrigate as a result of silted canals and reservoirs or leaking canals. The PSME project was predominantly a software project with limited funding for repairing irrigation infrastructure. Future software projects should be complemented by a hardware component so that farmers maximize the benefits they derive from the software components. One way is for future projects to focus on a smaller geographic area and then be more holistic in their support. A limited geographic coverage not only allows for a more holistic approach, but can also increase efficiency, effectiveness and impact of an intervention.
11. Water conflicts and sub-catchment issues: The evaluation noted that water is increasing becoming a scarce resource and a major source of community conflicts between independent irrigators, non-irrigators and irrigators in organized irrigation schemes. A good example is the Chipindeke Irrigation scheme which competes with the mini hydro-electricity plant for water. A lot of the siltation of water sources in most irrigation is mainly caused by the poor management of the sub-catchment areas and focusing of managing the problem only in irrigation schemes will not help much if the sub-catchment issues are not addressed as well. Future projects should pay increasing attention to the management of shared resources beyond just the irrigation scheme but also involve all users who derive a livelihood from the same water source.
12. Clear enabling irrigation policy: The current prevailing utility costs for water and electricity are hampering the development of smallholder irrigation schemes and especially those that are predominantly food security focused. In most irrigation schemes, the irrigation plots are too small to be able to produce enough to pay for water and electricity costs. There is therefore a need for a clear policy that distinguishes food security schemes from horticultural commercial schemes. Farmers in food security schemes should be charged lower tariffs than farmers in horticultural commercial schemes.
13. Project implementation period: Changing attitudes and mindsets of smallholder farmers often take long to see notable changes. Also, getting approvals for activities takes time especially with Government institutions and this reduces implementation time. Future programming should consider extending the period of implementation to 5 years minimum.
14. Integrating VSLs with formal finance institutions: The VSLs have proved to be an effective alternative approach to financing smallholder agriculture in the beneficiary schemes. There is need to strengthen VSLs and explore mechanisms for linking them with micro finance institutions and the formal banking system.
15. Imported fresh agricultural produce: There is need for the country to protect the agricultural sector from the influx of imported fresh agricultural produce from neighboring countries. Not only are the imports threatening the viability of the local agricultural sector, but they also pose a serious threat of introducing new pests and

66
diseases if adequate sanitary and phytosanitary measures are not applied as some of the imports come into the country illegal.
16. Value addition: There is need to develop value addition capacity at local level. This way, farmers can realize more returns for their produce and this creates more opportunities for rural based employment creation and poverty reduction.
67
6. Conclusion The PSME project performance has been exceptional and has achieved or nearly achieved all its targets. There has been significant traction in establishing systems (production, market linkages, credit), and the systems are showing great potential for sustainability. The project is innovative because it is introducing changes in systems and mindsets about smallholder irrigated agriculture at multiple levels: farmers, agricultural input suppliers, agricultural produce buyers, association leaders, public extension agents, agricultural finance institutions and private players. The project activities were and remain relevant to addressing the major challenges smallholder irrigated agricultural sector continues to confront — improving management of shared infrastructure and resources and enhancing market engagement and participation. The PSME has had a significant impact on technology adoption by the beneficiary farmers with 98% of the farmers now using improved production and conservation agriculture principles. Nine new crop varieties were introduced and are now grown by farmers. Almost 89% of the beneficiary farmers are now actively involved in the management of their shared infrastructure and resources. This in turn has resulted in increases in productivity, volume and value of marketed surplus, household incomes, farm level employment. Farmers are generating higher incomes than at the start of the project with 30% of the beneficiary farmers having increased their income from horticultural production by at least 50%. The extra income realized by the farmers has been invested in both productive assets, such as farm equipment, livestock and farm infrastructure, and social assets, with school fees and healthcare commanding highest priority. Women have been consciously incorporated into and are deriving real benefits from the project. Women make up 70% of the total beneficiaries and actively participated in all activities of the project. The project’s monitoring and evaluation system tracked results disaggregated by men and women. Women have participated in all capacity building activities, increased their incomes, and have access to productive assets. Social relationships in the family and the community are changing as women have gained economic power. On market linkages, significant progress was made in enhancing the business capacity of the beneficiary farmers and in establishing fundamental trust among the actors and repair broken systems: access to basic agricultural inputs, production, market linkages for sales, credit, enabling environment. A total of 12 agro dealers were contracted as agriculture stockists by big commercial companies and 34 buyers were identified and engaged. Access to financing has reached a relatively small number of the beneficiary farmers with only 29% of the farmers accessing loans from micro finance institutions compared to a target of 50%. Nevertheless, compared with the availability of credit for smallholder farmers at the outset of the project, progress is being made. As a result of the support and effort made by the PSME project in engaging finance institutions, some finance institutions have started showing interests in lending to the beneficiary farmers. The project has however managed to set up 104 VSL groups and 100% of the VSL group members have accessed loans from the VSL schemes. The project has also made significant progress in enhancing beneficiary farmers’ access to high quality, relevant and timely extension and market engagement advice for their crops. The project identified and trained 366 lead farmers to assist extension officers in meeting the extension needs of the farmers and 25 extension officers in the beneficiary irrigation schemes are now using PMSD as a market facilitation approach.

68
7. Annexes 7.1. Annex 1: Most Significant Change (MSC) / Case Studies
Title: Irrigation water fights a thing of the past at Nyamaropa Irrigation Scheme
Name of Organization: Farm Community Trust of Zimbabwe
Zimbabwe is located in the Southern part of Africa and has a population of 12 million people with 70% of them residing in the rural areas (Zimbabwe Statistical Bulletin 2012). The main livelihood option for rural population is dependent on rain fed agriculture which is very erratic and unreliable. According to recent survey carried by Zimstat July 2015, people are living on $157.03 per month for an average family of 5. Due to persistent droughts and the need to grow crops all year round, the government and other development partners embarked on irrigation schemes development as a way to alleviate poverty and improve living standards of the communities. Over the years the irrigation schemes brought food security and regular incomes to the inhabitants and those afar. However, there has been deterioration in the performance of the irrigation facilities. This
emanated from problems ranging from unreliable water supply, unaffordable inputs, high energy and utility bills, constant pumps breakdown due to age, marketing problems, general decline in scheme management, watershed/catchment deterioration and siltation. Practical Action in partnership with Farm Community Trust of Zimbabwe (FCTZ) and Zambuko Trust are implementing a project on Promoting Smallholder Market Engagement (PSME) in Manicaland Province of Zimbabwe with funding from the Big Lottery Fund. It is being implemented in 11 irrigated schemes and targeting 7490 households in four districts. The project started in April 2013. The project is main objective is to focus on the restoration of viable markets for the farmers through the creation of a win - win market linkages. To achieve this, the project will also promote increase in production of horticultural crops through improved agricultural practices, improved access of irrigation water, access to finance and improved farmer organizations. One of those irrigations is Nyamaropa, established in 1954 and situated 65 km east of Nyanga town. The irrigation has farmer establishment of 676 smallholder farmers.The main crops grown at the irrigation are maize, sugar bean, wheat and potatoes. The irrigation scheme lies in agro-ecological zone IV which receives an average of 450 – 600 mm of rainfall. This is due to the erratic nature of the rainfall.
In 2000 the main water reticulation system at the irrigation was damaged by Cyclone Eline and this reduced the irrigation capacity to the fields by 50%.The water problem has persisted up to 2013, resulting in regular water fights, farmers poaching irrigation water at night and reduced irrigation hectarage especially during the September to 30a pipe. The pipe however could not carry enough water from the canal resulting in backflow and shortage of water for farmers.
One of the damaged parts along the
canal –picture by R Sithole 2013
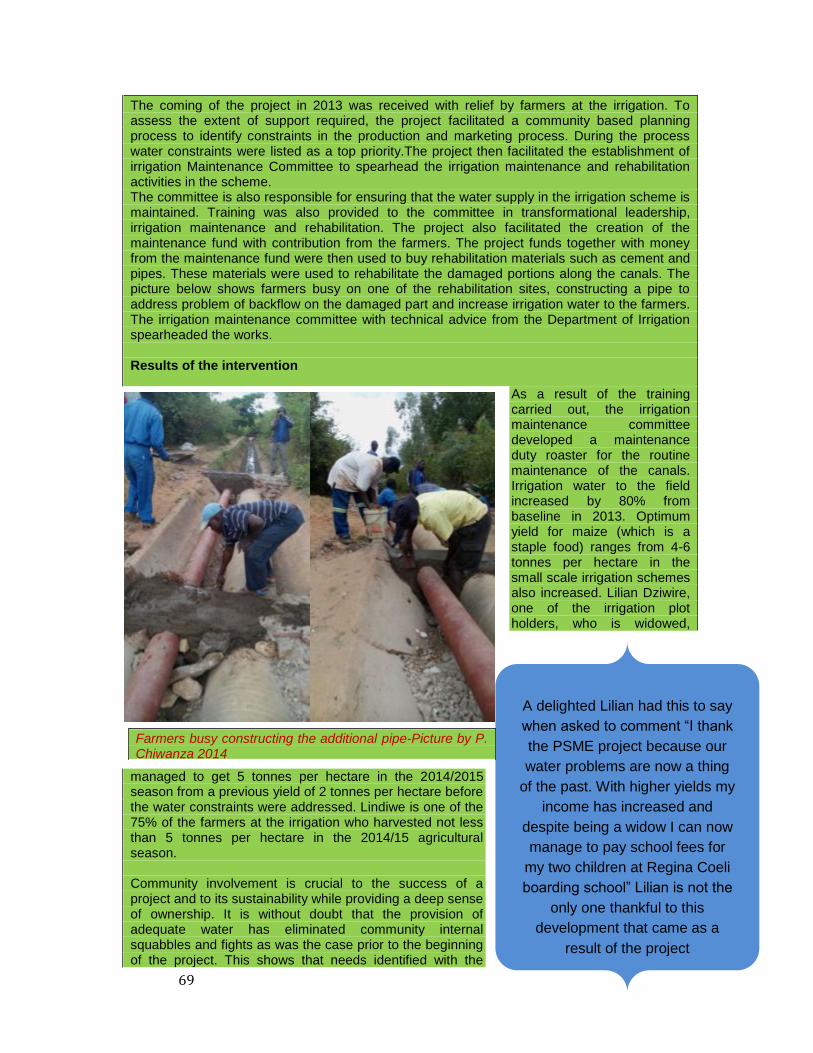
69
The coming of the project in 2013 was received with relief by farmers at the irrigation. To assess the extent of support required, the project facilitated a community based planning process to identify constraints in the production and marketing process. During the process water constraints were listed as a top priority.The project then facilitated the establishment of irrigation Maintenance Committee to spearhead the irrigation maintenance and rehabilitation activities in the scheme. The committee is also responsible for ensuring that the water supply in the irrigation scheme is maintained. Training was also provided to the committee in transformational leadership, irrigation maintenance and rehabilitation. The project also facilitated the creation of the maintenance fund with contribution from the farmers. The project funds together with money from the maintenance fund were then used to buy rehabilitation materials such as cement and pipes. These materials were used to rehabilitate the damaged portions along the canals. The picture below shows farmers busy on one of the rehabilitation sites, constructing a pipe to address problem of backflow on the damaged part and increase irrigation water to the farmers. The irrigation maintenance committee with technical advice from the Department of Irrigation spearheaded the works. Results of the intervention
As a result of the training carried out, the irrigation maintenance committee developed a maintenance duty roaster for the routine maintenance of the canals. Irrigation water to the field increased by 80% from baseline in 2013. Optimum yield for maize (which is a staple food) ranges from 4-6 tonnes per hectare in the small scale irrigation schemes also increased. Lilian Dziwire, one of the irrigation plot holders, who is widowed,
managed to get 5 tonnes per hectare in the 2014/2015 season from a previous yield of 2 tonnes per hectare before the water constraints were addressed. Lindiwe is one of the 75% of the farmers at the irrigation who harvested not less than 5 tonnes per hectare in the 2014/15 agricultural season. Community involvement is crucial to the success of a project and to its sustainability while providing a deep sense of ownership. It is without doubt that the provision of adequate water has eliminated community internal squabbles and fights as was the case prior to the beginning of the project. This shows that needs identified with the
A delighted Lilian had this to say
when asked to comment “I thank
the PSME project because our
water problems are now a thing
of the past. With higher yields my
income has increased and
despite being a widow I can now
manage to pay school fees for
my two children at Regina Coeli
boarding school” Lilian is not the
only one thankful to this
development that came as a
result of the project
Farmers busy constructing the additional pipe-Picture by P. Chiwanza 2014

70
community and for the community can be successfully addressed with the community for enhanced peace and social harmony. Crop production has now improved as it is now easier to follow cropping calendars when the water supply is adequate as this makes it easier to bulk inputs and produce thereby realizing economies of scale. Lastly the irrigation cycles are now being maintained without any disruption. The use of community based plans is key to identifying project priorities by the community especially when the community is well motivated and mobilized to take the lead. Every irrigation should have an irrigation maintenance committee responsible for driving irrigation maintenance and rehabilitation. Irrigation farmers should also contribute towards maintenance and rehabilitation fund to take care of irrigation repairs rather than wait for a breakdown to happen and start mobilising funds.
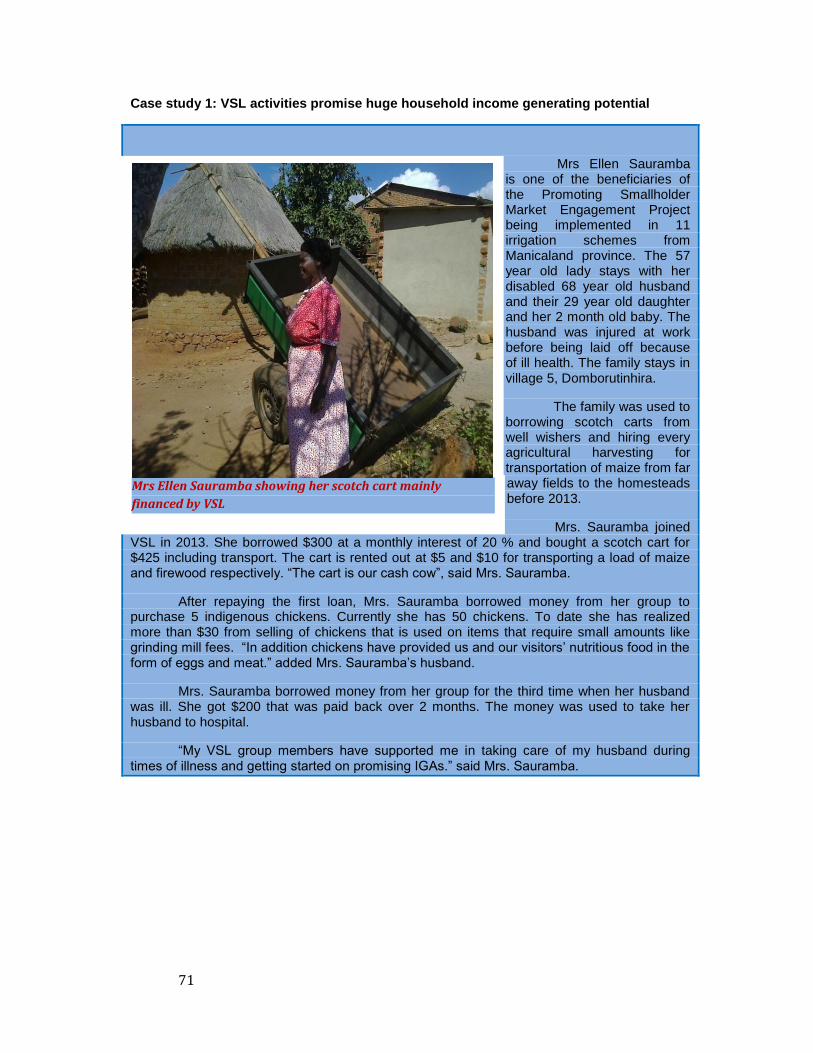
71
Case study 1: VSL activities promise huge household income generating potential
Mrs Ellen Sauramba is one of the beneficiaries of the Promoting Smallholder Market Engagement Project being implemented in 11 irrigation schemes from Manicaland province. The 57 year old lady stays with her disabled 68 year old husband and their 29 year old daughter and her 2 month old baby. The husband was injured at work before being laid off because of ill health. The family stays in village 5, Domborutinhira.
The family was used to borrowing scotch carts from well wishers and hiring every agricultural harvesting for transportation of maize from far away fields to the homesteads before 2013.
Mrs. Sauramba joined VSL in 2013. She borrowed $300 at a monthly interest of 20 % and bought a scotch cart for $425 including transport. The cart is rented out at $5 and $10 for transporting a load of maize and firewood respectively. “The cart is our cash cow”, said Mrs. Sauramba.
After repaying the first loan, Mrs. Sauramba borrowed money from her group to purchase 5 indigenous chickens. Currently she has 50 chickens. To date she has realized more than $30 from selling of chickens that is used on items that require small amounts like grinding mill fees. “In addition chickens have provided us and our visitors’ nutritious food in the form of eggs and meat.” added Mrs. Sauramba’s husband.
Mrs. Sauramba borrowed money from her group for the third time when her husband was ill. She got $200 that was paid back over 2 months. The money was used to take her husband to hospital.
“My VSL group members have supported me in taking care of my husband during times of illness and getting started on promising IGAs.” said Mrs. Sauramba.
Mrs Ellen Sauramba showing her scotch cart mainly
financed by VSL
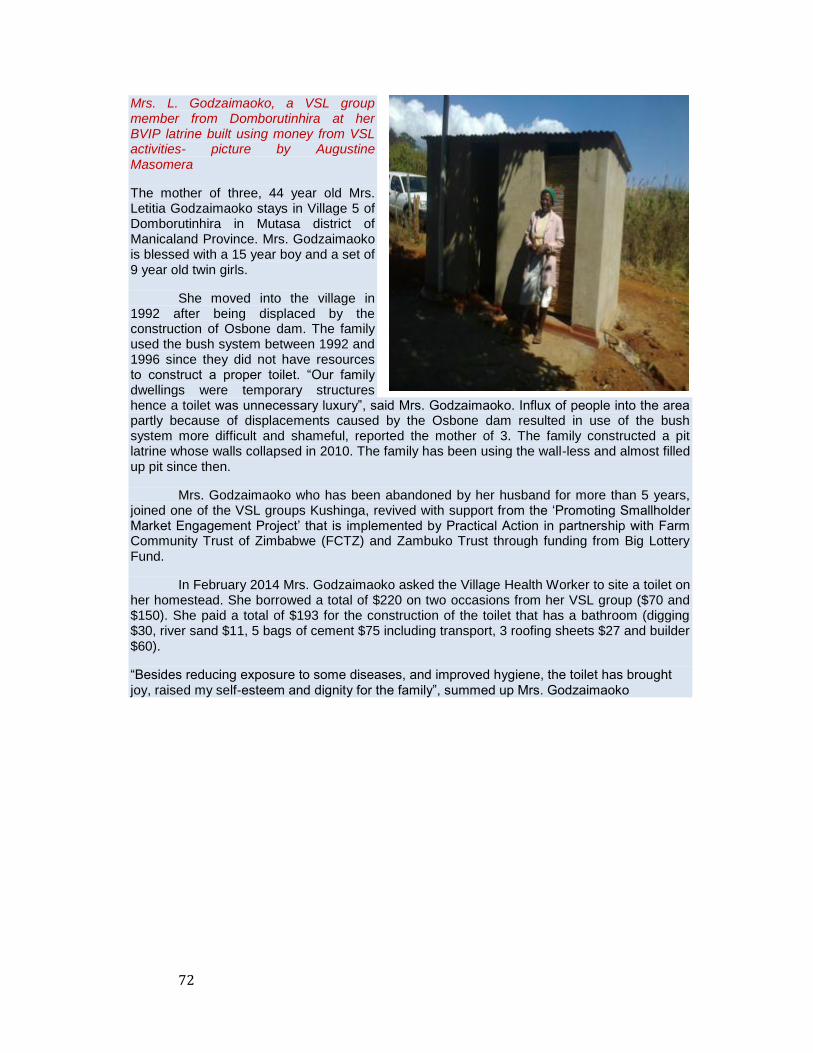
72
Mrs. L. Godzaimaoko, a VSL group member from Domborutinhira at her BVIP latrine built using money from VSL activities- picture by Augustine Masomera
The mother of three, 44 year old Mrs. Letitia Godzaimaoko stays in Village 5 of Domborutinhira in Mutasa district of Manicaland Province. Mrs. Godzaimaoko is blessed with a 15 year boy and a set of 9 year old twin girls.
She moved into the village in 1992 after being displaced by the construction of Osbone dam. The family used the bush system between 1992 and 1996 since they did not have resources to construct a proper toilet. “Our family dwellings were temporary structures hence a toilet was unnecessary luxury”, said Mrs. Godzaimaoko. Influx of people into the area partly because of displacements caused by the Osbone dam resulted in use of the bush system more difficult and shameful, reported the mother of 3. The family constructed a pit latrine whose walls collapsed in 2010. The family has been using the wall-less and almost filled up pit since then.
Mrs. Godzaimaoko who has been abandoned by her husband for more than 5 years, joined one of the VSL groups Kushinga, revived with support from the ‘Promoting Smallholder Market Engagement Project’ that is implemented by Practical Action in partnership with Farm Community Trust of Zimbabwe (FCTZ) and Zambuko Trust through funding from Big Lottery Fund.
In February 2014 Mrs. Godzaimaoko asked the Village Health Worker to site a toilet on her homestead. She borrowed a total of $220 on two occasions from her VSL group ($70 and $150). She paid a total of $193 for the construction of the toilet that has a bathroom (digging $30, river sand $11, 5 bags of cement $75 including transport, 3 roofing sheets $27 and builder $60).
“Besides reducing exposure to some diseases, and improved hygiene, the toilet has brought joy, raised my self-esteem and dignity for the family”, summed up Mrs. Godzaimaoko
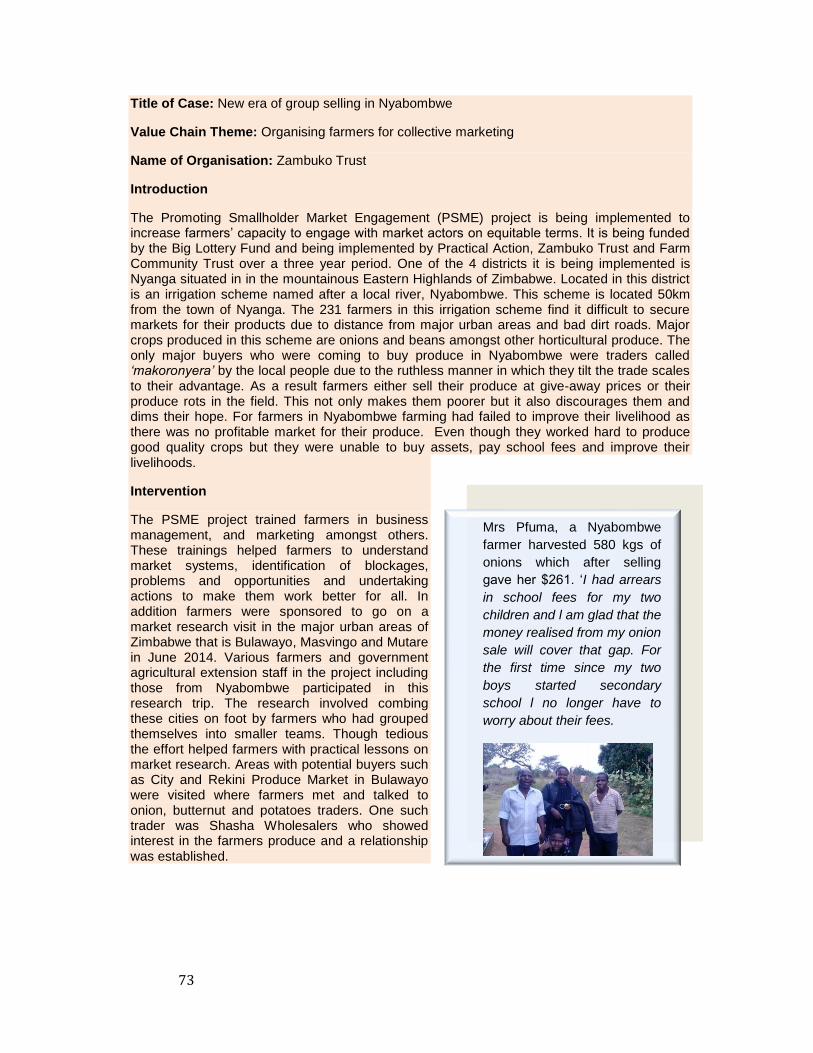
73
Title of Case: New era of group selling in Nyabombwe
Value Chain Theme: Organising farmers for collective marketing
Name of Organisation: Zambuko Trust
Introduction
The Promoting Smallholder Market Engagement (PSME) project is being implemented to increase farmers’ capacity to engage with market actors on equitable terms. It is being funded by the Big Lottery Fund and being implemented by Practical Action, Zambuko Trust and Farm Community Trust over a three year period. One of the 4 districts it is being implemented is Nyanga situated in in the mountainous Eastern Highlands of Zimbabwe. Located in this district is an irrigation scheme named after a local river, Nyabombwe. This scheme is located 50km from the town of Nyanga. The 231 farmers in this irrigation scheme find it difficult to secure markets for their products due to distance from major urban areas and bad dirt roads. Major crops produced in this scheme are onions and beans amongst other horticultural produce. The only major buyers who were coming to buy produce in Nyabombwe were traders called ‘makoronyera’ by the local people due to the ruthless manner in which they tilt the trade scales to their advantage. As a result farmers either sell their produce at give-away prices or their produce rots in the field. This not only makes them poorer but it also discourages them and dims their hope. For farmers in Nyabombwe farming had failed to improve their livelihood as there was no profitable market for their produce. Even though they worked hard to produce good quality crops but they were unable to buy assets, pay school fees and improve their livelihoods.
Intervention
The PSME project trained farmers in business management, and marketing amongst others. These trainings helped farmers to understand market systems, identification of blockages, problems and opportunities and undertaking actions to make them work better for all. In addition farmers were sponsored to go on a market research visit in the major urban areas of Zimbabwe that is Bulawayo, Masvingo and Mutare in June 2014. Various farmers and government agricultural extension staff in the project including those from Nyabombwe participated in this research trip. The research involved combing these cities on foot by farmers who had grouped themselves into smaller teams. Though tedious the effort helped farmers with practical lessons on market research. Areas with potential buyers such as City and Rekini Produce Market in Bulawayo were visited where farmers met and talked to onion, butternut and potatoes traders. One such trader was Shasha Wholesalers who showed interest in the farmers produce and a relationship was established.
Mrs Pfuma, a Nyabombwe
farmer harvested 580 kgs of
onions which after selling
gave her $261. ‘I had arrears
in school fees for my two
children and l am glad that the
money realised from my onion
sale will cover that gap. For
the first time since my two
boys started secondary
school l no longer have to
worry about their fees.
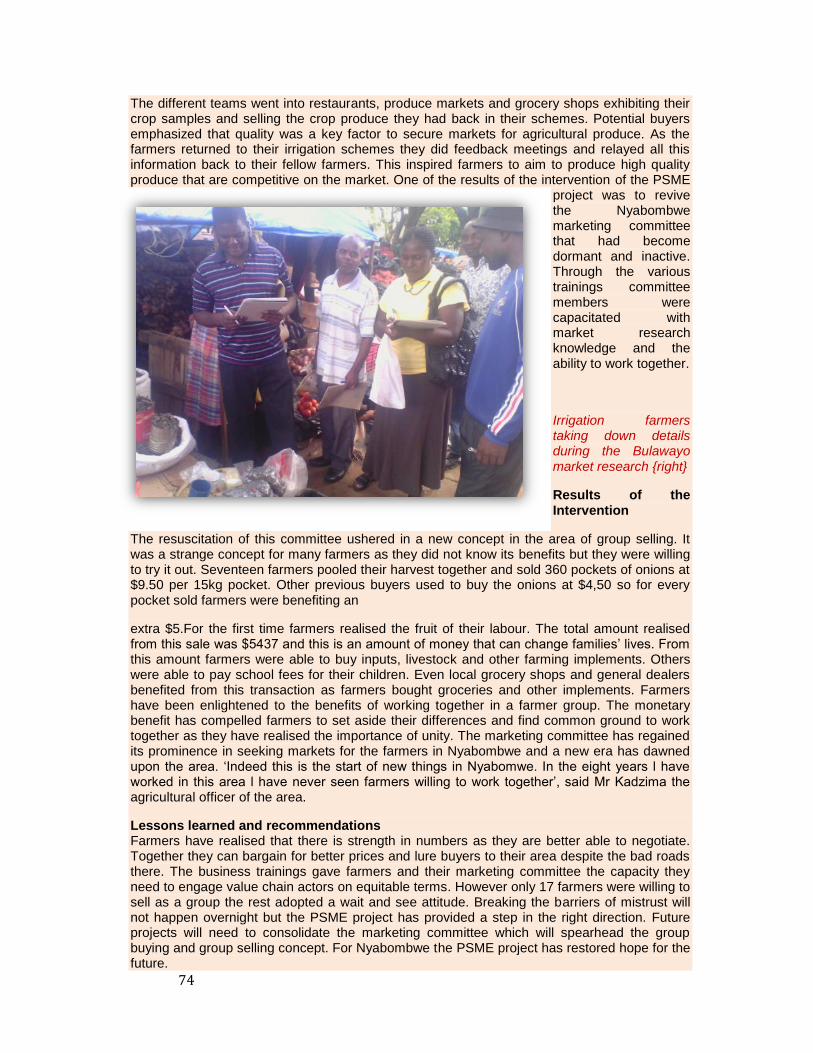
74
The different teams went into restaurants, produce markets and grocery shops exhibiting their crop samples and selling the crop produce they had back in their schemes. Potential buyers emphasized that quality was a key factor to secure markets for agricultural produce. As the farmers returned to their irrigation schemes they did feedback meetings and relayed all this information back to their fellow farmers. This inspired farmers to aim to produce high quality produce that are competitive on the market. One of the results of the intervention of the PSME
project was to revive the Nyabombwe marketing committee that had become dormant and inactive. Through the various trainings committee members were capacitated with market research knowledge and the ability to work together.
Irrigation farmers taking down details during the Bulawayo market research {right}
Results of the Intervention
The resuscitation of this committee ushered in a new concept in the area of group selling. It was a strange concept for many farmers as they did not know its benefits but they were willing to try it out. Seventeen farmers pooled their harvest together and sold 360 pockets of onions at $9.50 per 15kg pocket. Other previous buyers used to buy the onions at $4,50 so for every pocket sold farmers were benefiting an
extra $5.For the first time farmers realised the fruit of their labour. The total amount realised from this sale was $5437 and this is an amount of money that can change families’ lives. From this amount farmers were able to buy inputs, livestock and other farming implements. Others were able to pay school fees for their children. Even local grocery shops and general dealers benefited from this transaction as farmers bought groceries and other implements. Farmers have been enlightened to the benefits of working together in a farmer group. The monetary benefit has compelled farmers to set aside their differences and find common ground to work together as they have realised the importance of unity. The marketing committee has regained its prominence in seeking markets for the farmers in Nyabombwe and a new era has dawned upon the area. ‘Indeed this is the start of new things in Nyabomwe. In the eight years l have worked in this area l have never seen farmers willing to work together’, said Mr Kadzima the agricultural officer of the area.
Lessons learned and recommendations Farmers have realised that there is strength in numbers as they are better able to negotiate. Together they can bargain for better prices and lure buyers to their area despite the bad roads there. The business trainings gave farmers and their marketing committee the capacity they need to engage value chain actors on equitable terms. However only 17 farmers were willing to sell as a group the rest adopted a wait and see attitude. Breaking the barriers of mistrust will not happen overnight but the PSME project has provided a step in the right direction. Future projects will need to consolidate the marketing committee which will spearhead the group buying and group selling concept. For Nyabombwe the PSME project has restored hope for the future.

75
Market Engagement Yields Results for Manicaland Irrigation Farmers
Smallholder farmers from the 11 irrigation schemes in Zimbabwe’s Manicaland Province in the districts of Chimanimani, Mutare, Mutasa and Nyanga, gathered for a two day workshop on market engagement in Mutare. The aim of the meeting was to take stock of the engagement progress as well as engaging more market players. Invited to the meeting were input suppliers, crop produce buyers, market information providers and financial institutions.
Access to markets has always been a challenge for most of the smallholder farmers in Zimbabwe. In response to this challenge, Practical Action Southern Africa is implementing a three year project entitled Promoting Smallholder Market Engagement (PSME) in Manicaland Province. The project is being implemented in partnership with Zambuko Trust and Farm
Community Trust and seeks to strengthen the livelihoods and increase the incomes of at least 7,490 men and women farmers through improved participation and engagement in horticulture markets.
The project is targeting irrigation schemes in four districts namely
Chimanimani (Nyanyadzi,
Chakohwa/Nechitima, and Svinurai); Mutare (Chipendeke); Mutasa (Domborutinhira) and Nyanga (Bende,
Nyarumvurwe,
Nyabombwe, Nyamarimbira,
Nyakomba and
Nyamaropa)
The project has been able to organise farmers to come together to better plan, make collective decisions and coordinate horticultural activities, particularly for the sourcing of agricultural inputs and the bulking of produce to make marketing more cost effective, whether in attracting private sector interest or transporting the produce to market.
The market negotiation workshop conducted at African Sun Hotel in Mutare from the 18 to the 19
th of June was part of
the project’s activities to build
IrineMoyo showing some vegetables she is growing at Nyarumvurwe
irrigation scheme
A potential buyer explaining the quality of onions he buys during the research in Bulawayo

76
understanding and strengthen market linkages. The project has since its inception in 2013 been empowering farmers to identify and engage with market actors on more favourable terms. The project facilitated the formation of farmer marketing groups which are now actively driving marketing activities at their respective irrigation schemes. From January 2014 market committees have been conducting market researches in Mutare, Masvingo, Bulawayo and institutions surrounding the irrigation schemes.
At this particular workshop, the farmer marketing groups came to negotiate collectively and take advantage of market opportunities in Mutare and beyond. Increasing the quantity and quality of the farmers’ produce has been central to the success of this initiative.
Lucia Mamhende, a 55 year old farmer at the Nyabombwe Irrigation Scheme in Nyanga and other farmers were always struggling to source markets for their produce. ”We used to grow crops for nothing and struggled each year to find buyers. The market engagement exercise conducted by our marketing committee has enabled us to secure a market from Paddy Vegie, in Bulawayo. The company through the initiatives of the marketing committee came to our irrigation scheme and bought 360 pockets of onions from seventeen farmers, pocketing $7,200”, said Mamhende.
She continued, “I felt a pity for some of our colleagues who had already sold their onions at very low prices. From now onwards I am considering my farming as a business and I have seen the advantage of selling as a group as opposed to individuals”., Most farmers from the irrigation schemes have managed to clinch deals with buyers and have sold produce amounting to $20,275.00 since March 2014 from the sales of onions, potatoes, beans, maize, sugar beans and popcorn as a result of market researches being spearheaded by the marketing committee.
The workshop provided the farmers with an opportunity to engage key players and opening of new market engagements with National Foods on sugar beans and maize , SakubvaMusika on a variety of horticultural crops, the Zimbabwe Farmers Company on provision of inputs near their irrigation schemes and the possibility of micro financing by AGRIBANK for agricultural activities.
Market players exchanging notes during the market engagement meeting
The smallholder farmers will now be accessing up to date market information following registration of Market Committee with Knowledge Transfer Africa (KTA) for provision of market information through SMS. KTA is currently working with traders at Sakubva, Mbare, Rekini, Masvingo and Gweru and have an interactive website and SMS platform where farmers can request for market information from the centres mentioned and answers given instantly.

77
Nyakomba Tabasco Chilli market Lures More Growers
THE availability of a market for Tabasco chilli at Nyakomba Irrigation Scheme has seen an increase in the number of smallholder farmers concentrating on the crop than any other cash crops. This was as a result of Market Linkages Training through the Practical Actions Promoting Smallholder Market Engagement Project. More than 200 farmers have over the past five years joined a group of 100 Tabasco farmers who started in 2011.
They were mainly attracted by Better Agriculture which is readily available in the area to buy the fresh chilli. Better Agriculture has also been assisting farmers with seedlings and other farming inputs that cover 0,2 hectares. The farmers also received valuable market linkage training from Practical Action through the Promoting Smallholder Market Engagement Project.In addition; farmers receive about 80kg of ammonium nitrate fertiliser and an assortment of agro-chemicals which are withdrawn as per need in order to cut the overall input costs.
Better Agriculture in collaboration with AGRITEX set up a mini-processing plant for fresh chilli, which was constructed with the aid from the Japanese government through its agency JAICA in 2011. The profitable move came through the assistance of the Promoting Smallholder Market Engagement Project with the aim of transforming the fortunes of chilli growers in Nyanga.
The processing plant has created employment for youths in the area. Participating farmers are now able to purchase cattle, farm implements as well as building decent accommodation for their families and enhance food security over the recent years.
Mr Albert Gwezere (59), a Tabasco farmer in Block C of Nyakomba Irrigation Scheme, said most crops being grown in Nyakomba were being affected by lack of markets, hence farmers opt for Tabasco.
“Most farmers in this area grow beans, onions and maize, but we were failing to find lucrative markets over the past few years. The introduction of Tabasco farming has changed our lives here. We have seen a rapid growth in Tabasco farming because of its market which is readily available at reasonable prices.”
“In 2011, we only started as 100 farmers and harvested 67 tonnes. In 2012 and 2013, a total of 100 more farmers came on board and we harvested up to 350 tonnes in those two years. As a club member, I personally have 1 777 chilli plants and I am expecting three tonnes after harvesting. This should give me a profit of at least $1 500 after purchasing my inputs,” said Mr Gwezere.
Nyakomba Irrigation Scheme marketing chairperson, Mr Tenda Chiwandandebvu, said the Tabasco project had not only benefited farmers financially, but had also taught them to see farming as business.
“Our community has not only been benefited financially from the Tabasco project, but they have also learnt that farming is a very good business. Most farmers now have cropping calendars and are now doing record keeping, which have boosted the chilli production over the recent years. We are hoping for the best in this coming year as the farming portions and inputs have been expanded,” said Mr Chiwandandebvu.
Nyakomba Tabasco farmers collaborated with a group from Nyamaropa Irrigation Scheme and exported an estimated 272 tonnes of Tabasco chilli to America in a deal estimated at $140 000 last year.
78
NGO in smallholder farmers market linkages
PRACTICAL Action, in conjunction with Farm Community Trust of Zimbabwe last week held a Regional Farmers Gathering to discuss the effectiveness of the new approach to facilitate market linkages for smallholder farmers.
The initiative is dubbed the participatory market system development (PMSD).It is an approach that seeks to facilitate the creation of viable market linkages for smallholder farmers.
The discussion was held at Hot Springs, the main objective being to bring together farmers, development workers, extension workers, and local government to discuss the effectiveness of the strategy.
Participants were drawn from Mutare, Nyamaropa, Nyakomba, Nyamarimbira, Nyangombe, Nyarumvurwe, Bende, Domborutinhira, Chipendeke, Chakohwa, Svinurai and Nyanyadzi Irrigation Schemes.
The PMSD project started in 2013 and is ending in 2016.It is being funded by the Big Lottery Fund.
Manicaland smallholder engagement project manager, Mr Reginald Sithole, said the PMSD approach was established to bridge the gap between farmers and interest groups, especially Government.
“Our aim is to link farmers with different stakeholders to enable them to meet their needs and improve the quality of their livelihoods.
“If people are fully involved in processes that shape market systems those markets are more likely to innovate and deliver appropriate prices that meet the farmers’ needs.
“We also sought to play a constructive role in the province’s economic growth, development and transformation and create an environment in which agribusinesses of all sizes and in all sectors could thrive, expand and be competitive,” said Mr Sithole.
He added that the aim of PA is to leave a strong bond between farmers and other business stakeholders at an advanced stage before the end of their project.
Practical Action has been working with stakeholders at the national, provincial, district and ward levels for the past two years where it trained farmers and facilitate market research for them by enabling to scout different markets around Zimbabwe.
The organisation successfully linked Chakohwa and Chipendeke Irrigation Schemes to Cairns Foods, resulting into a Michigan beans farming contract.
Apart from that, PA also successfully linked Svinurai Irrigation Scheme with micro finance institutions like Zambuko Trust.
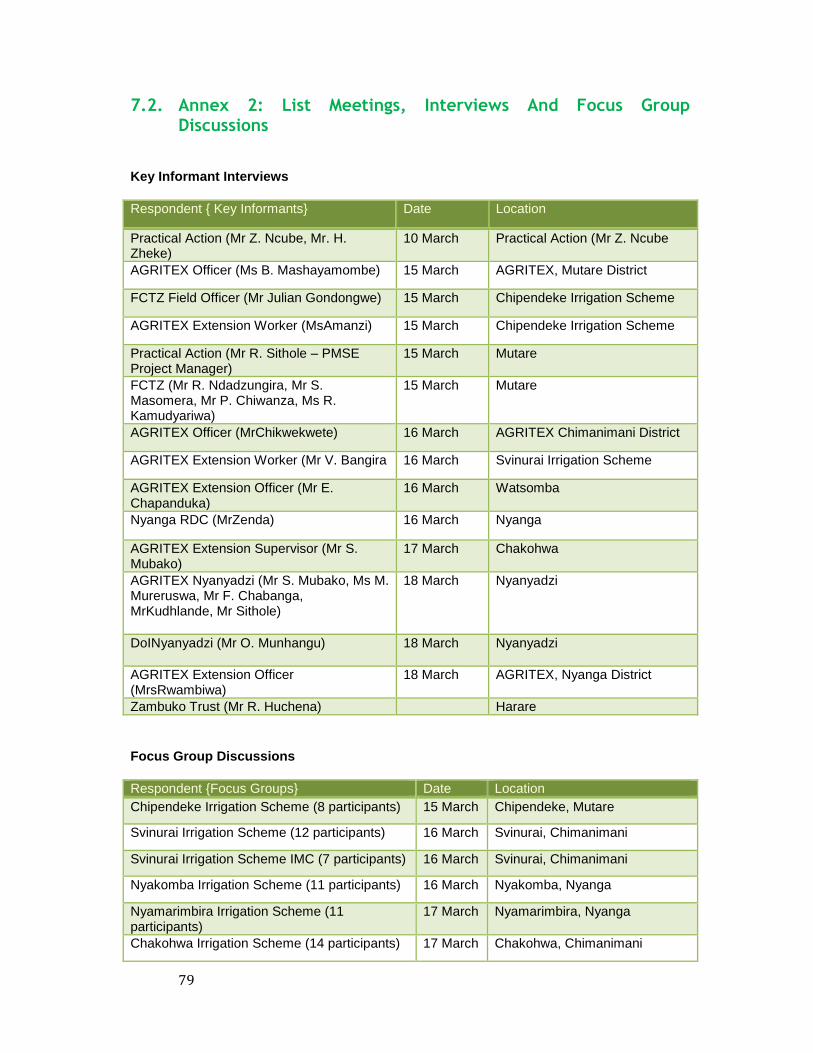
79
7.2. Annex 2: List Meetings, Interviews And Focus Group Discussions
Key Informant Interviews
Respondent { Key Informants} Date Location
Practical Action (Mr Z. Ncube, Mr. H. Zheke)
10 March Practical Action (Mr Z. Ncube
AGRITEX Officer (Ms B. Mashayamombe) 15 March AGRITEX, Mutare District
FCTZ Field Officer (Mr Julian Gondongwe) 15 March Chipendeke Irrigation Scheme
AGRITEX Extension Worker (MsAmanzi) 15 March Chipendeke Irrigation Scheme
Practical Action (Mr R. Sithole – PMSE Project Manager)
15 March Mutare
FCTZ (Mr R. Ndadzungira, Mr S. Masomera, Mr P. Chiwanza, Ms R. Kamudyariwa)
15 March Mutare
AGRITEX Officer (MrChikwekwete) 16 March AGRITEX Chimanimani District
AGRITEX Extension Worker (Mr V. Bangira 16 March Svinurai Irrigation Scheme
AGRITEX Extension Officer (Mr E. Chapanduka)
16 March Watsomba
Nyanga RDC (MrZenda) 16 March Nyanga
AGRITEX Extension Supervisor (Mr S. Mubako)
17 March Chakohwa
AGRITEX Nyanyadzi (Mr S. Mubako, Ms M. Mureruswa, Mr F. Chabanga, MrKudhlande, Mr Sithole)
18 March Nyanyadzi
DoINyanyadzi (Mr O. Munhangu) 18 March Nyanyadzi
AGRITEX Extension Officer (MrsRwambiwa)
18 March AGRITEX, Nyanga District
Zambuko Trust (Mr R. Huchena) Harare
Focus Group Discussions
Respondent {Focus Groups} Date Location
Chipendeke Irrigation Scheme (8 participants) 15 March Chipendeke, Mutare
Svinurai Irrigation Scheme (12 participants) 16 March Svinurai, Chimanimani
Svinurai Irrigation Scheme IMC (7 participants) 16 March Svinurai, Chimanimani
Nyakomba Irrigation Scheme (11 participants) 16 March Nyakomba, Nyanga
Nyamarimbira Irrigation Scheme (11 participants)
17 March Nyamarimbira, Nyanga
Chakohwa Irrigation Scheme (14 participants) 17 March Chakohwa, Chimanimani

80
Nyarumvurwe Irrigation Scheme (10 participants)
18 March Nyarumvurwe, Mutasa
Nyanyadzi Irrigation Scheme IMC+ Marketing Committee (7 members)
18 March Nyanyadzi, Chimanimani

81
7.3. Annex 3: Bond Evidence Principles Checklist BOND PRINCIPLES: CHECKLIST FOR ASSESSING QUALITY OF EVIDENCE Piece of evidence being assessed
Name of assessor
Date of assessment
Principle Criteria 1 2 3 4 Comments/evidence Score Quality
1) Voice and Inclusion
We present beneficiaries’ views on the effects of the intervention, and identify who has been affected and how
1a. Are the perspectives of beneficiaries included in the evidence?
0/4
1b. Are the perspectives of the most excluded and marginalized groups included in the evidence?
0/4
1c. Are findings disaggregated according to sex, disability and other relevant social difference?
0/4
1d. Did beneficiaries play an active role in designing the evidence gathering and analysis process?
0/4
Total score for voice and inclusion 0/16
2) Appropriateness
We use methods that are justifiable given the nature of the intervention and purpose of the assessment
2a. Are the data collection methods relevant to the purpose of the enquiry and do they generate reliable data?
0/4
2b. Is the size and composition of the sample in proportion to the conclusions sought by the enquiry?
0/4
2c. Does the team have the skills and characteristics to deliver high quality data collection and analysis?
0/4
2d. Are the data analysed in a systematic way that leads to convincing conclusions?
0/4
Total score for appropriateness 0/16
3) Triangulation
We make conclusions about the intervention’s effects by using a mix of methods, data sources, and perspectives
3a. different data collection methodologies used and different types of data collected?
0/4
3b. the perspectives of different stakeholders compared and analysed in establishing if and how change has occurred?
0/4
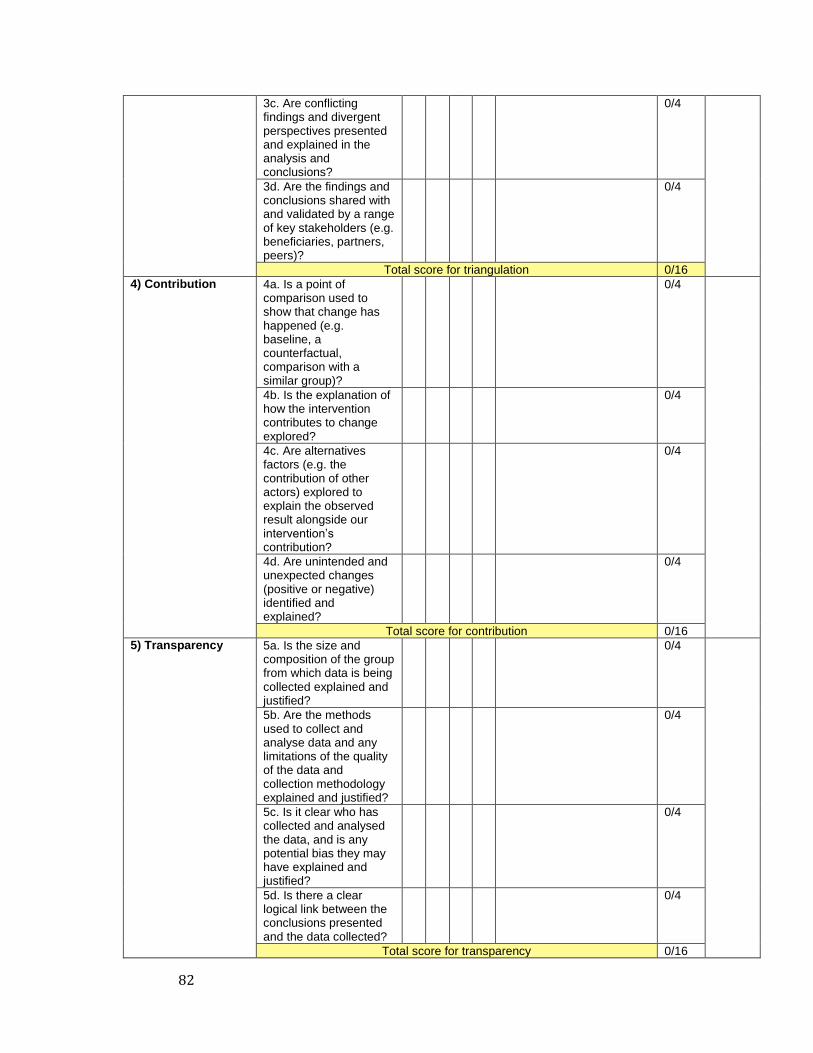
82
3c. Are conflicting findings and divergent perspectives presented and explained in the analysis and conclusions?
0/4
3d. Are the findings and conclusions shared with and validated by a range of key stakeholders (e.g. beneficiaries, partners, peers)?
0/4
Total score for triangulation 0/16
4) Contribution 4a. Is a point of comparison used to show that change has happened (e.g. baseline, a counterfactual, comparison with a similar group)?
0/4
4b. Is the explanation of how the intervention contributes to change explored?
0/4
4c. Are alternatives factors (e.g. the contribution of other actors) explored to explain the observed result alongside our intervention’s contribution?
0/4
4d. Are unintended and unexpected changes (positive or negative) identified and explained?
0/4
Total score for contribution 0/16
5) Transparency 5a. Is the size and composition of the group from which data is being collected explained and justified?
0/4
5b. Are the methods used to collect and analyse data and any limitations of the quality of the data and collection methodology explained and justified?
0/4
5c. Is it clear who has collected and analysed the data, and is any potential bias they may have explained and justified?
0/4
5d. Is there a clear logical link between the conclusions presented and the data collected?
0/4
Total score for transparency 0/16

83
7.4. Annex 4: Terms of Reference (TORs)
Terms of Reference for End of Project Evaluation
“Promoting Smallholder Market Engagement (PSME) Project in Manicaland Province of Zimbabwe”
BIG LOTTERY FUNDED PROJECT
Feb – March 2016 ToR for the End of Project Evaluation – PSME‐Big Lottery Funded Project 2016 Page 1

84
ACRONYMNS AND ABBREVIATIONS
BLF Big Lottery Fund PSME Promoting Smallholder Market Engagement FCTZ Farm Community Trust of Zimbabwe ZT Zambuko Trust of Zimbabwe AGRITEX Agriculture Technical and Extension Services FGD Focal Group Discussion HH Household MOU Memorandum of Understanding ToT Training of Trainers TFT Training for Transformation TLT Training Leaders for Transformation
ToR for the End of Project Evaluation – PSME‐Big Lottery Funded Project 2016 Page
2
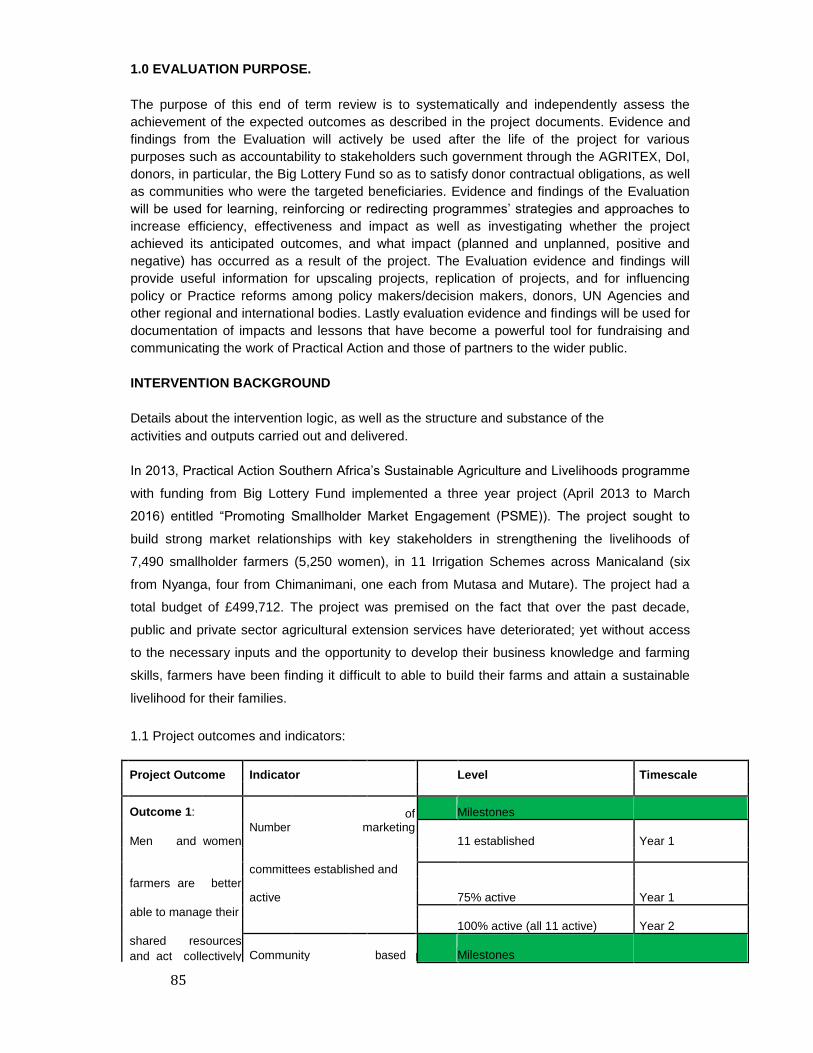
85
1.0 EVALUATION PURPOSE.
The purpose of this end of term review is to systematically and independently assess the
achievement of the expected outcomes as described in the project documents. Evidence and
findings from the Evaluation will actively be used after the life of the project for various
purposes such as accountability to stakeholders such government through the AGRITEX, DoI,
donors, in particular, the Big Lottery Fund so as to satisfy donor contractual obligations, as well
as communities who were the targeted beneficiaries. Evidence and findings of the Evaluation
will be used for learning, reinforcing or redirecting programmes’ strategies and approaches to
increase efficiency, effectiveness and impact as well as investigating whether the project
achieved its anticipated outcomes, and what impact (planned and unplanned, positive and
negative) has occurred as a result of the project. The Evaluation evidence and findings will
provide useful information for upscaling projects, replication of projects, and for influencing
policy or Practice reforms among policy makers/decision makers, donors, UN Agencies and
other regional and international bodies. Lastly evaluation evidence and findings will be used for
documentation of impacts and lessons that have become a powerful tool for fundraising and
communicating the work of Practical Action and those of partners to the wider public.
INTERVENTION BACKGROUND
Details about the intervention logic, as well as the structure and substance of the
activities and outputs carried out and delivered.
In 2013, Practical Action Southern Africa’s Sustainable Agriculture and Livelihoods programme
with funding from Big Lottery Fund implemented a three year project (April 2013 to March
2016) entitled “Promoting Smallholder Market Engagement (PSME)). The project sought to
build strong market relationships with key stakeholders in strengthening the livelihoods of
7,490 smallholder farmers (5,250 women), in 11 Irrigation Schemes across Manicaland (six
from Nyanga, four from Chimanimani, one each from Mutasa and Mutare). The project had a
total budget of £499,712. The project was premised on the fact that over the past decade,
public and private sector agricultural extension services have deteriorated; yet without access
to the necessary inputs and the opportunity to develop their business knowledge and farming
skills, farmers have been finding it difficult to able to build their farms and attain a sustainable
livelihood for their families.
1.1 Project outcomes and indicators:
Project Outcome Indicator Level Timescale
Outcome 1:
Number
of marketing
Milestones
Men and women
11 established Year 1
committees established and
farmers are better
75% active Year 1
active
able to manage their
100% active (all 11 active) Year 2
shared resources
Milestones
and act collectively Community based p
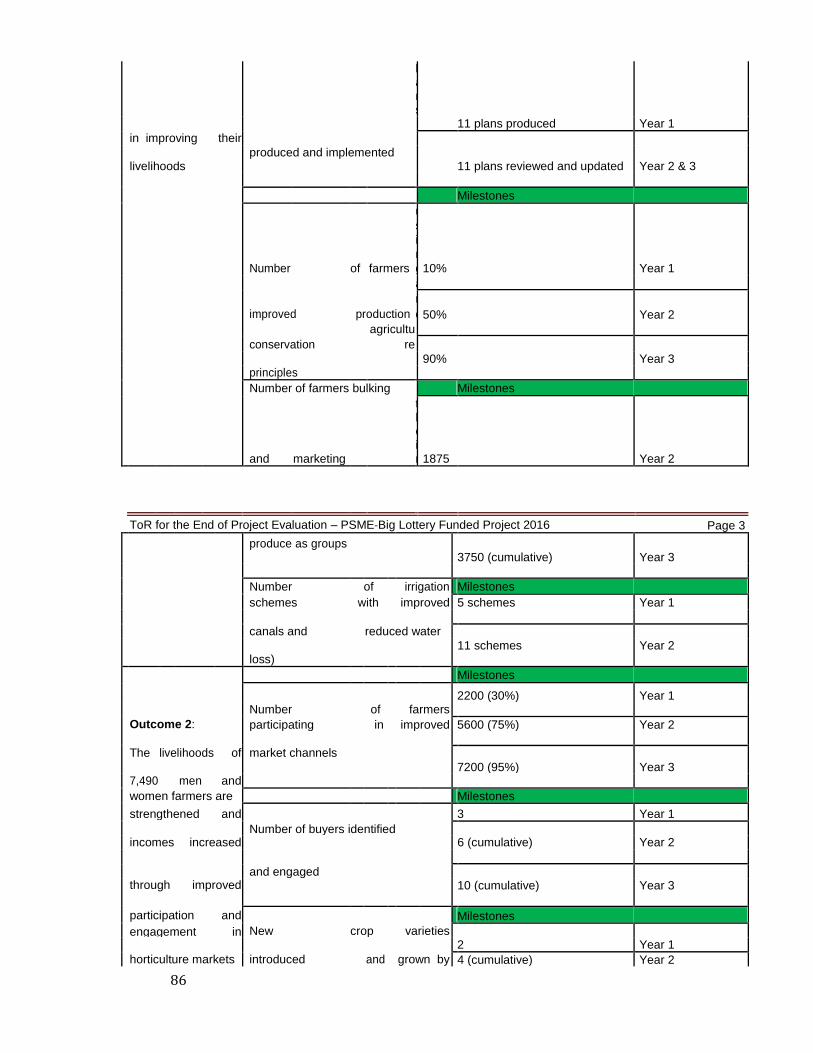
86
lans
11 plans produced Year 1
in improving their
produced and implemented
11 plans reviewed and updated Year 2 & 3
livelihoods
Milestones
Number of farmers
u
s
i
n
g 10% Year 1
improved production
a
n
d
50% Year 2
conservation
agricultu
re
90% Year 3
principles
Number of farmers bulking Milestones
and marketing
their 1875 Year 2
ToR for the End of Project Evaluation – PSME‐Big Lottery Funded Project 2016 Page 3
produce as groups 3750 (cumulative) Year 3
Number of irrigation Milestones
schemes with improved 5 schemes Year 1
canals and reduced water
11 schemes Year 2
loss)
Milestones
Number
of
farmers
2200 (30%) Year 1
Outcome 2:
participating in improved 5600 (75%) Year 2
The livelihoods of market channels
7200 (95%) Year 3
7,490
men and
women farmers are Milestones
strengthened and
Number of buyers identified
3 Year 1
incomes increased
6 (cumulative) Year 2
and engaged
through improved
10 (cumulative) Year 3
participation and
New crop
varieties
Milestones
engagement in 2 Year 1
horticulture markets introduced and grown by
4 (cumulative) Year 2
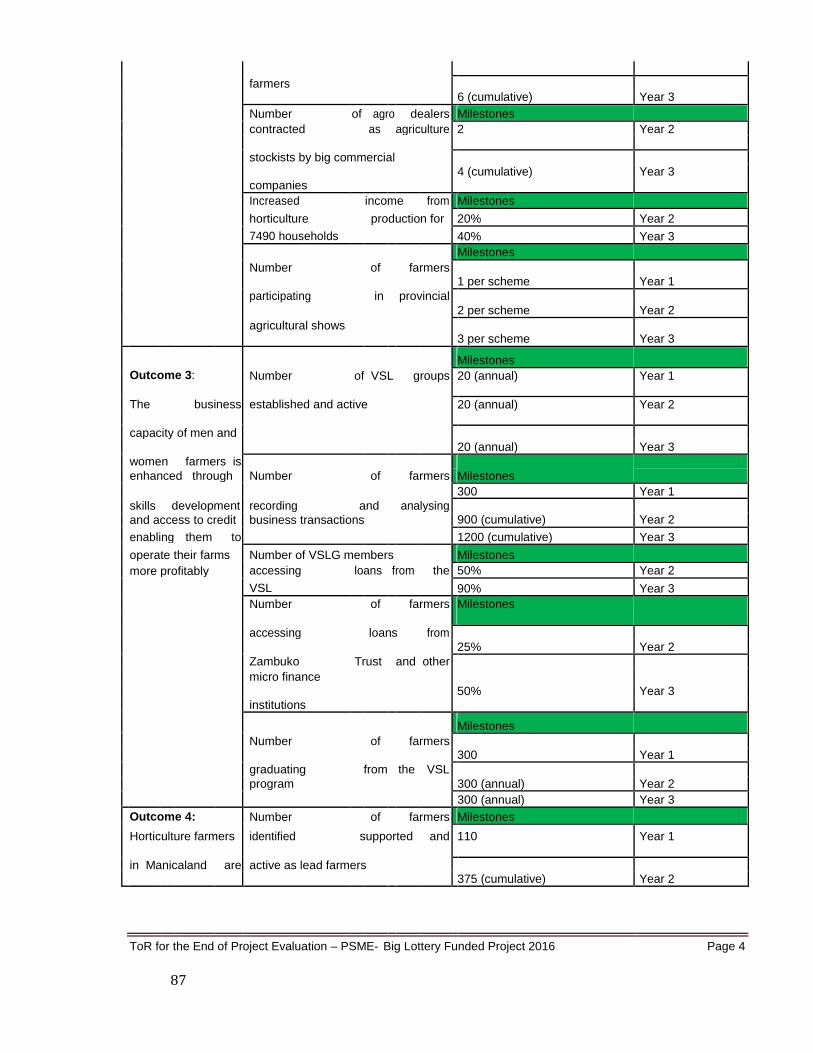
87
farmers
6 (cumulative) Year 3
Number of agro dealers Milestones
contracted as agriculture 2 Year 2
stockists by big commercial
4 (cumulative) Year 3
companies
Increased income from Milestones
horticulture production for 20% Year 2
7490 households 40% Year 3
Number
of
farmers
Milestones
1 per scheme Year 1
participating in provincial
2 per scheme Year 2
agricultural shows
3 per scheme Year 3
Outcome 3:
Milestones
Number of VSL groups 20 (annual) Year 1
The
business established and active
20 (annual) Year 2
capacity of men and
20 (annual) Year 3
women farmers is
Milestones
enhanced through Number of farmers
skills development recording and
analysing
300 Year 1
900 (cumulative) Year 2
and access to credit business transactions
enabling them to 1200 (cumulative) Year 3
operate their farms Number of VSLG members Milestones
more profitably accessing loans from the 50% Year 2
VSL 90% Year 3
Number of farmers Milestones
accessing
loans from
25% Year 2
Zambuko Trust and other
micro finance 50% Year 3
institutions
Number
of
farmers
Milestones
300 Year 1
graduating from the VSL
300 (annual) Year 2
program
300 (annual) Year 3
Outcome 4: Number of farmers Milestones
Horticulture farmers identified supported and 110 Year 1
in Manicaland are active as lead farmers
375 (cumulative) Year 2
ToR for the End of Project Evaluation – PSME‐ Big Lottery Funded Project 2016 Page 4

88
able to access high Milestones
quality, relevant and
Number
of farmers’ major
1000 Year 1
timely extension extension needs met by the
3000 (cumulative) Year 2
and market lead farmers.
engagement advice 6750 (cumulative) Year 3
for a wider range of
Milestones
crops from district
Number of extension
11 Year 2
and provincial officers using PMSD as a
extension service
s market facilitation approach
22 (cumulative) Year 3
and private sector
Milestones
providers
Number
of lessons shared 132 Year 1
through podcasting 264 (cumulative) Year 2
396 (cumulative) Year 3
Number of extension
Milestones
70 (10 per district) Year 2
officers outside the project
using PMSD as a market
140 (cumulative) Year 3
facilitation approach
STAKEHOLDER INVOLVEMENT.
A Participatory Evaluation approach that involves all key stakeholders will be used so at to
allow cross pollination of ideas. The key stakeholders will be involved as follows:
Practical Action
Enter into a contract with the consultant contracted to undertake the evaluation. Provide all documentation related to project proposal, including contribution agreement,
progress reports, evaluation reports and contract documents. Coordinate and arrange for the interviews of staff and
institutions Share the first draft report with partners and the
BLF. Coordinate with partners initial comments on the draft report and share with consultant in a
timely manner.
89
Share final evaluation report to all partners and the BLF..
Within Practical Action, the following teams will be actively involved.
Project management team are responsible for generating quarterly and annual progress reports
and will provide secondary data sources.
Monitoring, Evaluation and Learning (MEL) team will lead in setting evaluation standards
(eensuring use of the BOND Evidence principles) and providing guidance in order to create harmony
between the institutional and donor requirements and providing quality assurance for standards
before report (evaluation) is adopted and submitted to the donor.
Implementing Partners‐ Farm Community Trust of Zimbabwe and Zambuko Trust of Zimbabwe The Partners, as joint implementers with different roles such as community mobilization, selection of
beneficiaries and with shared responsibility for implementation and daily monitoring, will participate in
the project evaluation as they are the source of information, key informants and also mobilizing
communities for evaluations. They will specifically;
Provide all documents related to the project in its custody, including plans and operational reports, staff
contracts, contracts with service providers in respect of this action, correspondences and any records of
equipment and materials procured the action. Coordinate and arrange for the interviews of staff and institutions and stakeholders relevant to
this action and based in the field. Responsible for logistics to project sites in the district and government departments.
Coordinate and arrange for interviews with local leadership, and irrigation committees such as
the IMC, Maintenance and Marketing. Coordinate with consultant the presentation of evaluation findings.
Government Departments – AGRITEX, DoI, Local Authorities were part of the implementation team
who participated in the selection of wards, train farmers technical areas like improved agronomic
practices, irrigation water maintenance, leadership, market literacy, supervise rehabilitation and
maintenance of irrigation infrastructure and will be key informants during project evaluations
Smallholder farmers – Being key implementers, providing labour in irrigation infrastructure
improvement, they are the lynchpin of the project including M&E. They will participate through sharing of
the lessons learnt and as key informants through representative samples and focus group who validate
project outputs, results and impacts.
The review team/consultant Perform a desk review of the documentation provided to gain an understanding of the context and
environment in which the partners project operates; Develop the end of term review work plan
1 with a clear methodological approach. Each activity/
element of the review MUST have estimated durations in days clearly indicated. Provide a total cost for the end of term review broken into details such as Professional fees,
accommodation, costs of transport, equipment, etc.…(A practical and cost efficient plan will be
among the criteria used to award the consultancy.) Design the specific review approach and details of the procedures to be used, within the budget and
timeframe available; Encourage partners, stakeholders and beneficiaries to communicate concerns, ideas, questions and

90
suggestions to the review team during the review process and actively solicit their views; Draft the report according to the reporting timeframe and template;
Ensure a logical and plausible link between information gathered and analysed and results and
recommendations presented; Address recommendations for action and outline possible implications;
Record all aspects of methodological choices, assumptions, and limitations of the review process
and present a critical review during a debriefing with Practical Action and Partners as part of the
evaluation report
EVALUATION QUESTIONS
List of evaluation questions, based on a set of criteria that suit the evaluation purpose. Ensure you use
the BOND Evidence principles to help inform your questions and methodology.
The Evaluation will examine the extent to which the project achieved the following key principles
through the following questions:
Efficiency The evaluation will examine the extent to which the costs of a development intervention can be
justified by its outcomes through covering the following questions:
Was the intervention managed with reasonable regard for optimal use of resources What measures were taken during planning and implementation to ensure that resources
were efficiently used? Could the intervention have been implemented with fewer resources without reducing the
quality and quantity of the results?
Effectiveness
The evaluation will examine the extent to which the development intervention achieved its outcomes,
taking their relative importance into account through covering the following questions among others:
To what extent do development changes in the target area agree with the planned outputs,
purpose and goal of the intervention? This was a PMSD project which worked with the private
sector and acted as an intermediary between them and farmer group. Key questions to assess
are thus o What lessons can be drawn from using this approach? o
How has this enhanced linkage of farmers to market? o
How has this impacted women and men farmers o To what extent has the project increased incomes of farmers, and what have been
the impacts of this at the household level?
o What has been the investment of the Household to reach the present income level?
How has this changed for women and men?
What are the reasons for the achievement or non‐ achievement of
outcomes? What could have been done to make the intervention more
effective?
Impact
The evaluation will examine the extent to which the development intervention achieved the intended

91
effects (positive and negative, intended and unintended) through covering the following questions:
What are the intended and unintended, positive and negative, effects of the intervention on
people, institutions and the physical environment? What do beneficiaries and other stakeholders affected by the intervention perceive to be the
effects of the intervention on themselves (different sub groups and looked at differential impacts
on extreme poor, women, and men, children, disabled?) To what extent does the intervention contribute to capacity development and the strengthening
of institutions? To what extent can identified changes be attributed to the intervention
Relevance The Evaluation will determine the extent to which a development intervention conformed to the needs
and priorities of target groups and the national policies through covering the following questions among
others:
Was the intervention consistent with the livelihood strategies and living conditions of its target
groups? Was the intervention well in tune with the development policies and administrative systems of the
government of Zimbabwe at district and national levels as well as the regional and international
levels? Was the intervention a technically adequate solution to the development problem and did it
eliminate the main causes of the problem? Sustainability The evaluation will assess the potential for continuation of benefits from the intervention after the end of
the project though addressing the following questions
Was the intervention supported by local institutions and well integrated with local social and
cultural practises? How active was the participation of stakeholders in the planning and implementation of the
intervention? Is the technology and approach utilised in the intervention appropriate to the economic,
educational and cultural conditions in the target communities? Do partners have the financial capacity to maintain the benefits from the intervention when
Practical Action support has been withdrawn? Gender: The evaluation will assess the extent to which the intervention ensured equitable access to technological
options for all women and men and advanced gender equality and women’s empowerment through
addressing the following questions:
How were gender‐ related factors considered in the planning and implementation of the
intervention? Are there baseline data for assessing gender equality impact? Are data properly disaggregated
by gender?
Evidence: The evaluation will examine how robust is the evidence we collect and used by asking the following
questions in line with the BOND Principles (Annexed)
Are the perspectives of people living in poverty, including the most marginalized, are included in
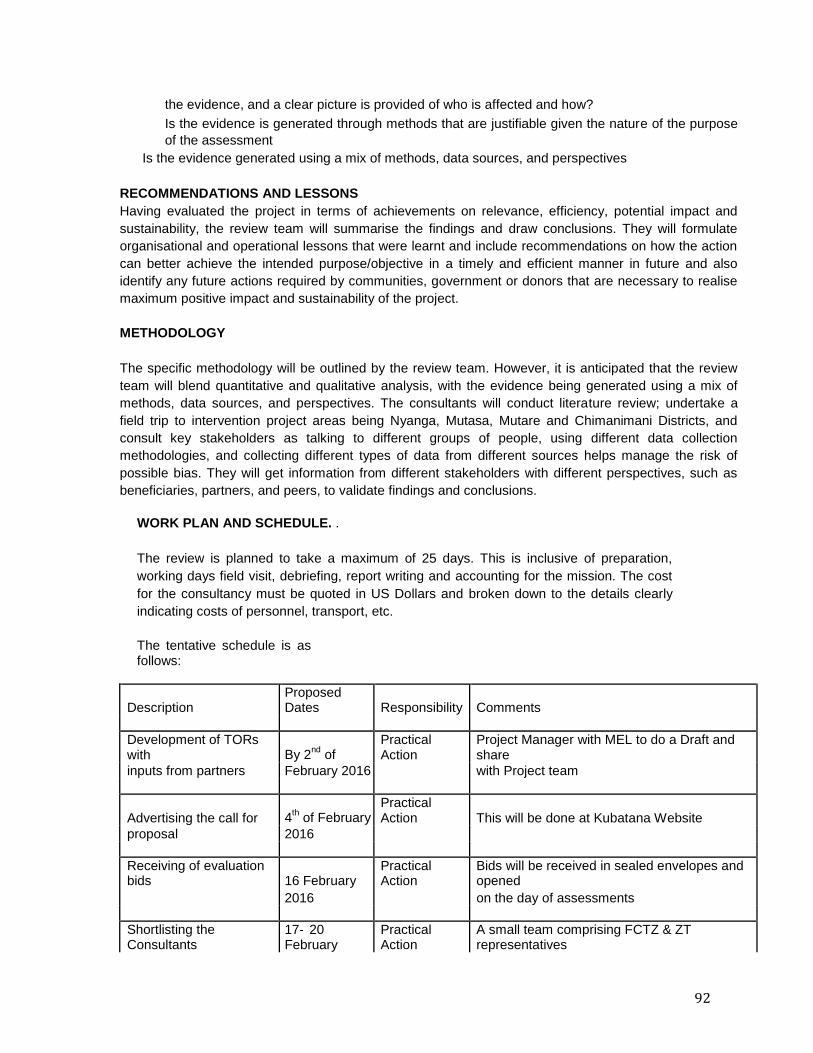
92
the evidence, and a clear picture is provided of who is affected and how? Is the evidence is generated through methods that are justifiable given the nature of the purpose
of the assessment Is the evidence generated using a mix of methods, data sources, and perspectives
RECOMMENDATIONS AND LESSONS Having evaluated the project in terms of achievements on relevance, efficiency, potential impact and
sustainability, the review team will summarise the findings and draw conclusions. They will formulate
organisational and operational lessons that were learnt and include recommendations on how the action
can better achieve the intended purpose/objective in a timely and efficient manner in future and also
identify any future actions required by communities, government or donors that are necessary to realise
maximum positive impact and sustainability of the project.
METHODOLOGY
The specific methodology will be outlined by the review team. However, it is anticipated that the review
team will blend quantitative and qualitative analysis, with the evidence being generated using a mix of
methods, data sources, and perspectives. The consultants will conduct literature review; undertake a
field trip to intervention project areas being Nyanga, Mutasa, Mutare and Chimanimani Districts, and
consult key stakeholders as talking to different groups of people, using different data collection
methodologies, and collecting different types of data from different sources helps manage the risk of
possible bias. They will get information from different stakeholders with different perspectives, such as
beneficiaries, partners, and peers, to validate findings and conclusions.
WORK PLAN AND SCHEDULE. .
The review is planned to take a maximum of 25 days. This is inclusive of preparation,
working days field visit, debriefing, report writing and accounting for the mission. The cost
for the consultancy must be quoted in US Dollars and broken down to the details clearly
indicating costs of personnel, transport, etc.
The tentative schedule is as follows:
Description Proposed Dates Responsibility Comments
Development of TORs with By 2
nd of
Practical Action
Project Manager with MEL to do a Draft and share
inputs from partners February 2016 with Project team
Advertising the call for 4th of February
Practical Action This will be done at Kubatana Website
proposal 2016
Receiving of evaluation bids 16 February
Practical Action
Bids will be received in sealed envelopes and opened
2016 on the day of assessments
Shortlisting the Consultants
17‐ 20 February
Practical Action
A small team comprising FCTZ & ZT representatives

93
for the evaluation 2016 /FCTZ/ZT and Practical Action team of Project Manager, MEL
Manager and Programme Head will do the
adjudication
Selection of Consultant and 23 February
Practical Action
A joint adjudication team will assess the bids and
negotiations 2016 /FCTZ/ZT select the winner. A predetermined selection tool will
be developed
Engagement of Consultants 24 February
Practical Action
Contract will be done with successful candidates
and contractual agreements 2016
according to Practical Action policies and procedures
Orientation meetings 25 February Consultant(s)/ Practical Action to provide reports in time.
between Consultant, 2016 Practical Action
Practical Action /FCTZ/ZT /FCTZ/ZT
Literature Review by 26 February Consultant(s) Supporting documents will be provided as highlighted
Consultant 2016 in the section overleaf
Field work 29 Feb‐ 4 March
FCTZ/ZT/Practic
FCTZ and ZT to coordinate. Practical Action to provide
Mutare/Chimanimani, 2016 al Action any required support
Mutasa and Nyanga
Draft Report completed 15 March 2016 Consiultant(s)
Consultant to share the Report with the Partners
Feedback by Partners 18 March 2016
Practical Action Written feedback by Partners
/FCTZ/ZT
Finalisation of Report 21 March 2016 Consultant(s) Report Finalised with comments addressed
Management Response Once a final report has been accepted. Practical
Action management will formulate a ‘management
response’
Adoption and submission of
Practical Action Report will be submitted to BLF
Report to BLF
REPORTING
94
Specification of what reports should be delivered and when, and the evaluators’ role in
follow up seminars and workshops. All evaluations must be published with a one page
summary sheet.
The consultant is accountable for delivering the products of the review, which include draft
and final reports. The Evaluation Report will follow the Practical Action Template Structure
as shown below:
Executive summary
One page summary of the evaluation, with particular emphasis on main findings, conclusions, lessons
learned and recommendations.
Introduction Presentation of the evaluation’s purpose, questions and main findings.
The evaluated intervention Description of the evaluated intervention, and its purpose, logic, history, organisation and stakeholders. Findings Factual evidence, data and observations that are relevant to the specific questions asked by the evaluation. Evaluative conclusions Assessment of the intervention and its results against given evaluation criteria as stated in the TOR. Lessons learned General conclusions that are likely to have a potential for wider application and use. Recommendations Actionable proposals to the evaluation’s users for improved intervention cycle management and policy. Annexes Terms of reference, methodology for data gathering and analysis, references, etc.
PROFILE OF EVALUATION TEAM
The review team should provide the following experiences and skills (complementary set):
Be a holder of at least a Degree in the following areas: Agriculture, Marketing, Social Studies;
Development Studies; or any related qualifications. A Master’s Degree in any of the above listed
academic fields is an added advantage.
At least 10 years or more extensive experience in complex evaluations of Agriculture Marketing
projects with practical quantitative and qualitative evaluation skills
Knowledge current policies, strategies, trends and challenges in agriculture market linkages in
Zimbabwe as well as global, regional trends and challenges in the same.
The Expert should have proven relevant experiences in Project Evaluations with reputable NGOs or
UN Agencies or should have carried out at least two end of term reviews/final evaluations of similar
projects in the last 3‐5 years.
Have the ability to draft concise reports and communicate the review/evaluation results clearly

95
Have the ability to interact with team members and stakeholders in a sensitive and effective way. Knowledge of Shona is an added advantage to facilitate direct communication with the beneficaries. Supporting Documents
Supporting documents are required as background information and before the review exercise begins,
be made available;
Detailed proposals Contributing partners agreement form; Log
frame;
Action Budget Baseline Survey Report Year 1 Narrative and Financial Reports
Year 2 Narrative and Financial Reports
Mini Evaluation Report Quarterly and annual progress reports
Any correspondence deemed appropriate with the contributing partners
Partners Strategies and Policies
96
PRESENTATION OF A PROPOSAL AND INSTRUCTIONS TO BIDDERS
Having read the terms of Reference and annex the prospective consultants wishing to present to
partners a proposal for analysis prior to award of contract must fulfil the following conditions:
1) Comply with the guidelines provided in the terms of reference. 2) Provide reference /and or evidence of previous similar works undertaken in the last 3‐ 5
years as highlighted in section 5.0 This is essential part of the evaluation process. 3) Provide a brief resume (CV) of the key persons to undertake or lead the team tasked with
undertaking the End‐ term review.
SUBMISSION OF PROPOSAL/BID
All proposals /bids for the consultancy should be placed in the Tender Box in plain sealed
packages or sent by courier clearly marked thus:‐ END OF PROJECT REVIEW CONSULTANCY – Big Lottery Funded Project:
At Practical Action Southern Africa
4 Ludlow Road, Highlands P.O. Box 1744 HARARE, ZIMBABWE
Not later than 19 February, 2016 at 13.00 hours

97
7.5. Annex 5: Key Informant Interview (KII) Checklist
7.5.1. KII GUIDE FOR MINISTRY & PRIVATE SECTORSTAKEHOLDERS
Date/Location:
Name of Interviewee:
Organization/Title:
Contact Details (Cell No.
& Email)
Background
Practical Action has commissioned an end of term review of the Promoting Smallholder Market Engagement
(PSME) project. The purpose of this end of term review is to systematically and independently assess the
achievement of the expected outcomes as described in the project documents. The Evaluation evidence
and findings will provide useful information for upscaling projects, replication of projects, and for
influencing policy or Practice reforms among policy makers/decision makers, donors,
We’d like to better understand your assessment, lessons learned and overall recommendations. Unless
you approve, we will not identify you by your name in the transcript nor in the main report that will be written.
You will only be identified by your position and the level of government at which you work. We take this
opportunity to request that you participate in the discussion which should last no more than one hour. We
thank you very much for your willingness to participate in the evaluation.
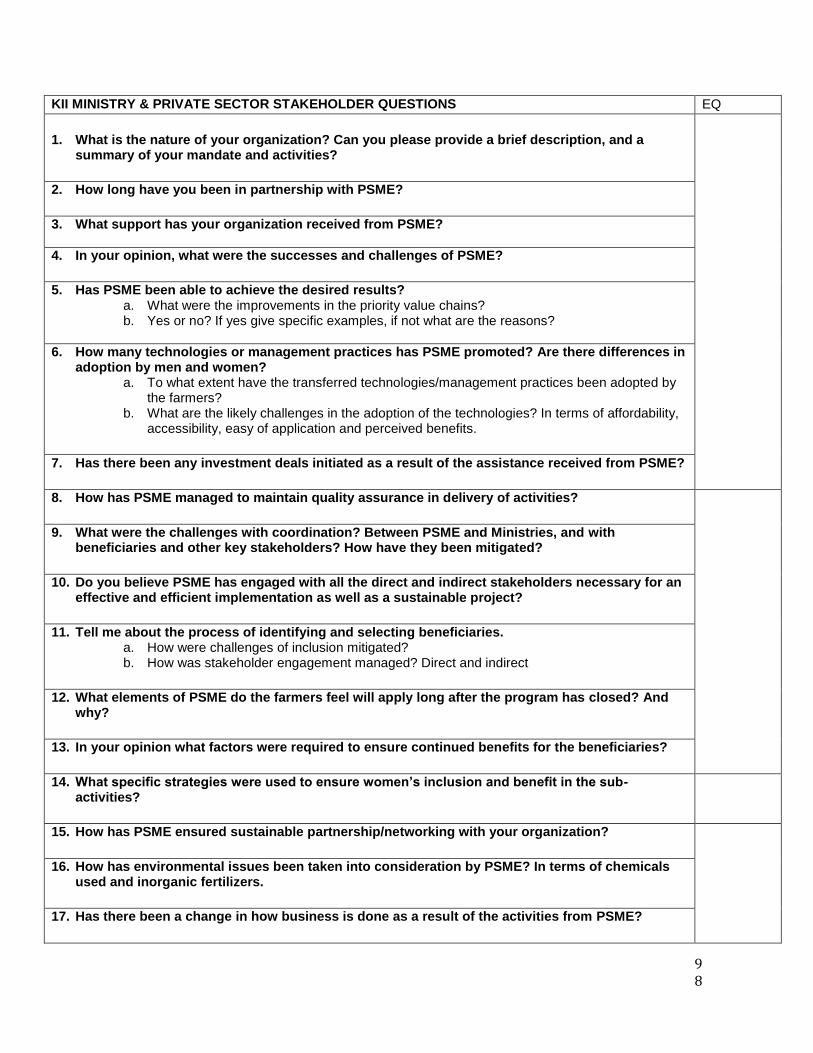
98
KII MINISTRY & PRIVATE SECTOR STAKEHOLDER QUESTIONS EQ
1. What is the nature of your organization? Can you please provide a brief description, and a summary of your mandate and activities?
2. How long have you been in partnership with PSME?
3. What support has your organization received from PSME?
4. In your opinion, what were the successes and challenges of PSME?
5. Has PSME been able to achieve the desired results? a. What were the improvements in the priority value chains? b. Yes or no? If yes give specific examples, if not what are the reasons?
6. How many technologies or management practices has PSME promoted? Are there differences in adoption by men and women?
a. To what extent have the transferred technologies/management practices been adopted by the farmers?
b. What are the likely challenges in the adoption of the technologies? In terms of affordability, accessibility, easy of application and perceived benefits.
7. Has there been any investment deals initiated as a result of the assistance received from PSME?
8. How has PSME managed to maintain quality assurance in delivery of activities?
9. What were the challenges with coordination? Between PSME and Ministries, and with beneficiaries and other key stakeholders? How have they been mitigated?
10. Do you believe PSME has engaged with all the direct and indirect stakeholders necessary for an effective and efficient implementation as well as a sustainable project?
11. Tell me about the process of identifying and selecting beneficiaries. a. How were challenges of inclusion mitigated? b. How was stakeholder engagement managed? Direct and indirect
12. What elements of PSME do the farmers feel will apply long after the program has closed? And why?
13. In your opinion what factors were required to ensure continued benefits for the beneficiaries?
14. What specific strategies were used to ensure women’s inclusion and benefit in the sub-activities?
15. How has PSME ensured sustainable partnership/networking with your organization?
16. How has environmental issues been taken into consideration by PSME? In terms of chemicals used and inorganic fertilizers.
17. Has there been a change in how business is done as a result of the activities from PSME?

99
a. When it comes to the value chain of the agriculture sector?
18. Overall, how successful has PSME been in ensuring the sustainability of agricultural activity benefits?
a. What are anticipated limitations? b. What recommendations can you make to mitigate?
19. If you were to start over, what changes would you make? What are the main lessons learned from your experience with PSME both positive and negative.
20. What changes both in delivery and technical approach would you make to greater benefit:
- Agricultural productivity and quality;
- Employment opportunities
- Farm family income
- Women
- Youth
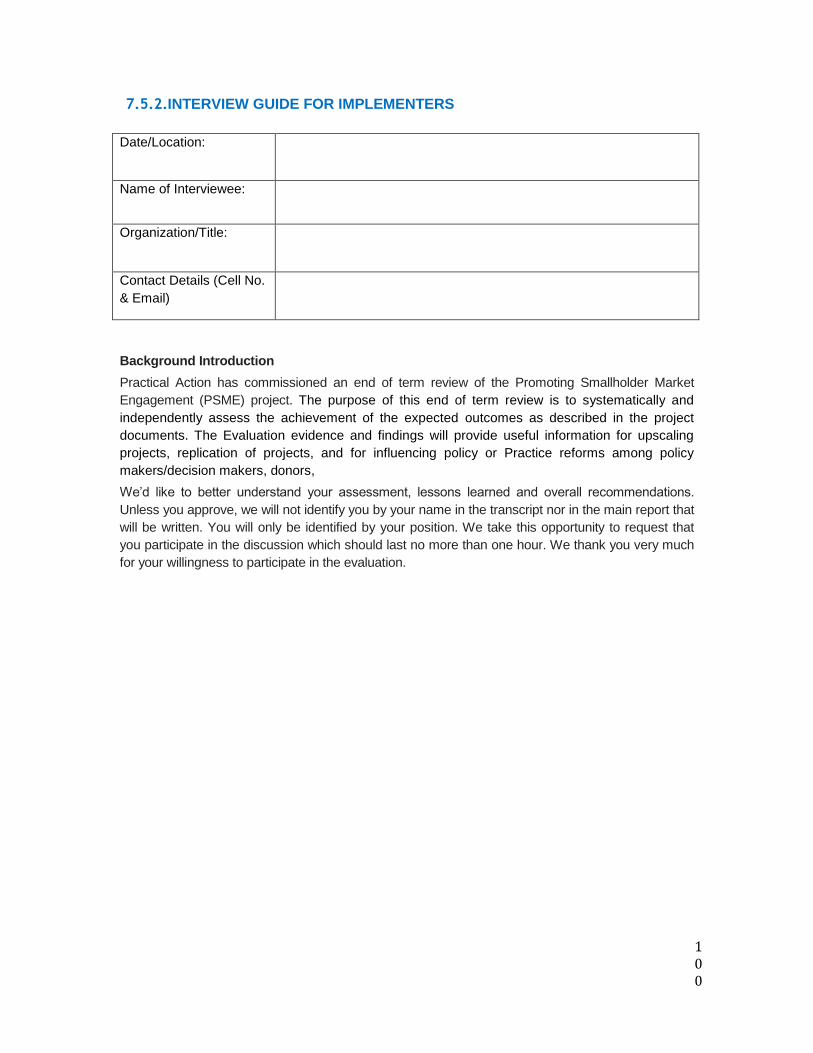
100
7.5.2.INTERVIEW GUIDE FOR IMPLEMENTERS
Date/Location:
Name of Interviewee:
Organization/Title:
Contact Details (Cell No.
& Email)
Background Introduction
Practical Action has commissioned an end of term review of the Promoting Smallholder Market
Engagement (PSME) project. The purpose of this end of term review is to systematically and
independently assess the achievement of the expected outcomes as described in the project
documents. The Evaluation evidence and findings will provide useful information for upscaling
projects, replication of projects, and for influencing policy or Practice reforms among policy
makers/decision makers, donors,
We’d like to better understand your assessment, lessons learned and overall recommendations.
Unless you approve, we will not identify you by your name in the transcript nor in the main report that
will be written. You will only be identified by your position. We take this opportunity to request that
you participate in the discussion which should last no more than one hour. We thank you very much
for your willingness to participate in the evaluation.
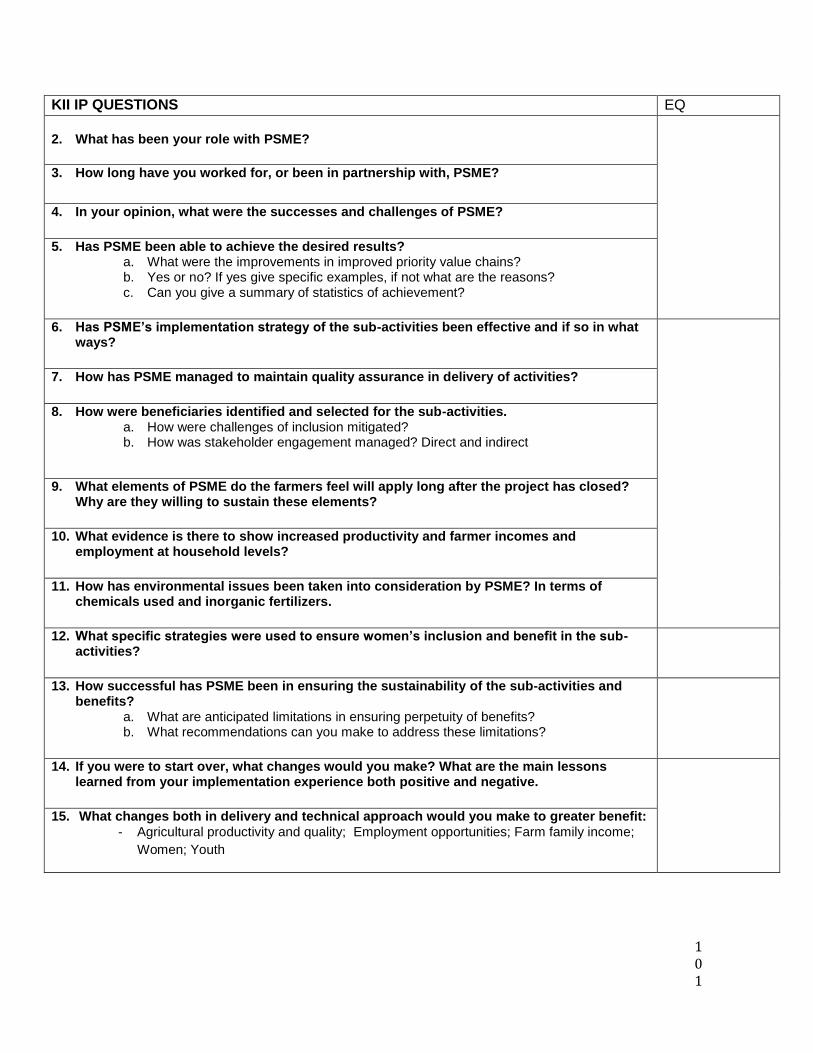
101
KII IP QUESTIONS EQ
2. What has been your role with PSME?
3. How long have you worked for, or been in partnership with, PSME?
4. In your opinion, what were the successes and challenges of PSME?
5. Has PSME been able to achieve the desired results? a. What were the improvements in improved priority value chains? b. Yes or no? If yes give specific examples, if not what are the reasons? c. Can you give a summary of statistics of achievement?
6. Has PSME’s implementation strategy of the sub-activities been effective and if so in what ways?
7. How has PSME managed to maintain quality assurance in delivery of activities?
8. How were beneficiaries identified and selected for the sub-activities. a. How were challenges of inclusion mitigated? b. How was stakeholder engagement managed? Direct and indirect
9. What elements of PSME do the farmers feel will apply long after the project has closed? Why are they willing to sustain these elements?
10. What evidence is there to show increased productivity and farmer incomes and employment at household levels?
11. How has environmental issues been taken into consideration by PSME? In terms of chemicals used and inorganic fertilizers.
12. What specific strategies were used to ensure women’s inclusion and benefit in the sub-activities?
13. How successful has PSME been in ensuring the sustainability of the sub-activities and benefits?
a. What are anticipated limitations in ensuring perpetuity of benefits? b. What recommendations can you make to address these limitations?
14. If you were to start over, what changes would you make? What are the main lessons learned from your implementation experience both positive and negative.
15. What changes both in delivery and technical approach would you make to greater benefit:
- Agricultural productivity and quality; Employment opportunities; Farm family income;
Women; Youth
102
7.6. Annex 6: Focus Group Discussion (FGD) Guide
FOCUS GROUP DISCUSSION GUIDE FOR PSME BENEFICIARIES
Date/Irrigation Scheme:
FGD Number:
Group Type:
Background
Practical Action has commissioned an end of term review of the Promoting Smallholder Market
Engagement (PSME) project. The purpose of this end of term review is to systematically and
independently assess the achievement of the expected outcomes as described in the project
documents. The Evaluation evidence and findings will provide useful information for upscaling
projects, replication of projects, and for influencing policy or Practice reforms among policy
makers/decision makers, donors,
As the stakeholders of the program we’d like to better understand your experience, how you’ve
benefited and overall recommendations. We will not identify you by your name in the transcript nor
in the main report that will be written. You will only be identified as a group you. We take this
opportunity to request that you participate in the discussion which should last no more than two
hours and we want to hear from you all. We thank you very much for your willingness to participate in
the evaluation.

Final
FGDPSME BENEFICIARIES QUESTIONS PROBE GUIDE EQ
1. Are you familiar with the PSME Project being implemented by Practical Action? (To be more effective, there might be need for a few “ice breaker” questions with farmers e.g. (i) main income sources of livelihoods/incomes in their area, (ii) major crops, (iii) key livestock enterprises)
What year did you first hear
about the program?
2. How were you first approached about the program? Who contacted you?
3. Tell me about the process of identifying and selecting participants for the agriculture activities.
Were you satisfied with how
the selection was done?
4. Was this approach of selection ideal? If not how should it have been done?
5. Were you involved in the identification of the key sub-activities of the PSME project?
Were you included in the
final decision?
6. What were the different technologies, practices and new knowledge were you introduced to?
To what extent have you
started to use these
technologies, practices and
knowledge?
7. Have other farmers started to use these same technologies, practices and knowledge introduced to you?
Can you specify and to what
extent I terms of adoption?
8. In your opinion, are the activities of the PSME project relevant for your community?
What about to you?
9. Will you continue to use the techniques and knowledge transferred to you? If so, why do you say so?
Will you be able to carry on
without the support of PEG?
If not give reasons.
10. How was PSME’s engagement with you in terms of communicating and coordinating about the activities?
11. Do you feel PSME was responsive to your needs and feedback? Give examples.
12. How are women/men/youth involved in the program? Which activities are they
involved in?
13. In your opinion, what were the activities that were most useful to you and why?
14. How has environmental issues been taken into consideration by PSME?
Please specify.
15. How has the PSME project helped you to better manage your shared resources?
Please specify.
16. How has the PSME project enhanced your skills and capacity to
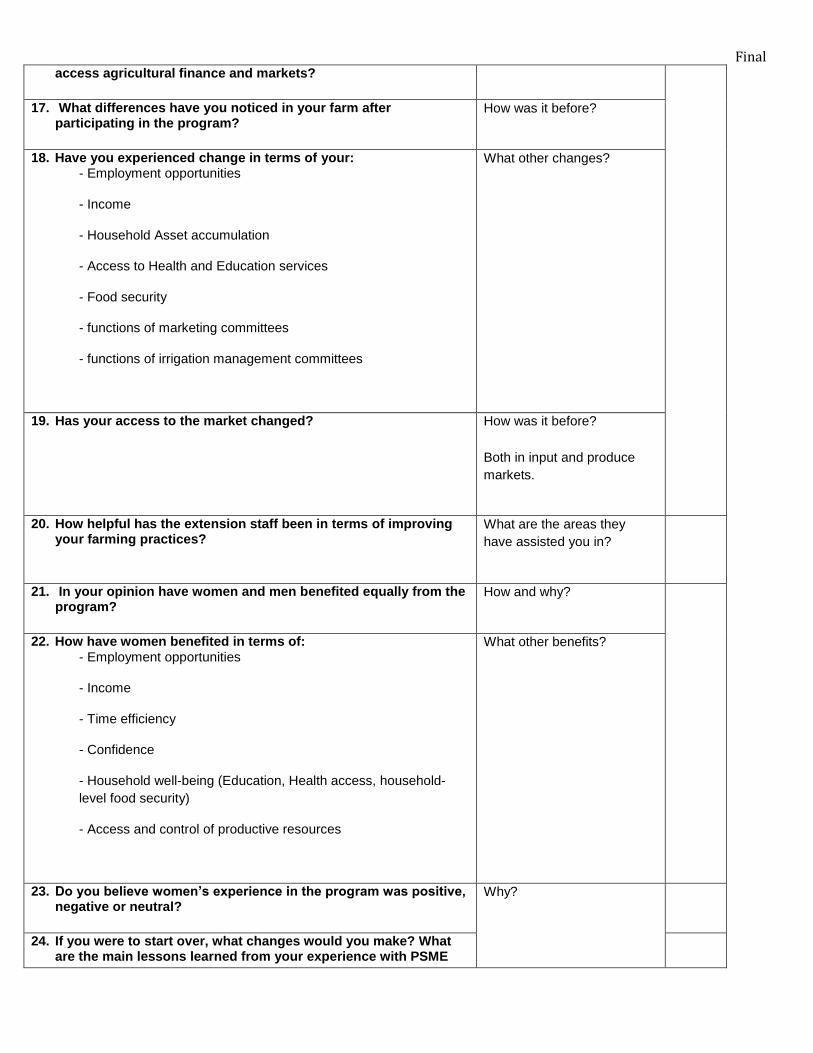
Final
access agricultural finance and markets?
17. What differences have you noticed in your farm after participating in the program?
How was it before?
18. Have you experienced change in terms of your: - Employment opportunities
- Income
- Household Asset accumulation
- Access to Health and Education services
- Food security
- functions of marketing committees
- functions of irrigation management committees
What other changes?
19. Has your access to the market changed? How was it before?
Both in input and produce
markets.
20. How helpful has the extension staff been in terms of improving your farming practices?
What are the areas they
have assisted you in?
21. In your opinion have women and men benefited equally from the program?
How and why?
22. How have women benefited in terms of:
- Employment opportunities
- Income
- Time efficiency
- Confidence
- Household well-being (Education, Health access, household-
level food security)
- Access and control of productive resources
What other benefits?
23. Do you believe women’s experience in the program was positive, negative or neutral?
Why?
24. If you were to start over, what changes would you make? What are the main lessons learned from your experience with PSME

Final
both positive and negative.
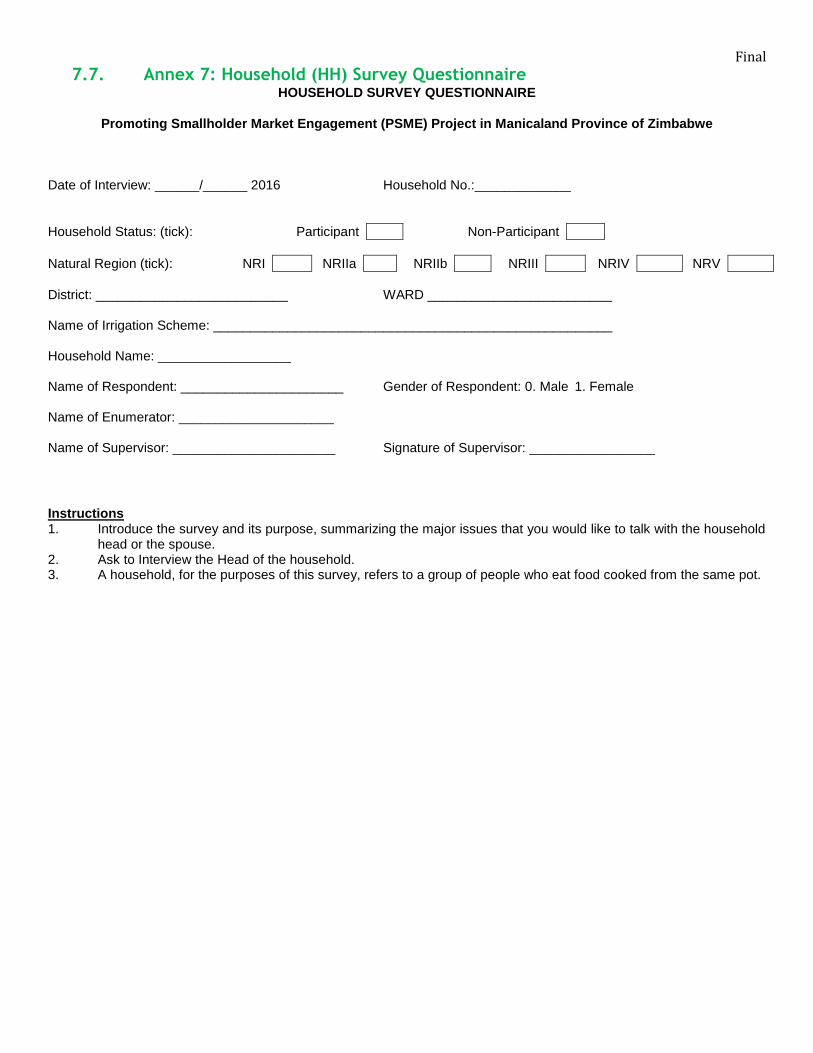
Final
7.7. Annex 7: Household (HH) Survey Questionnaire HOUSEHOLD SURVEY QUESTIONNAIRE
Promoting Smallholder Market Engagement (PSME) Project in Manicaland Province of Zimbabwe
Date of Interview: ______/______ 2016 Household No.:_____________
Household Status: (tick): Participant Non-Participant
Natural Region (tick): NRI NRIIa NRIIb NRIII NRIV NRV
District: __________________________ WARD _________________________ Name of Irrigation Scheme: ______________________________________________________ Household Name: __________________ Name of Respondent: ______________________ Gender of Respondent: 0. Male 1. Female Name of Enumerator: _____________________ Name of Supervisor: ______________________ Signature of Supervisor: _________________
Instructions 1. Introduce the survey and its purpose, summarizing the major issues that you would like to talk with the household
head or the spouse. 2. Ask to Interview the Head of the household. 3. A household, for the purposes of this survey, refers to a group of people who eat food cooked from the same pot.
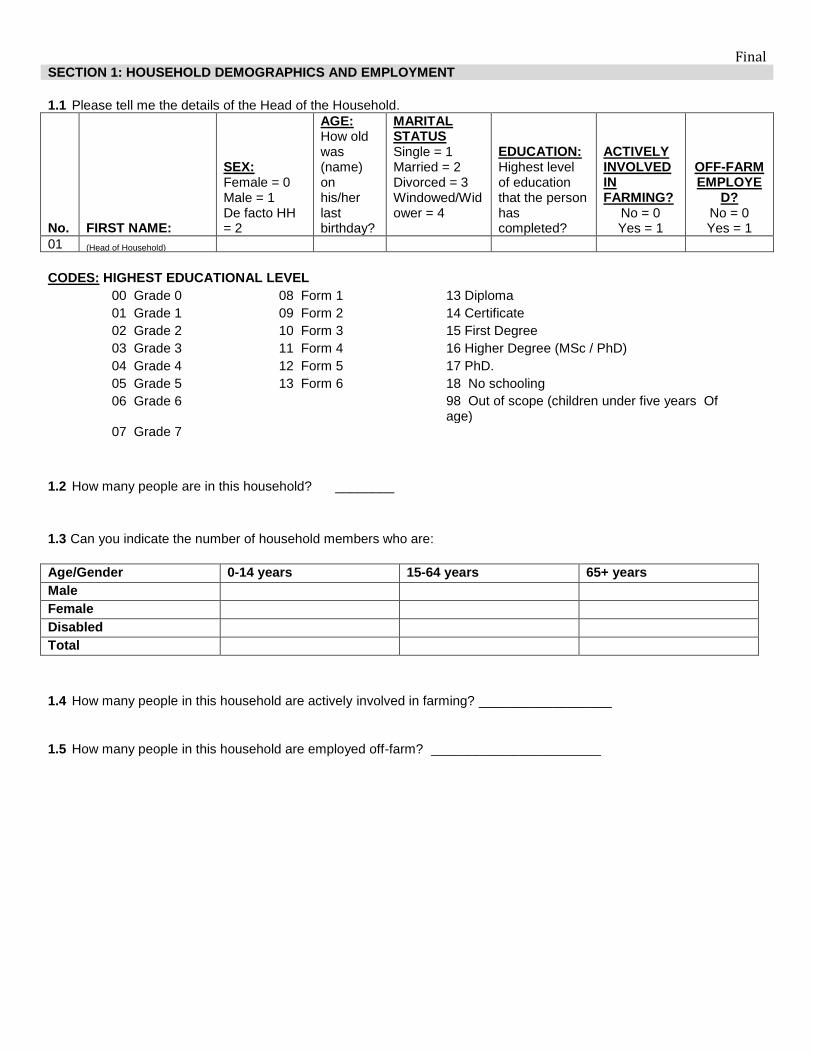
Final
SECTION 1: HOUSEHOLD DEMOGRAPHICS AND EMPLOYMENT
1.1 Please tell me the details of the Head of the Household.
No. FIRST NAME:
SEX: Female = 0 Male = 1 De facto HH = 2
AGE: How old was (name) on his/her last birthday?
MARITAL STATUS Single = 1 Married = 2 Divorced = 3 Windowed/Widower = 4
EDUCATION: Highest level of education that the person has completed?
ACTIVELY INVOLVED IN FARMING?
No = 0 Yes = 1
OFF-FARM EMPLOYE
D? No = 0 Yes = 1
01 (Head of Household)
CODES: HIGHEST EDUCATIONAL LEVEL
00 Grade 0 08 Form 1 13 Diploma
01 Grade 1 09 Form 2 14 Certificate
02 Grade 2 10 Form 3 15 First Degree
03 Grade 3 11 Form 4 16 Higher Degree (MSc / PhD)
04 Grade 4 12 Form 5 17 PhD.
05 Grade 5 13 Form 6 18 No schooling
06 Grade 6 98 Out of scope (children under five years Of age)
07 Grade 7
1.2 How many people are in this household? ________
1.3 Can you indicate the number of household members who are:
Age/Gender 0-14 years 15-64 years 65+ years
Male
Female
Disabled
Total
1.4 How many people in this household are actively involved in farming? __________________
1.5 How many people in this household are employed off-farm? _______________________
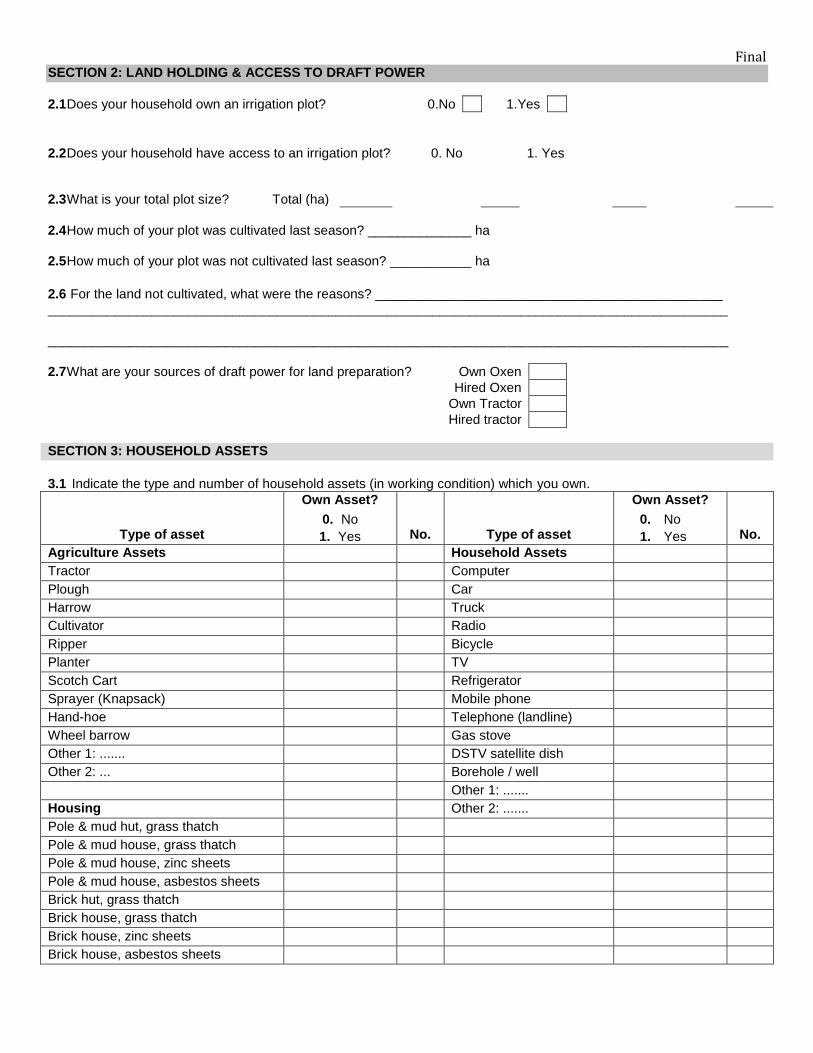
Final
SECTION 2: LAND HOLDING & ACCESS TO DRAFT POWER
2.1 Does your household own an irrigation plot? 0.No 1.Yes
2.2 Does your household have access to an irrigation plot? 0. No 1. Yes
2.3 What is your total plot size? Total (ha)
2.4 How much of your plot was cultivated last season? ______________ ha 2.5 How much of your plot was not cultivated last season? ___________ ha
2.6 For the land not cultivated, what were the reasons? _______________________________________________ ____________________________________________________________________________________________
____________________________________________________________________________________________
2.7 What are your sources of draft power for land preparation? Own Oxen
Hired Oxen
Own Tractor
Hired tractor
SECTION 3: HOUSEHOLD ASSETS
3.1 Indicate the type and number of household assets (in working condition) which you own.
Type of asset
Own Asset?
0. No
1. Yes No. Type of asset
Own Asset?
0. No
1. Yes No.
Agriculture Assets Household Assets
Tractor Computer
Plough Car
Harrow Truck
Cultivator Radio
Ripper Bicycle
Planter TV
Scotch Cart Refrigerator
Sprayer (Knapsack) Mobile phone
Hand-hoe Telephone (landline)
Wheel barrow Gas stove
Other 1: ....... DSTV satellite dish
Other 2: ... Borehole / well
Other 1: .......
Housing Other 2: .......
Pole & mud hut, grass thatch
Pole & mud house, grass thatch
Pole & mud house, zinc sheets
Pole & mud house, asbestos sheets
Brick hut, grass thatch
Brick house, grass thatch
Brick house, zinc sheets
Brick house, asbestos sheets
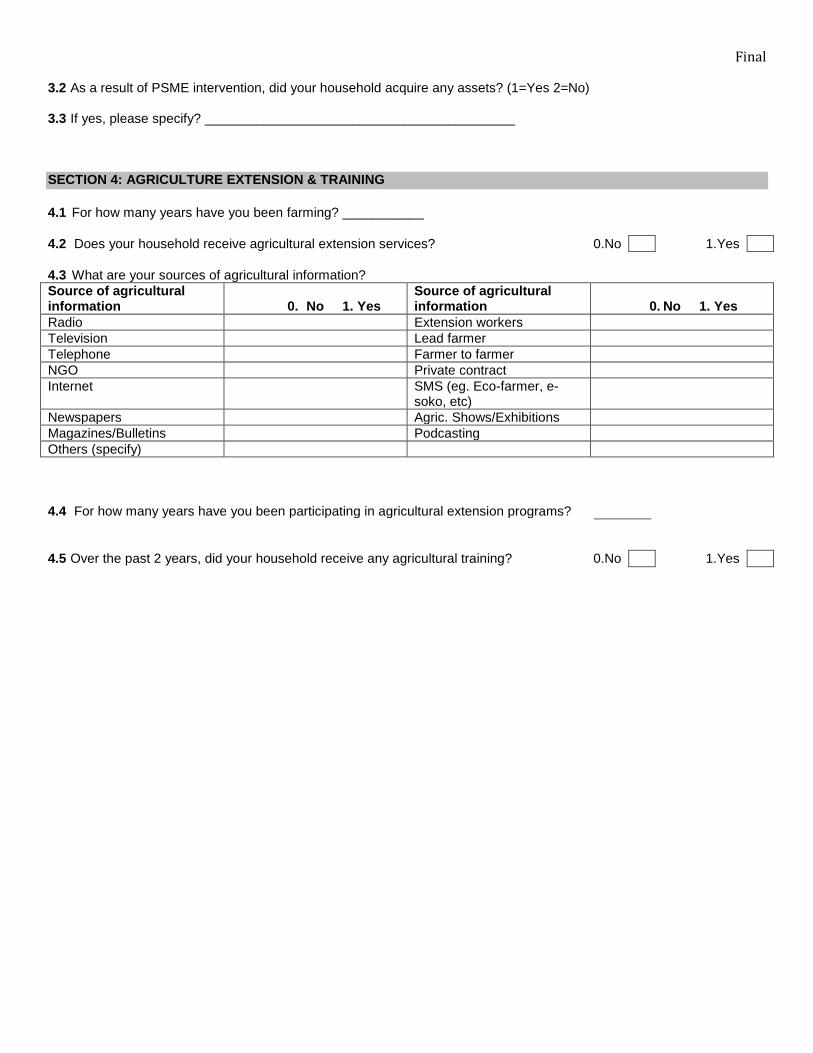
Final
3.2 As a result of PSME intervention, did your household acquire any assets? (1=Yes 2=No) 3.3 If yes, please specify? __________________________________________ SECTION 4: AGRICULTURE EXTENSION & TRAINING
4.1 For how many years have you been farming? ___________
4.2 Does your household receive agricultural extension services? 0.No 1.Yes
4.3 What are your sources of agricultural information?
Source of agricultural information 0. No 1. Yes
Source of agricultural information 0. No 1. Yes
Radio Extension workers
Television Lead farmer
Telephone Farmer to farmer
NGO Private contract
Internet SMS (eg. Eco-farmer, e-soko, etc)
Newspapers Agric. Shows/Exhibitions
Magazines/Bulletins Podcasting
Others (specify)
4.4 For how many years have you been participating in agricultural extension programs?
4.5 Over the past 2 years, did your household receive any agricultural training? 0.No 1.Yes

Final
SECTION 5: CROP PRODUCTION Over the last cropping season, what was the area under crops? What was your total production for each crop? What quantities did you sell? How much money did you make from the sale of each crop? What were your costs of production? For each type of cost, indicate the quantities and the total costs incurred.
PRODUCTION SALES COSTS
CROP
Are
a C
ult
ivate
d
(HA
)*
Ap
plied
Man
ure
?
Yes /
No
Seed
typ
e u
sed
OP
V / H
yb
rid
To
tal P
rod
ucti
on
realized
(K
G)
Qu
an
tity
So
ld
(KG
)
Inco
me f
rom
sale
s (
US
D)
Land Prep. (USD)
Seed Fertilizer (KG) Hired labour Chemicals
Ele
ctr
icit
y**
Irri
gati
on
Wate
r***
Marketing
(packaging &
Transport
VEGETABLES KG USD Bags USD No. USD KG /
L USD US
D USD
USD
Butternut
Cabbage
Onion
Pumpkin
Spinach / rape /
Covo
Tomato
FIELD CROPS
Bambara
Beans (dry)
Cow peas
Groundnuts
Maize grain
Maize green
meals
Wheat
Potato (Irish )
Potato (Sweet )
Sorghum grain
Millet
Rapoko
Soyabeans
Sunflower
Fruits (specify)
Final
* Note: Area cultivated per crop is cumulative for the year. E.g. 2 ha of beetroot three times a year gives a total of 6 ha cultivated per year. ** Give prevailing price per unit of electricity here: USD ___________________ *** Give prevailing price per cubic meter of water: USD ________________
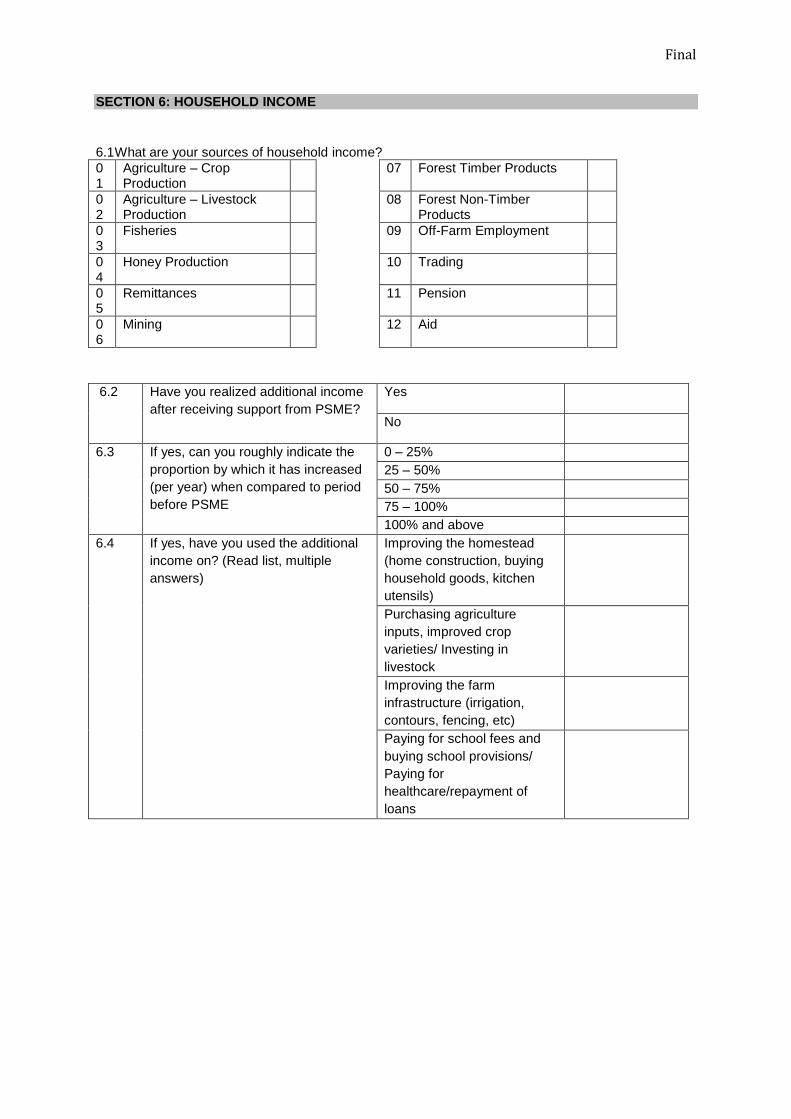
Final
SECTION 6: HOUSEHOLD INCOME
6.1 What are your sources of household income?
01
Agriculture – Crop Production
07 Forest Timber Products
02
Agriculture – Livestock Production
08 Forest Non-Timber Products
03
Fisheries 09 Off-Farm Employment
04
Honey Production 10 Trading
05
Remittances 11 Pension
06
Mining 12 Aid
6.2 Have you realized additional income
after receiving support from PSME?
Yes
No
6.3 If yes, can you roughly indicate the
proportion by which it has increased
(per year) when compared to period
before PSME
0 – 25%
25 – 50%
50 – 75%
75 – 100%
100% and above
6.4 If yes, have you used the additional
income on? (Read list, multiple
answers)
Improving the homestead
(home construction, buying
household goods, kitchen
utensils)
Purchasing agriculture
inputs, improved crop
varieties/ Investing in
livestock
Improving the farm
infrastructure (irrigation,
contours, fencing, etc)
Paying for school fees and
buying school provisions/
Paying for
healthcare/repayment of
loans

Final
SECTION 7: HOUSEHOLD EMPLOYMENT
7.1 Before the PSME support, how many people did you employ for your farming operations during
peak labour demands?
Activity Household members Permanent Workers Part-time/Seasonal
Workers
Agriculture production
7.2 How many people do you currently employ for your farming operations during peak labour
demands?
Activity Household members Permanent Workers Part-time/Seasonal
Workers
Agriculture production
SECTION 8: ADOPTION OF AGRICULTURE PRACTICES 8.1 Are you a member of a farmers’ credit group? 0. No 1. Yes 8.2 Over the past 12 months, did you use / access loans for crop production? 0. No 1. Yes 8.3 Does your household belong to a VSLG? 0. No 1. Yes 8.4 If yes, did your household access loans from a VSLG since receiving PSME support? 0. No 1. Yes 8.5 Has your household accessed loans from Zambuko Trust or any other micro finance institutions since receiving PSME support? 0. No 1. Yes 8.6 Is there an irrigation marketing committee in this scheme? 0. No 1. Yes 8.7 Have been involved in bulk marketing over the past 3 years? 0. No 1. Yes 8.8 Do you have markets for your crops? 0. No 1. Yes 8.9 If yes to 7.5, do you participate in improved agriculture market channels? 0. No 1.
Yes
8.10 Are you a member of a farmers’ inputs procurement group? 0. No 1. Yes 8.11 Was the support provided by PSME support easily accessible? 0. No 1. Yes 8.12 If no, why?__________________________________________________________________
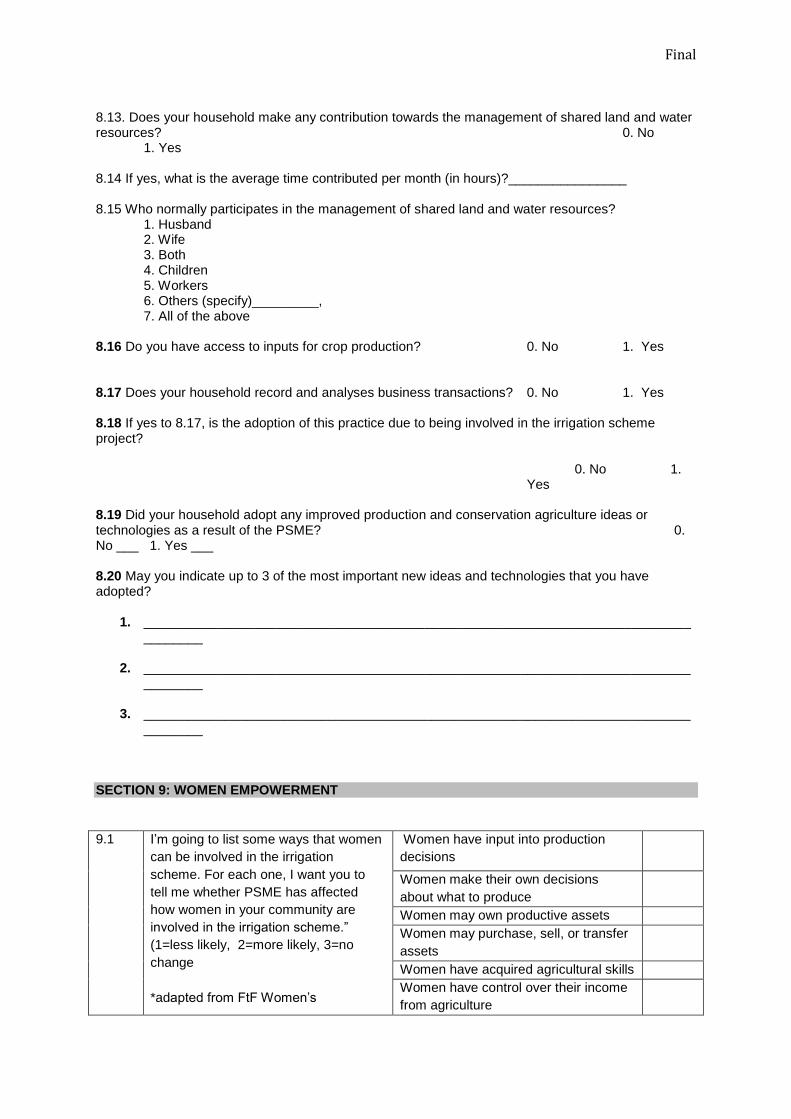
Final
8.13. Does your household make any contribution towards the management of shared land and water resources? 0. No 1. Yes 8.14 If yes, what is the average time contributed per month (in hours)?________________ 8.15 Who normally participates in the management of shared land and water resources?
1. Husband 2. Wife 3. Both 4. Children 5. Workers 6. Others (specify)_________, 7. All of the above
8.16 Do you have access to inputs for crop production? 0. No 1. Yes 8.17 Does your household record and analyses business transactions? 0. No 1. Yes 8.18 If yes to 8.17, is the adoption of this practice due to being involved in the irrigation scheme project?
0. No 1. Yes
8.19 Did your household adopt any improved production and conservation agriculture ideas or technologies as a result of the PSME? 0. No ___ 1. Yes ___ 8.20 May you indicate up to 3 of the most important new ideas and technologies that you have adopted?
1. __________________________________________________________________________________
2. __________________________________________________________________________________
3. __________________________________________________________________________________
SECTION 9: WOMEN EMPOWERMENT
9.1 I’m going to list some ways that women
can be involved in the irrigation
scheme. For each one, I want you to
tell me whether PSME has affected
how women in your community are
involved in the irrigation scheme.”
(1=less likely, 2=more likely, 3=no
change
*adapted from FtF Women’s
Women have input into production
decisions
Women make their own decisions
about what to produce
Women may own productive assets
Women may purchase, sell, or transfer
assets
Women have acquired agricultural skills
Women have control over their income
from agriculture

Final
Empowerment Index
Women have control over their
workload
Women have control over their leisure
activities
Women can apply for loans in their own
name
Women can be members of
farmer/community groups
Women can speak in public forums and
contribute to public debates
9.2 Has the PSME project affected
relations between men and women in
your community?
Yes, positive
Yes, negative
No
Don’t know
9.3 If yes, positive, how?
9.4 If yes, negative, How?
9.5 If no, how?
SECTION 10: PROJECT IMPACT
10.1 Has the project brought about any negative
impact to your household and/or
community?
Yes
No
Don’t know
10.2 If yes, what are these negative impacts to
household or community (specify)?
10.3 Are you satisfied with the support you
received from PSME?
1 =Not at all satisfied 2 =slightly satisfied 3 =moderately satisfied 4 =Very satisfied 5 =Extremely satisfied
10.4 If not satisfied, please give reasons.
10.5 In your opinion how would you rate the impact of the irrigation project in relation to the following:
Impact on: Very low Low Null High Very high
Access to loans?
Access to inputs?
Access to improved markets?
Crop productivity?
Household income?
Food Security & Nutrition?
Collective marketing?
Management of shared resources

Final
and infrastructure
Capacity of irrigation
management committees
Diversification of livelihoods?
Capacity building?
Access to extension?
SECTION 11: PERPERTUITY OF BENEFITS
11.1 Since receiving PSME support, has your access to inputs markets improved for your farming activities:
1 =much worse 2 =somewhat worse 3 =about the same 4 =somewhat better 5 =much better
11.2 Would you be able to purchase the technologies introduced to you by PSME program on your own on the market without PSME support
1 =Extremely unlikely 2 =unlikely 3 =Neutral 4 =likely 5 =Extremely likely
11.3 Since receiving PSME support, has your access to produce markets improved for your:
1 = much worse 2 =somewhat worse 3 =about the same 4 =somewhat better 5 =much better
11.5 Have you developed linkages with agro-dealers or input suppliers as a result of PSME?
Yes
No

Final
11.6 Do you think they will help you maintain new farming activities in the future?”
1 =Extremely unlikely 2 =unlikely 3 =Neutral 4 =likely 5 =Extremely likely
THANK YOU FOR TAKING TIME TO ANSWER OUR QUESTIONS

Final
7.8. Annex 8: Most Significant Change (MSC) Case Study Tool
PSME END OF TERM EVALUATION
Most Significant Change
Story Collection Guide
As part of the end of term evaluation of the Promoting Smallholder Market Engagement (PSME)
project, we are collecting stories about how the project has contributed to significant changes at an
individual, community and district level. 'Promoting Smallholder Market Engagement (PSME)' is a
three year project (April 2013 to March 2016) which seeks to build strong market relationships with
key stakeholders in strengthening the livelihoods of 7,490 smallholder farmers (5,250 women), in 11
Irrigation Schemes across Manicaland (six from Nyanga, four from Chimanimani, one each from
Mutasa and Mutare). Project implementing partners are Practical Action, Farm Community Trust of
Zimbabwe and Zambuko Trust. The project is funded by the Big Lottery Fund, UK. We’re also
interested to understand your views on the barriers to change in the context of the project. These
stories and insights will be reviewed by the PSME evaluation team and the stories deemed to
represent the most significant change will be selected and included in the final project evaluation
report, together with insights into the barriers to change encountered.
Below is a template to use to help you write your story. Stories should be around a page in length and
written using a personal tone. The template is based on a three part narrative structure used to
describe the situation before the change; what then happened; and the situation after the change
occurred. We’d also like to hear about challenges or barriers to change that you may have
encountered, and have included a final section for these comments to be recorded.
Story Title: _________________________________________________________
Storyteller: _________________________________________________________
Contact details: _____________________________________________________
Enumerator:________________________________________________________
Are you happy for your story to be shared at the community evaluation session with your
name included? Yes/No
If selected by the evaluation team, would you be happy for your story to be published in the
evaluation report? Yes/No
Background: Briefly describe your involvement with the PSME project:
___________________________________________________________________________
Thinking about your involvement in the project, what changes have occurred as a result of the
project’s activities? Please briefly list all the changes you know about.
Final
___________________________________________________________________________
Thinking about these changes, what do you think is the most significant change that has
occurred as a result of the project?
Please describe your experience in the form of a story using the template below:
Beginning (situation before the change)
___________________________________________________________________________
Middle (what happened?)
___________________________________________________________________________
End (situation after the change)
___________________________________________________________________________
In your opinion, why is this the most significant change?
___________________________________________________________________________
To finish up, we’d like to ask you two questions about the challenges associated with the
project:
Firstly, what, if any, negative changes occurred as a result of the project? Please describe.
___________________________________________________________________________
What if any, were the barriers to change occurring as a result of the project? Please describe.
___________________________________________________________________________
Thank you for sharing your story and other feedback about your involvement with the PSME project

Final