Embed Size (px)
Citation preview
Promoting Financial Inclusion through Mobile and How Policymakers can Help28 April 2016
Dominic P ArenaGroup Chief Strategy & Marketing Officer
company confidential

Internet of Things 2company confidential
AGENDA
company confidential
A Overview of Axiata Group
B Mobile Financial Services Driving Financial Inclusion in Asia

3company confidential

4company confidential
PAKISTAN (2005)12,000 km fiber
CAMBODIA (1998)7.6m subsFirst to launch 4G LTESmart-Hello merger (2012)
MALAYSIA (1998*)12.3m subsLeading mobile broadband provider
BANGLADESH (1995)28.3m subsPending acquisition / merger with Airtel
INDIA (2008)181.9m subs*Integrated pan-India operator 2G/3G
NEPAL(2016)13mil subsLeading mobile provider
~2,100 towers
SRI LANKA (1995)10.9m subs First to launch 3G in S.AsiaDialog-Suntel merger (2011)Dialog TV- SkyTV merger (2013)
SINGAPORE (2005)1.9m subs**First to offer 4G LTE in ASEAN
INDONESIA (2005)42m subs
XL-Axis merger (2012)
MYANMARAcquisition via edotco Group completed 4th Dec 2015 (75% stake)~1250 towers
Axiata is the second largest telecom operator in South Asia & ASEAN, with over 290 million customers & 25,000 staff in 10 countries
1st 2nd
3rd
1st
2nd
2nd
3rd
2nd
edotco Group (2012) Managing over 16,000 towers in 6 countries; World’s 12th largest independent TowerCo
12th
GloballyAxiata Digital Services (2014) Portfolio of 28 Digital businesses21M customers; $200M in investment

5company confidential
PEER GROUP (ASEAN & South Asia) – TOP 10 CUSTOMER REACH/BASE [Mn. Sims]
31.12.2015
82.6
99.0
110.0
154.9
171.9
193.6
194.0
255.5
274.0
507.8
MAXIS (incl. Aircel)
IDEA
TELKOMSEL
BHARTI AIRTEL
BSNL
RELIANCE
VODAFONE
TELENOR
SINGTEL
AXIATA
Regional Players Single Market Player
Source: Axiata Group Strategy, Informa WCIS Note: Vimpelcom 2010 incl. pro forma PMCL which was only consumated during H1-2011, Vodafone adjusted for India operations only
ASIA PACIFIC, excl. holdings below 19,9%
#7 #2+234 Mn Subs
24.1
30.0
36.8
39.8
39.9
41.0
47.9
53.3
55.2
164.5
TELKOMSEL
TELENOR
RELIANCE
BHARTI AIRTEL
VODAFONE
SINGTEL
AXIATA
PLDT
BSNL
AIS
31.12.2007
among regional & major single market players
Notes : ‒ Regional market is defined as ASEAN and South Asia
Over the past 8 years we have grown from #7 to a #2 Regional Champion, measured by Customers against our regional peers
7th
2nd
6company confidential
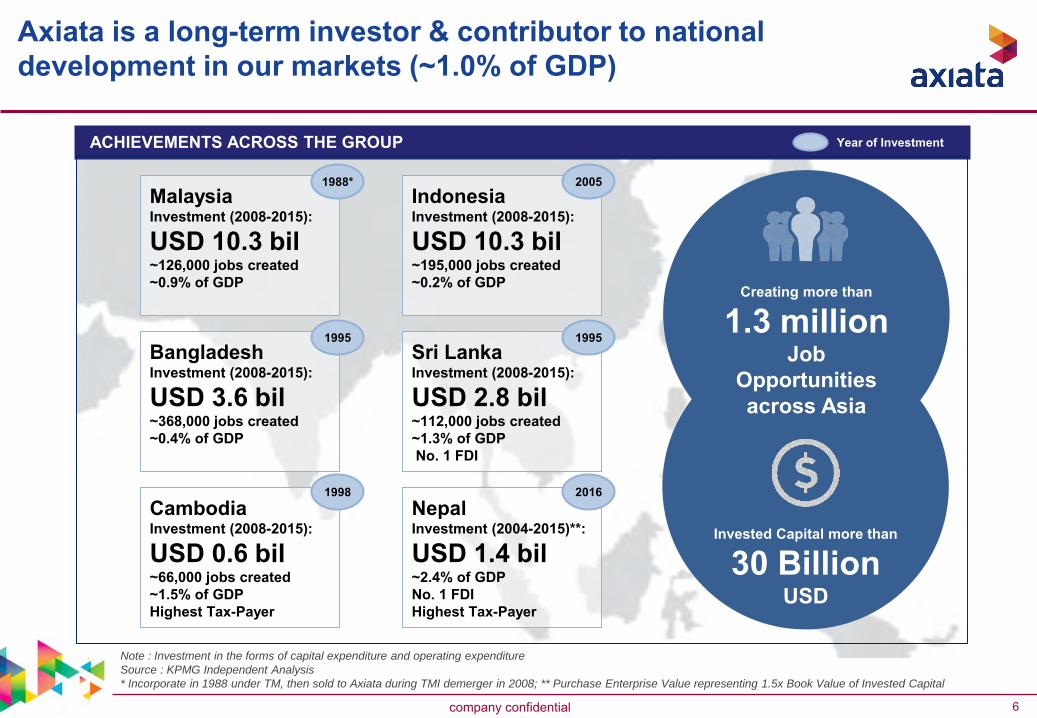
Invested Capital more than
30 BillionUSD
ACHIEVEMENTS ACROSS THE GROUP
Creating more than
1.3 million Job
Opportunities across Asia
BangladeshInvestment (2008-2015):
USD 3.6 bil~368,000 jobs created~0.4% of GDP
Sri Lanka Investment (2008-2015):
USD 2.8 bil~112,000 jobs created~1.3% of GDPNo. 1 FDI
CambodiaInvestment (2008-2015):
USD 0.6 bil~66,000 jobs created~1.5% of GDPHighest Tax-Payer
MalaysiaInvestment (2008-2015):
USD 10.3 bil~126,000 jobs created~0.9% of GDP
IndonesiaInvestment (2008-2015):
USD 10.3 bil~195,000 jobs created~0.2% of GDP
1995 1995
1998
1988* 2005
Year of Investment
Note : Investment in the forms of capital expenditure and operating expenditure
Source : KPMG Independent Analysis
* Incorporate in 1988 under TM, then sold to Axiata during TMI demerger in 2008; ** Purchase Enterprise Value representing 1.5x Book Value of Invested Capital
Axiata is a long-term investor & contributor to national development in our markets (~1.0% of GDP)
NepalInvestment (2004-2015)**:
USD 1.4 bil~2.4% of GDPNo. 1 FDIHighest Tax-Payer
2016

Internet of Things 7company confidential
AGENDA
company confidential
A Overview of Axiata Group
B Mobile Financial Services Driving Financial Inclusion in Asia

Internet of Things 8company confidential
The opportunity for Financial Inclusion and Commercial Participation in Mobile Financial Services (MFS) is highly attractive
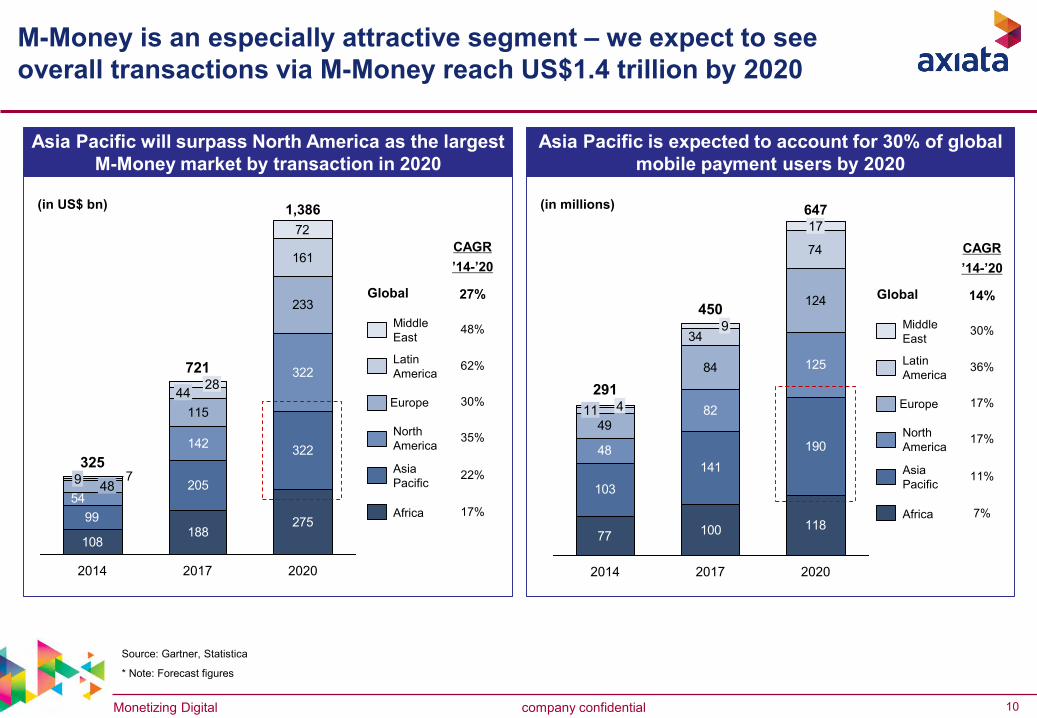
Attractive market opportunity for MFS in the Asia Pacific region – M-Money transactions forecasted to reach US$320bn with over 190mn users by 2020.1
With current formal banking penetration in Asia Pacific still below 25%, mobile operators and smartphones are the logical access provider / tool for M-Money:-a) Basic M-Money services are already accessible by all mobile subscribers – 2.5bn potential
users in Asia Pacific alone – basic M-Money does not need a Smartphoneb) Smartphone penetration already at 45% and is expected to hit 100% by 2020
2
A key opportunity in M-Money is international P2P transfer – market opportunity for remittance in Asia Pacific alone exceeds US$16bn annually with a CAGR of 6.8%.3
Another important opportunity in MFS is mPOS – penetration of POS terminals in Asia Pacific is half of global average; mPOS forecasted to have an annual growth rate of 50% until 2020.4
Barrier to Financial & Formal Economy via MFS (FinTech) is policy & regulations to ensure fair play between bank & non-bank providers.5
Monetizing Digital 9company confidential
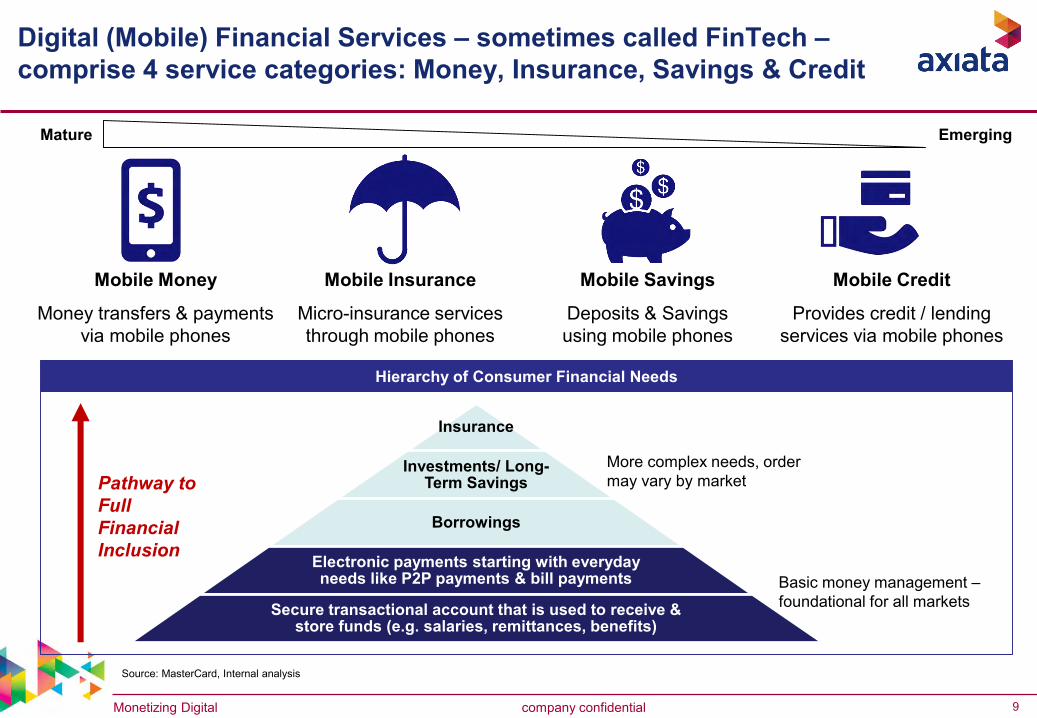
Digital (Mobile) Financial Services – sometimes called FinTech –comprise 4 service categories: Money, Insurance, Savings & Credit
Source: MasterCard, Internal analysis
Mobile Money
Money transfers & payments via mobile phones
Mobile Insurance
Micro-insurance services through mobile phones
Mobile Savings
Deposits & Savings using mobile phones
Mobile Credit
Provides credit / lending services via mobile phones
Hierarchy of Consumer Financial Needs
Pathway to Full Financial Inclusion
Insurance
Investments/ Long-Term Savings
Borrowings
Electronic payments starting with everyday needs like P2P payments & bill payments
Secure transactional account that is used to receive & store funds (e.g. salaries, remittances, benefits)
More complex needs, order may vary by market
Basic money management –foundational for all markets
Mature Emerging
Monetizing Digital 10company confidential
Asia Pacific is expected to account for 30% of global mobile payment users by 2020
(in millions)
M-Money is an especially attractive segment – we expect to see overall transactions via M-Money reach US$1.4 trillion by 2020
Asia Pacific will surpass North America as the largest M-Money market by transaction in 2020
Source: Gartner, Statistica
* Note: Forecast figures
(in US$ bn)
108188
27599
205
322142
322
115
233
72
54
161
79
2017
72128
1,386
44
2014
32548
2020
Middle East
Latin America
Europe
North America
Asia Pacific
Africa
CAGR’14-’20
Global
48%
62%
30%
35%
22%
17%
27%
77 100 118
103
14119048
82
125
49
84
124
74
34
11 4
17
2017
450
647
2020
9
2014
291
Middle East
Latin America
Europe
North America
Asia Pacific
Africa
CAGR’14-’20
Global
30%
36%
17%
17%
11%
7%
14%
Monetizing Digital 11company confidential
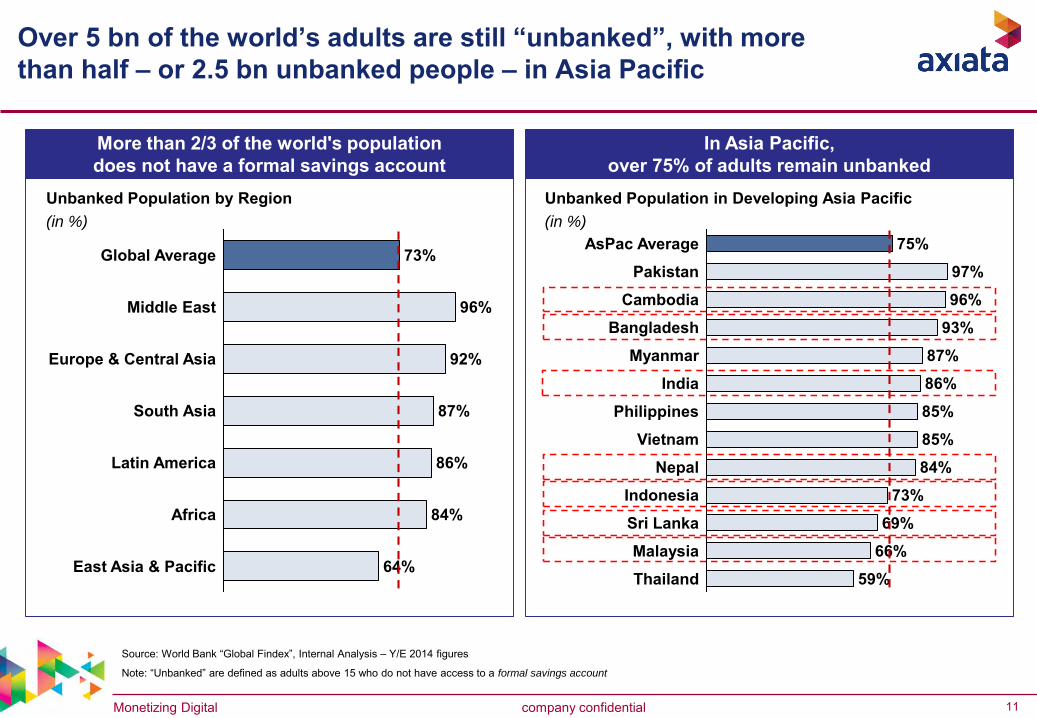
Over 5 bn of the world’s adults are still “unbanked”, with more than half – or 2.5 bn unbanked people – in Asia Pacific
In Asia Pacific, over 75% of adults remain unbanked
More than 2/3 of the world's population does not have a formal savings account
Unbanked Population in Developing Asia Pacific(in %)
Unbanked Population by Region(in %)
Source: World Bank “Global Findex”, Internal Analysis – Y/E 2014 figures
Note: “Unbanked” are defined as adults above 15 who do not have access to a formal savings account
Vietnam
86%
Philippines 85%
85%
66%
Nepal
69%
59%
Myanmar 87%
Cambodia 96%
Pakistan 97%
75%AsPac Average
India
84%
73%
Sri Lanka
93%
Indonesia
Bangladesh
Malaysia
Thailand
86%
South Asia
Latin America
East Asia & Pacific
Middle East
73%
92%
96%
87%
Global Average
64%
84%
Europe & Central Asia
Africa

Monetizing Digital 12company confidential
Today 100% of mobile customers could use basic M-Money services as seen by M-Pesa – in Asia this represents 2.5bn people
Mobile Penetration % in Asia Pacific – FY2015(measured by no. of unique subs vs population size)
AsPac Average
79%Cambodia
78%Vietnam
62%
78%
69%Indonesia 66%
Thailand
Sri Lanka
74%
72%Philippines
Malaysia
Bangladesh 55%
Nepal 53%
India 47%
Pakistan 44%
Myanmar 38%
935mn potential users in our footprint alone Over 62% of Asia Pacific are potential MFS users
Source: GSMA
Unique Subscribers in Asia Pacific – FY2015(in mns)
12
14
15
24
89
150
200
2,488
Malaysia
Cambodia
Bangladesh
Sri Lanka
Nepal
Indonesia
Total AsPac
India 611
171
M-Money does not require a Smartphone, so everyone can be included!

Monetizing Digital 13company confidential
…so with digital P2P cash in / out, we can turn every mobile phone user into an “ATM” or Financial Services Agent and benefit all citizens
Estimates based on internal analysis

Monetizing Digital 14company confidential
For richer MFS services, Smartphones are already the logical primary financial access tool; by 2020 Smartphone penetration will reach 100%
Penetration: Banked % vs Credit Card % vs Smartphone %
Source: World Bank, Mimosa, GSMA, Asia Foundation, Internal Analysis
Note: “Unbanked” are defined as adults above 15 who do not have access to a formal savings account
Banked%
31%
Smartphone%
38%
CreditCard %
3%
Sri Lanka
34%89%
17%
Malaysia
68%41%4%
Thailand
18%14%
3%
India
1%
53%
27%
Indonesia
25%
16%0%
Nepal
1%
42%15%
Vietnam
2%
46%
15%
Philippines
0%
18%7%
Bangladesh
0%
46%
13%
Myanmar
4%2%
49%
Cambodia
0% 3%
10%
Pakistan
Banked%
Smartphone%
CreditCard %
Banked%
Smartphone%
CreditCard %
Banked%
Smartphone%
CreditCard %
Banked%
Smartphone%
CreditCard %
Banked%
Smartphone%
CreditCard %
Banked%
Smartphone%
CreditCard %
Banked%
Smartphone%
CreditCard %
Banked%
Smartphone%
CreditCard %
Banked%
Smartphone%
CreditCard %
Banked%
Smartphone%
CreditCard %
Banked%
Smartphone%
CreditCard %

Monetizing Digital 15company confidential
In Asia Pacific alone, developing countries (ex-China) already account for over 30% of global remittances
Global remittances growing at a CAGR of 4.8%, while Asia Pacific is outgrowing the world at 6.8%
P2P Remittances by Receiving Country – FY2015(in US$ bn)
Global P2P Remittances by Region – FY2015(in US$ bn)
Source: World Bank, Internal Analysis
0.4
1.6
3.5
5.2
7.0
7.0
9.6
13.2
15.4
19.3
28.5
Cambodia
Malaysia
Myanmar
Bangladesh
Pakistan
Thailand
Sri Lanka
Phillippines
India 68.9
Nepal
Indonesia
Vietnam
% of GDP
3.4%
10.0%
7.9%
8.9%
7.1%
1.1%
35.4%
8.9%
1.3%
5.4%
0.5%
2.4%
A key opportunity within M-Money is international P2P transfers –global remittances have surpassed $580bn with a CAGR of 4.8%
176
69
5631
12967
86
35
245
2015
582
2010
150461
Developed Countries
Developing – Europe & Central Asia
Developing –Latin America
Developing –Middle East & Africa
Developing –Asia Pacific
CAGR(’10-’15)
Global
3.1%
2.0%
3.7%
4.5%
6.8%
4.8%
Monetizing Digital 16company confidential
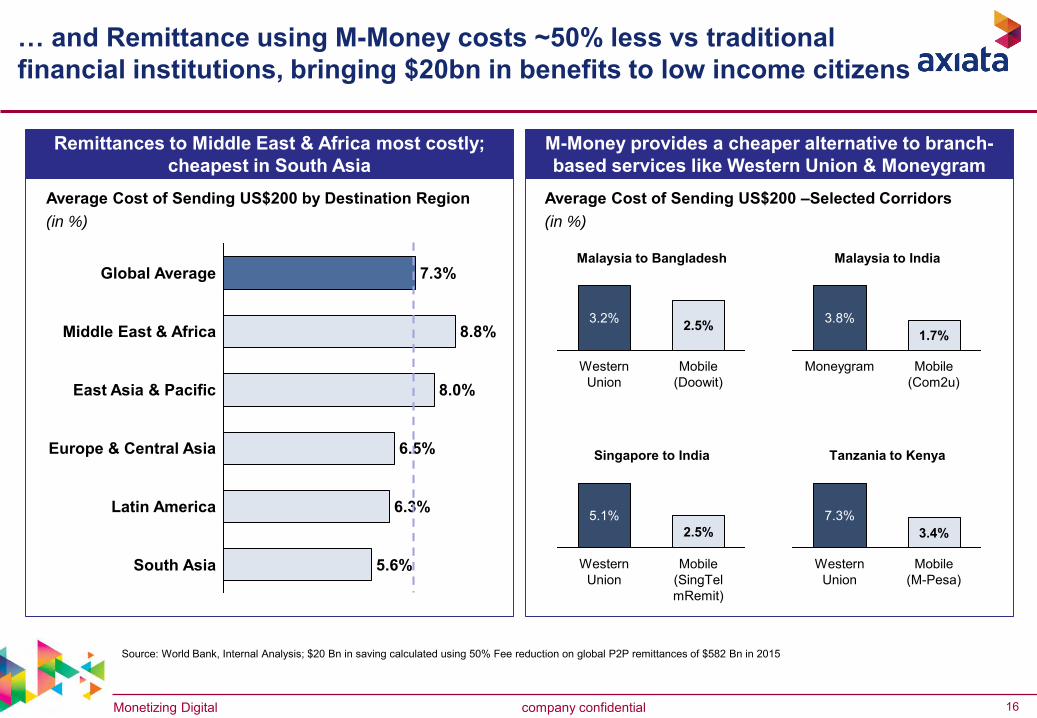
M-Money provides a cheaper alternative to branch-based services like Western Union & Moneygram
Remittances to Middle East & Africa most costly; cheapest in South Asia
Average Cost of Sending US$200 –Selected Corridors(in %)
Average Cost of Sending US$200 by Destination Region(in %)
5.6%
8.0%
Middle East & Africa 8.8%
Global Average 7.3%
South Asia
Latin America 6.3%
Europe & Central Asia 6.5%
East Asia & Pacific
… and Remittance using M-Money costs ~50% less vs traditional financial institutions, bringing $20bn in benefits to low income citizens
Source: World Bank, Internal Analysis; $20 Bn in saving calculated using 50% Fee reduction on global P2P remittances of $582 Bn in 2015
3.2%
Mobile(Doowit)
2.5%
WesternUnion
Malaysia to Bangladesh
3.8%1.7%
Moneygram Mobile(Com2u)
Malaysia to India
WesternUnion
5.1%
Mobile(SingTel mRemit)
2.5%
Singapore to India
3.4%
Mobile(M-Pesa)
WesternUnion
7.3%
Tanzania to Kenya
17Strictly Confidential
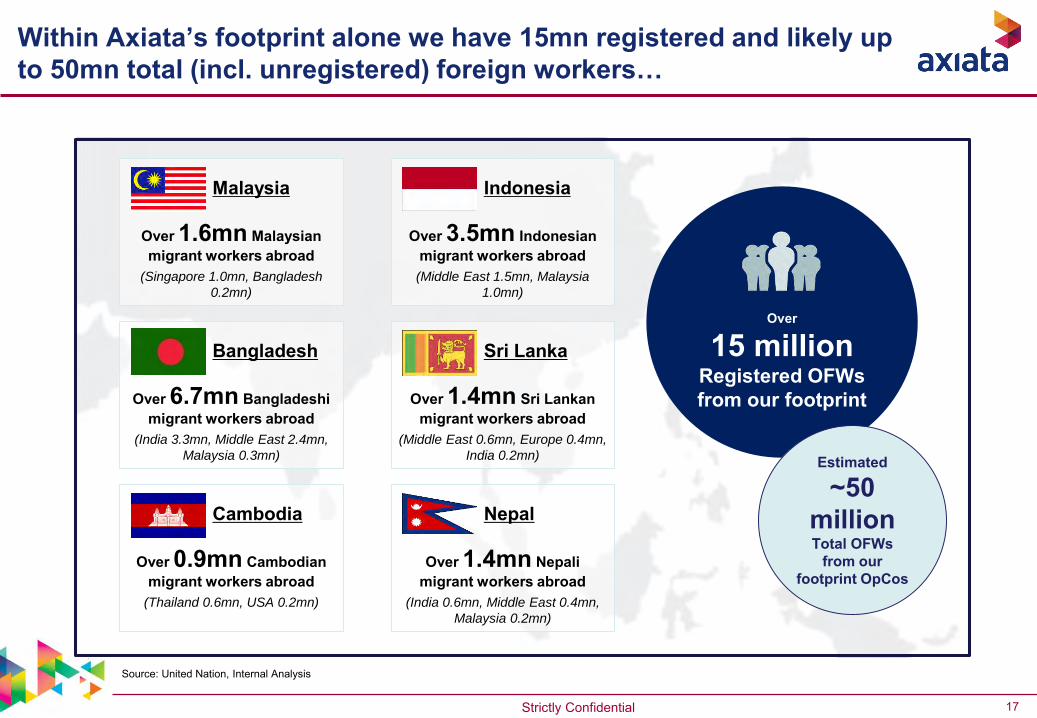
Within Axiata’s footprint alone we have 15mn registered and likely up to 50mn total (incl. unregistered) foreign workers…
Over
15 million Registered OFWs from our footprint
Bangladesh
Over 6.7mn Bangladeshi migrant workers abroad
(India 3.3mn, Middle East 2.4mn,
Malaysia 0.3mn)
Sri Lanka
Over 1.4mn Sri Lankan migrant workers abroad
(Middle East 0.6mn, Europe 0.4mn,
India 0.2mn)
Source: United Nation, Internal Analysis
Cambodia
Over 0.9mn Cambodian migrant workers abroad
(Thailand 0.6mn, USA 0.2mn)
Nepal
Over 1.4mn Nepali migrant workers abroad
(India 0.6mn, Middle East 0.4mn,
Malaysia 0.2mn)
Indonesia
Over 3.5mn Indonesian migrant workers abroad(Middle East 1.5mn, Malaysia
1.0mn)
Malaysia
Over 1.6mn Malaysian migrant workers abroad
(Singapore 1.0mn, Bangladesh
0.2mn)
Estimated
~50 millionTotal OFWs
from our footprint OpCos
Monetizing Digital 18company confidential
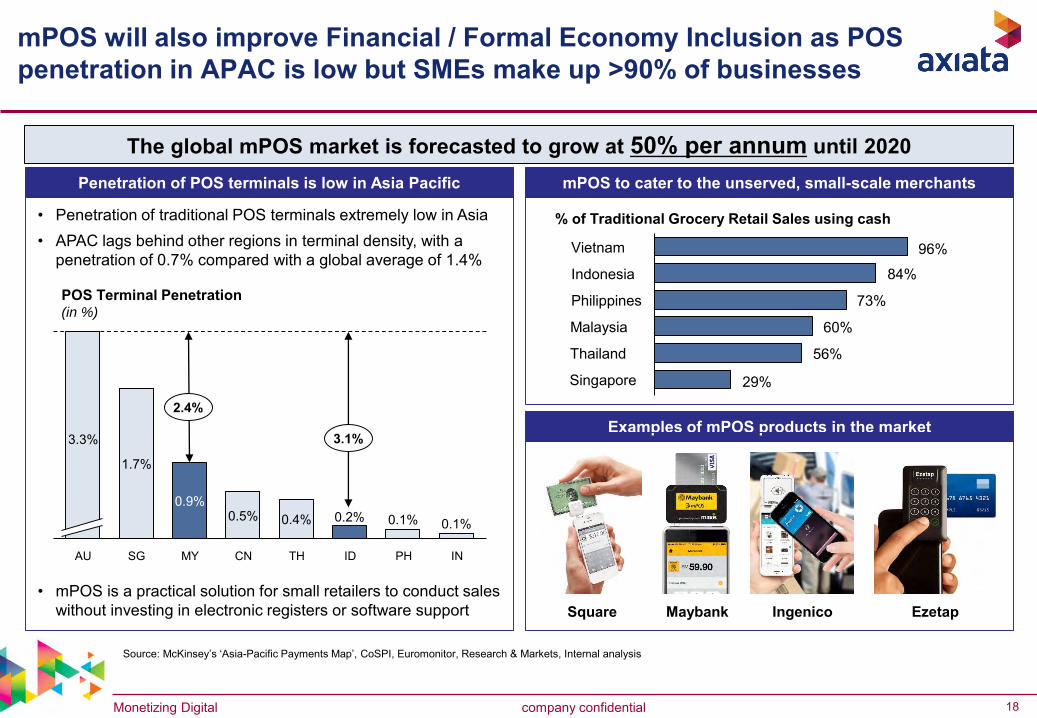
mPOS will also improve Financial / Formal Economy Inclusion as POS penetration in APAC is low but SMEs make up >90% of businesses
mPOS to cater to the unserved, small-scale merchantsPenetration of POS terminals is low in Asia Pacific
• Penetration of traditional POS terminals extremely low in Asia• APAC lags behind other regions in terminal density, with a
penetration of 0.7% compared with a global average of 1.4%
Source: McKinsey’s ‘Asia-Pacific Payments Map’, CoSPI, Euromonitor, Research & Markets, Internal analysis
POS Terminal Penetration(in %)
MYSGAU
3.3%
0.9%
1.7%
CN
0.5%
TH
0.4%
ID PH IN
0.1%0.1%0.2%
% of Traditional Grocery Retail Sales using cash
Philippines
Indonesia
Vietnam 96%
84%
73%
Malaysia 60%
Thailand 56%
Singapore 29%
2.4%
3.1%
The global mPOS market is forecasted to grow at 50% per annum until 2020
• mPOS is a practical solution for small retailers to conduct sales without investing in electronic registers or software support
Examples of mPOS products in the market
Square Maybank Ingenico Ezetap
Monetizing Digital 19company confidential
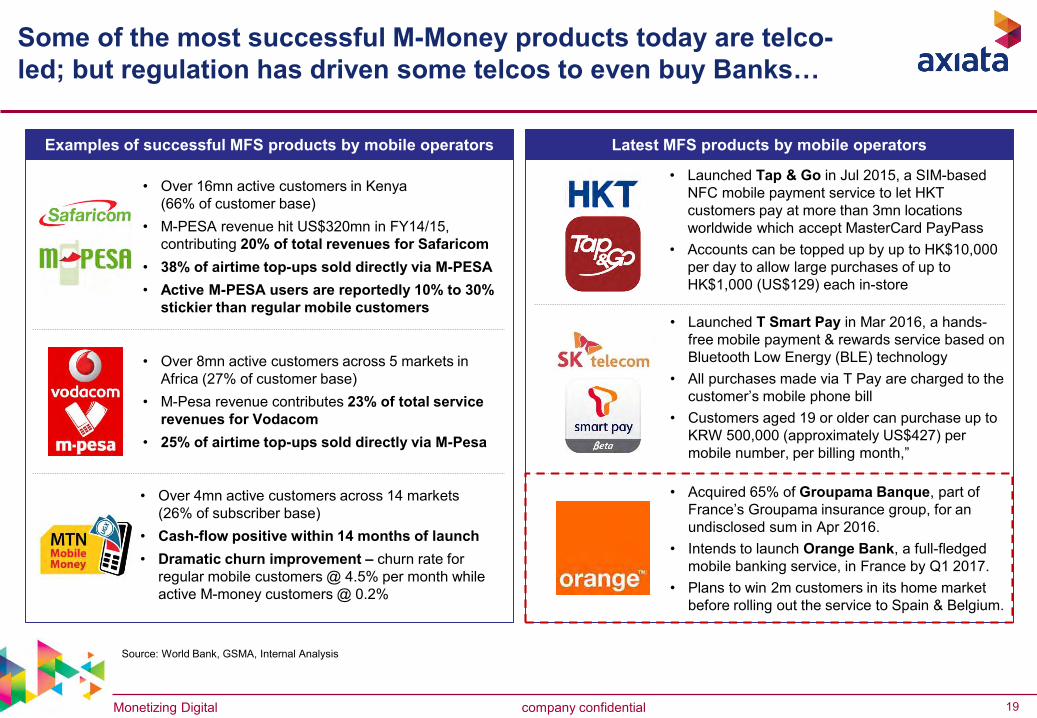
Latest MFS products by mobile operatorsExamples of successful MFS products by mobile operators
Some of the most successful M-Money products today are telco-led; but regulation has driven some telcos to even buy Banks…
Source: World Bank, GSMA, Internal Analysis
• Over 4mn active customers across 14 markets (26% of subscriber base)
• Cash-flow positive within 14 months of launch• Dramatic churn improvement – churn rate for
regular mobile customers @ 4.5% per month while active M-money customers @ 0.2%
• Over 16mn active customers in Kenya (66% of customer base)
• M-PESA revenue hit US$320mn in FY14/15, contributing 20% of total revenues for Safaricom
• 38% of airtime top-ups sold directly via M-PESA• Active M-PESA users are reportedly 10% to 30%
stickier than regular mobile customers
• Over 8mn active customers across 5 markets in Africa (27% of customer base)
• M-Pesa revenue contributes 23% of total service revenues for Vodacom
• 25% of airtime top-ups sold directly via M-Pesa
• Acquired 65% of Groupama Banque, part of France’s Groupama insurance group, for an undisclosed sum in Apr 2016.
• Intends to launch Orange Bank, a full-fledged mobile banking service, in France by Q1 2017.
• Plans to win 2m customers in its home market before rolling out the service to Spain & Belgium.
• Launched T Smart Pay in Mar 2016, a hands-free mobile payment & rewards service based on Bluetooth Low Energy (BLE) technology
• All purchases made via T Pay are charged to the customer’s mobile phone bill
• Customers aged 19 or older can purchase up to KRW 500,000 (approximately US$427) per mobile number, per billing month,”
• Launched Tap & Go in Jul 2015, a SIM-based NFC mobile payment service to let HKT customers pay at more than 3mn locations worldwide which accept MasterCard PayPass
• Accounts can be topped up by up to HK$10,000 per day to allow large purchases of up to HK$1,000 (US$129) each in-store

Monetizing Digital 20company confidential
• 6.7mn users
• 8% of subscriber base
• 162.8mn BDT in revenue
• >95,000 agents
• BEST NFC & MOBILE MONEY SERVICE at GSMA Global Mobile Awards 2015
• 2.3mn users
• 21.1% of subscriber base
• 49.2mn SLR in revenue
• 18,600 cash in cash out points
• 1.7mn users
• 3.5% of subscriber base
• 74.9bn IDR in revenue
• 22,000 transaction points
• 181 merchant partners
• 0.4 mn users
• 3.4% of subscriber base
• 2.7mn MYR in revenue
• 4000 online merchants
Sri Lanka Indonesia Bangladesh Malaysia
• >1,500 users
• ~1,000 agents
• Launched in Oct 2015
Cambodia
Note : Figures as of Dec 2015*Doowit – Includes international airtime transfer
• Virtual credit card number
• Launched in Apr 2016
Axiata now offers MFS in 5 markets, with our home-grown, award-winning product “EzCash” being a core underlying platform…
We also partner with BIMA for Mobile Insurance Products for OFWs

Monetizing Digital 21company confidential
However, currently there are still regulatory challenges in several of our markets for telcos to deliver full Mobile Financial Services
Examples of Regulatory Challenges Examples of Positive Regulatory Actions
• Permit non-banks to issue electronic money (or equivalent) • AND impose initial and ongoing capital requirements that are proportional to the risks of the e-money business,• AND permit them to use agents for cash-in and cash-out operations,• AND do not prescribe the implementation of specific interoperability models without allowing for a market-led approach.
GSMA “enabling regulatory environment”:
• Cash out agents need a separate remittance licence• Know-Your-Customers (KYC) requirements not
proportionate: agents in remote areas need to furnish documentation to central office which causes delays
• Banks have advantage of using individuals as agents in 2014 e-money regulation
• 3rd party processors rely on partner bank (bank to set terms)
• 3 years license – risk of renewal or monetisation• KYC / AML due to lack of proper identification
• Only banks allowed to issue e-money; this is being revised but proposed revisions require multi-party ownership of a new class of entity – a potential hurdle
An open and level playing field• Any person may issue e-money, if the appropriate
regulatory & operational requirements are met.• Detailed regulations & guidelines publicly available.• Currently only 18 non-bank e-money issuers & 5
banks have e-money approvals
Enabling use of agents• No restrictions on merchants acting as cash-in/ out
agents, as long as the appropriate due diligence is conducted and operational safeguards adopted.
Active policy making to increase financial inclusion• Introduced a new category of financial services
licenses – payments banks • Enable licencees to offer services similar to basic
banking services• 11 licences granted to players from different sectors
e.g. MNOs, pre-paid instrument issuers & corporates.
Indonesia
Bangladesh
Cambodia
Malaysia
Sri Lanka
India

Monetizing Digital 22company confidential
So far we have touched the bottom of the pyramid; emerging FinTechaddressing Savings & P2P Credit which needs regulatory support…
Source: MasterCard, Internal analysis
Mobile Money
Money transfers & payments via mobile phones
Mobile Insurance
Micro-insurance services through mobile phones
Mobile Savings
Deposits & Savings using mobile phones
Mobile Credit
Provides credit / lending services via mobile phones
Hierarchy of Consumer Financial Needs
Pathway to Full Financial Inclusion
Insurance
Investments/ Long-Term Savings
Credit / Borrowings
Electronic payments starting with everyday needs like P2P payments & bill payments
Secure transactional account that is used to receive & store funds (e.g. salaries, remittances, benefits)
More complex needs, order may vary by market – SMARTPHONES (2016-2020)
Basic money management –foundational for all markets –Feature Phones suffice
Mature Emerging
Monetizing Digital 23company confidential
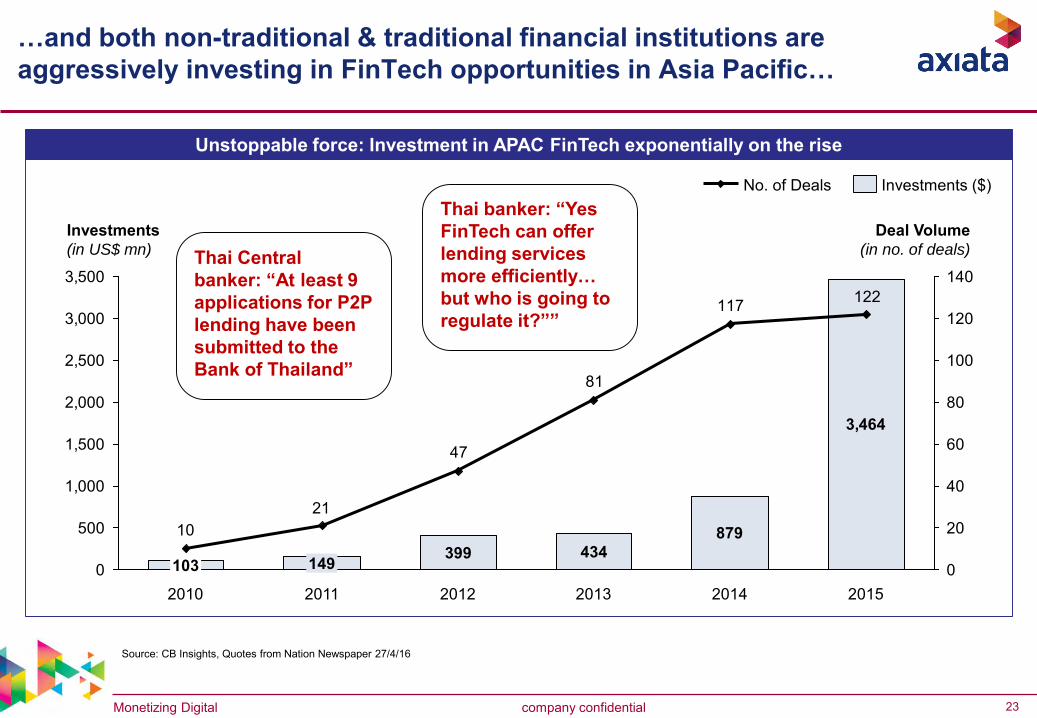
…and both non-traditional & traditional financial institutions are aggressively investing in FinTech opportunities in Asia Pacific…
Source: CB Insights, Quotes from Nation Newspaper 27/4/16
Unstoppable force: Investment in APAC FinTech exponentially on the rise
3,464
879434399
122117
81
47
2110
0
500
1,000
1,500
2,000
2,500
3,000
3,500
0
20
40
60
80
100
120
140
20152014201320122011
149
2010
103
Investments(in US$ mn)
Deal Volume(in no. of deals)
Investments ($)No. of Deals
Thai Central banker: “At least 9 applications for P2P lending have been submitted to the Bank of Thailand”
Thai banker: “Yes FinTech can offer lending services more efficiently… but who is going to regulate it?””
Monetizing Digital 24company confidential
Summary
There is a clear and significant market & economic development opportunity for financial services inclusion via mobile money in Asia Pacific – close to 100% of citizens can be reached via MFS1
Telcos are the logical access provider and Smartphones are the tool:• Over 2.5bn mobile subscribers in Asia Pacific can already use basic M-Money services today• Smartphone penetration is expected to reach 100% by 2020• Mobile KYC already requires biometric & other prepaid ID registration for most mobile users• Where available, M-Money currently offers lower cost by 50% to the low income OFWs and
can save the most needy citizens over $20Bn annually
2
Key areas in which policy makers can help:a) Permit non-banks to issue electronic money (or equivalent) b) Impose initial/ongoing capital requirements proportional to the risks of the e-money businessc) Permit telcos to use agents for Cash-in and cash-out operations, Deposit Taking, Insurance, and P2P lending with Mobile based KYC as the foundationd) Do not prescribe the implementation of specific interoperability models without allowing for a market-led approach
3
company confidential
Thank You
www.axiata.com
25