Embed Size (px)
Citation preview

Promoting Environmental Technologiesin SMEs: Barriers and Measures
Ruud Hoevenagel, Guido Brummelkamp, Anna Peytcheva and Rob van der HorstEditors: Josefina Lindblom and Luis Delgado
EUR 22769 EN
2007

The mission of the IPTS is to provide customer-driven support to the EU policy-making process by researching science-based responses to policy challenges that have both a socio-economic as well as a scientific/technological dimension.
European Commission Directorate-General Joint Research Centre Institute for Prospective Technological Studies Contact information Address: Edificio Expo. c/ Inca Garcilaso, s/n. E-41092 Seville (Spain) E-mail: [email protected] Tel.: +34 954488318 Fax: +34 954488300 http://www.jrc.es http://www.jrc.cec.eu.int Legal Notice Neither the European Commission nor any person acting on behalf of the Commission is responsible for the use which might be made of this publication. A great deal of additional information on the European Union is available on the Internet. It can be accessed through the Europa server http://europa.eu.int PUBSY 7124 EUR 22769 EN ISBN 978-92-79-05693-2ISSN 1018-5593 Luxembourg: Office for Official Publications of the European Communities © European Communities, 2007 Reproduction, for non commercial purposes, is authorised provided the source is acknowledged Printed in Spain

PREFACE
In 2003, over 23 million enterprises were providing a job to more than 140 million people in Europe 25, the European Economic Area and Switzerland. Most of these enterprises are SMEs, providing two thirds of all jobs. The average of SMEs (Small and Medium Enterprises) in the 12 New Member States is smaller than in the EU-15, although SMEs make up 72% of total employment. Regarding the contribution of SMEs to environmental problems, very few quantitative data exists. There are a number of different industrial sectors where SMEs have a particularly significant impact on the environment, in particular the manufacture of metal articles, some areas of electrical/electronic engineering, food, drink and tobacco, printing, textiles and leather, some areas of timber, woodworking industry and the manufacture of certain speciality chemicals. Considering the significant impact of SMEs on the environment it is important to analyse the process of adoption of environmental technologies within this sector. Different studies have to a certain extent covered this issue, describing a not promising picture of the average SME and its quest for environmental technology. SMEs face specific barriers hindering the adoption of environmental technologies and specific measures should be developed to promote their adoption by SMEs. This report provides an insight in the way SMEs at environmental technologies and identifies effective governmental measures that stimulate the adoption of environmental technologies by these enterprises. This report which is based on a the study conducted by the EIM Business & Policy Research on behalf of the Joint Research Centre Institute for Prospective Technological Studies, is a contribution to the development of the European Environmental Technologies Action Plan, ETAP, (COM (2004) 38). Thus far the role of SMEs in ETAP is underexposed in spite of the fact that SMEs play a crucial role in the European Economy. This report provides the ongoing work on ETAP with a better understanding of the barriers SMEs face when adopting environmental technologies. It also provides an analysis of specific measures for the promotion of environmental technologies in European SMEs. A review workshop has also been held in Brussels attended by representatives of government and industry from across the European Union to discuss and to consolidate the findings of the report. The outcome of this workshop is also incorporated in the report.

EXECUTIVE SUMMARY
Introduction This report deals with the adoption of environmental technologies by European small and medium sized enterprises (SMEs), what the problems in this respect are and how certain policy measures can help to overcome them. The issue is of great importance given the contribution of SMEs to current environmental problems in Europe, the relatively modest adoption of environmental technologies by SMEs and the crucial role SMEs play in the European economy. It is being argued that more SMEs adopting environmental technologies would contribute both to a better environment in Europe as well as to more growth and employment in Europe. The findings and the conclusions presented in this report are a contribution to the development of the Environmental Technology Action Plan, ETAP, adopted by the European Commission in 2004, where so far the role of SMEs is underexposed. ETAP aims to harness the full potential of environmental technologies to reduce pressures on natural resources, improve the quality of life and stimulate economic growth. The report provides an insight in the way SMEs look at environmental technologies and identifies effective governmental measures that stimulate the adoption of environmental technologies by these enterprises. To this aim, an inventory and analysis of a substantial number of measures for promoting the adoption of environmental technologies in 18 member states has been carried out. Among these national measures good practices have been selected according to certain selection criteria, which in turn are based on the barriers faced by SMEs in adopting environmental technologies. Almost all sectors of the economic activity are dominated by SMEs. Therefore, SMEs as a category is an extremely heterogeneous one. Most of these companies (about 80%) are mainly concerned by only two environmental issues, energy savings and waste recycling. In fact, only the larger SMEs in the field of manufacturing, transport, construction and extraction may encounter serious environmental problems. Common characteristics of SMEs that may impact on the adoption of environmental technologies Despite their heterogeneity, the companies in questions often have many characteristics in common which influence their approach to environmental issues and the use of environmental technologies, e.g.:
• Ownership and management are concentrated on the same hands. The entrepreneur plays a key role in the enterprise and his personal preference is usually the most influential factor when deciding about investments and business strategies.
• This entrepreneur is very likely to suffer from important time and task pressure, which leaves him with little time to reflect strategically on future activities beyond the core business of the company. This could imply that long-term investments which are not related to core-business are regarded as secondary.
• Given this time and task pressure, SMEs usually rely heavily on the opinion of their professional surrounding such as suppliers with which there is often a longstanding relationship. The entrepreneur himself usually is not well informed about the strengths and weaknesses of the relevant environmental technologies.

v
• The most common environmental issues for SMEs such as energy savings and waste disposal, which usually are not related to the core business of the company, are only dealt with in priority terms for action if this results in a substantial reduction of the total costs within a short time frame.
• The entrepreneur is often risk-averse given the relatively small economic size of the enterprise. The required pay-back for new investments is often as short as a maximum of three years. Generally, environmental technologies encompass higher costs in the short term whereas the extra benefits are realized in the longer term. This hinders the adoption of environmental technologies.
• SMEs experience little external pressure to behave more environmentally friendly manner. It is difficult for NGOs or customers to assign specific negative environmental consequences to one or more SMEs, while it is much easier to target large well known enterprises. Furthermore, governments in general avoid increasing external pressure on SMEs by environmental legislation.
• The internal motivation for most entrepreneurs to behave in a more environmentally friendly manner is low, as in general they are only indirectly involved in environmental issues. SMEs tend to only behave in an environmentally friendly manner within the existing environmental legislation.
Barriers and drivers for the adoption of environmental technologies The generic barriers hindering the adoption of environmental technologies and the general measures to address these barriers may be summarised as follows: • Most SMEs do not consider environmental issues to be important. This barrier is a
combination of the low level of external environmental pressure (from environmental legislation, NGOs, customers etc.) that most SMEs encounter and the fact that most environmental issues are back office activities. There is lack of internal and external incentives to act in a more environmentally friendly manner since only a limited number of SMEs have been able to utilise the growing concern for the environment to obtain a competitive advantage
The importance of environmental issues may be raised through the introduction of a stricter environmental legislation, by using existing business to business relationships, or by making environmental cost explicit using environmental accounting systems. Public campaigns to raise awareness amongst entrepreneurs in SMEs may also have an important role
• Most SMEs rely heavily on the opinion of their immediate professional surroundings
with respect to adopting environmental technologies. Most entrepreneurs are not very aware of environmental technologies or governmental measures to stimulate the uptake of such technologies; they lack information about potential technologies and their costs and benefits. They trust in the opinion of their professional surroundings regarding the adoption of environmental technologies, which often have the same lack of information about potential environmental technologies. Actions focussing on the professional surroundings, such as trade associations or equipment suppliers, may be more effective in regards to the adoption of environmental technologies, than actions which try to influence the entrepreneur himself directly.

• Costs and risks. The basic perception of SMEs with respect to environmental
technologies is the costs and risks associated to them. This barrier derives from the small economic size of most SMEs, their attitude towards risk and their cost perception with respect to new technologies. The low absorptive capacity of many SMEs (i.e. lack of adequately trained staff with sufficient knowledge about the installation and operation of new technology), as well as the difficulties in assessing finance play a part in this barrier as well.
The support towards the development of less risky technologies and the implementation of measures to at least partially offset these risks, like leasing contracts, bank guarantees, etc. are one of the most common approaches in governmental measures
Three key determinants or drivers of the environmental innovativeness of European SMEs, which correspond closely to the three barriers, have been identified through a number of case studies1: • Environmental orientation. The adoption of environmental innovations is
embedded in the SMEs’ business strategic decision-making. Companies have established an environmental management with a pro-active policy which goes beyond compliance with legislation).
• Business competence, differentiated into motivation, knowledge and power. The companies have the capacity to establish an internal adoption processes and to develop cooperative relations with external resources. It also involves organisational routines, which may be related to corporate values and norms. In many adoption processes, SMEs have ample practical knowledge on the available production and supportive processes, whereas science-based technological knowledge is under represented
• Network involvement, both the quality of the network and active use of the network. The network relations of a firm influence the adoption of environmental innovations in every stage, when a company gathers information on possible solutions, when it comes to implementing new technologies. The company’s networks can be divided into the business network, the knowledge network and the regulatory network.
There is a dynamic interaction between the three dimensions: environmental orientation, business competence and network involvement. For example, a company’s competences and network relations define the contours of the set of strategic options. On the other hand, a company’s strategic orientation influences the kinds of competences and external network relations that are developed. Moreover, internal competences define the ability to build and benefit from external relations. Competences of the firms are extended by their external competences. The case studies also show different patterns among countries and sectors with respect to the environmental innovativeness of companies. This would suggest that universal relationships across SMEs with respect to the adoption of environmental technologies do not exist, and probably more important, that governmental measures that aim to stimulate environmental technologies should take a sector’s specific structure into account. 1 EIM 1998 "Environmental innovation and SMEs: the dynamics of innovation".

vii
Identified measures Most member states have developed broad action programmes in order to promote sustainable entrepreneurship. These are often fostered by organizations or bodies related to the Ministry of Economics or to the Ministry of Environment. Accordingly, the measures are conceived from competitiveness or an environmental perspective. The national measures described in this report were not always conceived solely for SMEs but could have a bigger target group. A broad search has been made for governmental measures to stimulate the adoption of environmental technologies in the EU. The inventory consists of 127 measures applied in 18 member states. Among the measures identified, subsidies are the most common, but fiscal incentives, loans and guarantees and advice and consultancy are also frequent. Subsidies. This measure is used in almost all countries. Subsidies can be constructed in different ways and can cover different kinds of expenses. E.g., some only cover staff costs to implement new technologies, others can only be spent on services delivered by accredited or selected institutes and others cover the interest costs of the loans related to the funding of environmental technologies. A specific type of subsidy is the voucher scheme. Cheques are provided to companies to purchase knowledge or services from research institutes or from other businesses that have developed innovations. Fiscal incentives. With this measure in place, an entrepreneur can deduct investments from the taxable corporate income. This can sometimes be spread out over several years. In most countries this incentive is developed in the context of economic policy and it is meant to promote innovation and research and development in general terms. Providing assistance and information. By offering advice and knowledge or by stimulating the transfer and interaction between businesses and research institutes, ministries can directly or indirectly by funding private companies, promote a sustainable development among SMEs. Quite often these measures are combined in one single instrument, the most common combination in the identified programmes being subsidies with loans or subsidies with advisory services. The ex-post evaluation of the measures identified has only be carried out in a few occasions, and then most of these evaluations were not complete or comprehensive, showing merely the number of applicants and the funds spent. In order to get insight in the elements that determine a measure’s success, more detailed information is needed on its efficiency and on the constraints that hamper its application. In some cases there are more detailed evaluations and based on these, a number of constraints can be listed:
• Attention for sustainability disappears quickly. The consciousness of the entrepreneur often remains limited and the attention goes down significantly after the end of the project. An overall aim of the programmes/measures should thus be to integrate environmental concerns into the mainstream business strategy.

• Awareness of programmes. There is both a lack of awareness and knowledge of the programmes and measures among SMEs. There is insufficient promotion and marketing of measures and in many cases the potential benefits derived from the participation in the programmes are not clearly communicated.
• Address the specific needs of smaller enterprises. The success of a measure often depends to what extent the SME barriers are adequately recognized. It is not uncommon that, even if the measure is particularly meant for SMEs, it does not explicitly address the specific SME needs.
• Negative attitude One reason for a negative attitude towards governmental measures among SMEs can be the administrative burden that programmes and schemes can bring with them. They often require periodical delivery of comprehensive accounts and SME may lack the administrative capacity to comply with these requirements. One way of partly overcoming this could be to involve entrepreneurs in the planning, coordination and implementation of projects.
Good practice Good practices among the identified national measures for promoting the adoption of environmental technologies have been identified according to the five selection criteria described below, which in turn are based on the barriers faced by SMEs in adopting environmental technologies. Pressure. Governmental measures can increase directly or indirectly the pressure on SMEs to improve their environmental performance. Directly, governments can tighten up environmental legislation. There is however, no such governmental approach identified in the large group of studied measures. SMEs are not corrected due to their poor performance with regard to environmental technologies. Although this is generally regarded as an effective way to achieve environmental standards, governments are reluctant to apply this instrument on SMEs as it may deteriorate a country’s entrepreneurial climate and hamper its competitive position towards other countries. The indirect way is for governments to stimulate other stakeholders to increase their pressure on SMEs. Green public procurement is one option as well as influencing customers. In the inventory made, no measure was found that corresponds to the “pressure” criteria. Interest. One option is to inform the SME entrepreneur about the general benefits of becoming a more environmentally friendly company to improve their image among his customers and consequently increase the turnover. Another option is to use environmental accounting making environmental costs transparent. However, in the inventory, no such accounting measure was found. Whereas many measures in the inventory aim to increase the adoption of environmental technologies within SMEs, only few measures explicitly focused on influencing the operational business processes of companies. Most measures limit their focus to a single part of the production process. Whether entrepreneurs incorporate environmental issues into their business strategy plan is not taken into account.

ix
A weakness of measures that focus upon influencing the business process as a whole, are their relatively high costs. Seriously affecting corporate values requires a tailor made approach. Because of this, relatively few businesses can be served within the measure. Surrounding. It is generally agreed upon that the professional surrounding of an SME or the framework in which it exists has an important influence on the opinion of the entrepreneur. Good examples of measures addressing the surroundings of SMEs are incentives provided to entrepreneurs who invest in environmental technologies eligible for this incentive schemes. SMEs’ suppliers stimulate entrepreneurs to purchase eligible environmental technology. Using trade associations as a way to affect its members (usually SMEs) is a commonly followed route by national governments. Usually, these associations are used to explain new environmental regulations, but not to stimulate directly the use of environmental technologies Information. Providing information to the SMEs on environmental technologies is a widely used measure in the Member States and a significant share of the studied measures worked in this way. Information is being spread to reposition the views of entrepreneurs and make them invest in technologies they would otherwise not have considered. This kind of measures generally has a high share of lump sum costs; the additional cost for every new applicant is limited as long as the information campaign does not consist of tailor made consultancy services. However, information generally has an impact on companies which already have an environmental interest but often does not reach those who are not interested in environmental technologies. Benefits. Most of the measures identified in the inventory associate financial benefits to the adoption of specific environmental technologies. Subsidies and fiscal incentives are the most significant examples. An advantage of financial incentives is that they directly strengthen the profitability of companies. Nevertheless, experience shows that governments have to make substantial efforts to get the participation on a desired level, mostly due to a low level of awareness of the schemes among SMEs. Potential applicants can further be held back by conditions posed and the administrative procedures involved. It is thus fundamental to simplify these steps as much as possible. Probably the most salient conclusion, which resulted from the five selection criteria, is that none of the 127 measures of the inventory corresponds to the pressure criteria. This is remarkable, as it is generally agreed among SME experts and policy makers that most SMEs will only move towards a more environmentally friendly behaviour if they are pressed to do so. However, Member States in the European Union instead of using more stringent environmental regulations would rather use positive incentives to adopt environmental technologies. Providing subsidies and information about environmental technologies are the most frequently developed and used measures in the European Union. Using the influence of the surroundings of SMEs is less frequently developed, although some schemes show that suppliers of technologies will use, if available, official environmental
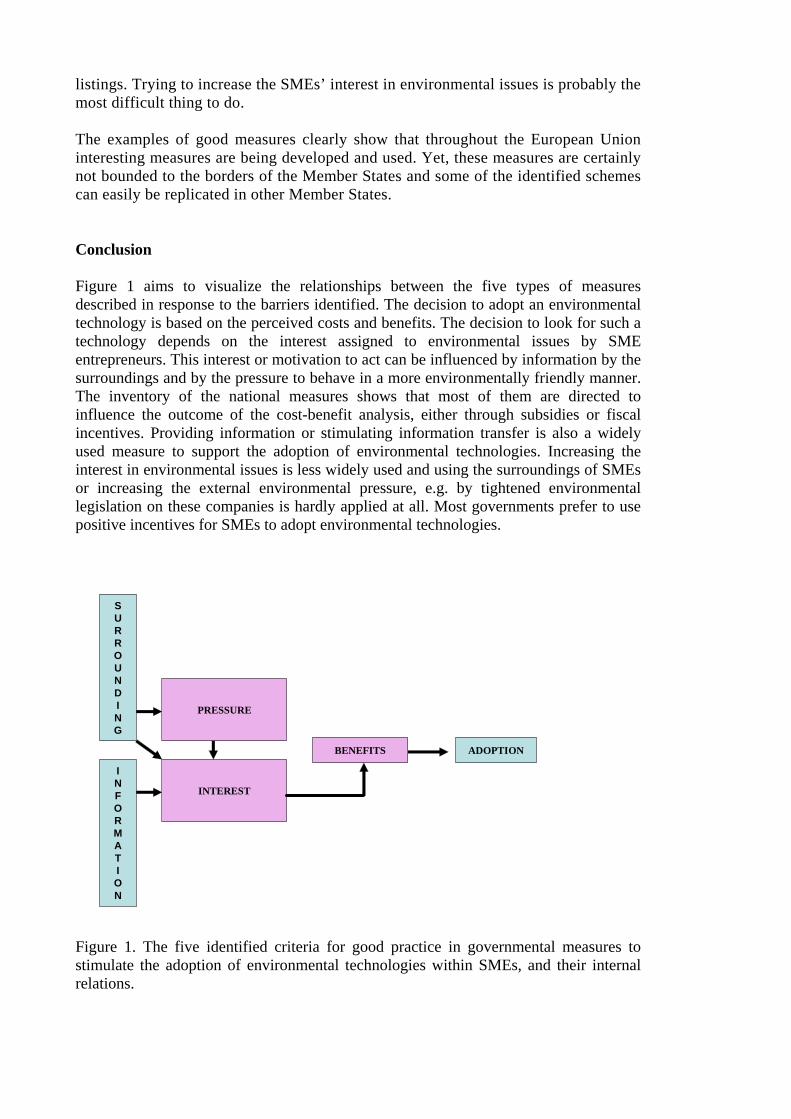
listings. Trying to increase the SMEs’ interest in environmental issues is probably the most difficult thing to do. The examples of good measures clearly show that throughout the European Union interesting measures are being developed and used. Yet, these measures are certainly not bounded to the borders of the Member States and some of the identified schemes can easily be replicated in other Member States. Conclusion Figure 1 aims to visualize the relationships between the five types of measures described in response to the barriers identified. The decision to adopt an environmental technology is based on the perceived costs and benefits. The decision to look for such a technology depends on the interest assigned to environmental issues by SME entrepreneurs. This interest or motivation to act can be influenced by information by the surroundings and by the pressure to behave in a more environmentally friendly manner. The inventory of the national measures shows that most of them are directed to influence the outcome of the cost-benefit analysis, either through subsidies or fiscal incentives. Providing information or stimulating information transfer is also a widely used measure to support the adoption of environmental technologies. Increasing the interest in environmental issues is less widely used and using the surroundings of SMEs or increasing the external environmental pressure, e.g. by tightened environmental legislation on these companies is hardly applied at all. Most governments prefer to use positive incentives for SMEs to adopt environmental technologies. Figure 1. The five identified criteria for good practice in governmental measures to stimulate the adoption of environmental technologies within SMEs, and their internal relations.
INTEREST
ADOPTION
SURROUNDING
BENEFITS
INFORMATION
PRESSURE

xi
Potentially important and effective measures are not being used. A very effective way to put environmental issues higher up on the agenda of SMEs is probably to increase the environmental pressure and/or to influence the framework in which they operate. Developing governmental measures that add environmental pressure on SMEs is more complex that setting up financial schemes or stimulating information transfers. One possibility is green public procurement whose impact on SMEs should be studied carefully. Regarding the surrounding of SMEs, the influence of trade and industry associations and suppliers could be used more extensively. Successful examples of measures addressing suppliers of environmental technologies drawing on official technology list to stimulate entrepreneurs to make use of their technologies have been identified. SMEs, which represent 99.8% of all enterprises in the European Union, are heterogeneous in nature, although they share some common characteristics regarding environmental issues and the adoption of cleaner technologies. Sector specific measures have proved to be more effective than measures of a general nature. Finally, it is advisable to develop standardized and comprehensive methods to evaluate governmental measures aimed at stimulating the adoption of environmental technologies.

1 INTRODUCTION.............................................................................................................................1 1.1 OBJECTIVES................................................................................................................................1 1.2 APPROACH .................................................................................................................................1 1.3 CONTENT OF THE REPORT...........................................................................................................2
2 EUROPEAN SME.............................................................................................................................3 2.1 THE NUMBER OF SMES IN THE EUROPEAN UNION .....................................................................3 2.2 CHARACTERISTICS OF SMES ......................................................................................................8 2.3 ENVIRONMENTAL ISSUES AND SMES.......................................................................................10 2.4 CONCLUSIONS ..........................................................................................................................11
3 BARRIERS HINDERING THE ADOPTION OF ENVIRONMENTAL TECHNOLOGIES.13 3.1 A BRIEF OVERVIEW .................................................................................................................13 3.2 GENERIC SME BARRIERS.........................................................................................................15 3.3 POSSIBLE SOLUTIONS ...............................................................................................................16
4 DRIVERS STIMULATING THE ADOPTION ...........................................................................17 4.1 ENVIRONMENTAL INNOVATIONS AND SMES............................................................................17 4.2 GENERAL INTERRELATIONS......................................................................................................19 4.3 COUNTRY-SPECIFIC AND SECTOR-SPECIFIC INTERRELATIONS...................................................20 4.4 CONCLUSIONS ..........................................................................................................................20
5 GOVERNMENTAL MEASURES TO STIMULATE SMES .....................................................21 5.1 INTRODUCTION.........................................................................................................................21 5.2 THE COLLECTION AND SELECTION PROCESS .............................................................................21 5.3 MEASURES IDENTIFIED.............................................................................................................22 5.4 TYPES OF INSTRUMENTS ...........................................................................................................24 5.5 POLICY CONTEXT OF THE MEASURES........................................................................................27 5.6 REVIEWING THE EVALUATIONS ................................................................................................29 5.7 CONCLUSIONS ..........................................................................................................................30
6 GOOD PRACTICES ......................................................................................................................31 6.1 INTRODUCTION.........................................................................................................................31 6.2 FIVE SELECTION CRITERIA ........................................................................................................31 6.3 ELABORATING ON THE SELECTION CRITERIA ............................................................................33 6.4 GOOD PRACTICES .....................................................................................................................35 6.5 CONCLUSIONS ..........................................................................................................................41
ANNEXES .................................................................................................................................................43 ANNEX I: SUSTAINABILITY POLICIES ......................................................................................................43
ANNEX II: PROCEEDINGS OF THE EXPERT WORKSHOP.........................................................47 INTRODUCTION .......................................................................................................................................47 THE PROGRAMME OF THE WORKSHOP.....................................................................................................47 CONCLUSIONS OF THE WORKSHOP ..........................................................................................................49 PARTICIPANTS OF THE WORKSHOP ..........................................................................................................50 ANNEX III: OVERVIEW OF ALL 127 MEASURES .......................................................................................52

1
1 INTRODUCTION 1.1 Objectives
This report deals with the adoption of environmental technologies2 by European small and medium-sized enterprises (SMEs). The issue is particularly relevant given the contribution of SMEs to current environmental problems in Europe and the crucial role SMEs play in the European economy. It is argued that more SMEs adopting environmental technologies would contribute both to a better environment in the Member States and to more growth and employment in Europe. The overall objective of this study is to gain more insight in the way SMEs look at environmental technologies, and to discover effective governmental measures that stimulate the adoption of environmental technologies by these enterprises. This report addresses two major questions: 1) What specific barriers do SMEs encounter in adopting environmental
technologies? 2) To what extent can governmental measures be designed to counteract these
barriers? The specific objectives of the study are threefold: 1. Identifying the key variables barriers hindering the adoption of environmental
technologies by European SMEs. 2. Identifying governmental measures and selecting good practices for promoting the
adoption of environmental technologies, including an analysis of their effectiveness and weaknesses.
3. Defining measures to promote the adoption of environmental technologies by European SMEs and possible ways of implementation.
This report has been elaborated to support the on-going development of the Environmental Technology Action Plan adopted by the European Commission in 2004 where, so far, the role of SMEs is underexposed. 1.2 Approach
Based on the confrontation of the measures found with the barriers identified, an overview has been made with barriers which have not been satisfactorily approached yet, the so-called 'white spots'. Based upon this overview a selection of existing good practices was made. These good practises serve as a model for possible new measures. The selection and analysis have been discussed at a workshop with various European experts. The identification of the barriers confronted by SMEs face has been carried out through desk research and consultations with SME and innovation experts. The search of governmental measures was done in three phases:
2 In this study environmental technologies include all technologies whose use is less environmentally harmful than relevant alternatives.

2
− Consulting existing international databases. − Approaching institutions and key agents in the fields of innovation and
environmental technologies by e-mail. They were confronted with the various measures that had been found in their countries and were asked to verify these and to provide us with evaluations.
− Finally, the members of the European Network for Social and Economic Research (ENSR) were consulted with the same questions.3
Moreover, only those measures were selected which (to a large extent) were financed through public funds. 1.3 Content of the report
The first three chapters of this report introduce the more relevant issues related to the adoption of environmental technologies by SMEs. Chapter 2 briefly describes the specific characteristics of European SMEs and provides a first overview of the main features that characterize the relation between environmental issues and SMEs. Chapters 3 and 4 address respectively the barriers hindering and the drivers stimulating the adoption of environmental technologies by SMEs. As a sidestep chapter 4 examines the specific features of environmentally friendly SMEs. Chapter 5 summarises the results of an exhaustive inventory of existing measures in the field of environmental technologies in 184 Member States. This chapter addresses the following issues: how the measures were collected, what type of measures were found, what measures are prominent in each Member State, and whether common patterns across countries to stimulate SMEs to adopt more environmental technologies can be identified. Finally, chapter 6 presents a number of selected good practices on the basis of five so-called, ‘determinants of successes'. These determinants are derived from the barriers which have been identified in chapter 3. Eight good practises are described in some detail and their effectiveness and weaknesses are analyzed. The Annexes present the proceedings of the expert workshop that was held to consolidate the results of this report, a listed inventory of existing measures in 18 Member States related to the adoption of environmental technologies and provide an overview of sustainability policies in these Member States.
3 ENSR is a network of similar organisations as EIM, one in each of the countries of the European Economic Area. All ENSR partners are scientifically independent and in total more than 450 highly qualified researchers are brought together in the Network. The Network has a broad spectrum of qualitative and quantitative research consisting of macro oriented, meso and sector studies, as well as micro economic and small business management research. 4 The 15 ‘old’ Member States, Poland, Hungary and the Czech Republic.

3
2 EUROPEAN SME 2.1 The number of SMEs in the European Union
Definition of SMEs5 SMEs are defined by the European Commission as enterprises which employ less than 250 employees and which have an annual turnover that does not exceed 50 million euros, and/or an annual balance sheet total not exceeding 43 million euros. Within SMEs the following categories are distinguished: • Micro enterprises: enterprises with 0-9 occupied persons, and whose annual
turnover and/or annual balance sheet total does not exceed 2 million euros. • Small enterprises: enterprises with 10-49 occupied persons, and whose annual
turnover and/or annual balance sheet total does not exceed 10 million euros. • Medium-sized enterprises: enterprises with 50-249 occupied persons, and whose
annual turnover does not exceed 50 million euros, and/or an annual balance sheet total not exceeding 43 million euros.
Observatory report 2003 The report SMEs in Europe 20036 of the Observatory of European SMEs, revealed that there are 19.3 million enterprises in the European Economic Area (EEA) and Switzerland, providing employment for 140 million people (See Table 1). About 92% of these enterprises are micro enterprises (0-9), 7% are small enterprises (10-49), less than 1% are medium-sized enterprises (50-249) and only 0.2% are large enterprises (250 or more employees). Just over two thirds of all jobs are in SMEs, so almost one third of all jobs are provided by large enterprises. Within SMEs, the major share of employment is in micro enterprises. Table 1: Basic fact about SMEs and large enterprises in Europe-197, 2003
SME Large Total Number of enterprises (x 1,000) 19,270 40 19,310 Employment (x 1,000) 97,420 42,300 139,710 Occupied persons per enterprise 5 1052 7 Turnover per enterprise Million € 0.9 319 1.6 Value added per occupied person € 1,000 55 120 75 Share of labour costs in value added % 56 47 52 Source: Estimated by EIM Business & Policy Research; estimates based on Eurostat's
Structural Business Statistics and Eurostat's SME Database. Also based on European Economy, Supplement A, May 2003 and OECD: Economic Outlook, No. 71, June 2003.
Number of SMEs in EU-25
5 Based on Recommendation 2003/361/EC of 6 May 2003 by the Commission. 6 European Commission, SMEs in Europe 2003; Observatory of European SMEs; Report submitted to the Enterprise Directorate General by KPMG Special Services, EIM Business & Policy Research, and ENSR; Brussels, 2003. 7 Europe-19 is the indication used in 2003 for the 18 EEA countries (EU-15, Norway, Iceland and Liechtenstein) together with Switzerland.

4
Table 2 – based on available figures of 2003 and 2001 - reveals that there are about 22.2 million SMEs in the current 25 Member States of the European Union. Almost 93% of these enterprises are micro enterprises (0-9), 6% are small enterprises (10-49), 0.9% are medium-sized enterprises (50-249) and only 0.2% of all enterprises are large enterprises (250 or more employees).8 Table 2 further reveals that 16.4 million SMES (74% of all SMEs in the European Union) are located in Italy, Germany, Spain, France, United Kingdom and Poland. Table 2: Number of SMEs and large enterprises in EU-25
x 1.000 Micro Small Medium-sized SMEs Large
Italy(a) 4,290 177 19 4,486 3 Germany(a) 2,656 307 44 3,008 11 Spain(a) 2,499 156 19 2,674 3 France(a) 2,326 144 25 2,495 6 United Kingdom(a) 1,996 200 31 2,226 8 Poland(b) 1,474 35 11 1,520 2 Czech Republic(b) 841 45 7 893 1 Hungary(b) 745 22 4 771 1 Greece(a) 752 16 2 771 0,4 Portugal(a) 648 39 6 693 1 The Netherlands(a) 517 43 9 570 3 Sweden(a) 454 27 4 485 1 Belgium(a) 408 25 4 437 1 Austria(a) 233 30 5 267 1 Finland(a) 207 12 2 221 1 Denmark(a) 180 21 4 205 1 Ireland(a) 83 12 2 97 0.4 Lithuania(b) 63 7 2 72 0.4 Slovenia(b) 57 2 1 59 0.2 Cyprus(b) 53 2 0.4 56 0.0 Slovak Republic(b) 49 3 1 52 0.1 Latvia(b) 33 7 1 41 0.2 Estonia(b) 29 4 1 34 0.1 Luxembourg(a) 21 3 1 24 0.1 Malta(b) 18 1 0.2 19 0.0 EU-25 20,636 1,339 204 22,179 44 (a) based upon available figures of 2003; (b) based upon available figures of 2001 Source: EIM Business & Policy Research; based on figures of 2003 (a) and 2001 (b)
Not all Member States have the same ‘SME structure’. For example, Greece and Poland encompass (comparatively speaking) the most micro enterprises (98 and 97%), whereas Latvia and Estonia encompass the lowest percentage of micro enterprises: 81 and 85%.
8 These numbers coincides well with the numbers of Table 1.

5
Table 2 reveals that within the large group of SMEs, the vast majority (93%) are micro enterprises, employing fewer than 10 persons. Approximately half of these micro enterprises (about 10 million) have no employees at all, only providing employment and income to self-employed and family workers. SMEs in EU-25: eight sectors divided It can be argued that industrial sectors have a more significant impact on the environment than services sectors and retail distribution. In particular manufacturers of metal products, food, drink and tobacco, printing, textiles and leather, certain specialist chemicals and some areas of electrical/electronic engineering and woodworking are important. Table 3 distinguishes the number of SMEs in the Member States of the European Union into eight sectors, i.e. extraction and energy, manufacturing, construction, wholesale trade, retail distribution, transport, producer’s services and personal services.9
9 These sectors correspond to the current NACE definition.

6
Table 3: SMEs in EU-25, divided into eight sectors
Extraction and energy Manufacturing Construction Wholesale trade Retail
distribution Transport,
communication Producer services;
Personal services
EU-25 0,2% 11,9% 11,6% 8,1% 20,0% 5,5% 22,2% 20,4% Italy 02% 15.4% 11.9% 10% 20.9% 4.1% 20.8% 16.8% Germany 0.2% 9.8% 10.1% 4.8% 12.2% 5.0% 29.0% 28.8% Spain 0.2% 11.7% 12.0% 7.5% 22.5% 8.8% 18.4% 18.9% France 0.2% 11.5% 13.3% 6.9% 18.2% 4.3% 20.8% 24.8% United Kingdom 0.1% 9.4% 8.9% 5.8% 13.0% 3.8% 28.0% 31.0% Poland 0.1% 12.0% 10.6% 11.2% 26.1% 8.5% 18.5% 13.0% Czech Republic 0.1% 17.1% 14.5% 7.4% 17.2% 5.1% 25.4% 13.2% Hungary 0.1% 11.0% 9.0% 8.4% 19.7% 6.1% 30.5% 15.2% Greece 0.3% 4.0% 15.7% 10.8% 47.5% 4.8% 6.5% 10.4% Portugal 0.4% 13.8% 15.8% 9.1% 32.3% 3.4% 10.2% 15.0% The Netherlands 0.1% 9.8% 10.4% 10.2% 17.9% 5.4% 23.8% 22.4% Sweden 0.4% 12.7% 11.3% 9.4% 15.7% 7.0% 36.2% 7.3% Belgium 0.1% 10.6% 12.5% 10.3% 21.9% 4.0% 20.0% 20.6% Austria 0.4% 11.8% 8.5% 8.2% 17.7% 5.3% 19.5% 28.5% Finland 1.0% 14.4% 13.3% 8.0% 15.0% 11.6% 20.7% 16.1% Denmark 2.2% 12.0% 14.2% 8.5% 16.0% 8.1% 27.9% 11.1% Ireland 0.6% 8.9% 17.9% 5.6% 20.0% 5.9% 22.0% 19.2% Lithuania 0.3% 9.5% 3.6% 13.8% 32.3% 9.3% 8.2% 23.1% Slovenia 0.7% 19.2% 11.7% 7.5% 17.5% 10.3% 17.6% 15.5% Cyprus 0.1% 11.0% 9.3% 10.4% 24.3% 8.0% 9.2% 27.6% Slovak Republic 0.1% 12.9% 8.4% 8.4% 19.6% 3.7% 12.5% 34.3% Latvia 0.3% 12.1% 5.8% 15.8% 37.0% 6.2% 12.4% 10.4% Estonia 0.5% 10.8% 6.2% 10.6% 24.8% 9.7% 26.2% 11.1% Luxembourg 0.2% 4.0% 8.7% 13.2% 14.3% 5.2% 30.3% 24.1% Malta 0.1% 26.7% 8.0% 8.9% 20.7% 6.5% 7.5% 21.7% Source: EIM Business & Policy Research, 2005

7
Table 3 shows different business organizations across the Member States. For example, the manufacturing sector is a relatively large in Malta, Czech Republic and Italy. Yet, retail distribution is relatively large in Greece, in the United Kingdom SMEs in the personal services sector are predominant. Table 3 further shows that 63% of all SMEs belong to the group of producer services, personal services and retail distribution, whereas the industrial sectors that might have the most negative impact on the environment, manufacturing and extraction constitute of 12.1% of all SMEs in EU-25.10 This corresponds to 2.7 million enterprises, including 2.5 million micro enterprises with less than 10 employees. It is also interesting to look at the ‘SME structure’ of the various sectors. Table 4 provides information on this topic. Due to data constraints this overview holds only for the 15 older Member States and refers to the year 2003. The overview in Table 4 refers to the 25 sectors where the percentage of SMEs is the lowest. The ‘tobacco industry’ which has the lowest percentage of SMEs still encompasses 62% micro enterprises. More generally, it can be argued from Table 4 that all sectors are dominated by micro enterprises. Table 4: Percentage of SMEs in 25 sectors in the 15 old Member States (2003)
Micro Small Medium- sized Large
manufacturing of tobacco products (NACE 16) 62.2% 14.2% 10.1% 13.4%
manufacturing of coke, refined petroleum and nuclear fuel (NACE 23) 65.1% 19.3% 8.3% 7.3%
extraction of crude petroleum & natural gas (NACE 11) 68.6% 13.3% 10.8% 7.3%
insurance & pension funding (NACE 66) 76.6% 11.2% 7.0% 5.2% manufacturing of motor vehicles, trailers & semi-trailers (NACE 34) 66.2% 20.7% 8.8% 4.3%
manufacturing of chemicals, ch. products and man-made fibres (NACE 24) 68.3% 18.4% 9.4% 3.9%
mining of metal ores (NACE 13) 85.2% 6.6% 4.3% 3.9% air transport (NACE 62) 75.6% 15.4% 5.4% 3.5% manufacturing of basic metals (NACE 27) 66.0% 20.9% 9.6% 3.4% electricity, gas, steam & hot water (NACE 40) 79.3% 12.3% 5.3% 3.2%
manufacturing of pulp, paper & paper products (NACE 21) 65.9% 22.5% 9.0% 2.6%
mining of coal & lignite, extraction of peat (NACE 10) 81.9% 11.4% 4.3% 2.4%
financial intermediation (NACE 65) 82.7% 10.7% 4.4% 2.2% research & development (NACE 73) 88.1% 7.5% 2.5% 1.9% manufacturing of radio, television &communication equipment (NACE 32) 81.3% 12.6% 4.4% 1.8%
manufacturing of other transport equipment (NACE 35) 81.9% 12.4% 3.9% 1.7%
10 Although these two sectors are probably the biggest polluters, this does not mean that it is wise to concentrate solely on these sectors when stimulating environmental technologies.

8
Micro Small Medium-sized Large
manufacturing of office machinery & computers (NACE 30) 83.1% 11.3% 3.8% 1.7%
manufacturing of electrical machinery (NACE 31) 76.7% 17.0% 4.8% 1.5%
collection, purification & distribution of water (NACE 41) 82.4% 11.7% 4.5% 1.4%
manufacturing of rubber and plastic products (NACE 25) 67.8% 23.6% 7.3% 1.4%
manufacturing of machinery and equipment, n.e.c. (NACE 29) 77.2% 17.1% 4.7% 1.1%
sewage & refuse, disposal, sanitation & similar services (NACE 90) 80.7% 14.9% 3.6% 0.8%
manufacturing of other non-metallic mineral products (NACE 26) 80.4% 15.4% 3.4% 0.8%
water transport (NACE 61) 88.1% 8.9% 2.3% 0.7% manufacturing of textiles (NACE 17) 78.8% 16.4% 4.1% 0.7% Source: EIM Business & Policy Research, 2005
The ten sectors where SMEs are overwhelmingly predominating are : wholesale & commission trade (NACE 51), renting of machinery & equipment (NACE 71) , health and social work (NACE 85), land transport, transport via pipelines (NACE 60), construction (NACE 45), recreational, cultural & sporting activities (NACE 92), retail trade, repair of household goods (NACE 52), sale, maintenance & repair of motor vehicles & motorcycles (NACE 50), hotels and restaurants (NACE 55), activities auxiliary to financial intermediation (NACE 67), real estate activities (NACE 70), and other service activities (NACE 93) . In all these sectors SMEs constitute more than 99.9% of the total number of companies. 2.2 Characteristics of SMEs
SMEs, despite their heterogeneity, share a number of characteristics that make them different from their larger counterparts. Some of these characteristics may affect the nature and the extent of the environmental behaviour of SMEs, (see section 2.3). In substance, SMEs are characterised by: • The average SME is small with respect to the number of employees. On average,
a large enterprise in Europe provides employment to about 1,000 people, whereas the average for SMEs is 5 people (see Table 1). Countries differ with respect to the average scale of their enterprises. For example, the average number of occupied persons per enterprise varies between 2 in Greece to 12 in The Netherlands.11 It is worth mentioning that about half of all enterprises have no employees at all.
• The average SME is also small with respect to the turnover generated. On
average, a large enterprise in Europe has a turnover of 319 million Euros, whereas the average for SMEs is almost 1 million Euros (see Table 1). The share of labour costs in the value added is greater in SMEs (56%) than in large enterprises (47%).
11 See the Observatory of European SMEs, 2003

9
• In most SMEs, ownership and management are concentrated in the same hands.
The entrepreneur plays a key role in his or her enterprise and his or her personal preference is usually the most influential factor regarding decisions about investments, the allocation of funds or the development of business strategies.
• Entrepreneurs in SMEs are very likely to suffer from important time and task
pressures, which leave them with little time to reflect strategically on future activities 'beyond' the core business of the enterprise. This characteristic could imply that long-term investments, which are not clearly related to the core business, are regarded as secondary.
• SMEs are usually risk-averse given the relatively small economic size of these
enterprises. The time to recover the extra costs of new investments is usually set at three years or less. Consequently, investments in proven technologies prevail over more innovative but risky investments.
• SMEs usually rely heavily on the opinion of their professional surroundings (i.e.
their main supplier, accountant, bank, etc.) with which there is often a longstanding relationship.12 It should be kept in mind that most entrepreneurs of SMEs are usually technically trained with respect to their core business, but not for new technologies that are beyond the core business.
Figure 1 provides a summary of the above stating typical characteristics of SMEs. These characteristics are more prominent the smaller the SME is. In small and medium-sized enterprises the role of the entrepreneur is usually less outstanding than in micro enterprises. At a size of some 40 employees marketing related managers usually enter the enterprises. Figure 1 Overview of the key characteristics of SMEs (EIM 2005)
Rely onsurrounding
Riskaverse
Corebusiness
Timepressure
Key roleentrepreneur
Small
SMEs
12 Personal relationships between the SME entrepreneur and financing partners, suppliers, clients, customers are more frequent
in smaller businesses. These personal contacts very often help to build trustful business partnerships in a way impracticable in larger firms. As a consequence, the basic knowledge circle of the entrepreneur is limited when compared to larger enterprises.

10
2.3 Environmental Issues and SMEs
Most of the SMEs consider that they are only indirectly concerned by environmental issues. In fact, the great majority of SME entrepreneurs do not actually see the environmental burden created by their enterprises (the same applies to their customers). It can be argued that 80% of all 22.2 million SMEs in the Member States of the European Union (see Table 3) are only concerned by two environmental issues, energy savings and waste recycling. Larger SMEs in the field of manufacturing, transport, construction and extraction may face more complex environmental problems. The main features that influence the way SMEs deal with environmental issues are: - Little external pressure to behave in a more environmentally friendly manner.
This relates to the fact that it is difficult for stakeholders, such as non-governmental organisations or customers, to assign specific negative environmental consequences to one or more SMEs.
- Low internal motivation for most entrepreneurs in SMEs to behave in a more
environmentally friendly manner. Moreover, environmental costs in SMEs constitute a small part (on average 3 to 5%) of the total costs. SMEs do not have incentives to go beyond existing environmental legislation.
- Typical environmental issues for SMEs such as energy savings and waste
disposal are usually not related to their core business; therefore, they are considered by the majority of the SMEs as back-office activities. New environmental technologies will only be regarded successful when they result in a substantial reduction of the total costs within a certain time span (three years or less).13
- The basic perception of SMEs with respect to environmental issues is extra costs
and not to extra benefits. Generally, environmental technologies in the short term encompass higher costs whereas the extra benefits of environmental technologies are usually realized on the longer term. The relatively short term focus of most SMEs hinders the adoption of risky technologies.
- SMEs in general are not well-informed about the strengths and weaknesses of the
relevant environmental technologies. - The traditional main suppliers play a key role in the adoption of new
technologies, eventually including environmental technologies. Figure 2 provides a summary of the above stated features. As noted before, these barriers are probably less dominant for larger SMEs.
13 Of course, when environmental technologies are needed to secure the turnover of the company (thus, interfering in the core business), SMEs react quickly.

11
Figure 2 Overview of the key environmental barriers of SMEs
Rely onsurrounding
Notwell-informed
Costperception
Backoffice
Indirectinvolvement
Littleexternalpressure
Environ-mentalissues
Source: EIM Business & Policy Research, 2005
2.4 Conclusions
The environmental behaviour of SMEs, either through adopting environmental technologies or through implementing environmental management measures, in essence occurs via external pressure or via internal motivation: basically the motivation of the entrepreneur. It is difficult to identify and assign specific environmental consequences to one or more SME and therefore, there is little external pressure from shareholders to improve their environmental performance. A closer look into the internal motivation of the SMEs reveals that there is generally only little stimulus to behave in a more environmentally friendly manner, i.e. environmental costs, which usually constitute only a small part of total business costs. Consequently, there is a need for SME-tailored measures to stimulate the adoption of environmental technologies. These measures could be sector specific given the ‘SME structure’ of most industrial and services sectors. Generally, about 90% of each sector consists of micro and small enterprises (see Table 4).


13
3 BARRIERS HINDERING THE ADOPTION OF ENVIRONMENTAL TECHNOLOGIES
3.1 A Brief Overview
Most of the barriers identified in the literature with respect to the relationship between SMEs and environmental technologies relate to the development of new technologies by SMEs, and not to their adoption. An example of this can be found in the barriers, which have been identified by the European Commission in its Environmental Technologies Action Plan (ETAP).14 In its Communication (COM (2004) 38) five groups of barriers are mentioned:
Economic barriers, such as the higher cost of investments in environmental technologies because of their perceived risk, the size of the initial investment or the complexity of switching from traditional to environmental technologies;
Legislative barriers, when legislation is unclear or too detailed, while good legislation can stimulate environmental technologies;
Insufficient research efforts, coupled with inappropriate functioning of the research system in European countries and weaknesses in information and training;
Inadequate availability of risk capital to move from the drawing board to the production line;
Lack of market demand from the public sector, as well as from consumers. Economic and legislative barriers also apply to the adoption of existing environmental technologies whereas the latter three barriers are clearly related to the development of new environmental technologies. Another, more elaborated scheme of barriers is offered by Ashford (1993). He makes a distinction between the following types of barriers:
Technological barriers: availability of technology for specific applications; Financial barriers: research and development costs of technology. Costs related
to risk of process changes regarding consumer acceptance and product quality; Labour force-related barriers: lack of person(s) in charge of management,
control, and implementation; Regulatory barriers: uncertainty about future environmental regulation; Consumer-related barriers: risk of customer loss if output properties change
slightly or if product cannot be delivered for a certain period; Supplier-related barriers: lack of supplier support in terms of product
advertising, good maintenance service, expertise of process adjustments, and so forth;
Managerial barriers: lack of top management commitment. Also this scheme seems to be more related to the development of new environmental technologies than to the adoption of existing environmental technologies by SMEs. (Although the above-mentioned labour force-related barriers could be relevant for the adoption of environmental technologies.)
14 It should be noted that these barriers were not exclusively meant for SMEs.

14
The IPTS report (conducted for the preparation of the ETAP)15 clearly states the key problems SME entrepreneurs face with respect to adopting environmental technologies. These problems have been put forward by IPTS in a hypothetical, case study. Company A. Ltd. is an SME in one of the member states of the EU. Most of the people working in company A Ltd., including the manager, do not consider the production process to be very pollutant, or at least, not in comparison with the bigger production plants in their industrial area. Besides, after having received the permit to establish a business, about twelve years ago, there has been no need to check the environmental legislation that applies to their business, because latest expansions of the production lines did not require it. It might not come as a surprise that reducing the environmental impact of the process is not considered of core importance, neither by the manager, nor by his staff. One day, an incident occurs that causes an immediate need for environmental improvement. The general manager, flexible but suffering a shortage of time and staff resources, acts rapidly as always and quickly starts looking for a solution for this problem in his process. Soon, he realises that the company is lacking of skills, education, training and expertise in this field, which would not be a problem if he would know whom to turn to. Unfortunately, the general manager is reluctant to ask for external help, and decides to try to find support in his existing network. Not distinguishing well the difference between consultants, environmental technology-experts and equipment sellers, he has troubles to find a reliable advice on how to proceed. He ends up with one of his current equipment provider that tries to sell him a simple, operational solution that solves the problem without interfering in the process. The general manager is attracted by the idea of a quick settlement of the issue, and of not having to shut down the process for more than one day. Talking to the production manager however, he realises that there might be other, in the long term more efficient, answers. Through an acquaintance of the production manager, who works in an environmental consultancy, the manager gets in touch with a supplier of an environmental technology solution. After a visit of one of their representatives, during which they have to provide a lot of data on water and electricity consumption, the offer is sent. Unfortunately, the investment costs turn out to be disappointingly high. Especially now when the company is tight on financial resources and having the prospect of a further regression of the economy, the manager feels he should above all be concerned with short-term economic revival of his company. On top of it all it proves to be difficult to quantify the environmental benefits and get certainty about possible savings, especially now when energy prices are going down. It is clear to the manager, the company simply cannot afford this kind of investment at the moment and he starts thinking back on the first solution that was provided by the current equipment-supplier. He calls the representative of the environmental technology company to share his doubts with him. The above hypothetical story clearly states several of the barriers SMEs face in adopting environmental technologies.
15 IPTS (2004) Promoting environmental technologies: sectored analyses, barriers and measures. Report EUR 21002, European Commission.

15
3.2 Generic SME Barriers
In combining the six typical characteristics of SMEs (Figure 1) with the six features that may affect the way SMEs deal with environmental issues (Figure 2), three generic barriers have been identified in this study. The first barrier is a combination of the little external environmental pressures that most SMEs face, the indirect involvement of entrepreneurs in SMEs with environmental issues and the fact that most environmental issues are back office activities. The barrier is phrased as follows: most SMEs do not consider environmental issues to be important. An internal incentive to act in a more environmentally friendly manner is lacking in most SMEs. Also, the external pressure from customers or clients to do so is usually low. Despite the priority given by society over recent years in achieving environmental improvements, only a limited number of SMEs have been able to utilise the trend towards growing concern for the environment to obtain a competitive advantage. The second barrier is a combination of the key role most entrepreneurs have in their enterprise, the time pressure they face, their interest in the core business, the fact that they are usually not well-informed about environmental technologies (or about governmental measures that try to stimulate these technologies ), and their trust in the opinions of their professional surroundings. The barrier is therefore phrased as follows: most SMEs rely heavily on the opinions of their immediate professional surroundings with respect to adopting environmental technologies. Another barrier is the lack of information about potential environmental technologies: amongst both entrepreneurs and his or her immediate professional surroundings. Without a good understanding of the costs and benefits of the new technology it’s difficult for SMEs to compare the strengths of these technologies with contemporary ones.16 Finally, the third barrier is a combination of the small economic size of most SMEs, their attitude towards risks, and their cost perception with respect to new technologies. The barrier is phrased as follows: the basics perception of SMEs with respect to environmental technologies is related to costs and risks. New environmental technologies are often perceived by SMEs as risky investments, because entrepreneurs are not well-informed and these technologies are often not a part of the investor’s core business. The lack of adequately trained staff is also an issue, which could lead to additional costs and risks. Where technology is new, it requires training for it to be installed and maintained properly. It should be noted that SMEs tend to have more difficulties than larger firms in accessing finance and information that is not linked to their core business.
16 Even when a technology could be competitive, it may be difficult to disseminate it because distribution channels for new technologies are not as good as those for established technologies. Yet, in order to promote environmental technologies, one should preferably follow existing information routes, i.e., business organisations or the financial sector.

16
3.3 Possible Solutions
There are a number of general potential solutions to overcome the identified three generic barriers SMEs face with respect to adopting environmental technologies. The importance of environmental issues may be raised through the introduction of stricter environmental legislation, by using existing business to business relationships, or by making environmental cost explicit using environmental accounting systems. Public campaigns to raise awareness amongst entrepreneurs in SMEs may also have an important role. Actions focussing on the professional surroundings of SMEs, like trade associations or equipment suppliers, may be more effective with respect to the adoption of environmental technologies, than actions which try to influence the entrepreneur himself directly.
The support to the development of less risky technologies and the implementation of measures to at least partially offset these risks, like leasing contracts, bank guarantees, etc. are one of the most common approaches in governmental measures to stimulate the adoption of environmental technologies (cf. chapter 5).

17
4 DRIVERS STIMULATING THE ADOPTION 4.1 Environmental innovations and SMEs
The study “Environmental innovations and SMEs: the dynamics of innovation (ENVIS)”17 addresses the key characteristics of SMEs that have actually adopted new environmental technologies. The study focused on the adoption of environmental innovations by SMEs, considering their specific characteristics and competences and the support received from external parties. The study investigated the adoption of environmental innovations in five countries of the European Union: Denmark, Italy, the Netherlands, Portugal and the United Kingdom. Moreover, the study looked at four industrial sectors: offset printing, electroplating, textile finishing and industrial painting. Within this study 20 case studies on the adoption of environmental innovations were carried out. Case studies, for each sector in each country, consisted of SME that had adopted a particular environmental innovation. The role of the different actors as well as the internal factors driving the process was studied. The case studies were followed by a quantitative survey among 500 European SMEs in the sectors studied, in order to test and generalise a couple of hypotheses developed in the previous phase. On the basis of the 20 case studies three key determinants of the environmental innovativeness of European SMEs were identified. They are represented in the figure 3, the so called environmental innovation triangle. The three determinants are:
Environmental orientation (environmental management, a pro-active policy which goes beyond compliance with legislation);
Business competence (differentiated into motivation, knowledge and power); Network involvement (both the quality of the network and active use of the
network)
17 EIM 1998, The adoption of environmental innovations by small and medium-sized enterprises.

Governmental measures to stimulate SMES
18
Figure 3. The environmental innovation triangle
INNOVATIVENESS
Environmental orientation(depends on perceived environmental pressure,business strategy and market situation)
Network involvement(relates to the number of actorsa firm consult)
Business competence(consists of motivation to innovate, knowledgeto innovate -information control- and -financial-power to innovate)
Source: EIM Business & Policy Research, 2005
Environmental orientation One of the most significant observations in the case studies was that the adoption of environmental innovations was embedded in the SMEs’ business strategic decision-making18, even when the adoption had been triggered by regulatory pressure. To focus on the environmental element of the process, the strategic element in the triangle has been reduced to a company’s environmental orientation. The anticipation on future regulations and the assessment of one’s position in the market and value chain determined how the environmental element was dealt with. For example, electroplating firms operating in markets with low added value tend to comply with regulation in a defensive manner, i.e. they act on a short term cost control basis. On the other hand, another case involved an electroplating firm that had made the environment a key element of its business strategy. For this company ‘environment’ served as a competition parameter.19 Business competence Business competence refers to the capacity to establish an internal adoption processes and to develop cooperative relations with external resources. The knowledge and skills of a firm’s employees constitute the backbone of such capacity. However, it also involves organisational routines, which may be related to corporate values and norms. In many adoption processes SMEs have ample practical knowledge on the available production and supportive processes, whereas science-based technological knowledge on materials and processes is underrepresented. However, suppliers of equipment often offer the latter knowledge. 18 Because of that, the specific relationship between the adopted environmental innovation and a company’s objectives may vary considerably. 19 It should be noted that two types of electroplating companies were part of the case studies: the so-called piece workers and the more integrated plants. The company that had made environment a key element of its business strategy was a so-called integrated plant.

Governmental measures to stimulate SMES
19
Because of a lack of knowledge, SMEs tend to have difficulties in identifying and assessing available options. Therefore, companies tend to be conservative and to give priority to already known technologies. New technologies are taken on board when the equipment supplier is able to communicate on the merits and limitations of the new equipment or procedures. A possible policy response to this is the development of infrastructures that can function as gatekeepers and sources of information. There are different examples of such institutions and how they have played a positive role in an adoption process. For instance, there are knowledge and regulatory networks developed in the area of electroplating (water cleaning techniques) in the UK, the Netherlands and Denmark. However, it is the better endowed SMEs who succeed in making use of these networks. In other words, it takes business competence to attract the necessary expertise from the network. Network involvement The network relations of a firm influence the adoption of environmental innovations in every stage.20 They are important in the beginning of an adoption process when a company gathers information on possible solutions. When it comes to implementing new technologies, the network relations also may play a pivotal role. Identification of external resources and the building up of new relations have been crucial elements in a great part of the studied adoption processes. Often these have been mediated by other actors (such as environmental authorities, customers, consultants). The company’s networks can be divided into three main networks: the business network, the knowledge network and the regulatory network. In practice, there may be gaps between these networks, which may hamper viable adoption processes. Business networks may be isolated from research circuits, as a result of which new knowledge may not be fed into company-based product design or production systems. Regulatory networks may operate without involving the business or knowledge networks. 4.2 General interrelations
There is a dynamic interaction between the three dimensions: environmental orientation, business competence and network involvement. For example, a company’s competences and network relations define the contours of the set of strategic options. On the other hand, a company’s strategic orientation influences the kinds of competences and external network relations that are developed. Moreover, internal competences define the ability to build and benefit from external relations. Competences of the firms are extended by their external competences. Two hypotheses were defined and tested in the quantitative stage among 500 European SMEs: (1) business competence and environmental orientation have a positive effect on network involvement, and (2) the levels of business competence, environmental orientation and network involvement are positively related to a firm’s innovativeness. Both hypotheses were confirmed by the data.
20 Network relations may be long lasting, but need to be activated to be effective. They may contain (social) elements of trust and reciprocity, but also interdependency. A company’s network relations can be considered as both a resource, enhancing one’s competences and a playing field setting the boundaries of one’s innovative activities.

Governmental measures to stimulate SMES
20
4.3 Country-specific and sector-specific interrelations
In the quantitative stage 527 SMEs were been interviewed by telephone, divided among the four sectors and five countries involved. The questionnaire consisted of several questions on the issues of environmental orientation, business competence and network involvement. On the basis of the answers of the entrepreneurs, three indexes were computed.21 Due to the sample selection, both country-specific as well as sector-specific conclusions can be drawn with respect to the relative importance of the determinants of the environmental innovation triangle (IT). Table 5 presents the results for the five countries involved. Table 5 Relative importance of the determinant of the IT among five countries
Total Denmark Italy Portugal Netherlands U.K. Environmental orientation index 54 58 63 47 52 50
Business competence index 56 64 53 54 56 56
Network involvement index 46 51 55 40 49 40
Source: EIM Business & Policy Research, 2005
Table 5 shows different indices across the five countries. For example, the environmental orientation index is the highest in Italy and the lowest in Portugal. Yet, business competence is the highest in Denmark and lowest in Italy and network involvement is the highest in Italy and the lowest in Portugal and the U.K. (N.B. For a more elaborated discussion on the country-specific interrelations, we refer to the original report.) Also different sector-specific interrelations have been found. Table 6 shows the correlations between the three determinants of the innovation triangle and the environmental innovativeness of the companies in the sectors involved. 4.4 Conclusions
The three drivers behind environmental innovativeness correspond closely to the three barriers defined in chapter 3. For example, environmental orientation corresponds closely to the little external pressure; business competence corresponds to the cost perception of SMEs and network involvement to the importance of the professional surroundings. Moreover, the ENVIS study clearly shows different patterns among countries and sectors with respect to the environmental innovativeness of companies. This would suggest that universal relationships across SMEs with respect to the adoption of environmental technologies do not exist, and – probably more important – that governmental measures that aim to stimulate environmental technologies should take a sector’s specific structure into account.
21 For example, the environmental orientation index refers to the following questionnaire statements: “we have a clearly stated environmental policy”, “we have implemented an environmental management system”, and “we are ahead of legal environmental requirements”.
21
5 GOVERNMENTAL MEASURES TO STIMULATE SMES
5.1 Introduction
This chapter provides an inventory of governmental measures developed in the European Union to encourage the adoption of environmental technologies by SMEs. The inventory is not an exhaustive list of all available measures, but provides an overview of the wide variety of existing measures. 127 measures, divided among 18 Member States have been identified (Cf. Annex III). The following framework was used to describe these governmental measures: • Name of the measure; • Country of origin; • Period of operation, goal and objectives, type of the measure; • Target groups; • Characteristics of the organisation responsible; • External funding included? • Effects; • To what extent have goals and target groups been reached? • Are there evaluation studies available? • What are main conclusions from these studies? • Have adjustments to the measure been made? • Contact information. 5.2 The collection and selection process
The following databases and sources have been consulted: • OECD: the EEA database on instruments used in environmental policy; • European Commission (Cordis): inventory of measures that have been developed
in the context of the encouragement of SME participation; • Technopolis inventory: this contains a collection of policy instruments for
sustainable innovation that was made in the context of the Informal European Environmental Council in 2004 (Dutch Presidency);
• The European Environment Agency: although the agency does not maintain a database on specific measures, the information system of this Agency proved to be useful because it contains the most significant policy documents of each country.
• Google Alert: with respect to environmental innovations in SMEs. Three criteria have been used during the collecting and selecting process. The measures should: • Stimulate innovation, and research and development; • Stimulate sustainability within businesses; • Be intended for SMEs, or define SMEs as a particular target group. Many governmental measures were not developed solely with environment purposes. Some also explicitly stimulate the competitiveness and innovativeness of companies and business sectors. Figure 4 provides an overview of the scope of the inventory.

22
Figure 4: Scope of the inventory
Source: EIM Business & Policy Research, 2005
During the collection and selection process it was found that it was not always desirable to draw the division line very strictly. Firstly, it proved to be difficult to differentiate measures, which strictly promote the adoption of environmental technologies from measures that are more directed towards innovation.22 Secondly, many measures promoted both the development of new technologies and its adoption. Thirdly, many governmental measures were intended for SMEs as well as for large enterprises. In order to prevent the exclusion of some appealing examples the scope of the inventory has been extended in some occasions. The close relationship between the promotion of innovation and sustainability was particularly found in New Member States. As an example, Hungary can be mentioned. The Hungarian Development Plan has set out an overall strategy with regard to entrepreneurship. In this Plan the issue of sustainability is dealt with together with other important aspects of economic development. (Annex I provides a brief overview of the relationships and developments in the field of sustainability within 18 Member States.) 5.3 Measures identified
Eighteen Member States were included in the inventory (see Table 7). Most of the 127 measures found originated from the Netherlands, Denmark, United Kingdom and Hungary. Yet, it would be too optimistic to regard the number of measures found as 22 Most Member States have placed the promotion of innovation in a broader context that just the strengthening of sustainability. In fact, many Member States aim to improve the competitiveness of their economies by stimulating the introduction of new technologies. Innovations in the field of sustainability are just one field of interest.

23
an indication of the State’s effort to stimulate sustainable entrepreneurship within SMEs. Table 7 127 governmental measures found in 18 Member States23
Country Number of measures
The Netherlands 19
Denmark 12
United Kingdom 10
Hungary 10
Germany 9
Spain 9 Portugal 7 Ireland 7 France 7 Belgium 6 Poland 6 Czech Republic 6 Finland 5 Luxembourg 4 Sweden 4 Italy 2 Austria 2 Greece 2 Total 127
Source: EIM Business & Policy Research, 2005
The distinction between governmental measures and measures promoted by private organizations to improve the adoption of environmental technologies by SMEs was sometimes difficult to make. The inventory includes both types of measures. Most Member States have developed broad action programmes for the promotion of sustainable entrepreneurship. Many of the 127 measures that have been found in the inventory were embedded in such contexts. Sometimes these programmes are promoted and initiated by ministries such as the Ministry of Economy or the Ministry of Environment. More frequently these programmes are fostered by specialized organizations, which are usually attached to these ministries. An example is the Spanish Centre for the Development of Industrial Technology, which is an agency of the Ministry of Science and Technology.
23 Measures that increase sustainability, for example, through zone planning, the promotion of regional economic development, raising public awareness among civilians, or by setting up regulations with regard to specific products (such as chemicals and pesticides) were not included in the inventory. It should be mentioned, however, that in some Member States comprehensive actions have been set up to raise awareness among consumers in order to stimulate them to purchase from ‘green’ companies. Some appealing measures in this area have been found in Denmark but have not been included in this inventory.

24
Table 8 provides an overview of the specialized organizations in the 18 Member States. Table 8: Specialized organizations concerned with SME programmes
Austria The Federal Ministry of Economic Affairs; Austrian Research Promotion Agency; Austrian Energy Agency.
Belgium The Flemish Institute for Environmental Research, the Institute for the Promotion of Innovation by Science and Technology in Flanders
Czech Republic Association for Innovative Enterprising (AIE CR)
Denmark Danish Environmental Protection Agency; Industrial Promotion Agency, Ministry of Science Technology and Innovation
Finland National Technology Agency of Finland (TEKES)
France The French Agency for Innovation (OSEO anvar); The Ministries of Industry, SMEs and Research
Germany Deutsche Bundesstiftung Umwelt; Federal Ministry of Education and Research; Federal Ministry for the Environment, Nature Conservation and Nuclear Safety
Greece General Secretariat for Research and Technology; Centre for Renewable Energy Sources; EOMMEX (The Hellenic Organization of SMEs and Handicraft)
Hungary Agency for research, fund management and research exploitation (KPI); National Office for Research and Technology (NKTH)
Ireland Sustainable Energy Ireland, Environmental Protection Agency
Italy Regione Lombardia; INNOVA SPA– Technology transfer, Valorisation and Innovation
Luxembourg Centre de Ressources des Technologies pour l’Environement (CRTE); UXINNOVATION (Agence nationale pour la promotion de l’innovation et de la recherché
Netherlands SenterNovem; Syntens; Ministry of Economic Affairs; Ministry of Housing, Spatial Planning and the Environment
Spain Centre for the Development of Industrial Technology (CDTI)
Sweden Swedish Business Development Agency (NUTEK), Swedish Energy Agency (STEM) Swedish Environmental Protection Agency (EPA-SW)
Poland Agency for Enterprise Development (PAED) Portugal Integrated Programme for Innovation (PROINOV) United Kingdom The Small Business Service (SBS); Department of Trade and Industry.
Source: EIM Business & Policy Research, 2005
5.4 Types of instruments
Sustainable entrepreneurship is stimulated by various measures. As Table 9 shows, the subsidy is the most frequently used (83). Other types of measures, which stimulate entrepreneurs to adopt environmental technologies, are fiscal incentives (9) and loans or guarantees for bank loans (12). Thirteen measures have been found that promote sustainability by advice and knowledge capacity building or by stimulating the transfer and interaction between businesses and research institutes. Furthermore, four measures were found that used publicity campaigns to raise environmental
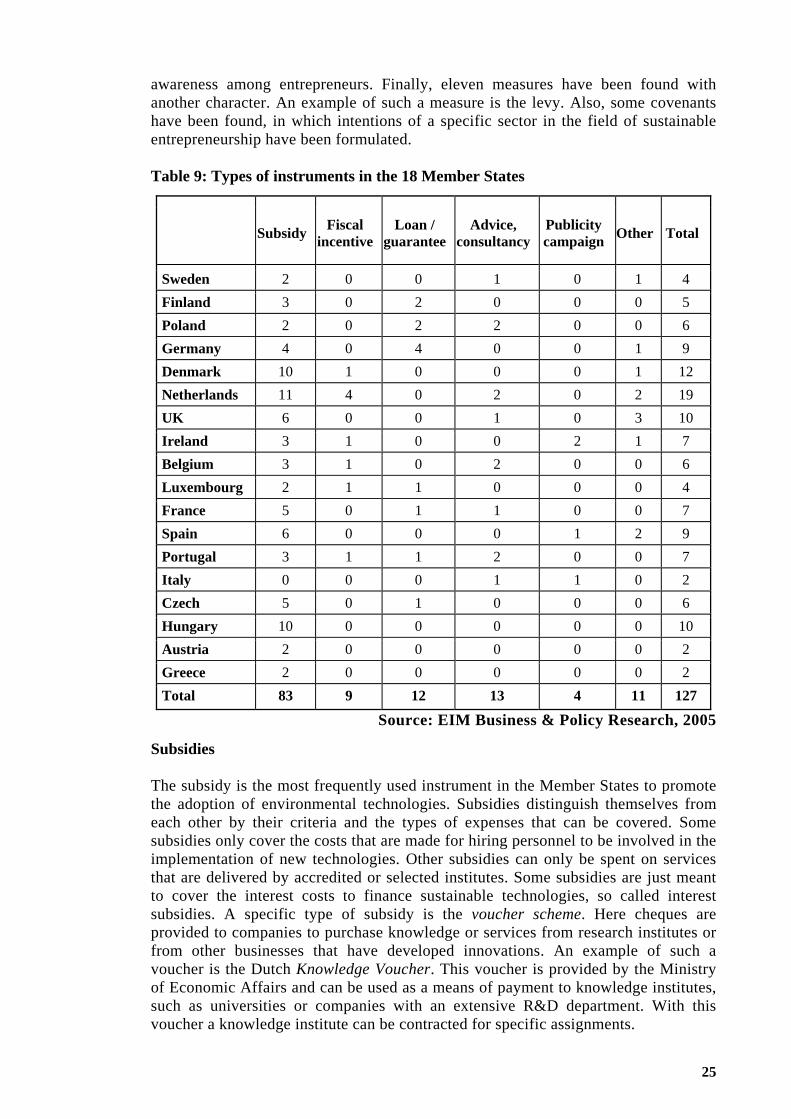
25
awareness among entrepreneurs. Finally, eleven measures have been found with another character. An example of such a measure is the levy. Also, some covenants have been found, in which intentions of a specific sector in the field of sustainable entrepreneurship have been formulated. Table 9: Types of instruments in the 18 Member States
Subsidy Fiscal incentive
Loan / guarantee
Advice, consultancy
Publicity campaign Other Total
Sweden 2 0 0 1 0 1 4 Finland 3 0 2 0 0 0 5 Poland 2 0 2 2 0 0 6 Germany 4 0 4 0 0 1 9 Denmark 10 1 0 0 0 1 12 Netherlands 11 4 0 2 0 2 19 UK 6 0 0 1 0 3 10 Ireland 3 1 0 0 2 1 7 Belgium 3 1 0 2 0 0 6 Luxembourg 2 1 1 0 0 0 4 France 5 0 1 1 0 0 7 Spain 6 0 0 0 1 2 9 Portugal 3 1 1 2 0 0 7 Italy 0 0 0 1 1 0 2 Czech 5 0 1 0 0 0 6 Hungary 10 0 0 0 0 0 10 Austria 2 0 0 0 0 0 2 Greece 2 0 0 0 0 0 2 Total 83 9 12 13 4 11 127
Source: EIM Business & Policy Research, 2005
Subsidies The subsidy is the most frequently used instrument in the Member States to promote the adoption of environmental technologies. Subsidies distinguish themselves from each other by their criteria and the types of expenses that can be covered. Some subsidies only cover the costs that are made for hiring personnel to be involved in the implementation of new technologies. Other subsidies can only be spent on services that are delivered by accredited or selected institutes. Some subsidies are just meant to cover the interest costs to finance sustainable technologies, so called interest subsidies. A specific type of subsidy is the voucher scheme. Here cheques are provided to companies to purchase knowledge or services from research institutes or from other businesses that have developed innovations. An example of such a voucher is the Dutch Knowledge Voucher. This voucher is provided by the Ministry of Economic Affairs and can be used as a means of payment to knowledge institutes, such as universities or companies with an extensive R&D department. With this voucher a knowledge institute can be contracted for specific assignments.

26
Fiscal incentives Nine fiscal incentives have been identified in the inventory. A fiscal incentive consists of the possibility for an entrepreneur to deduct investments (partly or wholly) from the taxable corporate income. Some regulations allow entrepreneurs to spread out such a deduction over several years. In most countries this incentive is developed within the context of economic policy and is meant to promote innovation and research and development in general terms. In the Netherlands three fiscal incentives have been developed that are particularly meant for environmental innovations. Another fiscal incentive that specifically addresses sustainability is the Flemish Tax Exception Scheme. Here the corporate income that is subject for taxation can be reduced to 26% of the investments in environmental technologies. Consultancy; providing assistance and information In some Member States the promotion of sustainable entrepreneurship is also fostered by more immaterial means. Here organizations have been set up that provide information and advice to entrepreneurs about the need for sustainability and the way they could improve their business processes. Some of these organizations are attached to a ministry, whereas others are private companies. These companies are often indirectly funded by subsidies that are provided to entrepreneurs. The Swedish Environment Driven Business Development Plan is an example of an agency that provides such services. Loans (or guarantee for bank loans) Generally two types of loans have been found. Some loans are directly provided by government or agencies. Here budgets have been reserved that can be lent to business under conditions that are generally more favourable for lenders than commercial conditions. Other loans are provided by financial institutions with the help of governments. Here the government (or agencies) acts as a guarantor. An example of a loan is the French ATOUT procedure (technology diffusion within SMEs). Within this scheme loans and subsidies are provided to improve the technological level of SMEs. In the Netherlands some loans have been replaced by guarantee schemes. A major advantage of these schemes is that they require a small budget. Covenants With a covenant, public authorities and businesses formulate an agreement on principles with regard to a certain field. Many covenants are about labour relations or address issues in the field of sustainable and reliable entrepreneurship. In the Netherlands a covenant specifically deals with sustainable entrepreneurship. Businesses that have signed this covenant commit themselves to pay attention to sustainability, particularly while purchasing goods and services. The interest of participating in a covenant is less materialistic than participating in other schemes (such as subsidy programmes). Although the covenant generally lacks means of coercion towards entrepreneurs, it is assumed that businesses that participate are more willing to integrate the interest of sustainability into their strategy. However, no covenant has been identified that specifically aims to promote the adoption of technologies among SMEs. It is therefore unclear whether this instrument will be successful in this specific field.

27
Combining instruments within measures The distinction made in Table 9 is somewhat artificial because various measures have been found with a multiple character. Sometimes the provision of subsidies is combined with advice and assistance in searching appropriate partners. An example of such measures, where various kinds of support have been combined, is the Swedish programme Environmental Management in Small Companies (NUTEK) In the context of this programme three types of services are provided: information and dissemination through a telephone service and seminars; financial support for specific projects and the support of network building among entrepreneurs and public bodies. A total of 25 combined instruments within measures have been found in the inventory. The most frequently found combination is the subsidy scheme combined with loans or advisory services (see Table 10). Table 10: Types of combined measures
Combinations of Subsidy Consultancy Publicity campaign Loan Other Total
Subsidy 0 6 0 8 2 16 Consultancy 2 0 1 0 1 4 Publicity campaign 1 0 0 0 1 2 Loan 3 0 0 0 0 3 Total 6 6 1 8 4 25
Source: EIM Business & Policy Research, 2005
5.5 Policy context of the measures
In the inventory one can distinguish measures that are developed from an environmental point of view and measures that are developed in the context of entrepreneurial policies and the strive for competitiveness. The first group of measures primarily exists to explore and adapt new technologies which could be used to decrease the environmental burden of business processes. Many of these measures are developed in the context of environmental programmes initiated by ministries or agencies that are concerned with the environment. Many of these initiatives stimulate companies to adapt technologies to reduce the use of energy or emissions. An example of such a measure is the Swedish Environment Driven Business Development. Within this scheme the Swedish government attempts to integrate environmental values into the core business strategy of SMEs. Other programmes and measures have been developed in the context of a Member States’ economic policy to promote business innovation. The adaptation of new technologies is generally regarded as a major condition for economic growth and competitiveness. For example, the Polish Loan for innovative investments is primarily meant to support business innovation. This scheme, primarily designed to stimulate competitive entrepreneurship, has the potential to encourage the adoption of environmental technologies.

28
As Table 11 shows, 50% of the measures identified have been primarily developed in the context of entrepreneurial policies. Table 11: Policy context of measures
Number of measures
Measures developed in the context of environmental policies 53
Measures developed in the context of entrepreneurial policies. 63
Measures developed in a multidisciplinary context 7 Context unknown 4 Total 127
Source: EIM Business & Policy Research, 2005
From the selected Member States, the Czech Republic, Greece, Hungary, Luxembourg, Poland, Portugal and Spain have mainly developed measures in the context of economical development. In three of them, Poland, the Czech Republic and Greece, environmentally driven measures were not identified in this study. To who are the measures addressed? The inventory was meant to include measures that are directed towards SMEs. Yet, not all measures are exclusively meant for SMEs. About one-fifth of all measures are directed towards both public and private organizations. Only 57 measures are solely focused at SMEs. Seventeen measures have been found that have a specific business sector as target group. As Table 12 shows, five measures are primarily meant for research institutes. These measures aim to stimulate institutes such as universities and technicians to tune their research to the specific needs of enterprises. Table 12 Defined target groups in the 127 measures
Number of measures
Both public and private organizations 27 SMEs and large companies 23 SMEs 55 Specific sectors 17 Research institutes 5 Total 127
Source: EIM Business & Policy Research, 2005
The measures that are particularly meant for SMEs do not always necessarily address the barriers to adopt environmental technologies. Most of these measures simply exclude the larger enterprises. An exception is the Portuguese CRAFT Programme24. This programme is particularly meant to overcome the financial difficulties SMEs face when investing in new technologies. 24 CRAFT is partly funded (50%) by the European Commission

29
5.6 Reviewing the evaluations
Most evaluations that were found in the inventory were not complete or comprehensive. Many gave only a general overview on the number of applicants and funds that were spent. From 45% of all measures no information was available about the outcomes of the measure at all (see Table 13). Table 13 Availability and general conclusions evaluation studies
Evaluated? Positive Neutral Negative Yes 71 63 6 2 No 32 Unknown 24 Total 127
Source: EIM Business & Policy Research, 2005
Based on the available evaluation studies, an inventory is made on the most frequently detected constraints that were met. Attention for sustainability recedes quickly In the evaluation of some measures, the lack of attention for the environment among entrepreneurs is explicitly mentioned as a point of concern. It appears that the consciousness of entrepreneurs remains limited, despite their participation in projects. The attention recedes soon after a project has been finalized. Some initiatives pay attention to this concern. An example of such an initiative is the Swedish Environmental Management Systems Programme. This programme aims to integrate environmental concerns into the mainstream business strategy. Governments have an idealistic view on entrepreneurship It appears that entrepreneurs are generally less interested in public goals than is often assumed by governments. In some cases the objectives governments set proved to be unrealistic and far off the direct interests of single enterprises. As an example the Belgium Presti programme can be mentioned. A conclusion that was drawn on the experiences with this measure was that targets should be based on a realistic view on values that exist among entrepreneurs. Particularly SMEs proved to be a difficult target group. Acquaintance with the schemes The participation of entrepreneurs in projects remains often limited because entrepreneurs are not aware of them. Besides the lack of spreading factual information on the measures, it appears that insufficient attention is given to the promotion and marketing of measures. In many cases it is not clearly communicated what benefits entrepreneurs will enjoy when participating in the scheme.

30
Addressing the specific needs of smaller enterprises The success of measures often depends on the extent the SME barriers are adequately recognized. Although many measures that have been selected are particularly meant for SMEs, most of them do not explicitly address their specific needs. Lack of technical knowledge among implementing agencies In some cases a lack of technical knowledge among implementing agencies hampered the coordination and communication with the applicants. In these cases companies expressed a need for more technical assistance. Reluctance of entrepreneurs to participate in public programmes Few studies revealed that entrepreneurs are reluctant to participate in public programmes. In order to get entrepreneurs more involved in the coordination and planning of programmes, it has been considered in Belgium to add entrepreneurs in the steering committee that monitors the implementation of a programme. One of the factors that lead to a negative attitude is the administrative burden for the applicants. Most measures require a comprehensive account to be delivered periodically. SMEs lack the administrative capacity to comply with these requirements. Evaluation studies The quality of the evaluation studies needs attention. In order to get insight in the elements that determine a measure’s success, more detailed information is needed. No conclusions can be drawn on elementary indicators such as number of participants and the budget that was spent. In order to assess the success of a measure in a reliable way, its evaluation study should consist of elements such as its efficiency and an inventory of constraints that hamper the participation or integration of sustainable innovation in the daily practice of enterprises. 5.7 Conclusions
The EIM inventory came up with 127 governmental measures that, in one way or another, are directed to SMEs adopting environmental technologies. Six types of instruments have been found, of which the subsidy is the most popular. Almost two third of the measures found consisted of a subsidy. In almost all countries subsidies have been identified. The 127 measures found are not solely directed to SMEs adopting environmental technologies. For example, Table 11 revealed that 50% of the measures found have been developed within the context of broad entrepreneurial policies. Moreover, only 57 measures are solely focused at SMEs, whereas 17 measures have been found that have a specific business sector as target group. Hence, both the target group SMEs and the policy field adopting environmental technologies does not seem to have a special place in the agenda of the Member States of the European Union. Most measures that have been identified lack a proper evaluation. Moreover, many measures have not been evaluated at all or their implementation is briefly described by numbers of applicants and budgets spent. Thus far, none of the Member States have established an adequate methodology for evaluating these measures.

31
6 GOOD PRACTICES 6.1 Introduction
This chapter deals with the identification of governmental measures and the selection of good practices for the promotion of the adoption of environmental technologies, including an analysis of their effectiveness and weaknesses. In order to select a set of good practices out of the inventory, selection criteria have been defined steaming from the barriers SMEs face in adopting environmental technologies. Section 6.2 will describe the selection criteria together with an analysis of their relationships, whereas section 6.3 briefly elaborates on these criteria. Section 6.4 presents five good practices that correspond closely to the defined selection criteria. Finally, section 6.5 presents the conclusions. 6.2 Five selection criteria
Based on the barriers identified in chapter 3, five selection criteria have been formulated. Below, these criteria are summarized by one word, accompanied with a brief explanation of its contents: - PRESSURE: “to what extent do governmental measures increase the
environmental pressure on SMEs?” - INTEREST: “to what extent do governmental measures increase the interest of
SMEs in environmental issues?” - SURROUNDINGS: “to what extent do governmental measures make use of the
professional surroundings of SMEs with respect to adopting environmental technologies?”
- INFORMATION: “to what extent do governmental measures increase the information about environmental technologies of SME entrepreneurs?”
- BENEFITS: “to what extent do governmental measures increase the benefits for SMEs to adopt environmental technologies?”
The above order of the criteria is not completely arbitrary. It is assumed that SMEs will ‘move’ towards adopting environmental technologies either:
• because they have to do so (PRESSURE). • because they feel that it is how they should act (INTEREST). • because they think it is profitable (BENEFITS).
Most SMEs act in an environmentally friendly manner within the boundaries of environmental legislation or business-to-business relationships. Only few entrepreneurs adopt environmental technologies because of their positive attitude towards the environment (sustainable entrepreneurship, which could be considered a form of corporate social and environmental responsibility - CSR). The cost-benefit analysis, including indirect costs as qualifying employees and indirect benefits as a better image, of the new environmental technology determines the adoption of a certain technology. However, the entrepreneur will only make such an analysis if he/she is motivated enough or under pressure to look for environmental technologies. Figure 5 aims to visualize the relationships between the five selection criteria. As can be seen (in the end) the decision to adopt an environmental technology is based on

32
the perceived costs and benefits. Yet, the judgment to look for an environmental technology depends on the interest assigned by SME entrepreneurs to adopting such technologies. This interest, or motivation to act, can be influenced by information, by the surroundings, and by the pressure to act in a more environmentally friendly manner. Figure 5: Relationships among the five selection criteria
INTEREST
ADOPTION
SURROUNDING
BENEFITS
INFORMATION
PRESSURE
Source: EIM Business & Policy Research, 2005
In Table 14, all 127 governmental measures found in the inventory have been confronted with the selection criteria. As can be seen, most of the measures in the inventory are directed on influencing the outcome of the cost-benefit analysis, either through providing subsidies or fiscal incentives. Providing information to SME entrepreneurs or stimulating information transfers is also a widely used measure to stimulate the adoption of environmental technologies. Increasing the interest in environmental issues of SMEs is less widely used, whereas using the surroundings of SMEs or increasing the external environmental pressure on SMEs has been hardly or not at all found. Table 14 Measures and their relation to the five selection criteria
Number of measures
Pressure 0 Interest 21 Surroundings 4 Information 46 Benefits 106
Source: EIM Business & Policy Research, 2005
It should be noted that some of the measures found in the inventory are related to more than one selection criteria.

33
6.3 Elaborating on the selection criteria
Pressure Governmental measures can increase directly or indirectly the pressure on SMEs to improve their environmental performance. Directly, governments can tighten up existing environmental regulations. Yet, when it comes to stimulating environmental technologies no coercive governmental measures have been found in the inventory. Using the indirect way, governments can try to stimulate the stakeholders of SMEs to increase the pressure on them, for example, by pushing customers (through public campaigns) to buy green products or by stimulating or forcing the key companies in business-to business relationships.25 Another alternative that fits within these selection criteria is green public procurement (GPP),26 where public contracting authorities take into account environmental elements when procuring goods and services. Although tightening up environmental legislation is generally regarded as an effective way to realize environmental standards, governments are reluctant to apply this instrument on SMEs because it may deteriorate a country’s entrepreneurial climate and hamper its competitive position in relation to third countries. In the inventory no measure was found that corresponds to these selection criteria. Interest It is difficult to increase the interest in environmental issues by SMEs, especially when these companies are only indirectly affected by such issues. Generally, two alternative routes can be followed: the first one is providing additional information on the benefits of becoming a more environmentally friendly company or on the environmental costs within the company; the second one is increasing the environmental pressure on SMEs (see above). One option is to inform the SME entrepreneur about the general benefits of becoming a more environmentally friendly company, for example, by improving their image among his customers and consequently increasing the turnover. Another option is to disentangle the environmental costs for the company to make the entrepreneur aware of these costs: the so-called environmental accounting. Such information could stimulate the entrepreneur to reduce these costs by adopting environmental technologies. Yet, in the inventory carried out no such accounting measure was found. Whereas many measures in the inventory aim to increase the adoption of environmental technologies within SMEs, only few measures explicitly focused on 25 In some business sectors regulations exist to save the sector from calamities or a bad image. Sometimes this kind of self-regulation is recorded in a code of conduct. Other sectors maintain a certification scheme and execute inspections among their members to monitor a proper compliance. In order to minimize the administrative burden that comes along with regulations, governments put a lot of emphasis on the idea of self-regulation. In the field of environmental technologies and SMEs thus far no such self-regulation initiatives have been found in the desk research. 26 see: http://europa.eu.int/comm/environment/gpp

34
influencing the operational business processes of companies. Most measures, such as the Flemish Ecology Premium, limit their focus to a single part of the production process. Whether entrepreneurs incorporate environmental issues into their business strategy plan is not taken into account. A weakness of measures that focus upon influencing the business process as a whole, are their relatively high costs. Seriously affecting corporate values requires a tailor made approach. Because of this, relatively few businesses can be served within the measure. An example of a measure that scored on the interest selection criteria is the Environment Driven Business Development Programme (see section 6.4). Surroundings It is generally agreed upon that the professional surroundings of SMEs have an important influence on the opinions of the SME entrepreneur. This statement holds especially with respect to environmental issues due to the low environmental involvement and knowledge of most SME entrepreneurs. Making use of the influence the professional surroundings SMEs have implies knowing the “agenda” of the stakeholders involved (e.g. accountants, suppliers, bank officials, trade associations). The better the measure corresponds to these agenda’s, the more effective the measure will be. A good example is the Dutch MIA/VAMIL scheme. VAMIL is a tax incentive that can be provided to entrepreneurs who invest in a particular environmental technology. The ministry involved has drawn listings of technologies that are eligible for this scheme. SMEs’ suppliers use the listings to stimulate entrepreneurs to purchase their (listed) environmental technology (see section 6.4). Trade associations are a route commonly followed by national governments to influence SMEs. Usually, these associations are used to explain new environmental regulations, but not to stimulate directly the use of environmental technologies. Information Providing information to the SME entrepreneur with respect to new environmental technologies is a widely used measure in the Member States. About 15% of the identified measures in the inventory aim to provide information about the use of environmental technologies. The provision of information about environmental technologies may lead to a change among SMEs that otherwise would not have invested in such technologies. Whereas other types of measures, such as subsidies, assist entrepreneurs in realizing investments that they already intended to make, informative measures try to persuade entrepreneurs to reposition their views. One strength of these measures is the relatively high share of lump sum costs. After the initial investments have been made, it may serve as many companies as needed. The additional costs for every new applicant are limited as long as the information campaign doesn’t consist of tailor made consultancy services.

35
A weakness of measures that inform SMEs about the use of environmental technologies is that they are eminently non-committal. The amount of information provided will probably only lead to a shift in the entrepreneurs’ decisions if they already encompass some environmental interest. Hence, it is difficult to reach those SME entrepreneurs who are not interested in environmental technologies. An example of a measure in which information plays a major role is the British Envirowise scheme (see section 6.4). Benefits Most of the measures identified in the inventory aim at increasing the financial benefits of adopting specific environmental technologies. Fiscal incentives and subsidies are the most significant examples. A clear advantage of financial incentives is that they directly help entrepreneurs to strengthen their profitability. Although the advantages for entrepreneurs who apply are inevitably clear, experience shows that governments have to make substantial efforts to get the participation on a desired level. This is because most SMEs are not aware of such schemes. Sometimes, potential applicants are held back by the conditions posed and the administrative procedures involved. In order to overcome these constraints some schemes have simplified the application procedure. For example, the Flemish Ecology Premium became more accessible after entrepreneurs were enabled to apply via the Internet. Two examples of such measures are the Austrian Contracting Scheme and the Flemish Ecology Premium (see section 6.4). 6.4 Good practices
The 127 measures of the inventory have been confronted with the five selection criteria. The confrontation revealed that most of the 127 measures corresponded to one (83 measures) or two (40 measures) criteria. In fact, only two measures satisfied three criteria and just two measures satisfied four criteria. Apart from the few measures that satisfy most criteria also other measures that can be regarded as good practice of the criteria met have been described. None of the measure identified satisfy the pressure criteria.

36
Table 15 Measures and their relation to the five selection criteria
Pressure Interest Surroundings Information Benefits Environment-driven Business Development (Sweden)
Envirowise (U.K.) MIA & VAMIL scheme (The Netherlands)
Ecology Premium (Belgium)
Energy Performance Contracting (Austria)
Source: EIM Business & Policy Research, 2005
Table 15 shows the five measures that will be described, together with their scores on the five criteria. Environment-driven business development (Sweden) The Swedish programme ’Environment-driven business development’ aims at strengthening the competitiveness of SMEs through stimulating product and business development from the perspective of sustainability. The programme distinguishes itself from other measures in the inventory because it gains insight in the businesses operations and the way these could be affected to diminish the environmental burden. Another special element of the programme is its integral approach. Whereas most measures are directed towards one or two environmental issues, the Swedish programme intends to examine the whole business process on environmental grounds. Besides physic features of machines, this programme intends to incorporate the environmental interest into management, marketing and the consciousness of employees. Also the possibilities for commercializing new products and services that foster the environment are looked at. The aim of the programme is formulated as follows: “to boost the competitiveness of small and medium sized enterprises by encouraging operational and product development from the point of view of sustainability.” The programme was directed towards two themes: “Environmentally sound products as a competitive device” and “Operational development focusing on continuous improvements”. In the context of the first theme SMEs were encouraged to make environmentally friendly product development a natural part of their operations. The programme consisted of assistance to companies to help them to market these new products and services. The aim of the projects that have been developed in the context of the second theme was to encourage, measure and continuously improve operational environmental management. Target group The programme is directed towards SMEs, in particular to those SMEs that have an open mind for environmental friendly entrepreneurship and already have some form

37
of environmental and quality management system. The programme was launched in the spring of 2001. By the end of 2004, 390 SMEs had participated. Experiences Based on the experiences with the SMEs involved, the factors that determine the extent an entrepreneur adopts a more environmental friendly operational management style were analysed. The extent to which a company changes and incorporates environmental values heavily depends on its consciousness at the start of the project. Projects that are led by experienced managers that are more committed to the subject are more likely to become successful. Other factors with a significant influence proved to be: the commitment of the top management, the dedication of key individuals and change agents and the extent to which companies already experienced environmental benefits. Envirowise (United Kingdom) Envirowise offers companies free, independent advice and support to minimize waste and increase profits. The most important part of the programme is to provide information (best practices, case studies, and handbooks) about proven cost-effective measures that have reduced waste and therefore improved environmental performance. Another important part of the programme the financial assistance provided for developing new environmental technologies. Envirowise distinguishes itself from other information measures because of its broad character. It is not a single-issue activity but merely a programme that contains various activities. Within the Envirowise programme the following activities have been developed and can be provided without costs to entrepreneurs: - Fast track visits: Envirowise consultants provide companies with on-site reviews
to help them to review their business processes, identify the amount of waste and highlight potential savings. The visits are primarily aimed at SMEs, but are open to any company genuinely committed to reducing waste.
- The Envirowise helpline: this helpline is for entrepreneurs that need advice on environmental management and waste minimization. The helpline consists of a panel of specialists that work through waste problems with the aim to find profitable solutions. Many entrepreneurs have made use of this initiative. The helpline receives more than 700 calls weekly and its guides and brochures were disseminated among thousands of companies.
- Besides these two activities Envirowise runs and attends various events per year. They range from visits to companies who successfully reduced waste, to training workshops on specific issues, to attending the trade fairs of different industrial sectors.
Target group

38
No specific target groups have been identified. Information on waste and energy minimization is available for all British businesses. There is one exception; companies with over 250 employees are not eligible for a Fast Track Visit. Results Envirowise exists for more than a decade. The scheme offers advices to hundreds of businesses annually. It has been estimated that the Envirowise message has reached more than 140,000 companies in the U.K. through the media, seminars, events, advertising and partner organizations. Specific services have been delivered by on-site visits, the helpline, seminars, workshops and other events. The Envirowise organization claims that its efforts have contributed: • To a reduction of 2.4 million tonnes solid waste production per year since 1994, • To a fall of water consumption and effluent production by a total of 68 million
cubic meters, • To a fall of raw materials by 855,000 tonnes per year. Accelerated depreciation on environmental investments (MIA/VAMIL) MIA and VAMIL are two separate measures to promote the use of environmental technologies by Dutch companies. Although MIA and VAMIL have been introduced separately in the Netherlands, these measures have many similarities. VAMIL is a measure enabling a company to freely determine the depreciation period of the invested environmental technology that is on an official ministry listing. Consequently, VAMIL can offer entrepreneurs a financial advantage as technologies can be depreciated more quickly. Although it is difficult to determine the precise advantage that is gained by using a VAMIL technology - the benefits depend largely on the specific conditions under which the entrepreneurs apply for VAMIL - generally the advantage is estimated between 3 to 8% of the investments made. MIA enables companies to deduct environmental investments partially. The benefits that can be gained via the MIA scheme depend on the investment and the applied tax scheme (corporate tax or income tax). The percentages of the investment that can be deducted from taxes are explicitly determined and mentioned in the ‘Environment list’. Depending on the investment and applied technology, entrepreneurs can deduct 15, 30 or 40%. In 2003 the average benefit as a result of MIA was 10% of the investment. Responsible authorities The Ministry of Housing, Spatial Planning and the Environment, the Dutch Tax Authority and SenterNovem are responsible for both MIA and VAMIL. The ministry updates the listings of environmental technologies yearly. Entrepreneurs who invest in environmental technologies can check whether the respective technology is included in the so-called ‘Environment list’. Usually, this is done by the supplier of the technology, who has an own interest in convincing the entrepreneur to buy the environmental technology. It should be noted that the Ministry of Housing, Spatial Planning and the Environment allows suppliers to actively use the environment list. If a technology is included in this list the entrepreneur can apply. This should be done within three months after the investment. Information of the applicants that make use

39
of the schemes is sent to SenterNovem, who carries out random inspections, such as technical inspections on the spot. Target group Both schemes are accessible for all business. Yet, most applicants (93%) are SMEs. The MIA and VAMIL schemes are most used by companies in the agricultural sector.27 The data over 2003 reveal that 77% of all applicants belonged to this sector. Results Around 15,000 entrepreneurs have applied for MIA in 2003. This number was somewhat higher for VAMIL (15,000). Over the period 2000-2003 the use of MIA grew slightly each year. The number of entrepreneurs that applied for VAMIL dropped in 2003 after some of the conditions had changed (due to budgetary cuts). Ecology Premium The (Flemish28) Ecology Premium is a subsidy provided to enterprises that invest in environmental technologies. Investments that are considered environmental supportive are eligible for application. Both material and immaterial environmental investments are applicable as long as they concern purchases from third parties under market conditions. The subsidy depends on the environmental performance of the technology. Each investment has an environmental performance factor. This performance factor is a qualitative indication that ranges between 0.6 and 1. The Flemish Department of Economic Support Policy has composed a list of environmental technologies and their performance factor. When a company applies for a subsidy to finance a technology that is not on the list, its environmental effects must be investigated. Procedures Entrepreneurs can apply for the ecology premium at the Flemish government. In order to reduce the administrative burden the government has launched a website. The application procedure starts when an entrepreneur has registered his company at this website. After approval a login-ID and a password are provided. With this password the entrepreneur can apply for a premium on-line. The opportunity to apply on-line is one of the features that have improved access. Furthermore the number of specifications that have to be delivered by the entrepreneur has been limited. Target group The ecology premium is meant for all Flemish companies with a government participation that does not exceed 25%. SMEs can receive a subsidy with a maximum of 35% of the investments that are made. For larger companies this maximum is set on 25%. Besides these percentages, the subsidy cannot exceed the amount of 3.6 million Euros. Whether the maximum percentages are granted depends on the performance factor. Note that the percentages can be heightened if a company is certified according to ISO-14001 and or EMAS.
27 Trade associations within this sector are eager to stimulate companies to use this fiscal instrument. 28 Flanders is the Dutch speaking community in Belgium.

40
Results The scheme has not been evaluated yet. However, in 1998 an evaluation study was carried out on the precursor of the scheme: the Presti Decree. The study revealed that the measure has made a difference. It made entrepreneurs more conscious and stimulated them to undertake actions to diminish their environmental burden. Energy Performance Contracting The Austrian Energy Performance Contracting Scheme is primarily meant to diminish the risks that come along with investments in energy savings. In energy performance contracting, the whole project - from planning to implementation - is financed by the contractor. The additional costs are offset by the companies’ energy savings. Contracting is a way to diminish the financial barriers to invest in energy savings. In fact the scheme enables entrepreneurs to invest without approaching their financial resources. The Austrian contracting scheme consists of two kinds of contracting: performance contracting and installation contracting.
In Performance contracting the contractor implements measures to reduce the energy costs, and is reimbursed through the savings that are made. The service that is provided by the contractor includes financing of energy saving measures, planning and implementation, service and maintenance. The entrepreneur, who acts as a client, is given the guarantee that energy saving targets will be met, and that he will not be liable if they are not.
In Installation contracting the contractor implements, operates and finances a specific energy savings installation. The client pays for the energy supplied, the price of which is calculated from the energy costs, the rate at which the investments start to pay off, and the costs of all services provided by the contractor. When the contract expires, two options are offered: an extension of the contract or a purchase of the energy system installation by the client.
Procedure Any building owner or administrator can apply for energy contracting. The Austrian Organization for Environment and Technology (OGUT) has developed a manual for organizations who intent to apply contracting. This manual describes the various steps to be taken, starting with an analysis of the energy consumption of the company. When this analysis learns that investments in energy saving technologies can be profitable, the entrepreneur may look for an investor. In a brochure OGUT provides advice that may help to find a suitable partner. Target group Thus far contracting has been employed mainly in the public sector (national, regional and local government). Yet, it can also be used in the private sector. When the annual energy consumption of a company exceeds € 20,000, it might be valuable to carry out an analysis of the saving potential. Results Since 1997, contracting had become a frequently used tool in optimizing and modernizing federal and municipal buildings in Austria. More than 1,000 buildings have been energy-optimized using this tool. Most of the contracts are still active. Lately, the administration of the scheme discovered SMEs as an interesting target group. Yet, the awareness and interest of SMEs in this scheme is modest

41
6.5 Conclusions
Part III of the study has resulted in five selection criteria and five good practices. Probably the most salient conclusion, which resulted from the five selection criteria, is that none of the 127 measures of the inventory corresponds to the pressure criteria. This is remarkable, as it is generally agreed among SME experts and policy makers that most SMEs will only move towards a more environmentally friendly behaviour if they are pressed to do so. However, Member States in the European Union instead of more stringent environmental regulations rather use positive incentives to adopt environmental technologies. Providing subsidies and information about environmental technologies are the most frequently developed and used measures in the European Union. Using the influence of the surroundings of SMEs is less frequently developed, whereas the VAMIL scheme shows that suppliers of technologies will use, if available, official environmental listings. Trying to increase the SMEs’ interest (interest criteria) in environmental issues is probably the most difficult thing to do. The Swedish example learns that it can be effective, but only among a very small number of SMEs. These measures necessarily have to be tailor-made. The five examples of good measures clearly show that throughout the European Union interesting measures are being developed and used. Yet, these measures are certainly not bounded to the borders of the Member States. For example, the VAMIL scheme as well as the Ecology premium, and the Envirowise scheme can easily be copied in other Member States.


43
ANNEXES Annex I: Sustainability policies
This annex provides a brief overview of the relationships and developments in the field of sustainability within 18 Member States. Austria The Austrian policy towards sustainability thus far depended on several specific and isolated measures. The promotion of a more environmental friendly attitude within the various business sectors seems to get a minor priority. The efforts mainly consist of subsidies for companies who invested in sustainable production processes or technologies. Belgium From the various Belgium regions, Flanders has developed the most active approach when it comes to the promotion of sustainable entrepreneurship and innovation. Here agencies, such as IWT and VITO exist that are specialized in the promotion and supporting of innovations within businesses. Some of the programs, like PRODEM, are particularly concerned with the promotion of sustainable technologies. Czech Republic In the Czech Republic implementation of environmental policies and measures is gradually becoming a necessary condition for maintaining the competitiveness. Some of the political documents focused on environmental protection are guided by the principles of sustainable development. The National Development Plan of the Czech Republic includes an overview of measures that have already been taken by the Government to stimulate more environmental technologies. Denmark Since the 1980s environmental policy has become more integrated into other policy fields, including industrial and technology policy. Both government and industry state that environmental regulation could be used to establish competitive advantages in the environment. This understanding changed the environmental policy in Denmark from environmental protection based on regulation to supply and demand policies based on fostering pollution prevention and technological innovations. Finland In Finland environmental policy is largely implemented with the active involvement of the industry (e.g. voluntary agreements on energy conservation, extended producer responsibility). Furthermore, economic instruments (Finland was the first country to introduce a CO2 tax in 1990) are becoming more important (further tax revision) in environmental protection. France The growing importance of sustainable development in France is supported by the implementation of a National Strategy for Sustainable Development (SNDD). Another characteristic of this Member State is the wide use of research and innovation networks, including institutions such as laboratories, companies,

44
educational and professional learning institutions as well as public agencies providing funds and sometimes also expertise. This policy tool is particularly well suited for coping with the cross-sectional and interdisciplinary issues of sustainable development and technological change. Germany In Germany investments in R&D and innovation as a percentage of value added is among the highest in the European Union. In the area of environmental innovations, measures have been identified in the federal government's climate protection programme and in the draft of the national strategy on sustainability. An interesting example of what is perceived as a new way to deal with sustainability is the RTD-programme “Research for the environment”. It is organized as a cross-departmental environmental research programme integrating a wide range of research fields and addressing various aspects of sustainability. Greece In Greece, there are not many innovative sustainable innovation policy instruments. Yet, the latest programme within the Operational Program “Competitiveness” (included in the 3rd Community Support Framework (2000-2006) does concern energy and sustainability, but does not address the promotion and support of clean technologies. Hungary The measures that have been found in Hungary sometimes have a broader aim than the stimulation of sustainable entrepreneurship. Most measures stimulate entrepreneurship in general. Among the objectives that haven been formulated within the framework of the measures are: strengthening competitiveness and regional cohesion. It seems that the promotion of sustainable innovation is just a way of realizing those aims. Ireland The integration of environmental considerations into other policy areas is a key means of securing balanced development in Ireland. These principles are now incorporated in the strategies with regard to economic development and entrepreneurship. Agencies such as ‘Enterprise Ireland’ and ‘Forbairt’ developed programmes and initiatives to foster the development and implementation of sustainable technologies. Italy In Italy an 'Innovation System for Sustainability' seems to have evolved only in the last decade. Compared to other Member States thematically oriented R&D programmes seem to play a minor role in the Italian system. Bottom-up project funding as well as the establishment of fairly focused research organizations (e.g. ENEA) with a strong regional anchoring seem to prevail. Furthermore legislation and taxation (e.g. carbon tax) has played an important role in creating additional demand for environmental technology. Luxembourg The environmental policy and measures are based on the Environmental policy plan from 1999. SMEs policy with its SMEs action plan (updated in 2001) was used as a basis for some innovation measures, such as start-up loans. Greening of the taxes and an environmental investment funds are the most important economic instruments.

45
Netherlands: The Dutch policy to stimulate environmental technologies in SMEs basically rests on three pillars. First of all there are two fiscal instruments (VAMIL, EIA/MIA), which stimulate the entrepreneur to choose for environmental technologies that are on a pre-defined list. Next to these instruments there is Syntens (a national public agency). As an independent party with an active, broad and strong network, it accompanies entrepreneurs who want to innovate. Recently, Syntens introduced Innovationnet, which is a digital consultant that helps entrepreneurs who want to innovate. Recently so-called knowledge-vouchers were introduced in order to stimulate the network involvement of SMEs. Poland Sustainable development is among the priorities of governmental policies in Poland, which is reflected in numerous programme documents. Yet, there are not so many measures and financial incentives for achieving environmental friendly technology innovations, mainly because the financial conditions are still not very stable and because of the weaknesses of the financial institutions supporting innovation. Portugal Most of the public modes of intervention in Portugal are still very much directed at economic convergence, more than environmental convergence. The sustainable development objective has been mainly pursued in the last decade through EU-supported environment infrastructure works, such as water supply and treatment systems or waste treatment systems. Environment regulations have also been put in place recently, again driven by EU directives. As far as the development and diffusion of clean technologies is concerned, no significant programmes or initiatives were found. Spain The pillars of Spanish environmental policy are related to renewable energy sources as well as to technologies allowing greater energy efficiency and saving. The Spanish environmental policy relies heavily on subsidies and other type of governmental transfers (see OECD international survey reports). Another specificity of Spanish policy is the great responsibilities given to the 17 autonomous regions to implement their environmental policies. Sweden In 1999 the Swedish government announced that Sweden should pioneer the adjustment to ecologically sustainable development and must link environment and economic growth. Several issues are important to reach this goal. First of all, each sector (transport, energy, tourism) is responsible for preventing outburst of new environmental problems and to solve existing problems. Second, industry must recognize the advantages of green production and must show environmental responsibility. Third, consumers must be encouraged to demand environmental sound and resource-efficient products. United Kingdom Since 1997 UK’s environmental policy has changed as there is an increasing acceptance of the need to set targets for environmental improvement (e.g. climate change, transport, waste minimization). Private companies become more actively involved and contribute to the implementation of the environmental policy, because

46
they begin to see environmental protection as a voluntary rather than mandatory action (encouraged by the government). Finally, in addition to direct policy instruments (mainly regulation) indirect policy measures are becoming more important in environmental policy (e.g. various fiscal measures).

47
Annex II: Proceedings of the Expert Workshop Introduction
About 15 experts in the field of SMEs and environmental issues attended the workshop Promoting environmental technologies in SMEs. The participants came from a variety of Member States, namely: Austria, United Kingdom, France, Finland, Hungary, Spain, Sweden, Ireland, and the Netherlands. Moreover, different representatives from the European Commission (ETAP, DG Environment, and DG Enterprise) attended the workshop. (Annex II presents the list of participants.) The experts invited, consisted of persons who were concerned with policy making in the field of SMEs and environmental issues as well as of persons who were responsible for specific governmental measures. The objectives of the workshop were three-fold:
Discussing the key findings of the study by exchanging experiences. Discussing four good practises and developing new ideas. Creating a level playing field.
The programme of the workshop29
The workshop started with a presentation of the representative of DG Environment (Mr. Jakub Wejchert) who stressed the importance of SMEs in ETAP. Thus far the role of SMEs was somewhat underexposed, although various initiatives to better involve SMEs were under construction. Mr. Ruud Hoevenagel and Mr. Guido Brummelkamp (both EIM Business & Policy Research) presented the first three parts of this report: - The identified key barriers The barriers identified in the study were confirmed by the experts from the Member States. Yet, it was argued that SMEs are less homogeneous than suggested by the key barriers. It was underlined that most enterprises in the European Union are indeed very small. A question arose as to whether sector-specific measures could be a solution to the barriers mentioned. - Selection criteria and an overview of the 127 measures identified: A discussion arose on the issue of how to put environmental pressure on SMEs, as these criteria was considered to be one of the most challenging. It was questioned whether governments could use the instrument of green public procurement to put pressure on SMEs. Also the role of using the influence of trade associations was stressed by some experts.
29 Annex III provides an overview of the programme of the workshop

48
- Good practices: After this, representatives of specific governmental measures (corresponding to four of the five good practices in chapter 6) presented their measure including an analysis of the strengths and weaknesses. Successively, the MIA/VAMIL scheme, the Environment-driven business development programme, Envirowise and Contracting were presented. Mrs. Rianne Dobbelsteen (Netherlands Ministry of Housing, Spatial planning and the Environmental) presented four key factors of success with respect to the Dutch MIA/VAMIL scheme: easy access, low administration costs, clear technology list and simple enforcement. Consequently, in 2003:
1.1 billion Euros were invested in environmental technologies of the technology-list.
8,000 enterprises, of which 95% SMEs applied for this instrument. 350 new techniques were proposed by suppliers to be listed on the technology
list. Another success of this scheme relates to its large multiplier effect: only a small amount of tax money is needed to trigger many private investments. A weakness (or limitation) of this scheme is its focus on capital goods, on proved techniques and on companies that make a profit. In principle this scheme could be transferred to other Member States. In a reaction to this presentation Mrs. Josefina Lindblom (IPTS) mentioned the fear of industrial trade associations as well as of industrial companies that policy makers could choose specific environmental technologies (e.g. by using lists as in the Dutch model) that may block the development of other technologies that might have been better in the long run. According to Mrs. Dobbelsteen, in the VAMIL scheme there is no need for such a fear as companies are not forced to use the environmental technologies on the list. Moreover, Mr. Guido Brummelkamp added to this remark that no such “forced” technology measures have been found in the EIM inventory. Mr. Stefan Henningsson (NUTEK) presented the Environment-driven Business Development Programme (Swedish measure to stimulate environmental management strategies in business). This ongoing three-year programme uses as its target group: Swedish proactive SMEs with respect to environmental issues. The programme started with 161 SME-applications, which finally resulted in 34 projects. In January 2005:
390 SMEs were actively involved in the programme. 106 company case studies have been conducted. 34 enhanced tools for environment-driven business developments were
established. 58 new products (goods and services) were designed for the environment. 75 companies had an environmental product documentation system.
Whereas the results of this programme are impressive, the key bottleneck is its little ’SME range’. The programme has been proven to be successful for proactive SMEs with respect to environmental issues. The key question is: to what extent is it possible to use this kind of programme for the main group of SMEs, at reasonable costs?

49
Mrs. Eleanor Morris (Envirowise) presented the key results of the Envirowise programme. The Envirowise message has reached an estimated 140,000 businesses in the UK, through the media, seminars, events, and advertising and partner organizations. Over the last four years, awareness of Envirowise in key market sectors has raised four fold. Mrs. Morris stressed the fact that the hard work of more than a decade is paying off. To date, the programme has helped U.K. businesses to realize savings of £1.4 billion. This figure rises continuously by almost £ 300 million every year. This positive track record has led to increased funding for 2006. Finally, Mr. Marton Varga (Austrian Energy Agency) presented the key findings of Energy Performance Contracting (EPC). Thus far this contracting scheme has been very successful for public buildings in Austria. About 230 federally owned buildings are already under an EPC contract, and the guaranteed energy costs savings are about 20%. Points of concern with respect to developing EPC for private buildings are:
Lack of awareness (among SMEs). Lack of finance. Relatively high acquisition costs for the contractor. Short time span. Energy costs are a minor part of total business costs.
Note that in order to be successful with EPC (1) there should be some potential savings to be realized and (2) the time span for the contract is usually 5 to 10 years. Conclusions of the workshop
After the six presentations, the workshop ended with a discussion on the key issues of this study: how to overcome the key barriers SMEs face when adopting environmental technologies. The chair of the workshop, Mr. Rob van der Horst (EIM Business & Policy Research) summarized the discussion by presenting the following key conclusions. Pay more attention to the heterogeneity of SMEs The experts stressed the fact that SMEs are heterogeneous in nature. They range from a self–employed craftsman without employees applying an ancient technology, to a high-tech company with 240 employees exporting to countries all over the world, and everything in between. There are sometimes large differences between the business processes. Various experts assumed that the adoption of environmental technologies will increase when measures are designed more tailor-made with respect to the various sectors. Increase awareness among SMEs Among SMEs there is a lack of awareness with respect to existing governmental measures that stimulate the adoption of environmental technologies. Whereas many of these measures have been evaluated positively, the average application rate of SMEs is low. Envirowise seems a positive exception with 140,000 contacts. Increasing the awareness of SMEs is considered very important by the experts. Pressure: a stubborn bottleneck The need for environmental pressure was emphasized by the experts. Although it seems unrealistic to expect a more stringent legislation with regard to environmental investments, the experts mentioned other ways to overcome this bottleneck:
Use green public procurement with respect to environmental technologies.

50
Use the influence of trade associations. Use the influence of business-to-business pressure.
Focus more on the surroundings of SMEs The success of the Dutch MIA/VAMIL scheme is mainly based on the implicit support of suppliers. As soon as a technology is included in the technology-list, the suppliers of these environmental technologies will promote MIA/VAMIL among SMEs (their clients). The usefulness of the surroundings of SMEs is still underexposed. Use environmental consciousness as a market value SMEs are profit driven (“go where the money is”). Hence, stressing the benefits of an environmental image might stimulate SMEs to adopt environmental technologies. It should be noted that the environmental soundness of a company may be a decisive argument for clients and customers to buy products. Some experts suggest that governments should anticipate more on this mechanism. Exchanging experiences is important The need to exchange the experiences obtained in the Member States with respect to stimulating the adoption of environmental technologies was put forward by some experts. Sometimes it is easier to translate existing successful governmental measures than to develop new ones (e.g. MIA/VAMIL, Envirowise). On the other hand, in order to be more successful, the inventory carried out for this study should be extended to more unconventional measures. Measures are too much cost-oriented Although it is acknowledged that SMEs are cost-oriented with respect to environmental technologies, the experts confirm the notion that too many measures are oriented towards financial support. No new measures A final conclusion which arose in the discussion was that it was not regarded necessary to come up with a new European Union-wide measure to stimulate the adoption of environmental technologies. It was generally felt that enough measures have been developed thus far. The experts preferred that one should learn from the experiences of existing measures rather than developing new ones. Participants of the workshop
Mrs S. Dunne Enterprise Ireland Mr P. Mickwicz Finnish Environment Institute Mrs M. Hibbey Ministry of Economy and Transport, Hungary Mr J. Mérillot ADEME, France Mr S. Henningsson NUTEK, Swedish Agency for Economic and Regional Growth Mr M. Varga Austrian Energy Agency

51
Mrs E. Morris Envirowise, United Kingdom Mrs R. Dobbelsteen Netherlands Ministry of Housing, Spatial planning and Environment Mr I. Isusi IKEI, Spain Mrs M. Tomikova Ministry of Industry and Trade, Czech Republic Mrs P. Písová Ministry of Industry and Trade, Czech Republic Mrs J. Lindblom IPTS, Spain Mr A. Vettori European Commission (DG Environment) Mr J. Wejchert European Commission (DG Environment) Mr A. d'Angelo European Commission (DG Enterprise) Mr R. van der Horst EIM Business & Policy Research Mr R. Hoevenagel EIM Business & Policy Research Mr G. Brummelkamp EIM Business & Policy Research

52
Annex III: Overview of all 127 measures
Nr. Country Name Type Target group
1 Austria Contracting subsidy both public and private organisations
2 Austria The Programme Technologies for Sustainable Development: sub programme Factory of Tomorrow
subsidy both public and private organisations
3 Belgium Presti Degree subsidy specific business sector(s) 4 Belgium OVAM, Public Waste Agency consultancy all private companies 5 Belgium Advisory Service by Regional Development Agencies consultancy just SMEs 6 Belgium Promotion of ecological investments subsidy just SMEs 7 Belgium Exception from taxes on investments.... fiscal incentive all private companies 8 Belgium PRODEM consultancy just SMEs 9 Belgium Cluster ecobuilding subsidy specific business sector(s) 10 Czech ZARUKA guarantee for
bank loan just SMEs
11 Czech TANDEM subsidy all private companies 12 Czech IMPULS subsidy all private companies 13 Czech PARK II subsidy just SMEs 14 Czech TECHNOS subsidy just SMEs 15 Czech Operational Programme Industry and Enterprise subsidy just SMEs 16 Denmark Energy subsidy scheme subsidy unknown 17 Denmark Danish Growth Fund subsidy just SMEs 18 Denmark Subsidies for energy efficiency in enterprises subsidy both public and private
organisations 19 Denmark Subsidy scheme for coverage of expend. to CO2 tax subsidy just SMEs 20 Denmark Approved Technological Service Institutes subsidy both public and private
organisations 21 Denmark 150% tax reduction on research expenditure fiscal incentive just SMEs
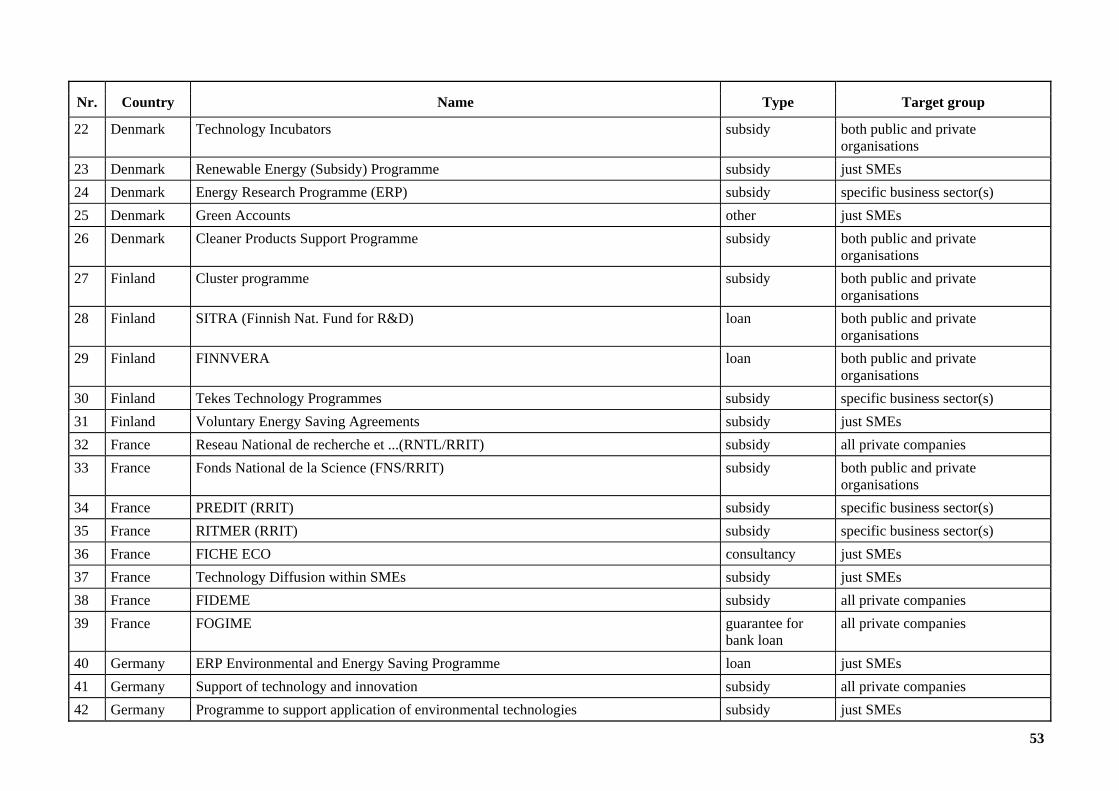
53
Nr. Country Name Type Target group
22 Denmark Technology Incubators subsidy both public and private organisations
23 Denmark Renewable Energy (Subsidy) Programme subsidy just SMEs 24 Denmark Energy Research Programme (ERP) subsidy specific business sector(s) 25 Denmark Green Accounts other just SMEs 26 Denmark Cleaner Products Support Programme subsidy both public and private
organisations 27 Finland Cluster programme subsidy both public and private
organisations 28 Finland SITRA (Finnish Nat. Fund for R&D) loan both public and private
organisations 29 Finland FINNVERA loan both public and private
organisations 30 Finland Tekes Technology Programmes subsidy specific business sector(s) 31 Finland Voluntary Energy Saving Agreements subsidy just SMEs 32 France Reseau National de recherche et ...(RNTL/RRIT) subsidy all private companies 33 France Fonds National de la Science (FNS/RRIT) subsidy both public and private
organisations 34 France PREDIT (RRIT) subsidy specific business sector(s) 35 France RITMER (RRIT) subsidy specific business sector(s) 36 France FICHE ECO consultancy just SMEs 37 France Technology Diffusion within SMEs subsidy just SMEs 38 France FIDEME subsidy all private companies 39 France FOGIME guarantee for
bank loan all private companies
40 Germany ERP Environmental and Energy Saving Programme loan just SMEs 41 Germany Support of technology and innovation subsidy all private companies 42 Germany Programme to support application of environmental technologies subsidy just SMEs

54
Nr. Country Name Type Target group
43 Germany 100.000 Roofs-Solar Energy Programme subsidy just SMEs 44 Germany DtA-Environmental programme loan just SMEs 45 Germany KfW-Envir Programme-Inv. credits for environmental saving loan both public and private
organisations 46 Germany Programme for stimulation of demonstration plans other both public and private
organisations 47 Germany Energy Research Programme (ERP) subsidy both public and private
organisations 48 Germany DBU loan just SMEs 49 Greece Support for the competitiveness of SMEs subsidy just SMEs 50 Greece Technological and organisational modernisation.... subsidy just SMEs 51 Hungary Interest subsidy to promote development of SMEs subsidy just SMEs 52 Hungary Regional Innovation Agencies subsidy both public and private
organisations 53 Hungary Innovation and research activities of SMEs subsidy just SMEs 54 Hungary Regional knowledge centres at Universities subsidy research institutes 55 Hungary Support to new, technology enterprises subsidy just SMEs 56 Hungary Environmental and materials research (NRDP) subsidy unknown 57 Hungary Application-oriented research and technology development subsidy all private companies 58 Hungary Cooperative Research Centres (KKK II) subsidy research institutes 59 Hungary Cooperative Research Centre (CRC) Scheme subsidy both public and private
organisations 60 Hungary Integrator Programme subsidy just SMEs 61 Ireland Sustainable Energy Ireland (SEI) publicity
campaign specific business sector(s)
62 Ireland Rural Environment Protection Scheme subsidy specific business sector(s) 62 Ireland Tax deduction fiscal incentive specific business sector(s) 63 Ireland IPV Licensing System other specific business sector(s)

55
Nr. Country Name Type Target group
64 Ireland Research Technology and Innovation Scheme (RTI) subsidy specific business sector(s) 65 Ireland Programmes in Advanced Technology subsidy specific business sector(s) 66 Ireland Technology Transfer Initiative (TTI) subsidy just SMEs 67 Ireland Envirocentre publicity
campaign just SMEs
68 Italy BASIS consultancy all private companies 69 Italy New clean technologies in the agro food sector publicity
campaign specific business sector(s)
70 Luxembourg
Medium and long term loans loan all private companies
71 Luxembourg
R&D incentive scheme subsidy both public and private organisations
72 Luxembourg
Innovation Loan subsidy both public and private organisations
73 Luxembourg
CRTE (Resource Centre for Environmental Technology) fiscal incentive just SMEs
74 The Netherlands
Innovatievoucher 2005/Kennisbon subsidy just SMEs
75 The Netherlands
Kennisvoucher subsidy just SMEs
76 The Netherlands
Milieu&Technologie Programma subsidy specific business sector(s)
77 The Netherlands
Innovatiesubsidie Samenwerkingsprojecten (IS) subsidy just SMEs
78 The Netherlands
Syntens (formerly Innovation Centre) other all private companies
79 The Netherlands
NEO (Nieuw Energie Onderzoek) subsidy all private companies

56
Nr. Country Name Type Target group
80 The Netherlands
Knowledge Transfer Entrepreneur SMEs subsidy just SMEs
81 The Netherlands
Innovation-oriented research programmes consultancy research institutes
82 The Netherlands
Subsidieregel kennisoverdracht Brancheorganisaties MKB subsidy just SMEs
83 The Netherlands
Transportbesparing subsidy specific business sector(s)
84 The Netherlands
Information centre for the environment consultancy both public and private organisations
85 The Netherlands
Green Investment Funds fiscal incentive all private companies
86 The Netherlands
Accelerated Depreciation on Environ. Innovations fiscal incentive just SMEs
87 The Netherlands
BioPartner subsidy just SMEs
88 The Netherlands
Grant Scheme environmental technology reference projects subsidy just SMEs
89 The Netherlands
Knowledge Carriers in SMEs subsidy just SMEs
90 The Netherlands
Environmental investment Scheme/Energy Inv. Deduct fiscal incentive just SMEs
91 The Netherlands
WSBO fiscal incentive all private companies
92 The Netherlands
MOVE subsidy all private companies
93 The Netherlands
Innovatienet / Stichting Innovatie Alliantie . .
94 Poland Phare 2002-SME and Innovation sectored programme subsidy just SMEs 95 Poland Loan for innovative investments loan just SMEs
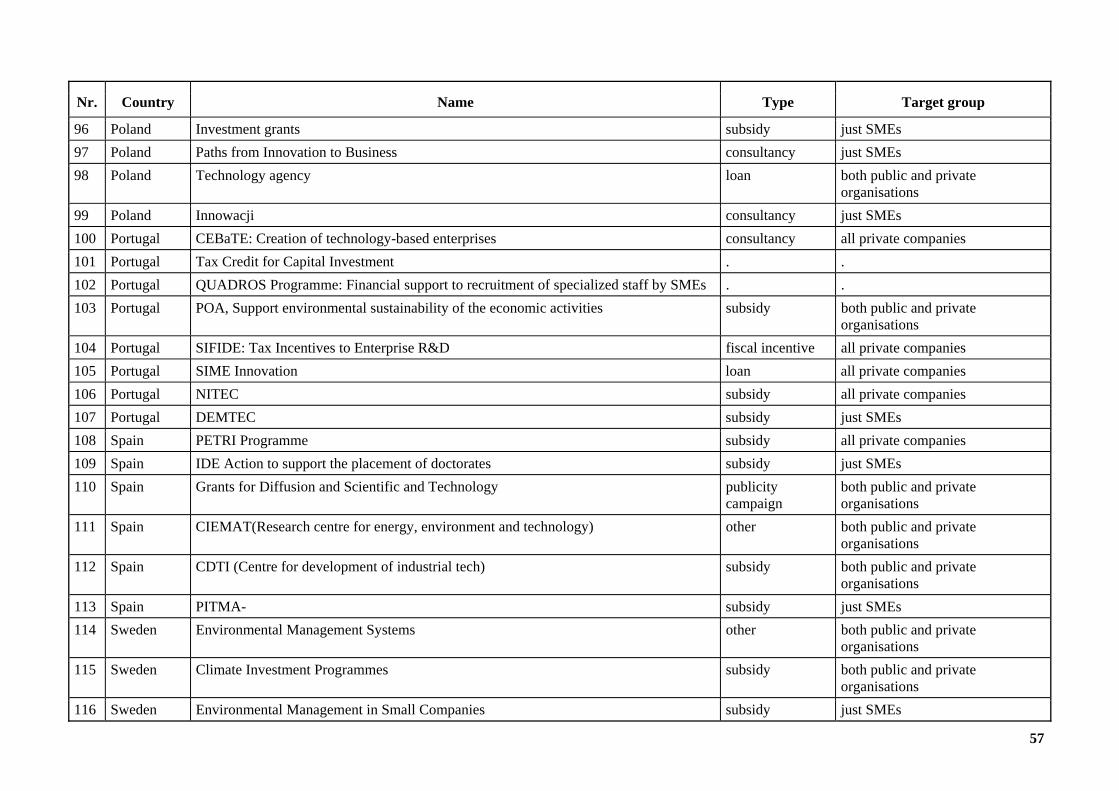
57
Nr. Country Name Type Target group
96 Poland Investment grants subsidy just SMEs 97 Poland Paths from Innovation to Business consultancy just SMEs 98 Poland Technology agency loan both public and private
organisations 99 Poland Innowacji consultancy just SMEs 100 Portugal CEBaTE: Creation of technology-based enterprises consultancy all private companies 101 Portugal Tax Credit for Capital Investment . . 102 Portugal QUADROS Programme: Financial support to recruitment of specialized staff by SMEs . . 103 Portugal POA, Support environmental sustainability of the economic activities subsidy both public and private
organisations 104 Portugal SIFIDE: Tax Incentives to Enterprise R&D fiscal incentive all private companies 105 Portugal SIME Innovation loan all private companies 106 Portugal NITEC subsidy all private companies 107 Portugal DEMTEC subsidy just SMEs 108 Spain PETRI Programme subsidy all private companies 109 Spain IDE Action to support the placement of doctorates subsidy just SMEs 110 Spain Grants for Diffusion and Scientific and Technology publicity
campaign both public and private organisations
111 Spain CIEMAT(Research centre for energy, environment and technology) other both public and private organisations
112 Spain CDTI (Centre for development of industrial tech) subsidy both public and private organisations
113 Spain PITMA- subsidy just SMEs 114 Sweden Environmental Management Systems other both public and private
organisations 115 Sweden Climate Investment Programmes subsidy both public and private
organisations 116 Sweden Environmental Management in Small Companies subsidy just SMEs

58
Nr. Country Name Type Target group
117 Sweden Environment driven business development consultancy just SMEs 118 United
Kingdom ENVIROWISE consultancy specific business sector(s)
119 United Kingdom
Bio energy Capital Grant Scheme subsidy just SMEs
120 United Kingdom
Energy Efficiency Best Practice Programme (EEBPP) subsidy just SMEs
121 United Kingdom
SMART subsidy just SMEs
122 United Kingdom
Environmental Action Plan (FAF) subsidy both public and private organisations
123 United Kingdom
Non-Fossil Fuel Obligation (NFFO) other both public and private organisations
124 United Kingdom
Energy Efficiency Commitment (EEC) subsidy just SMEs
125 United Kingdom
Climate Change Levy (industrial energy tax) other both public and private organisations
126 United Kingdom
Landfill Tax other just SMEs
127 United Kingdom
SCEEMAS subsidy just SMEs

European Commission EUR 22769 EN – DG Joint Research Centre, Institute for Prospective Technological Studies Title: Promoting Environmental Technologies in SMEs: Barriers and Measures Authors: Ruud Hoevenagel, Guido Brummelkamp, Anna Peytcheva and Rob van der Horst Editors: Josefina Lindblom and Luis Delgado Luxembourg: Office for Official Publications of the European Communities 2007 EUR - Scientific and Technical Research series; ISSN 1018-5593 ISBN 978-92-79-05693-2 Abstract This report which is based on a the study conducted by the EIM Business & Policy Research on behalf of the Joint Research Centre Institute for Prospective Technological Studies, is a contribution to the development of the European Environmental Technologies Action Plan, ETAP, (COM (2004) 38). Thus far the role of SMEs in ETAP is underexposed in spite of the fact that SMEs play a crucial role in the European Economy. This report provides the ongoing work on ETAP with a better understanding of the barriers SMEs face when adopting environmental technologies. It also provides an analysis of specific measures for the promotion of environmental technologies in European SMEs.
The mission of the JRC is to provide customer-driven scientific and technical support for the conception, development, implementation and monitoring of EU policies. As a service of the European Commission, the JRC functions as a reference centre of science and technology for the Union. Close to the policy-making process, it serves the common interest of the Member States, while being independent of special interests, whether private or national.
LF-NA
-22769-EN-C