Embed Size (px)
Citation preview

PROSETTA STONE® ANALYSIS REPORT A ROSETTA STONE FOR PATIENT REPORTED OUTCOMES
PROMIS ANGER AND BUSS PERRY AGGRESSION QUESTIONNAIRE
SEUNG W. CHOI, TRACY PODRABSKY, NATALIE MCKINNEY, BENJAMIN D. SCHALET, KARON F. COOK
& DAVID CELLA
DEPARTMENT OF MEDICAL SOCIAL SCIENCES FEINBERG SCHOOL OF MEDICINE
NORTHWESTERN UNIVERSITY
This research was supported by an NIH/National Cancer Institute grant PROSETTA STONE (1RC4CA157236-01, PI: David Cella). Authors acknowledge careful reviews, comments, and suggestions from Drs. Robert Brennan, Lawrence Hedges, Won-Chan Lee, and Nan Rothrock.

PROSETTA STONE®
– PROMIS ANGER AND BUSS PERRY AGGRESSION QUESTIONNAIRE
Table of Contents
Contents 1. Introduction .......................................................................................................................................... 3
2. The PRO Rosetta Stone Project ............................................................................................................. 3
2.1. Patient-Reported Outcomes Measurement Information System (PROMIS) ................................ 4
2.2. The NIH Toolbox for Assessment of Neurological and Behavioral Function (Toolbox) ................ 4
2.3. Quality of Life Outcomes in Neurological Disorders (Neuro-QOL) ............................................... 5
3. Legacy Instruments ............................................................................................................................... 5
3.1. Buss-Perry Aggression Questionnaire (BPAQ) .............................................................................. 5
4. Linking Methods .................................................................................................................................... 6
4.1. IRT Linking ..................................................................................................................................... 6
4.2. Equipercentile Linking ................................................................................................................... 7
4.3. Linking Assumptions ..................................................................................................................... 8
5. Linking Results ....................................................................................................................................... 9
5.5. PROMIS Anger and BPAQ ............................................................................................................ 10
5.5.1. Raw Summed Score Distribution ........................................................................................ 10
5.5.2. Classical Item Analysis ......................................................................................................... 11
5.5.3. Confirmatory Factor Analysis (CFA) .................................................................................... 11
5.5.4. Item Response Theory (IRT) Linking .................................................................................... 12
5.5.5. Raw Score to T-Score Conversion using Linked IRT Parameters ......................................... 14
5.5.6. Equipercentile Linking ......................................................................................................... 14
5.5.7. Summary and Discussion .................................................................................................... 15
6. Appendix Table 13: Raw Score to T-Score Conversion Table (IRT Fixed Parameter Calibration Linking) for BPAQ to PROMIS Anger (PROMIS Study). ................................................................................ 18
7. Appendix Table 14: Direct (Raw to Scale) Equipercentile Crosswalk Table - From BPAQ to PROMIS Anger (PROMIS Study). ............................................................................................................................... 19
8. Appendix Table 15: Indirect (Raw to Raw to Scale) Equipercentile Crosswalk Table - From BPAQ to PROMIS Anger (PROMIS Study) .................................................................................................................. 21

PROSETTA STONE®
– PROMIS ANGER AND BUSS PERRY AGGRESSION QUESTIONNAIRE
PRO Rosetta Stone (PROsetta Stone®) Analysis
1. Introduction A common problem when using a variety of patient-reported outcome measures (PROs) for diverse populations and subgroups is establishing the comparability of scales or units on which the outcomes are reported. The lack of comparability in metrics (e.g., raw summed scores vs. scaled scores) among different PROs poses practical challenges in measuring and comparing effects across different studies. Linking refers to establishing a relationship between scores on two different measures that are not necessarily designed to have the same content or target population. When tests are built in such a way that they differ in content or difficulty, linking must be conducted in order to establish a relationship between the test scores. One technique, commonly referred to as equating, involves the process of converting the system of units of one measure to that of another. This process of deriving equivalent scores has been used successfully in educational assessment to compare test scores obtained from parallel or alternate forms that measure the same characteristic with equal precision. Extending the technique further, comparable scores are sometimes derived for measures of different but related characteristics. The process of establishing comparable scores generally has little effect on the magnitude of association between the measures. Comparability may not signify interchangeability unless the association between the measures approaches the reliability. Equating, the strongest form of linking, can be established only when two tests 1) measure the same content/construct, 2) target very similar populations, 3) are administered under similar conditions such that the constructs measured are not differentially affected, 4) share common measurement goals and 5) are equally reliable. When test forms are created to be similar in content and difficulty, equating adjusts for differences in difficulty. Test forms are considered to be essentially the same, so scores on the two forms can be used interchangeably after equating has adjusted for differences in difficulty. For tests with lesser degrees of similarity, only weaker forms of linking are meaningful, such as calibration, concordance, projection, or moderation.
2. The PRO Rosetta Stone Project
The primary aim of the PRO Rosetta Stone (PROsetta Stone®) project (1RC4CA157236-01, PI: David Cella) is to develop and apply methods to link the Patient-Reported Outcomes Measurement Information System (PROMIS) measures with other related “legacy” instruments to expand the range of PRO assessment options within a common, standardized metric. The project identifies and applies appropriate linking methods that allow scores on a range of PRO instruments to be expressed as standardized T-score metrics linked to the PROMIS. This preliminary report encompasses the first wave of 20 linking studies based on available PRO data from PROMIS (aka, PROMIS Wave I), Toolbox, and Neuro-QOL.
PROSETTA STONE®
– PROMIS ANGER AND BUSS PERRY AGGRESSION QUESTIONNAIRE
2.1. Patient-Reported Outcomes Measurement Information System (PROMIS)
In 2004, the NIH initiated the PROMIS1 cooperative group under the NIH Roadmap2 effort to re-engineer the clinical research enterprise. The aim of PROMIS is to revolutionize and standardize how PRO tools are selected and employed in clinical research. To accomplish this, a publicly-available system was developed to allow clinical researchers access to a common repository of items and state-of-the-science computer-based methods to administer the PROMIS measures. The PROMIS measures include item banks across a wide range of domains that comprise physical, mental, and social health for adults and children, with 12-124 items per bank. Initial concepts measured include emotional distress (anger, anxiety, and depression), physical function, fatigue, pain (quality, behavior, and interference), social function, sleep disturbance, and sleep-related impairment. The banks can be used to administer computerized adaptive tests (CAT) or fixed-length forms in these domains. We have also developed 4 to 20-item short forms for each domain, and a 10-item Global Health Scale that includes global ratings of five broad PROMIS domains and general health perceptions. As described in a full issue of Medical Care (Cella et al., 2007), the PROMIS items, banks, and short forms were developed using a standardized, rigorous methodology that began with constructing a consensus-based PROMIS domain framework. All PROMIS banks have been calibrated according to Samejima’s (1969) graded response model (based on large data collections including both general and clinical samples) and re-scaled (mean=50 and SD=10) using scale-setting subsamples matching the marginal distributions of gender, age, race, and education in the 2000 US census. The PROMIS Wave I calibration data included a small number of full-bank testing cases (approximately 1,000 per bank) from a general population taking one full bank and a larger number of block-administration cases (n= ~14,000) from both general and clinical populations taking a collection of blocks representing all banks with 7 items each. The full-bank testing samples were randomly assigned to one of 7 different forms. Each form was composed of one or more PROMIS domains (with an exception of Physical Function where the bank was split over two forms) and one or more legacy measures of the same or related domains. The PROMIS Wave I data collection design included a number of widely accepted “legacy” measures. The legacy measures used for validation evidence included Buss-Perry Aggression Questionnaire (BPAQ), Center for Epidemiological Studies Depression Scale (CES-D), Mood and Anxiety Symptom Questionnaire (MASQ), Functional Assessment of Chronic Illness Therapy-Fatigue (FACIT-F), Brief Pain Inventory (BPI), and SF-36. In addition to the pairs for validity (e.g., PROMIS Depression and CES-D), the PROMIS Wave I data allows for the potential for linking over a dozen pairs of measures/subscales. Furthermore, included within each of the PROMIS banks were items from many other existing measures. Depending on the nature and strength of relationship between the measures, various linking procedures can be used to allow for cross-walking of scores.
2.2. The NIH Toolbox for Assessment of Neurological and Behavioral Function (Toolbox)
Developed in 2006 with the NIH Blueprint funding for Neuroscience Research, four domains of assessment central to neurological and behavioral function were created to measure cognition, sensation, motor functioning, and emotional health. The NIH Toolbox for Assessment of Neurological
1 www.nihpromis.org 2 www.nihroadmap.nih.gov

PROSETTA STONE®
– PROMIS ANGER AND BUSS PERRY AGGRESSION QUESTIONNAIRE
and Behavioral Function3 provides investigators with a brief, yet comprehensive measurement tool for assessment of cognitive function, emotional health, sensory and motor function. It provides an innovative approach to measurement that is responsive to the needs of researchers in a variety of settings, with a particular emphasis on measuring outcomes in clinical trials and functional status in large cohort studies, e.g. epidemiological studies and longitudinal studies. Included as subdomains of emotional health were negative affect, psychological well-being, stress and self-efficacy, and social relationships. Three PROMIS emotional distress item banks (Anger, Anxiety, and Depression) were used as measures of negative affect. Additionally, existing “legacy” measures, e.g., Patient Health Questionnaire (PHQ-9) and Center for Epidemiological Studies Depression Scale (CES-D), were flagged as potential candidates for the Toolbox battery because of their history, visibility, and research legacy. Among these legacy measures, we focused on those that were available without proprietary restrictions for research applications. In most cases, these measures had been developed using classical test theory.
2.3. Quality of Life Outcomes in Neurological Disorders (Neuro-QOL) The National Institute of Neurological Disorders and Stroke sponsored a multi-site project to develop a clinically relevant and psychometrically robust Quality of Life (QOL) assessment tool for adults and children with neurological disorders. The primary goal of this effort, known as Neuro-QOL3, was to enable clinical researchers to compare the QOL impact of different interventions within and across various conditions. This resulted in 13 adult QOL item banks (Anxiety, Depression, Fatigue, Upper Extremity Function - Fine Motor, Lower Extremity Function - Mobility, Applied Cognition - General Concerns, Applied Cognition - Executive Function, Emotional and Behavioral Dyscontrol, Positive Affect and Well-Being, Sleep Disturbance, Ability to Participate in Social Roles and Activities, Satisfaction with Social Roles and Activities, and Stigma).
3. Legacy Instruments The following instruments are widely accepted “legacy” measures that have been used as part of the initial validation work for PROMIS and Toolbox. Data were collected on a minimum of 500 respondents (for stable item parameter estimation) along with at least one other conceptually similar scale or bank.
3.1. Buss-Perry Aggression Questionnaire (BPAQ) The Buss-Perry Aggression Questionnaire (BPAQ) is a 29-item self-report measure that includes four subscales: physical aggression (9 items), verbal aggression (5 items), anger (7 items), and hostility (8 items) (Buss & Perry, 1992). There is no time frame specified, and items are rated using a seven-point scale from “extremely uncharacteristic” to “extremely characteristic”.
3 www.nihtoolbox.org
PROSETTA STONE®
– PROMIS ANGER AND BUSS PERRY AGGRESSION QUESTIONNAIRE
4. Linking Methods PROMIS full-bank administration allows for single group linking. This linking method is used when two or more measures are administered to the same group of people. For example, two PROMIS banks (Anxiety and Depression) and three legacy measures (MASQ, CES-D, and SF-36/MH) were administered to a sample of 925 people. The order of measures was randomized so as to minimize potential order effects. The original purpose of the full-bank administration study was to establish initial validity evidence (e.g., validity coefficients), not to establish linking relationships. Some of the measures revealed severely skewed score distributions in the full-bank administration sample and the sample size was relatively small, which might be limiting factors when it comes to determining the linking method. Another potential issue is related to how the non-PROMIS measures are scored and reported. For example, all SF-36 subscales are scored using a proprietary scoring algorithm and reported as normed scores (0 to 100). Others are scored and reported using simple raw summed scores. All PROMIS measures are scored using the final re-centered item response theory (IRT) item parameters and transformed to the T-score metric (mean=50, SD=10). PROMIS’s T-score distributions are standardized such that a score of 50 represents the average (mean) for the US general population, and the standard deviation around that mean is 10 points. A high PROMIS score always represents more of the concept being measured. Thus, for example, a person who has a T-score of 60 is one standard deviation higher than the general population for the concept being measured. For symptoms and other negatively-worded concepts like pain, fatigue, and anxiety, a score of 60 is one standard deviation worse than average; for functional scores and other positively-worded concepts like physical or social function, a score of 60 is one standard deviation better than average, etc. In order to apply the linking methods consistently across different studies, linking/concordance relationships will be established based on the raw summed score metric of the measures. Furthermore, the direction of linking relationships to be established will be from legacy to PROMIS. That is, each raw summed score on a given legacy instrument will be mapped to a T-score of the corresponding PROMIS instrument/bank. Finally, the raw summed score for each legacy instrument was constructed such that higher scores represent higher levels of the construct being measured. When the measures were scaled in the opposite direction, we reversed the direction of the legacy measure in order for the correlation between the measures to be positive and to facilitate concurrent calibration. As a result, some or all item response scores for some legacy instruments will need to be reverse-coded.
4.1. IRT Linking One of the objectives of the current linking analysis is to determine whether or not the non-PROMIS measures can be added to their respective PROMIS item bank without significantly altering the underlying trait being measured. The rationale is twofold: (1) the augmented PROMIS item banks might provide more robust coverage both in terms of content and difficulty; and (2) calibrating the non-PROMIS measures on the corresponding PROMIS item bank scale might facilitate subsequent linking analyses. At least, two IRT linking approaches are applicable under the current study design; (1) linking separate calibrations through the Stocking-Lord method and (2) fixed parameter calibration. Linking separate calibrations might involve the following steps under the current setting.
• First, simultaneously calibrate the combined item set (e.g., PROMIS Depression bank and CES-D).

PROSETTA STONE®
– PROMIS ANGER AND BUSS PERRY AGGRESSION QUESTIONNAIRE
• Second, estimate linear transformation coefficients (additive and multiplicative constants) using the item parameters for the PROMIS bank items as anchor items.
• Third, transform the metric for the non-PROMIS items to the PROMIS metric. The second approach, fixed parameter calibration, involves fixing the PROMIS item parameters at their final bank values and calibrating only non-PROMIS items so that the non-PROMIS item parameters may be placed on the same metric as the PROMIS items. The focus is on placing the parameters of non-PROMIS items on the PROMIS scale. Updating the PROMIS item parameters is not desired because the linking exercise is built on the stability of these calibrations. Note that IRT linking would be necessary when the ability level of the full-bank testing sample is different from that of the PROMIS scale-setting sample. If it is assumed that the two samples are from the same population, linking is not necessary and calibration of the items (either separately or simultaneously) will result in item parameter estimates that are on the same scale without any further scale linking. Even though the full-bank testing sample was a subset of the full PROMIS calibration sample, it is still possible that the two samples are somewhat disparate due to some non-random component of the selection process. Moreover, there is some evidence that linking can improve the accuracy of parameter estimation even when linking is not necessary (e.g., two samples are from the same population having the same or similar ability levels). Thus, conducting IRT linking would be worthwhile. Once the non-PROMIS items are calibrated on the corresponding PROMIS item bank scale, the augmented item bank can be used for standard computation of IRT scaled scores from any subset of the items, including computerized adaptive testing (CAT) and creating short forms. The non-PROMIS items will be treated the same as the existing PROMIS items. Again, the above options are feasible only when the dimensionality of the bank is not altered significantly (i.e., where a unidimensional IRT model is suitable for the aggregate set of items). Thus, prior to conducting IRT linking, it is important to assess dimensionality of the measures based on some selected combinations of PROMIS and non-PROMIS measures. Various dimensionality assessment tools can be used including a confirmatory factor analysis, disattenuated correlations, and essential unidimensionality.
4.2. Equipercentile Linking The IRT Linking procedures described above are permissible only if the traits being measured are not significantly altered by aggregating items from multiple measures. One potential issue might be creating multidimensionality as a result of aggregating items measuring different traits. For two scales that measure distinct but highly related traits, predicting scores on one scale from those of the other has been used frequently. Concordance tables between PROMIS and non-PROMIS measures can be constructed using equipercentile equating (Lord, 1982; Kolen & Brennan, 2004) when there is insufficient empirical evidence that the instruments measure the same construct. An equipercentile method estimates a nonlinear linking relationship using percentile rank distributions of the two linking measures. The equipercentile linking method can be used in conjunction with a presmoothing method such as the loglinear model (Hanson, Zeng, & Colton, 1994). The frequency distributions are first smoothed using the loglinear model and then equipercentile linking is conducted based on the smoothed frequency distributions of the two measures. Smoothing can also be done at the backend on equipercentile equivalents and is called postsmoothing (Brennan, 2004; Kolen & Brennan, 2004). The cubic-spline smoothing algorithm (Reinsch, 1967) is used in the LEGS program (Brennan, 2004). Smoothing is intended to reduce sampling error involved in the linking process. A successful linking
PROSETTA STONE®
– PROMIS ANGER AND BUSS PERRY AGGRESSION QUESTIONNAIRE
procedure will provide a conversion (crosswalk) table, in which, for example, raw summed scores on the PHQ-9 measure are transformed to the T-score equivalents of the PROMIS Depression measure. Under the current context, equipercentile crosswalk tables can be generated using two different approaches. First is a direct linking approach where each raw summed score on non-PROMIS measure is mapped directly to a PROMIS T-score. That is, raw summed scores on the non-PROMIS instrument and IRT scaled scores on the PROMIS (reference) instrument are linked directly, although raw summed scores and IRT scaled score have distinct properties (e.g., discrete vs. continuous). This approach might be appropriate when the reference instrument is either an item bank or composed of a large number of items and so various subsets (static or dynamic) are likely to be used but not the full bank in its entirety (e.g., PROMIS Physical Function bank with 124 items). Second is an indirect approach where raw summed scores on the non-PROMIS instrument are mapped to raw summed scores on the PROMIS instrument; and then the resulting raw summed score equivalents are mapped to corresponding scaled scores based on a raw-to-scale score conversion table. Because the raw summed score equivalents may take fractional values, such a conversion table will need to be interpolated using statistical procedures (e.g., cubic spline). Finally, when samples are small or inadequate for a specific method, random sampling error becomes a major concern (Kolen & Brennan, 2004). That is, substantially different linking relationships might be obtained if linking is conducted repeatedly over different samples. The type of random sampling error can be measured by the standard error of equating (SEE), which can be operationalized as the standard deviation of equated scores for a given raw summed score over replications (Lord, 1982).
4.3. Linking Assumptions In Section 5, we present the results of a large number of linking studies using secondary data sets. In each case, we have applied all three linking methods described in sections 4.1 and 4.2. Our purpose is to provide the maximum amount of useful information. However, the suitability of these methods depends upon the meeting of various linking assumptions. These assumptions require that the two instruments to be linked measure the same construct, show a high correlation, and are relatively invariant in subpopulation differences (Dorans, 2007). The degree to which these assumptions are met varies across linking studies. Given that different researchers may interpret these requirements differently, we have taken a liberal approach for inclusion of linkages in this book. Nevertheless, we recommend that researchers diagnostically review the classical psychometrics and CFA results in light of these assumptions prior to any application of the cross-walk charts or legacy parameters to their own data.
PROSETTA STONE®
– PROMIS ANGER AND BUSS PERRY AGGRESSION QUESTIONNAIRE
5. Linking Results Table 5.1 lists the linking analyses included in this report, which have been conducted based on samples from two different studies: PROMIS and Toolbox (see Section 2 for more details). In all cases, PROMIS instruments were used as the reference (i.e., scores on non-PROMIS instruments are expressed on the PROMIS score metric); however, shorter versions of PROMIS were used in Toolbox. Table 5.1. Linking by Study
Section Study PROMIS Instrument Non-PROMIS Instrument to Link
5.5 PROMIS Wave1 Anger Buss Perry Aggression Questionnaire (BPAQ)
PROSETTA STONE®
– PROMIS ANGER AND BUSS PERRY AGGRESSION QUESTIONNAIRE
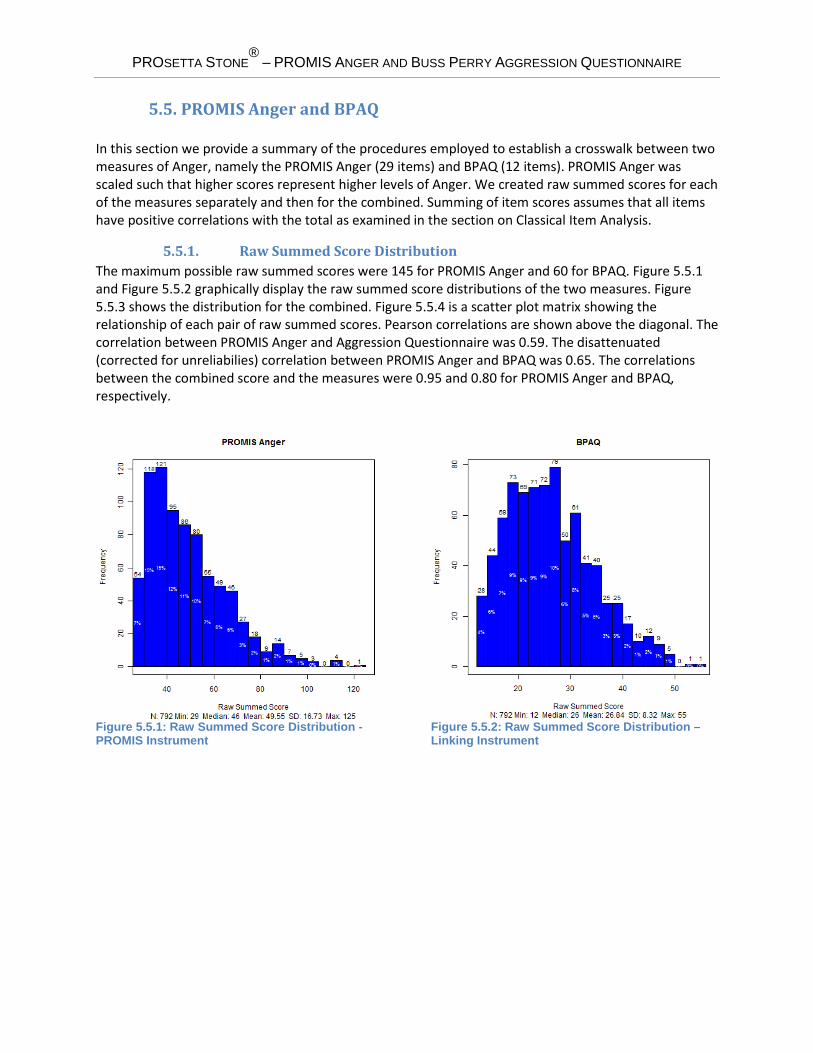
5.5. PROMIS Anger and BPAQ In this section we provide a summary of the procedures employed to establish a crosswalk between two measures of Anger, namely the PROMIS Anger (29 items) and BPAQ (12 items). PROMIS Anger was scaled such that higher scores represent higher levels of Anger. We created raw summed scores for each of the measures separately and then for the combined. Summing of item scores assumes that all items have positive correlations with the total as examined in the section on Classical Item Analysis.
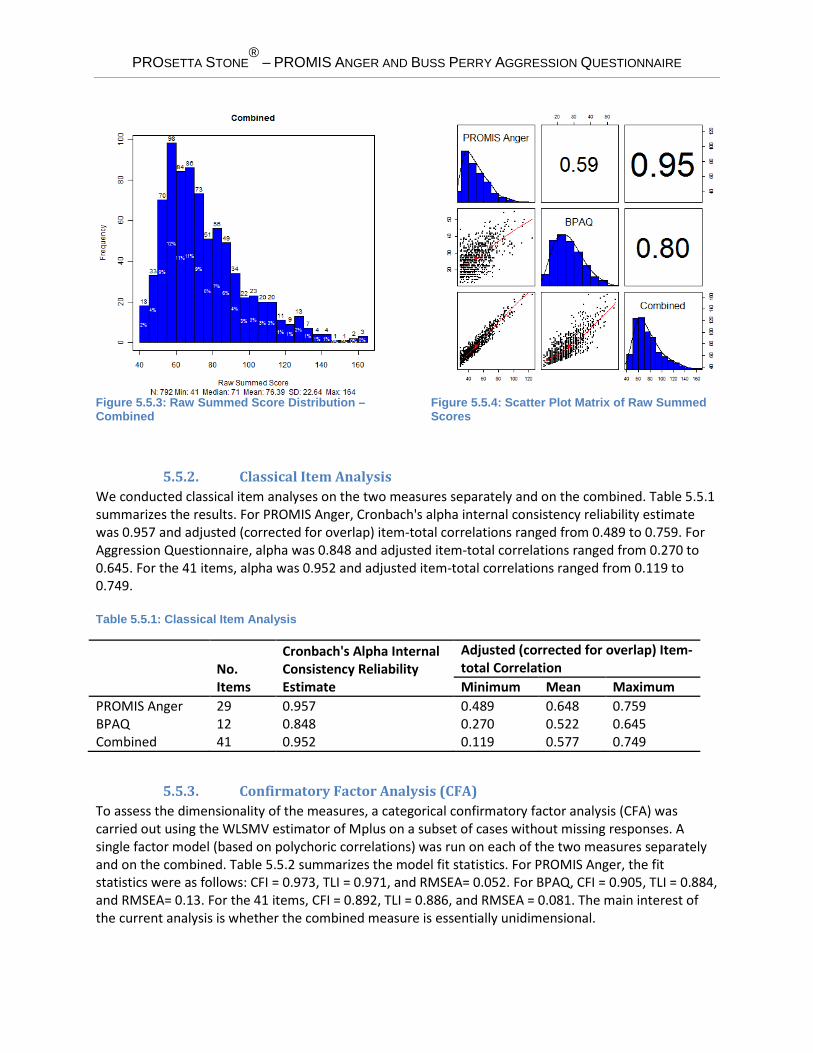
5.5.1. Raw Summed Score Distribution The maximum possible raw summed scores were 145 for PROMIS Anger and 60 for BPAQ. Figure 5.5.1 and Figure 5.5.2 graphically display the raw summed score distributions of the two measures. Figure 5.5.3 shows the distribution for the combined. Figure 5.5.4 is a scatter plot matrix showing the relationship of each pair of raw summed scores. Pearson correlations are shown above the diagonal. The correlation between PROMIS Anger and Aggression Questionnaire was 0.59. The disattenuated (corrected for unreliabilies) correlation between PROMIS Anger and BPAQ was 0.65. The correlations between the combined score and the measures were 0.95 and 0.80 for PROMIS Anger and BPAQ, respectively.
Figure 5.5.1: Raw Summed Score Distribution - PROMIS Instrument
Figure 5.5.2: Raw Summed Score Distribution – Linking Instrument
PROSETTA STONE®
– PROMIS ANGER AND BUSS PERRY AGGRESSION QUESTIONNAIRE
Figure 5.5.3: Raw Summed Score Distribution – Combined
Figure 5.5.4: Scatter Plot Matrix of Raw Summed Scores
5.5.2. Classical Item Analysis We conducted classical item analyses on the two measures separately and on the combined. Table 5.5.1 summarizes the results. For PROMIS Anger, Cronbach's alpha internal consistency reliability estimate was 0.957 and adjusted (corrected for overlap) item-total correlations ranged from 0.489 to 0.759. For Aggression Questionnaire, alpha was 0.848 and adjusted item-total correlations ranged from 0.270 to 0.645. For the 41 items, alpha was 0.952 and adjusted item-total correlations ranged from 0.119 to 0.749. Table 5.5.1: Classical Item Analysis
No. Items
Cronbach's Alpha Internal Consistency Reliability Estimate
Adjusted (corrected for overlap) Item-total Correlation Minimum Mean Maximum
PROMIS Anger 29 0.957 0.489 0.648 0.759 BPAQ 12 0.848 0.270 0.522 0.645 Combined 41 0.952 0.119 0.577 0.749
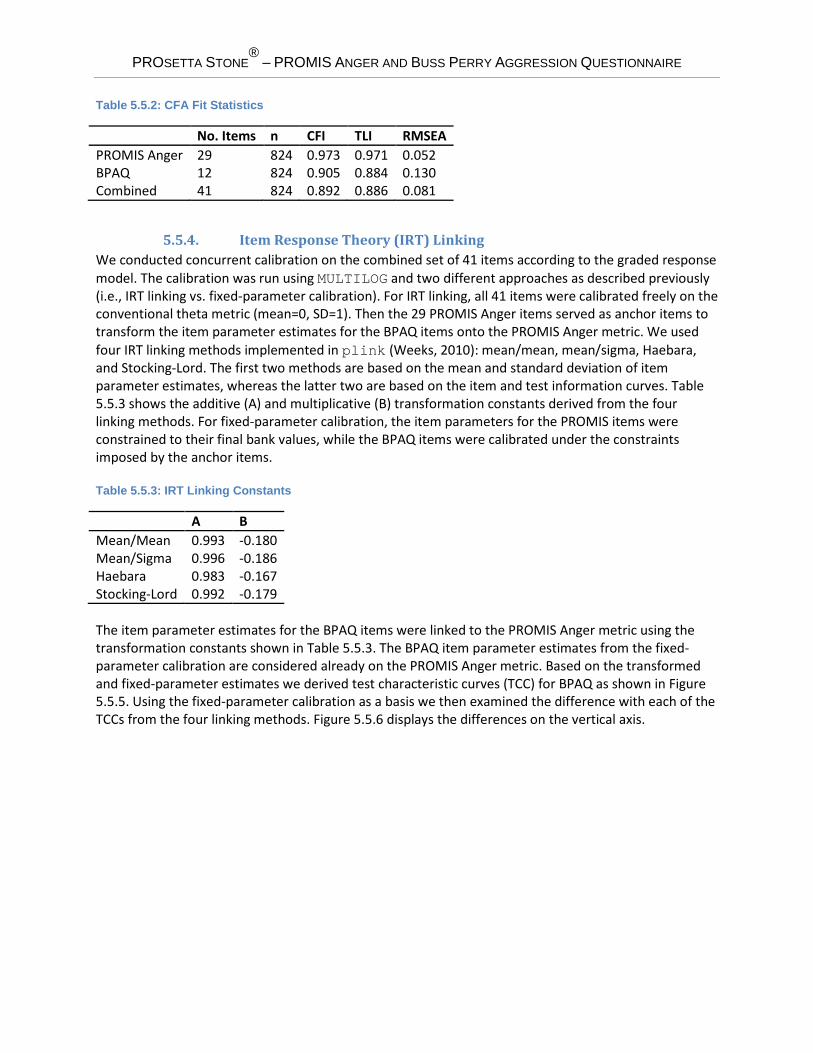
5.5.3. Confirmatory Factor Analysis (CFA) To assess the dimensionality of the measures, a categorical confirmatory factor analysis (CFA) was carried out using the WLSMV estimator of Mplus on a subset of cases without missing responses. A single factor model (based on polychoric correlations) was run on each of the two measures separately and on the combined. Table 5.5.2 summarizes the model fit statistics. For PROMIS Anger, the fit statistics were as follows: CFI = 0.973, TLI = 0.971, and RMSEA= 0.052. For BPAQ, CFI = 0.905, TLI = 0.884, and RMSEA= 0.13. For the 41 items, CFI = 0.892, TLI = 0.886, and RMSEA = 0.081. The main interest of the current analysis is whether the combined measure is essentially unidimensional.
PROSETTA STONE®
– PROMIS ANGER AND BUSS PERRY AGGRESSION QUESTIONNAIRE
Table 5.5.2: CFA Fit Statistics
No. Items n CFI TLI RMSEA PROMIS Anger 29 824 0.973 0.971 0.052 BPAQ 12 824 0.905 0.884 0.130 Combined 41 824 0.892 0.886 0.081
5.5.4. Item Response Theory (IRT) Linking We conducted concurrent calibration on the combined set of 41 items according to the graded response model. The calibration was run using MULTILOG and two different approaches as described previously (i.e., IRT linking vs. fixed-parameter calibration). For IRT linking, all 41 items were calibrated freely on the conventional theta metric (mean=0, SD=1). Then the 29 PROMIS Anger items served as anchor items to transform the item parameter estimates for the BPAQ items onto the PROMIS Anger metric. We used four IRT linking methods implemented in plink (Weeks, 2010): mean/mean, mean/sigma, Haebara, and Stocking-Lord. The first two methods are based on the mean and standard deviation of item parameter estimates, whereas the latter two are based on the item and test information curves. Table 5.5.3 shows the additive (A) and multiplicative (B) transformation constants derived from the four linking methods. For fixed-parameter calibration, the item parameters for the PROMIS items were constrained to their final bank values, while the BPAQ items were calibrated under the constraints imposed by the anchor items. Table 5.5.3: IRT Linking Constants
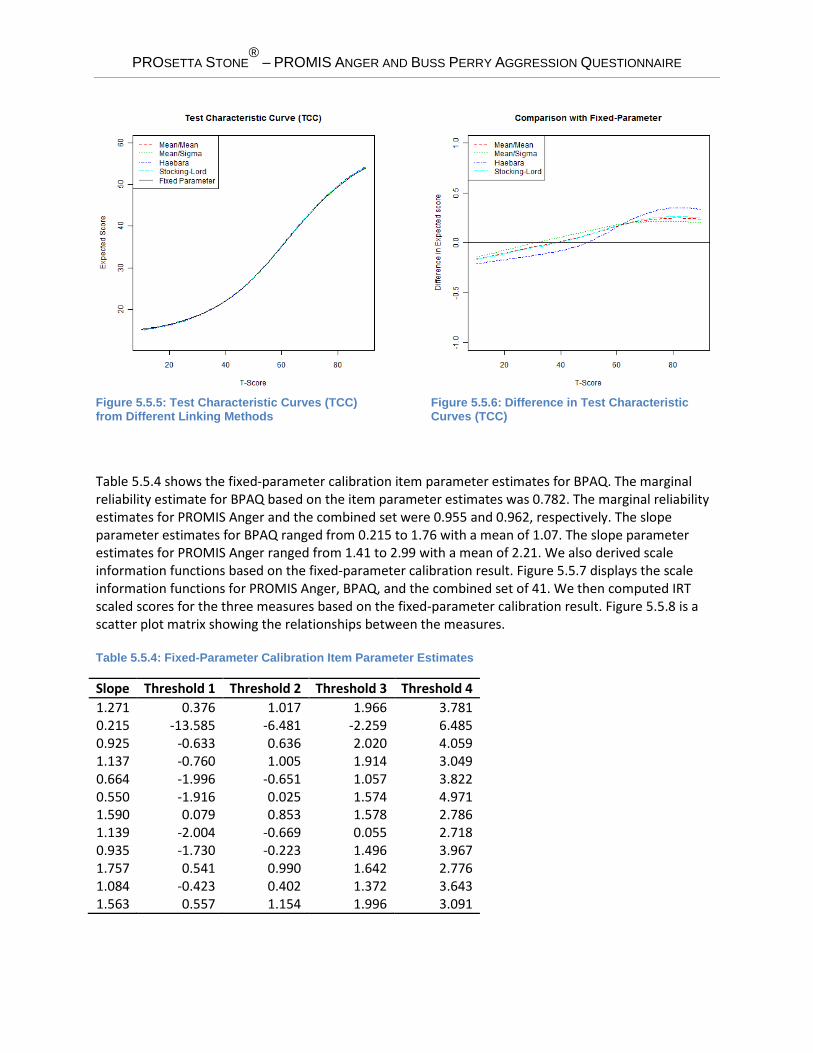
A B Mean/Mean 0.993 -0.180 Mean/Sigma 0.996 -0.186 Haebara 0.983 -0.167 Stocking-Lord 0.992 -0.179 The item parameter estimates for the BPAQ items were linked to the PROMIS Anger metric using the transformation constants shown in Table 5.5.3. The BPAQ item parameter estimates from the fixed-parameter calibration are considered already on the PROMIS Anger metric. Based on the transformed and fixed-parameter estimates we derived test characteristic curves (TCC) for BPAQ as shown in Figure 5.5.5. Using the fixed-parameter calibration as a basis we then examined the difference with each of the TCCs from the four linking methods. Figure 5.5.6 displays the differences on the vertical axis.
PROSETTA STONE®
– PROMIS ANGER AND BUSS PERRY AGGRESSION QUESTIONNAIRE
Figure 5.5.5: Test Characteristic Curves (TCC) from Different Linking Methods
Figure 5.5.6: Difference in Test Characteristic Curves (TCC)
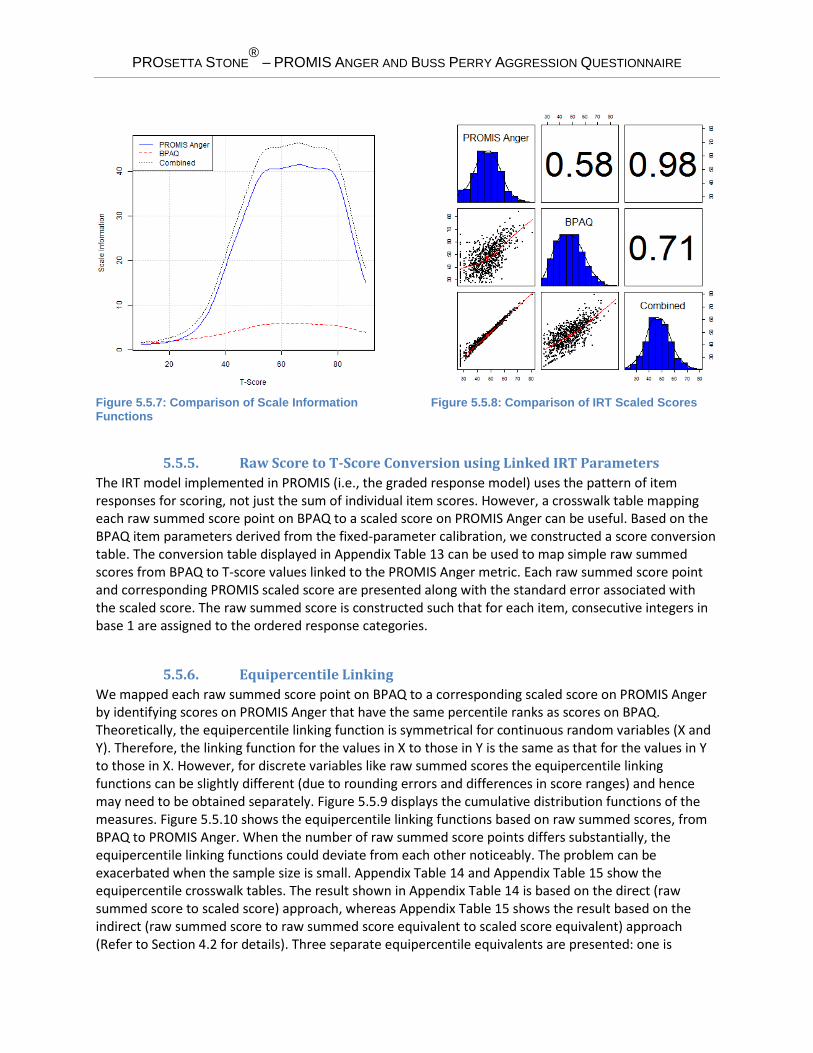
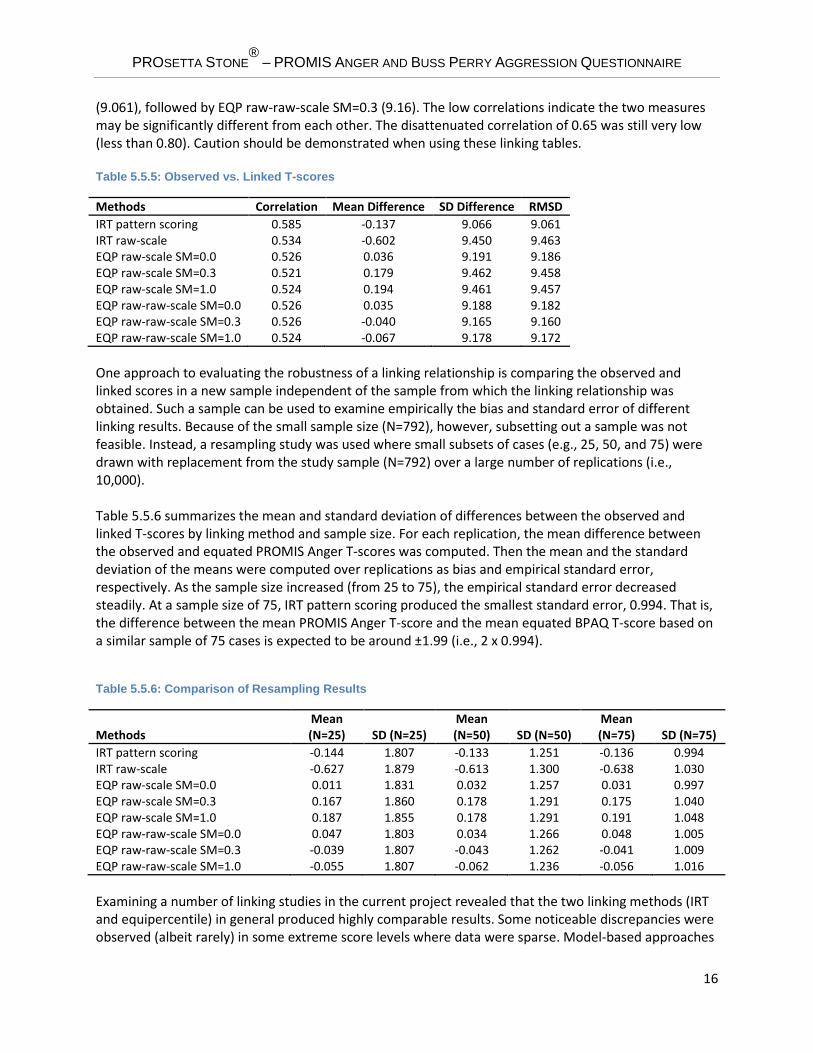
Table 5.5.4 shows the fixed-parameter calibration item parameter estimates for BPAQ. The marginal reliability estimate for BPAQ based on the item parameter estimates was 0.782. The marginal reliability estimates for PROMIS Anger and the combined set were 0.955 and 0.962, respectively. The slope parameter estimates for BPAQ ranged from 0.215 to 1.76 with a mean of 1.07. The slope parameter estimates for PROMIS Anger ranged from 1.41 to 2.99 with a mean of 2.21. We also derived scale information functions based on the fixed-parameter calibration result. Figure 5.5.7 displays the scale information functions for PROMIS Anger, BPAQ, and the combined set of 41. We then computed IRT scaled scores for the three measures based on the fixed-parameter calibration result. Figure 5.5.8 is a scatter plot matrix showing the relationships between the measures. Table 5.5.4: Fixed-Parameter Calibration Item Parameter Estimates
Slope Threshold 1 Threshold 2 Threshold 3 Threshold 4 1.271 0.376 1.017 1.966 3.781 0.215 -13.585 -6.481 -2.259 6.485 0.925 -0.633 0.636 2.020 4.059 1.137 -0.760 1.005 1.914 3.049 0.664 -1.996 -0.651 1.057 3.822 0.550 -1.916 0.025 1.574 4.971 1.590 0.079 0.853 1.578 2.786 1.139 -2.004 -0.669 0.055 2.718 0.935 -1.730 -0.223 1.496 3.967 1.757 0.541 0.990 1.642 2.776 1.084 -0.423 0.402 1.372 3.643 1.563 0.557 1.154 1.996 3.091
PROSETTA STONE®
– PROMIS ANGER AND BUSS PERRY AGGRESSION QUESTIONNAIRE
Figure 5.5.7: Comparison of Scale Information Functions
Figure 5.5.8: Comparison of IRT Scaled Scores
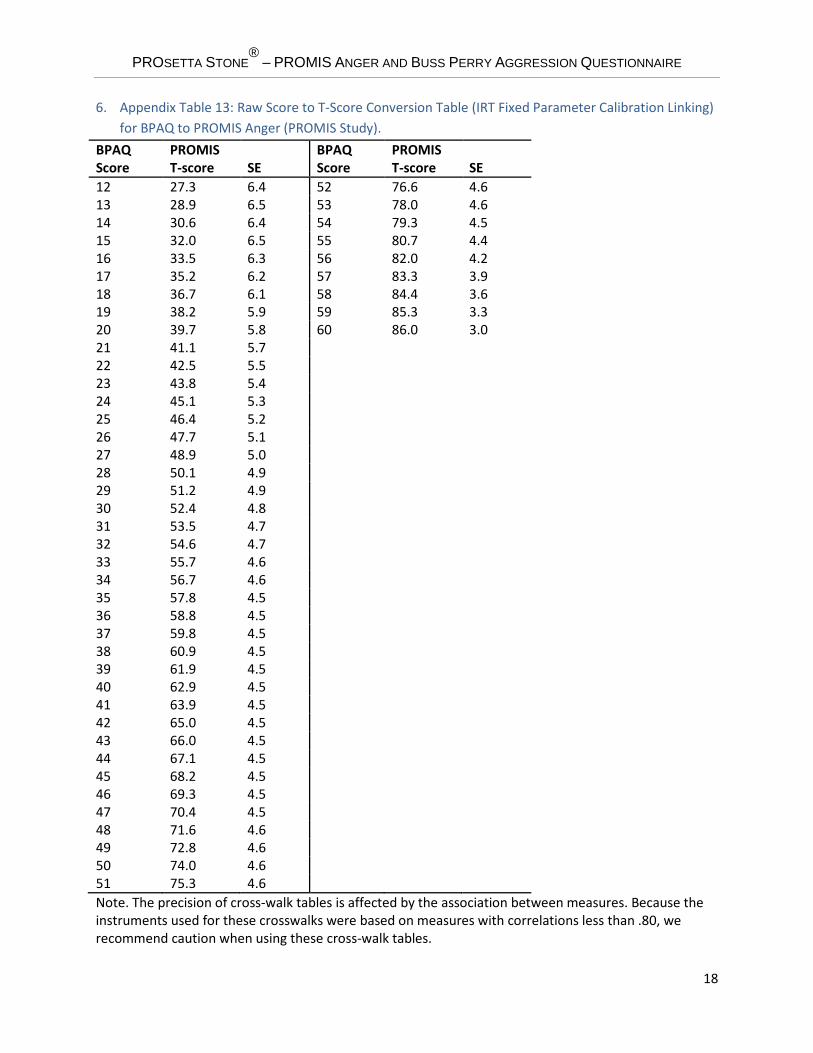
5.5.5. Raw Score to T-Score Conversion using Linked IRT Parameters The IRT model implemented in PROMIS (i.e., the graded response model) uses the pattern of item responses for scoring, not just the sum of individual item scores. However, a crosswalk table mapping each raw summed score point on BPAQ to a scaled score on PROMIS Anger can be useful. Based on the BPAQ item parameters derived from the fixed-parameter calibration, we constructed a score conversion table. The conversion table displayed in Appendix Table 13 can be used to map simple raw summed scores from BPAQ to T-score values linked to the PROMIS Anger metric. Each raw summed score point and corresponding PROMIS scaled score are presented along with the standard error associated with the scaled score. The raw summed score is constructed such that for each item, consecutive integers in base 1 are assigned to the ordered response categories.
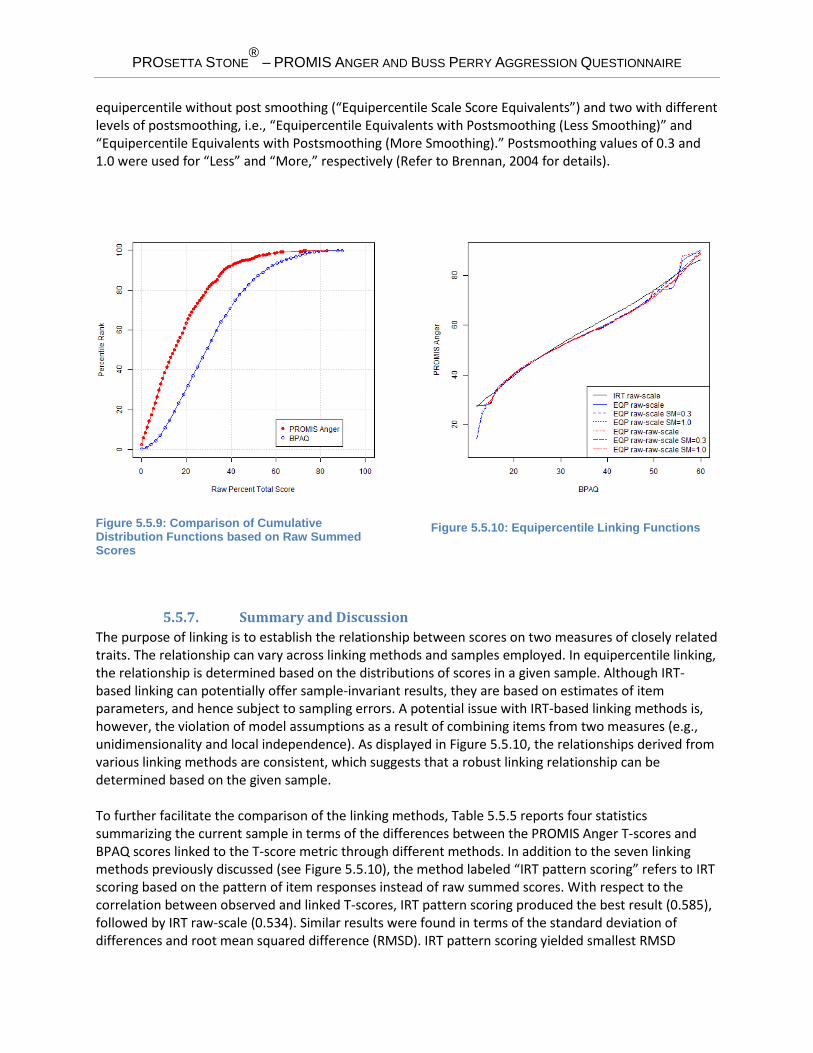
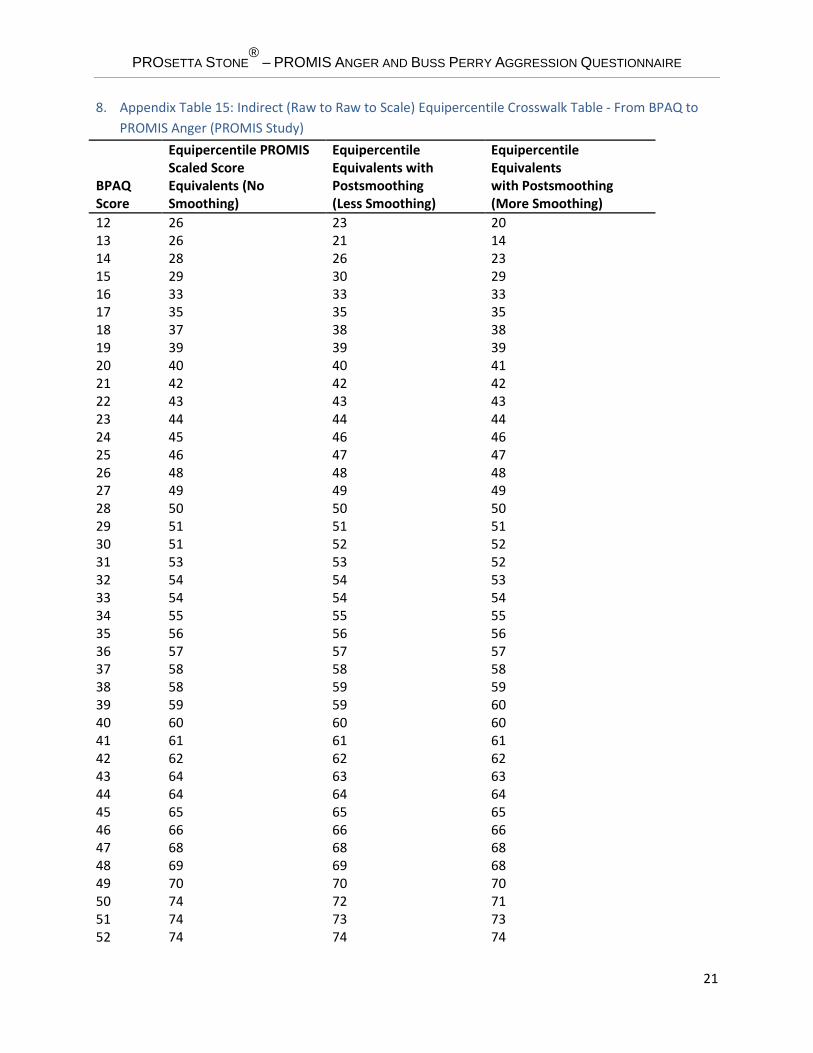
5.5.6. Equipercentile Linking We mapped each raw summed score point on BPAQ to a corresponding scaled score on PROMIS Anger by identifying scores on PROMIS Anger that have the same percentile ranks as scores on BPAQ. Theoretically, the equipercentile linking function is symmetrical for continuous random variables (X and Y). Therefore, the linking function for the values in X to those in Y is the same as that for the values in Y to those in X. However, for discrete variables like raw summed scores the equipercentile linking functions can be slightly different (due to rounding errors and differences in score ranges) and hence may need to be obtained separately. Figure 5.5.9 displays the cumulative distribution functions of the measures. Figure 5.5.10 shows the equipercentile linking functions based on raw summed scores, from BPAQ to PROMIS Anger. When the number of raw summed score points differs substantially, the equipercentile linking functions could deviate from each other noticeably. The problem can be exacerbated when the sample size is small. Appendix Table 14 and Appendix Table 15 show the equipercentile crosswalk tables. The result shown in Appendix Table 14 is based on the direct (raw summed score to scaled score) approach, whereas Appendix Table 15 shows the result based on the indirect (raw summed score to raw summed score equivalent to scaled score equivalent) approach (Refer to Section 4.2 for details). Three separate equipercentile equivalents are presented: one is
PROSETTA STONE®
– PROMIS ANGER AND BUSS PERRY AGGRESSION QUESTIONNAIRE
equipercentile without post smoothing (“Equipercentile Scale Score Equivalents”) and two with different levels of postsmoothing, i.e., “Equipercentile Equivalents with Postsmoothing (Less Smoothing)” and “Equipercentile Equivalents with Postsmoothing (More Smoothing).” Postsmoothing values of 0.3 and 1.0 were used for “Less” and “More,” respectively (Refer to Brennan, 2004 for details).
Figure 5.5.9: Comparison of Cumulative Distribution Functions based on Raw Summed Scores
Figure 5.5.10: Equipercentile Linking Functions
5.5.7. Summary and Discussion The purpose of linking is to establish the relationship between scores on two measures of closely related traits. The relationship can vary across linking methods and samples employed. In equipercentile linking, the relationship is determined based on the distributions of scores in a given sample. Although IRT-based linking can potentially offer sample-invariant results, they are based on estimates of item parameters, and hence subject to sampling errors. A potential issue with IRT-based linking methods is, however, the violation of model assumptions as a result of combining items from two measures (e.g., unidimensionality and local independence). As displayed in Figure 5.5.10, the relationships derived from various linking methods are consistent, which suggests that a robust linking relationship can be determined based on the given sample. To further facilitate the comparison of the linking methods, Table 5.5.5 reports four statistics summarizing the current sample in terms of the differences between the PROMIS Anger T-scores and BPAQ scores linked to the T-score metric through different methods. In addition to the seven linking methods previously discussed (see Figure 5.5.10), the method labeled “IRT pattern scoring” refers to IRT scoring based on the pattern of item responses instead of raw summed scores. With respect to the correlation between observed and linked T-scores, IRT pattern scoring produced the best result (0.585), followed by IRT raw-scale (0.534). Similar results were found in terms of the standard deviation of differences and root mean squared difference (RMSD). IRT pattern scoring yielded smallest RMSD
PROSETTA STONE®
– PROMIS ANGER AND BUSS PERRY AGGRESSION QUESTIONNAIRE
16
(9.061), followed by EQP raw-raw-scale SM=0.3 (9.16). The low correlations indicate the two measures may be significantly different from each other. The disattenuated correlation of 0.65 was still very low (less than 0.80). Caution should be demonstrated when using these linking tables. Table 5.5.5: Observed vs. Linked T-scores
Methods Correlation Mean Difference SD Difference RMSD IRT pattern scoring 0.585 -0.137 9.066 9.061 IRT raw-scale 0.534 -0.602 9.450 9.463 EQP raw-scale SM=0.0 0.526 0.036 9.191 9.186 EQP raw-scale SM=0.3 0.521 0.179 9.462 9.458 EQP raw-scale SM=1.0 0.524 0.194 9.461 9.457 EQP raw-raw-scale SM=0.0 0.526 0.035 9.188 9.182 EQP raw-raw-scale SM=0.3 0.526 -0.040 9.165 9.160 EQP raw-raw-scale SM=1.0 0.524 -0.067 9.178 9.172 One approach to evaluating the robustness of a linking relationship is comparing the observed and linked scores in a new sample independent of the sample from which the linking relationship was obtained. Such a sample can be used to examine empirically the bias and standard error of different linking results. Because of the small sample size (N=792), however, subsetting out a sample was not feasible. Instead, a resampling study was used where small subsets of cases (e.g., 25, 50, and 75) were drawn with replacement from the study sample (N=792) over a large number of replications (i.e., 10,000). Table 5.5.6 summarizes the mean and standard deviation of differences between the observed and linked T-scores by linking method and sample size. For each replication, the mean difference between the observed and equated PROMIS Anger T-scores was computed. Then the mean and the standard deviation of the means were computed over replications as bias and empirical standard error, respectively. As the sample size increased (from 25 to 75), the empirical standard error decreased steadily. At a sample size of 75, IRT pattern scoring produced the smallest standard error, 0.994. That is, the difference between the mean PROMIS Anger T-score and the mean equated BPAQ T-score based on a similar sample of 75 cases is expected to be around ±1.99 (i.e., 2 x 0.994). Table 5.5.6: Comparison of Resampling Results
Methods Mean (N=25) SD (N=25)
Mean (N=50) SD (N=50)
Mean (N=75) SD (N=75)
IRT pattern scoring -0.144 1.807 -0.133 1.251 -0.136 0.994 IRT raw-scale -0.627 1.879 -0.613 1.300 -0.638 1.030 EQP raw-scale SM=0.0 0.011 1.831 0.032 1.257 0.031 0.997 EQP raw-scale SM=0.3 0.167 1.860 0.178 1.291 0.175 1.040 EQP raw-scale SM=1.0 0.187 1.855 0.178 1.291 0.191 1.048 EQP raw-raw-scale SM=0.0 0.047 1.803 0.034 1.266 0.048 1.005 EQP raw-raw-scale SM=0.3 -0.039 1.807 -0.043 1.262 -0.041 1.009 EQP raw-raw-scale SM=1.0 -0.055 1.807 -0.062 1.236 -0.056 1.016 Examining a number of linking studies in the current project revealed that the two linking methods (IRT and equipercentile) in general produced highly comparable results. Some noticeable discrepancies were observed (albeit rarely) in some extreme score levels where data were sparse. Model-based approaches

PROSETTA STONE®
– PROMIS ANGER AND BUSS PERRY AGGRESSION QUESTIONNAIRE
17
can provide more robust results than those relying solely on data when data is sparse. The caveat is that the model should fit the data reasonably well. One of the potential advantages of IRT-based linking is that the item parameters on the linking instrument can be expressed on the metric of the reference instrument, and therefore can be combined without significantly altering the underlying trait being measured. As a result, a larger item pool might be available for computerized adaptive testing or various subsets of items can be used in static short forms. Therefore, IRT-based linking (Appendix Table 13) might be preferred when the results are comparable and no apparent violations of assumptions are evident.
PROSETTA STONE®
– PROMIS ANGER AND BUSS PERRY AGGRESSION QUESTIONNAIRE
18
6. Appendix Table 13: Raw Score to T-Score Conversion Table (IRT Fixed Parameter Calibration Linking) for BPAQ to PROMIS Anger (PROMIS Study).
BPAQ Score
PROMIS T-score SE
BPAQ Score
PROMIS T-score SE
12 27.3 6.4 52 76.6 4.6 13 28.9 6.5 53 78.0 4.6 14 30.6 6.4 54 79.3 4.5 15 32.0 6.5 55 80.7 4.4 16 33.5 6.3 56 82.0 4.2 17 35.2 6.2 57 83.3 3.9 18 36.7 6.1 58 84.4 3.6 19 38.2 5.9 59 85.3 3.3 20 39.7 5.8 60 86.0 3.0 21 41.1 5.7 22 42.5 5.5 23 43.8 5.4 24 45.1 5.3 25 46.4 5.2 26 47.7 5.1 27 48.9 5.0 28 50.1 4.9 29 51.2 4.9 30 52.4 4.8 31 53.5 4.7 32 54.6 4.7 33 55.7 4.6 34 56.7 4.6 35 57.8 4.5 36 58.8 4.5 37 59.8 4.5 38 60.9 4.5 39 61.9 4.5 40 62.9 4.5 41 63.9 4.5 42 65.0 4.5 43 66.0 4.5 44 67.1 4.5 45 68.2 4.5 46 69.3 4.5 47 70.4 4.5 48 71.6 4.6 49 72.8 4.6 50 74.0 4.6 51 75.3 4.6 Note. The precision of cross-walk tables is affected by the association between measures. Because the instruments used for these crosswalks were based on measures with correlations less than .80, we recommend caution when using these cross-walk tables.

PROSETTA STONE®
– PROMIS ANGER AND BUSS PERRY AGGRESSION QUESTIONNAIRE
19
7. Appendix Table 14: Direct (Raw to Scale) Equipercentile Crosswalk Table - From BPAQ to PROMIS Anger (PROMIS Study).
BPAQ Score
Equipercentile PROMIS Scaled Score Equivalents (No Smoothing)
Equipercentile Equivalents with Postsmoothing (Less Smoothing)
Equipercentile Equivalents with Postsmoothing (More Smoothing)
Standard Error of Equating (SEE)
12 28 14 14 0.07 13 28 23 24 0.07 14 28 27 28 0.08 15 28 29 30 0.17 16 34 33 32 0.39 17 36 35 35 0.47 18 37 37 37 0.44 19 38 39 39 0.51 20 40 40 40 0.30 21 42 42 42 0.30 22 43 43 43 0.74 23 44 44 44 0.37 24 45 45 45 0.86 25 46 46 46 0.42 26 48 48 48 0.50 27 49 49 49 0.50 28 50 50 50 0.26 29 50 51 51 0.24 30 52 52 52 0.46 31 53 53 53 0.57 32 54 54 54 0.44 33 54 54 54 0.38 34 55 55 55 0.46 35 56 56 56 0.52 36 57 57 57 0.55 37 58 58 58 0.34 38 58 58 59 0.32 39 59 59 60 0.80 40 60 60 61 0.54 41 61 61 62 1.13 42 62 62 63 1.18 43 64 63 64 0.72 44 64 64 65 0.64 45 65 65 66 0.81 46 66 67 67 1.89 47 68 68 68 1.63 48 69 69 69 0.85 49 70 71 70 0.98 50 74 72 72 0.77 51 74 74 74 2.00 52 74 76 76 2.00

PROSETTA STONE®
– PROMIS ANGER AND BUSS PERRY AGGRESSION QUESTIONNAIRE
20
BPAQ Score
Equipercentile PROMIS Scaled Score Equivalents (No Smoothing)
Equipercentile Equivalents with Postsmoothing (Less Smoothing)
Equipercentile Equivalents with Postsmoothing (More Smoothing)
Standard Error of Equating (SEE)
53 74 78 77 2.00 54 75 79 79 2.00 55 79 81 81 1.41 56 86 83 83 1.41 57 87 84 84 1.41 58 88 86 86 1.41 59 89 88 88 1.41 60 90 90 90 1.41 Note. The precision of cross-walk tables is affected by the association between measures. Because the instruments used for these crosswalks were based on measures with correlations less than .80, we recommend caution when using these cross-walk tables.
PROSETTA STONE®
– PROMIS ANGER AND BUSS PERRY AGGRESSION QUESTIONNAIRE
21
8. Appendix Table 15: Indirect (Raw to Raw to Scale) Equipercentile Crosswalk Table - From BPAQ to PROMIS Anger (PROMIS Study)
BPAQ Score
Equipercentile PROMIS Scaled Score Equivalents (No Smoothing)
Equipercentile Equivalents with Postsmoothing (Less Smoothing)
Equipercentile Equivalents with Postsmoothing (More Smoothing)
12 26 23 20 13 26 21 14 14 28 26 23 15 29 30 29 16 33 33 33 17 35 35 35 18 37 38 38 19 39 39 39 20 40 40 41 21 42 42 42 22 43 43 43 23 44 44 44 24 45 46 46 25 46 47 47 26 48 48 48 27 49 49 49 28 50 50 50 29 51 51 51 30 51 52 52 31 53 53 52 32 54 54 53 33 54 54 54 34 55 55 55 35 56 56 56 36 57 57 57 37 58 58 58 38 58 59 59 39 59 59 60 40 60 60 60 41 61 61 61 42 62 62 62 43 64 63 63 44 64 64 64 45 65 65 65 46 66 66 66 47 68 68 68 48 69 69 68 49 70 70 70 50 74 72 71 51 74 73 73 52 74 74 74

PROSETTA STONE®
– PROMIS ANGER AND BUSS PERRY AGGRESSION QUESTIONNAIRE
22
BPAQ Score
Equipercentile PROMIS Scaled Score Equivalents (No Smoothing)
Equipercentile Equivalents with Postsmoothing (Less Smoothing)
Equipercentile Equivalents with Postsmoothing (More Smoothing)
53 74 76 76 54 75 78 77 55 79 79 79 56 88 81 81 57 88 83 83 58 88 85 85 59 89 87 87 60 89 89 89 Note. The precision of cross-walk tables is affected by the association between measures. Because the instruments used for these crosswalks were based on measures with correlations less than .80, we recommend caution when using these cross-walk tables.