Embed Size (px)
Citation preview

Proprietary & Confidential. Health Care Incentives Improvement Institute, Inc.
PROMETHEUS Pilot Pre-conference
March 23rd 2011

Proprietary & Confidential. Health Care Incentives Improvement Institute, Inc.
Agenda
Session Topics/Title Presenters
8:30-8:45a.m. ¨ Five lessons learned from the RWJF-funded Prometheus Payment pilots
• Francois de Brantes(HCI3)
8:45-9:15a.m. ¨ Analyzing opportunities for episode of care (EOC) payment
• Elizabeth Siteman (HCI3)
9:15-10:15a.m. ¨ Contracting for episodes • Doug Emery (HCI3) • Eddie Bell (Providence) • Greger Vigen (SOA)
10:15-10:30a.m. ¨ Break
10:30-11:30a.m. ¨ Operationalizing & Implementing EOC payment
• Chad Brown (HCI3) • Liz Rubin (Horizon) • Joe O’Connor (CareFuze)
11:30a.m.-Noon ¨ Q&A • All
2

Proprietary & Confidential. Health Care Incentives Improvement Institute, Inc.
Lessons learned from Implementations • 5 ingredients to success:
– Full CEO engagement – Commitment by willing plan AND provider – Clean and complete claims and eligibility data – EMR systems – Sense of urgency
• We’ve actually made the operations relatively easy, and they’re becoming easier.
• However, hospitals, in particular, have a growing dilemma to manage
3

Proprietary & Confidential. Health Care Incentives Improvement Institute, Inc.
The Hospital CFO’s Dilemma
• It’s better to make a 7% margin on $140 million in revenue than a 4.5% margin on $190 million in revenue
• However, you’re worse off if you’re making a 7% margin on $40 million plus a 4.5% margin on $120 million
• So…how do you manage the transition from volume-based payment to value-based payment?
4
Proprietary & Confidential. Health Care Incentives Improvement Institute, Inc.
VBP volume and margin dictate the sustainable pace of change
$0
$20,000,000
$40,000,000
$60,000,000
$80,000,000
$100,000,000
$120,000,000
$140,000,000
$160,000,000
$180,000,000
$200,000,000
1 2 3 4 5 6 7 8 9 10 11 12 13
Total Revenue
Break-even FFS Volume
EOC Volume
Total Margin
Note: Assumes a 7% margin for Episode of Care payment and a 4.5% margin for FFS payments. FFS b/e Vol = (Target $ Margin – (EOC $ Vol * EOC margin)) / FFS margin.
5

Proprietary & Confidential. Health Care Incentives Improvement Institute, Inc.
For contact information: www.HCI3.org www.bridgestoexcellence.org www.prometheuspayment.org

Proprietary & Confidential. Health Care Incentives Improvement Institute, Inc.
Analyzing Opportunities for Episode of Care Payment
National P4P Summit Preconference II March 23, 2010

Proprietary & Confidential. Health Care Incentives Improvement Institute, Inc.
Agenda
• Identifying Sources of Variation in Episode Costs
• Analyzing Potentially Avoidable Complications
• Provider Level Analysis as a guide to contracting, performance assessment, and quality improvement

Proprietary & Confidential. Health Care Incentives Improvement Institute, Inc.
Sources of Variation in Episode Costs • Provider Performance in terms of potentially
avoidable complications (PACs) • Unit Price per Service – determined by fee
schedules or contracted rates • Severity of the patient – sicker patients may
require more resources for appropriate care • Provider Practice Patterns in terms of
frequency and types of services provided for routine or typical care
3

Proprietary & Confidential. Health Care Incentives Improvement Institute, Inc.
Variation in COPD Episode Costs across 10 Provider Groups
4
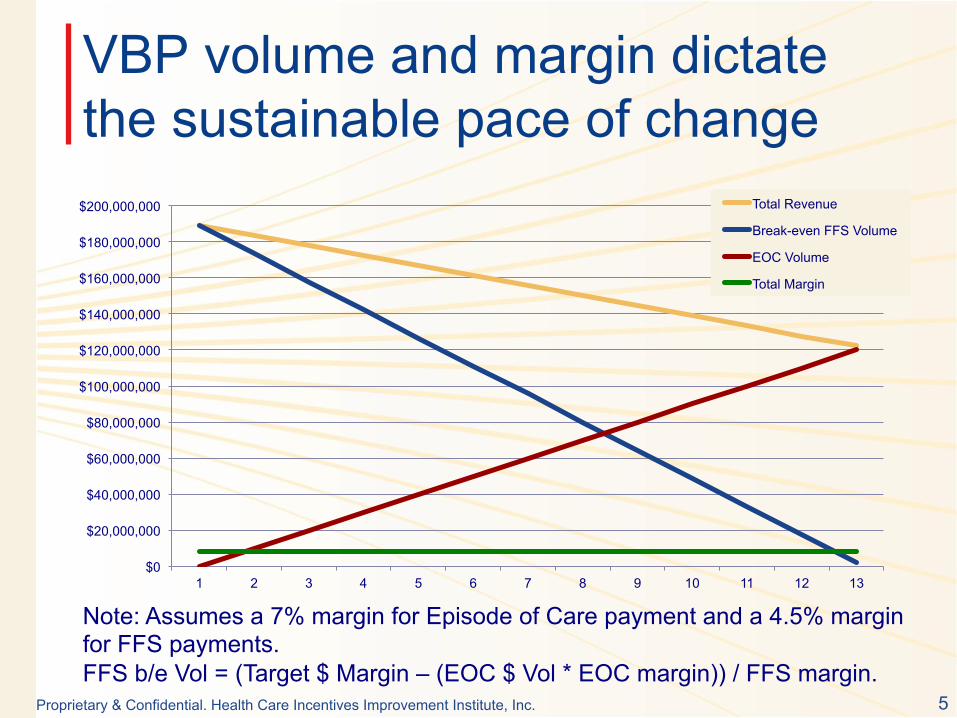
Average annual episode costs per patient are a routine measure used to assess cost performance across providers. However, little is known about the causes of the variation and how to reduce them.

Proprietary & Confidential. Health Care Incentives Improvement Institute, Inc. 5
Example: COPD Episodes Among Two Provider Groups
5
• On average, Provider 10’s episode costs are 2.5x Provider 4’s.
• How much of this difference is due to patient severity, provider competence and practice patterns?
Provider 4 Provider 10
N 408 444
Total Episode Costs $569,160 $1,640,580
Average Episode Costs $1,395 $3,695

Proprietary & Confidential. Health Care Incentives Improvement Institute, Inc. 6
Let’s split the average episode costs between typical and PAC
6
• Provider 10 incurs more PACs on average relative to total annual episode cost (35% v. 25%)
• On average Provider 10 incurs close to 4x more than Provider 4 on PACs per patient
Provider 4 Provider 10 Difference
Average PAC Costs $344 $1,297 3.8
Average Typical Costs $1,051 $2,398 2.3
% of Dollars Spent on PACs 25% 35% 1.4
3.8x
2.3x

Proprietary & Confidential. Health Care Incentives Improvement Institute, Inc.
PAC Cost and Frequency
7
Provider 10’s PAC problem is not caused by the frequency of PACs as much as the average cost per PAC. Let’s understand the drivers.

Proprietary & Confidential. Health Care Incentives Improvement Institute, Inc.
What types of PACs are driving excess costs for Provider 10?
8
PAC Type Provider 4 Provider 10 Type 1 PACs (directly related to the index condition) 41% 52% Type 2 PACs (related to comorbidities) 55% 36% Type 3 PACs (suggesting patient safety failures) 4% 12%
PAC Description Provider 4 Provider 10
Emergency Room 18% 12%
Acute Exacerbation of COPD 16% 15%
Pneumonia, Lung Complications 6% 13%
Cardiac Dysrhythmias 11% 9%
Urinary Tract Infections 4% 1%
Cellulitis, Skin Infections 8% 6%
Gastritis, ulcer, GI hemorrhage 7% 3%
Chronic Obstructive Bronchitis -- 6%
Complications of medical care, surgery, implanted device, grafts
2% 2%
DVT, Pulmonary Embolism 1% 8%
Proprietary & Confidential. Health Care Incentives Improvement Institute, Inc.
Is the variation in typical costs due to patient severity?
9
Proprietary & Confidential. Health Care Incentives Improvement Institute, Inc. 10
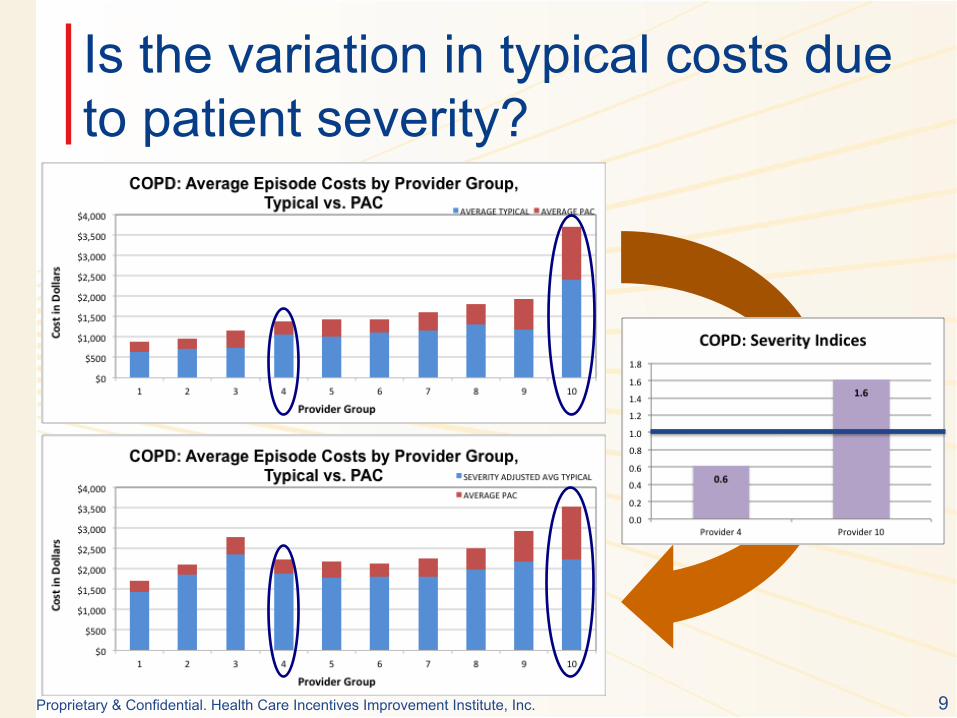
After adjusting for severity
• After adjusting for patient severity, the difference in typical costs is minor and mostly due to practice pattern variation (e.g. higher use of discretionary services – labs, imaging, etc..)
Provider 4 Provider 10
Severity Index (reference = 1.0) 0.62 1.61
Average Typical after adjusting for severity $1,893 $2,227
1.2x

Proprietary & Confidential. Health Care Incentives Improvement Institute, Inc.
After adjustments, Provider 10 still has higher episode costs
11
However, the rank of the other providers has shifted – 3 went from low cost to relatively high cost, and 6 went from average to lower cost.

Proprietary & Confidential. Health Care Incentives Improvement Institute, Inc.
One view of performance: ranking on PACs and Typical
12
Provider 10 goes from being a complete outlier, to a Provider with a PAC problem, that can be addressed through clinical reengineering and improving patient management.

Proprietary & Confidential. Health Care Incentives Improvement Institute, Inc. 13
Observations
• PAC Analysis and its details can help providers understand the source of professional variation and improve quality/cost performance
• Severity-adjusting typical costs and comparing providers on that basis provides insights on practice pattern variations and price
• Examining variation in episode cost can help to inform quality improvement initiatives, contracting decisions, and help providers and payers win in “budget-based” payments.

Proprietary & Confidential. Health Care Incentives Improvement Institute, Inc.
For contact information: www.HCI3.org www.bridgestoexcellence.org www.prometheuspayment.org

Proprietary & Confidential. Health Care Incentives Improvement Institute, Inc.
Contracting ECRs
IHA P4P Conference March 23rd, 2011
Doug Emery, M.S. Implementation Leader, Western Region HCI3

Proprietary & Confidential. Health Care Incentives Improvement Institute, Inc.
Agenda
• ECR Concept and Accountable Care • Retrospective vs Prospective Payment • Negotiating Tunable Parameters

Proprietary & Confidential. Health Care Incentives Improvement Institute, Inc.
Patient-centered continuum of care
Source: Sustaining the Medical Home: How Prometheus Payment Can Revitalize Primary Care, RWJ publication

Proprietary & Confidential. Health Care Incentives Improvement Institute, Inc.
Amplitude of cost along the continuum
Source: Sustaining the Medical Home: How Prometheus Payment Can Revitalize Primary Care, RWJ publication

Proprietary & Confidential. Health Care Incentives Improvement Institute, Inc.
Retrospective Payment
5
Readmission
Hospitalization
Outpatient Professional
Key: Claims for typical care and services Potentially avoidable cost (PACs)
365 days – e.g. Jan 1.
Chronic Episode
Procedural Episode Inpatient
Professional
Outpatient Professional
180 day look-forward 30 day look-back

Proprietary & Confidential. Health Care Incentives Improvement Institute, Inc.
Retrospectively reconciled prospective episode budgets
Episode budget is established upon trigger and not paid out, but allocated
1
Claims incurred are paid FFS by the plan and accumulated, split between typical and PAC
2
Accumulated claims are compared to budgeted episode, and reconciled, to determine upside/ downside
3

Proprietary & Confidential. Health Care Incentives Improvement Institute, Inc.
Operational elements
• Prospective budgets are calculated by the plan, and the tunable parameters (e.g. stop-loss, PAC allowance) are negotiated with providers. – Need a contracting organization (health plan) – Providers don’t have to be legally/organizationally integrated
• Claims incurred are paid according to underlying FFS schedules and accumulated against budgets – Need an accumulating engine (currently MedAssets, but
working with McKesson and TriZetto for additional solutions) • Paid claims are reconciled against budgets and upside/
downside is determined – Need fiscal intermediary (plan) to deduct withholds and
process reconciliations, pay out balances

Proprietary & Confidential. Health Care Incentives Improvement Institute, Inc.
Prospectively paid episode budgets with reconciliation
Episode budget is established upon trigger and paid out to “ACO” or fiscal intermediary
1
Claims incurred are zeroed out, but accumulated against budget
2
Claims incurred compared against budget to provide guidance on prospective budgets/payments
3

Proprietary & Confidential. Health Care Incentives Improvement Institute, Inc.
Operational elements
• Prospective budgets are paid out (with or w/o withhold – we recommend always taking a withhold) – Need ACO or fiscal intermediary who will distribute funds to
subcontracted providers • Claims incurred are zeroed out but accumulated against
budgets to help inform future pricing and severity adjustment reconciliations – Need claims engine to zero out claims for triggered budgets
and accumulate claims against episodes • Incurred is reconciled against budgets, and withhold is then
balanced out (to guard against overpayment when patients die or seek services outside contracted providers) – Need fiscal intermediary to perform reconciliations and
determine distributions of withhold balances

Proprietary & Confidential. Health Care Incentives Improvement Institute, Inc.
Negotiating Tunable Parameters

Proprietary & Confidential. Health Care Incentives Improvement Institute, Inc.
Risk Bifurcation
Total Relevant Costs of a Specific Episode
Total Cost of Care
Typical Costs of Episode Costs of all Potentially
Avoidable Complications (and other provider-specific variation)
Costs of all Base Services
Costs of all Severity Adjusters
Insurer – Probability risk Provider – Technical risk Consumer – Probability risk
Reliable Care
Global Cap
“Coarse” Episodes
ECRs
11
Proprietary & Confidential. Health Care Incentives Improvement Institute, Inc.
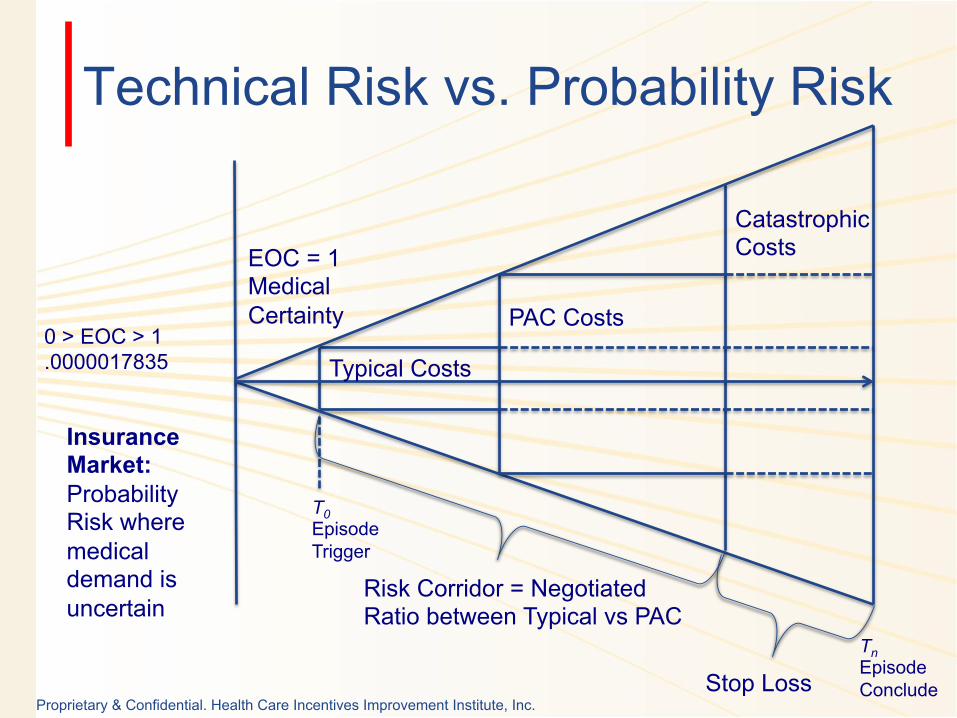
Technical Risk vs. Probability Risk
0 > EOC > 1 .0000017835
Insurance Market: Probability Risk where medical demand is uncertain
Typical Costs
PAC Costs
Catastrophic Costs EOC = 1
Medical Certainty
Tn Episode Conclude
T0 Episode Trigger
Risk Corridor = Negotiated Ratio between Typical vs PAC
Stop Loss
Proprietary & Confidential. Health Care Incentives Improvement Institute, Inc.
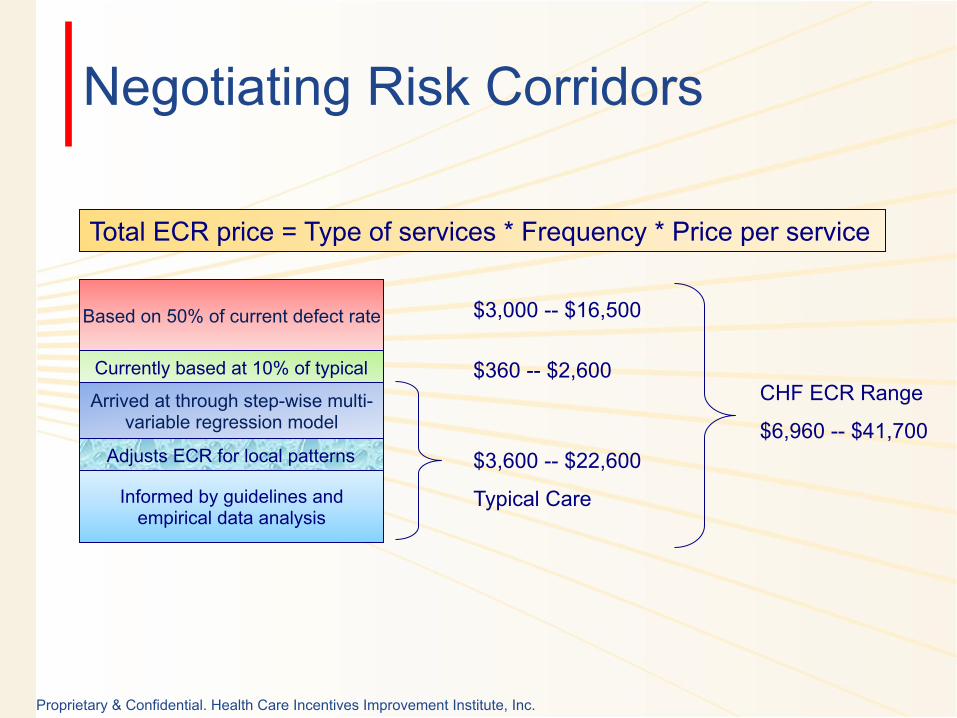
Negotiating Risk Corridors
Informed by guidelines and empirical data analysis
Adjusts ECR for local patterns
Arrived at through step-wise multi-variable regression model
Currently based at 10% of typical
Based on 50% of current defect rate
Total ECR price = Type of services * Frequency * Price per service
$3,600 -- $22,600
Typical Care
$360 -- $2,600
$3,000 -- $16,500
CHF ECR Range
$6,960 -- $41,700

Proprietary & Confidential. Health Care Incentives Improvement Institute, Inc.
Tunable Parameters: Negotiating ECR Risk Corridors
The PAC Allowance:
0% 100% 50%
CHF Prospective Budget @ 50% Patient 1 = $4,112 Patient 2 = $15,549 Patient 3 = $34,629
CHF Prospective Budget @ 75% Patient 1 = $5,348 Patient 2 = $18,714 Patient 3 = $41,013
14

Proprietary & Confidential. Health Care Incentives Improvement Institute, Inc.
Tunable Parameters: The Donut Hole
15
% o
f Cur
rent
PA
C C
osts
Re-
allo
cate
d to
E
CR
Bud
get (
PAC
Allo
wan
ce)
100%
50%
Size of “Donut Hole”
Payer Risk
Payer Risk
Provider Risk – “Donut Hole”

Proprietary & Confidential. Health Care Incentives Improvement Institute, Inc.
Tunable Parameters: The Donut Hole
16
% o
f Cur
rent
PA
C C
osts
Re-
allo
cate
d to
E
CR
Bud
get (
PAC
Allo
wan
ce)
100%
50%
Size of “Donut Hole”
Payer Risk
Payer Risk
Provider Risk – “Donut Hole”
Stop Loss

Proprietary & Confidential. Health Care Incentives Improvement Institute, Inc.
Prospective vs Retrospective Payment
Transparency only Programs
Fixed fee/bonus-based Programs
Shared savings-based Programs
Episode of Care payment
Provider Risk
Sav
ings

Proprietary & Confidential. Health Care Incentives Improvement Institute, Inc.
For contact information: www.HCI3.org www.bridgestoexcellence.org www.prometheuspayment.org


![Prometheus Bound by Aeschylus and Prometheus Unbound by … · 2014-05-19 · Prometheus Bound by Aeschylus and Prometheus Unbound by Percy Bysshe Shelley: [Prometheus Unbound] Translated](https://img.dokumen.tips/doc/110x75/5e6b69d324985e52ae4c9922/prometheus-bound-by-aeschylus-and-prometheus-unbound-by-2014-05-19-prometheus.jpg)