Embed Size (px)
Citation preview


Brian GautreauSales Engineer – NGINX Inc.
NGINX Plus, Kubernetes & Prometheus Gain insights into your N+ Ingress Controller

NGINX Plus and the Ingress Controller
NGINX Plus API
Prometheus, Prometheus Exporter, Grafana
Demo
1
2
3
4
Agenda
Q&A5
NGINX Plus, Kubernetes, Prometheus and Grafana
�4

K8s and NGINX Plus
�5
• Ingress Controller available in NGINX Inc. Github repo
• SSL Termination, Path based routing, rewrites, websockets
• Also exposes NGINX Plus functionality ◦ Status API, Session Persistence, JWT
Auth, On-the-fly reconfig
• Annotations for extending functionality
https://github.com/nginxinc/kubernetes-ingress

NGINX Plus API
�6
• Over 150 metrics ◦ HTTP and Stream ◦ Server blocks ◦ Upstreams ◦ Cache Instrumentation ◦ Memory zone utilization
• Read/Write(able)
http://nginx.org/en/docs/http/ngx_http_api_module.html

Prometheus Metrics
�7
• Stores time based metrics • Easy to query, filter
and extract • Scrapes data from
instances • Aggregate multiple
sources of data
https://prometheus.io/

NGINX Prometheus Exporter
�8
• Converts the API status into Prometheus consumable data
• Written in GO • Exposes metrics such as: ◦ Status codes ◦ Connection counts ◦ Upstreams status ◦ Server zone status
• Automatic discovery with Prometheus Annotations
https://github.com/nginxinc/nginx-prometheus-exporter
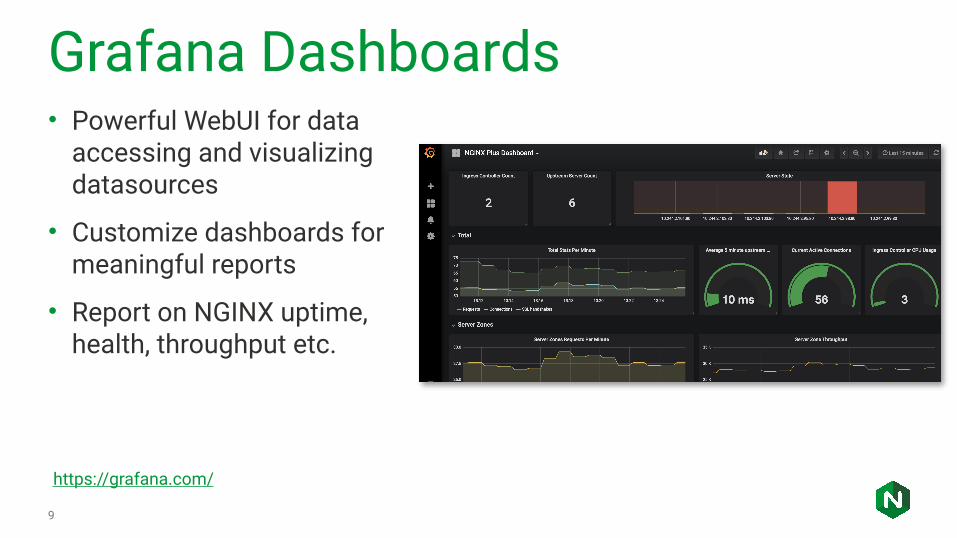
Grafana Dashboards
�9
• Powerful WebUI for data accessing and visualizing datasources
• Customize dashboards for meaningful reports
• Report on NGINX uptime, health, throughput etc.
https://grafana.com/

Demo Time
�10

Q & A
�11


![Docker 及Kubernetes 基础 · richarvey/nginx-php-fpm Container running Nginx + PHP-FPM capable ... 675 [OK] jrcs/letsencrypt-nginx-proxy-companion LetsEncrypt container ... centos/nginx-18-centos7](https://img.dokumen.tips/doc/110x75/5ec38c3a5e3bae053a7989f8/docker-kubernetes-c-richarveynginx-php-fpm-container-running-nginx-php-fpm.jpg)


![Gautreau Ronald - Teoria Y Problemas de Fisica Moderna[1] Copy](https://img.dokumen.tips/doc/110x75/563db8ce550346aa9a972297/gautreau-ronald-teoria-y-problemas-de-fisica-moderna1-copy.jpg)