Embed Size (px)
Citation preview

Projects of the Florida Water and Climate Alliance
Chris MartinezAssociate Professor, University of Florida
Community Building to Create Actionable Science

The Florida Water and Climate Alliance
• Partnership of:– Water utilities– State agencies– Researchers– Local governments
• Science we can use!

The Florida Water and Climate Alliance
www.FloridaWCA.org

Tampa Bay Water
• Regional wholesale water supply authority
• Non‐profit, special district created by interlocal agreement
• 6 member governments
• Serving 2+ million people

Tampa Bay Water• Created in 1998 to end the region’s “water wars”
• Current sources:• Groundwater (13 Wellfields)• Hillsborough and Alafia Rivers• C.W. Bill Young Reservoir• Desalination Plant
1998
2008
2012
Percentage of Water by Source
100%
61%
11%
28%
45.5%45.5%
9%
Groundwater Permit192 MGD
158 MGD
121 MGD
90 MGD
pre 1998
1998
2002
2008
(12-monthmoving
average)

Links Between Information and Decisions
Decision Required Information
Update water-year Allocations
Time-Scale
Monthly, out to 12 months
Operational Allocations
Weekly, out to 4 weeks
Precipitation and Streamflowforecasts
Precipitation, Streamflow and Demand forecasts
Infrastructure Decades Precipitation, Temperature, Streamflow, and Demand Projections

Weekly Municipal Demand
• Forecast Analogs• Global Ensemble Forecast System (GEFS)
• ARIMAX models– Total Rainfall– Number of Wet Days– Consecutive Wet Days– Number of Hot Days
• Uncertainty Reduced
7 Point of Connections

Seasonal Streamflow
Alafia River at Bell Shoals Stratify Flow by Niño3.4
Exploratory Analysis
LEPS Skill Score

National Multi‐Model Ensemble (NMME)
• 6 GCM reforecasts• Downscaled to 12 km• Multiple downscaling methods
• Ensemble performed as well as best single model
DJF JJAPrecip.
NM
ME
Mod
els

Seasonal Reference Evapotranspiration
• Climate Forecast System v2 (CFSv2)
• Downscaled to 12 km• Quantile mapping• Penman Monteith
• Skill highest in winter & during ENSO events
Tmea
nTm
axTm
inR
sW
ind

Statistical Downscaling Methods
UF Downscaling Method Works Best!
Wet season average daily rainfall
Wet season standard deviation of daily rainfall
UFMethod

Hydrologic Implications
0
5
10
15
20
25Ja
nFe
bM
arA
prM
ay Jun
Jul
Aug Se
pO
ctN
ov Dec
Stre
amflo
w (m
3/s)
BCSD_GCMsObs.Cal.
Jan
Feb
Mar
Apr
May Jun
Jul
Aug Se
pO
ctN
ov Dec
SDBC_GCMsObs.Cal.
Jan
Feb
Mar
Apr
May Jun
Jul
Aug Se
pO
ctN
ov Dec
BCSA_GCMsObs.Cal.
0
2
4
6
8
10
Jan
Feb
Mar
Apr
May Jun
Jul
Aug Se
pO
ctN
ov Dec
Stre
amflo
w (m
3/s)
BCSD_GCMsObs.Cal.
Jan
Feb
Mar
Apr
May Jun
Jul
Aug Se
pO
ctN
ov Dec
SDBC_GCMsObs.Cal.
Jan
Feb
Mar
Apr
May Jun
Jul
Aug Se
pO
ctN
ov Dec
BCSA_GCMsObs.Cal.
Alafia River
Cypress Creek
BCSD SDBC BCSA
BCSD SDBC BCSA
UFMethod

Frequency of daily streamflow events
0.01
0.1
1
10
100
1000
0 100 200 300 400 500 600
# of events p
er year
Streamflow (m3/s)
Obs.Cal.BCSD_GCMsSDBC_GCMsBCSA_GCMs
Alafia River
Cypress Creek
0.01
0.1
1
10
100
1000
0 10 20 30 40 50 60 70
# of events p
er year
Streamflow (m3/s)
Obs.Cal.BCSD_GCMsSDBC_GCMsBCSA_GCMs
Max Observed Over-prediction of peaks

Peace River Manasota Regional Water Supply Authority
• Regional wholesale water supply authority
• 300,000 customers
• Peace River is the single source
Peace River Facility

Peace River Supply System
• Highly Seasonal River Flows
• Reservoir
• Largest Aquifer Storage and Recovery (ASR) East of the Mississippi

Peace River Supply System
Storage Is Key to Resiliency

Aquifer Storage and Recovery (ASR)
• When to start ASR recovery?
• Too Soon:– Costs rise (ASR Water treated twice!)
– Higher TDS (blended water quality issue)

Aquifer Storage and Recovery (ASR)
• When to start ASR recovery?
• Too Late:– Less reservoir water to dilute TDS of ASR water– Water restrictions– Pull hard on wells potential salt water upconing

Aquifer Storage and Recovery (ASR)
• Decision Support Tool:– Keetch Byram Drought Index (KBDI)– CPC 1 Month Outlooks– CPC 3 Month Outlooks– Raw water reserves– ASR reserves– River flow
• Different Weights
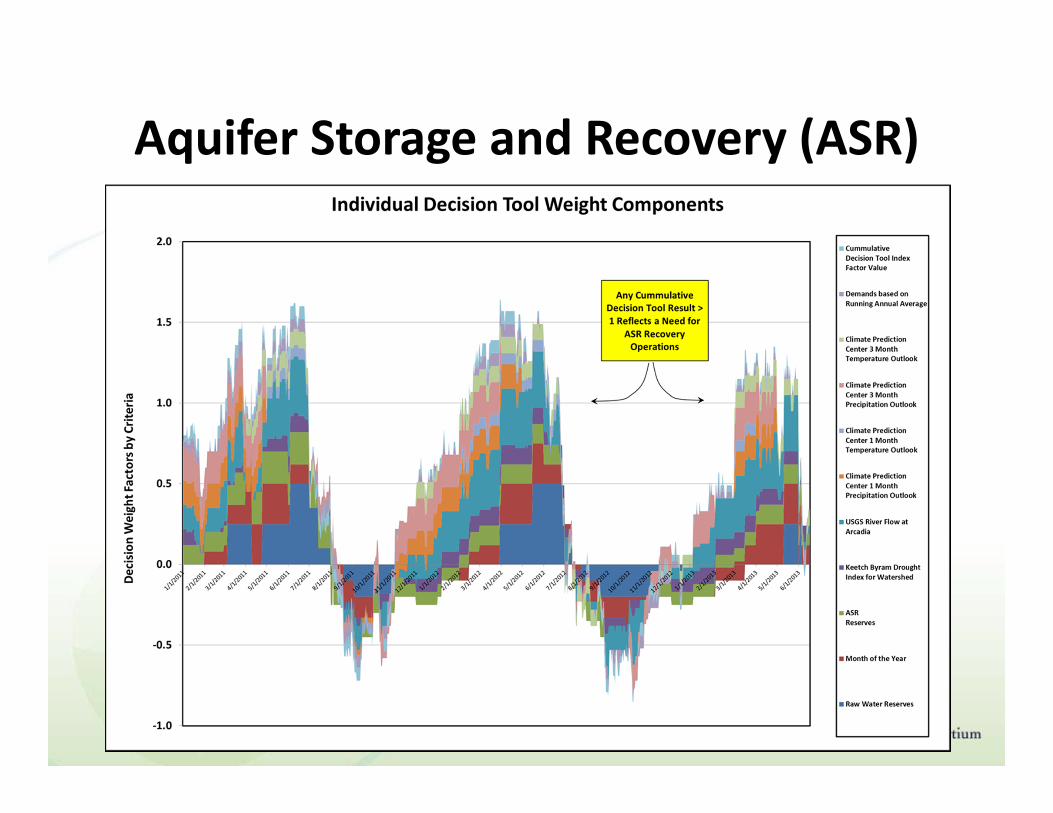
Aquifer Storage and Recovery (ASR)

Aquifer Storage and Recovery (ASR)

Questions?
• NOAA Sectoral Applications Research Program (SARP)
• NOAA Regional Integrated Science and Assessments Program (RISA)
• Tampa Bay Water