Embed Size (px)
Citation preview

U.S. DEPARTMENT OF EDUCATIONNCES 2018-019
Projections of Education Statistics to 2026Forty-fifth Edition
202220222022 202420242024 20262026202520252025202320232023


Projections of Education Statistics to 2026Forty-fifth Edition
April 2018
William J. HussarNational Center for Education Statistics
Tabitha M. BaileyIHS Global Inc.
NCES 2018-019
U.S. DEPARTMENT OF EDUCATION

U.S. Department of Education Betsy DeVos Secretary of Education
Institute of Education Sciences Thomas Brock Commissioner of the National Center for Education Research Delegated the Duties of the Director
National Center for Education Statistics James L. Woodworth Commissioner
The National Center for Education Statistics (NCES) is the primary federal entity for collecting, analyzing, and reporting data related to education in the United States and other nations. It fulfills a congressional mandate to collect, collate, analyze, and report full and complete statistics on the condition of education in the United States; conduct and publish reports and specialized analyses of the meaning and significance of such statistics; assist state and local education agencies in improving their statistical systems; and review and report on education activities in foreign countries.
NCES activities are designed to address high-priority education data needs; provide consistent, reliable, complete, and accurate indicators of education status and trends; and report timely, useful, and high-quality data to the U.S. Department of Education, the Congress, the states, other education policymakers, practitioners, data users, and the general public. Unless specifically noted, all information contained herein is in the public domain.
We strive to make our products available in a variety of formats and in language that is appropriate to a variety of audiences. You, as our customer, are the best judge of our success in communicating information effectively. If you have any comments or suggestions about this or any other NCES product or report, we would like to hear from you. Please direct your comments to
NCES, IES, U.S. Department of Education Potomac Center Plaza 550 12th Street, SW Washington, DC 20202
April 2018
The NCES Home Page address is http://nces.ed.gov. The NCES Publications and Products address is http://nces.ed.gov/pubsearch.
This report was prepared in part under Contract No. ED-IES-14-O-5005 with IHS Global Inc. Mention of trade names, commercial products, or organizations does not imply endorsement by the U.S. Government.
Suggested CitationHussar, W.J., and Bailey, T.M. (2018). Projections of Education Statistics to 2026 (NCES 2018-019). U.S. Department of Education, Washington, DC: National Center for Education Statistics.
Content Contact William J. Hussar (202) 245-6389 [email protected]
Projections of Education Statistics to 2026 iii
ForewordProjections of Education Statistics to 2026 is the 45th report in a series begun in 1964. It includes statistics on elementary and secondary schools and degree-granting postsecondary institutions. This report provides revisions of projections shown in Projections of Education Statistics to 2025 and projections of enrollment, graduates, teachers, and expenditures to the year 2026.
In addition to projections at the national level, the report includes projections of public elementary and secondary school enrollment and public high school graduates to the year 2026 at the state level. The projections in this report were produced by the National Center for Education Statistics (NCES) to provide researchers, policy analysts, and others with state-level projections developed using a consistent methodology. They are not intended to supplant detailed projections prepared for individual states.
Assumptions regarding the population and the economy are the key factors underlying the projections of education statistics. NCES projections do not reflect changes in national, state, or local education policies that may affect education statistics.
Appendix A of this report outlines the projection methodology and describes the models and assumptions used to develop the national and state projections. The enrollment models use enrollment data and population estimates and projections from NCES, the U.S. Census Bureau, and the economic forecasting service IHS Global Inc. The models are based on the mathematical projection of past data patterns into the future. The models also use projections of economic variables from IHS Global Inc.
The projections presented in this report are based on assumptions for the fertility rate, internal migration, net immigration, and mortality rate from the Census Bureau. For further information, see appendix A.
Thomas D. Snyder, Supervisor Annual Reports and Information Staff National Center for Education Statistics

This page intentionally left blank.

Projections of Education Statistics to 2026 v
ContentsPage
Foreword .............................................................................................................................................................................. iiiList of Reference Tables ....................................................................................................................................................... viiList of Figures ....................................................................................................................................................................... xi
About This Report ................................................................................................................................................................. 1Projections .................................................................................................................................................................... 1Limitations of Projections ............................................................................................................................................. 1
Section 1. Elementary and Secondary Enrollment .........................................................................................................3Introduction ................................................................................................................................................................. 3Accuracy of Projections ................................................................................................................................................. 3National ....................................................................................................................................................................... 4State and Regional (Public School Data) ....................................................................................................................... 6Race/Ethnicity (Public School Data) ............................................................................................................................ 8
Section 2. Elementary and Secondary Teachers ..............................................................................................................9Introduction ................................................................................................................................................................. 9Accuracy of Projections ................................................................................................................................................. 9Teachers in Elementary and Secondary Schools .......................................................................................................... 10
Section 3. High School Graduates ................................................................................................................................13Introduction ............................................................................................................................................................... 13Accuracy of Projections ............................................................................................................................................... 13National ..................................................................................................................................................................... 14State and Regional (Public School Data) ..................................................................................................................... 15Race/Ethnicity (Public School Data) .......................................................................................................................... 17
Section 4. Expenditures for Public Elementary and Secondary Education ...................................................................19Introduction ............................................................................................................................................................... 19Accuracy of Projections ............................................................................................................................................... 19Current Expenditures ................................................................................................................................................. 20
Section 5. Enrollment in Degree-Granting Postsecondary Institutions ........................................................................23Introduction ............................................................................................................................................................... 23Accuracy of Projections ............................................................................................................................................... 23Total Enrollment ........................................................................................................................................................ 24Enrollment by Selected Characteristics and Control of Institution .............................................................................. 25First-Time Freshmen Enrollment ................................................................................................................................ 29Full-Time-Equivalent Enrollment, by Control of Institution ...................................................................................... 30

vi Contents
Page
Section 6. Postsecondary Degrees Conferred ...............................................................................................................31Introduction ............................................................................................................................................................... 31Accuracy of Projections ............................................................................................................................................... 31Degrees, by Level of Degree and Sex of Recipient ....................................................................................................... 32
Reference Tables ...........................................................................................................................................................35
Technical Appendixes ...................................................................................................................................................69Appendix A. Introduction to Projection Methodology ........................................................................................................ 71
A.0. Introduction to Projection Methodology ............................................................................................................. 71A.1. Elementary and Secondary Enrollment ............................................................................................................... 78A.2. Elementary and Secondary Teachers .................................................................................................................... 88A.3. High School Graduates ....................................................................................................................................... 95A.4. Expenditures for Public Elementary and Secondary Education .......................................................................... 100A.5. Enrollment in Degree-Granting Postsecondary Institutions ............................................................................... 104A.6. Postsecondary Degrees Conferred ...................................................................................................................... 124
Appendix B. Supplementary Tables ................................................................................................................................... 127Appendix C. Data Sources ................................................................................................................................................. 135Appendix D. References .................................................................................................................................................... 149Appendix E. List of Abbreviations ..................................................................................................................................... 151Appendix F. Glossary ......................................................................................................................................................... 153

Projections of Education Statistics to 2026 vii
List of TablesTable Page
Reference Tables1. Enrollment in elementary, secondary, and degree-granting postsecondary institutions, by level and control
of institution: Selected years, 1869–70 through fall 2026 ..................................................................................... 372. Enrollment in public elementary and secondary schools, by level and grade: Selected years, fall 1980 through
fall 2026 ............................................................................................................................................................... 383. Enrollment in public elementary and secondary schools, by region, state, and jurisdiction: Selected years,
fall 1990 through fall 2026 .................................................................................................................................. 404. Public school enrollment in prekindergarten through grade 8, by region, state, and jurisdiction: Selected
years, fall 1990 through fall 2026 ......................................................................................................................... 425. Public school enrollment in grades 9 through 12, by region, state, and jurisdiction: Selected years, fall 1990
through fall 2026 ................................................................................................................................................. 446. Enrollment and percentage distribution of enrollment in public elementary and secondary schools, by race/
ethnicity and region: Selected years, fall 1995 through fall 2026 .......................................................................... 467. Enrollment and percentage distribution of enrollment in public elementary and secondary schools, by race/
ethnicity and level of education: Fall 1999 through fall 2026 ............................................................................... 488. Public and private elementary and secondary teachers, enrollment, pupil/teacher ratios, and new teacher
hires: Selected years, fall 1955 through fall 2026 .................................................................................................. 509. High school graduates, by sex and control of school: Selected years, 1869–70 through 2026–27 ......................... 5110. Public high school graduates, by region, state, and jurisdiction: Selected years, 1980–81 through 2026–27 ......... 5211. Public high school graduates, by race/ethnicity: 1998–99 through 2026–27 ........................................................ 5412. Current expenditures and current expenditures per pupil in public elementary and secondary schools:
1989–90 through 2026–27 .................................................................................................................................. 5513. Total fall enrollment in degree-granting postsecondary institutions, by attendance status, sex of student,
and control of institution: Selected years, 1947 through 2026 .............................................................................. 56 14. Total fall enrollment in degree-granting postsecondary institutions, by level and control of institution,
attendance status, and sex of student: Selected years, 1970 through 2026 ............................................................ 5815. Total fall enrollment in degree-granting postsecondary institutions, by attendance status, sex, and age:
Selected years, 1970 through 2026 ....................................................................................................................... 6016. Total undergraduate fall enrollment in degree-granting postsecondary institutions, by attendance status,
sex of student, and control and level of institution: Selected years, 1970 through 2026 ........................................ 6217. Total postbaccalaureate fall enrollment in degree-granting postsecondary institutions, by attendance status,
sex of student, and control of institution: 1967 through 2026 ............................................................................. 6418. Total fall enrollment of first-time degree/certificate-seeking students in degree-granting postsecondary
institutions, by attendance status, sex of student, and level and control of institution: 1955 through 2026 .......... 6519. Fall enrollment of U.S. residents in degree-granting postsecondary institutions, by race/ethnicity: Selected
years, 1976 through 2026 .................................................................................................................................... 6620. Full-time-equivalent fall enrollment in degree-granting postsecondary institutions, by control and level of
institution: 1967 through 2026 ............................................................................................................................ 6721. Degrees conferred by postsecondary institutions, by level of degree and sex of student: Selected years,
1869–70 through 2026–27 .................................................................................................................................. 68

viii List of Tables
Table Page
Appendix A Text TablesA. Mean absolute percentage errors (MAPEs) of enrollment projections, by lead time, control of school,
and grade in elementary and secondary schools: MAPEs constructed using projections from Projections of Education Statistics to 1984–85 through Projections of Education Statistics to 2025 ............................................. 81
B. Mean absolute percentage errors (MAPEs) of enrollment projections, by lead time and race/ethnicity: MAPEs constructed using projections from Projections of Education Statistics to 1984–85 through Projections of Education Statistics to 2025 ................................................................................................................................... 83
C. Mean absolute percentage errors (MAPEs) of projections of number of public elementary and secondary school teachers, by lead time: MAPEs constructed using projections from Projections of Education Statistics to 1997–98 through Projections of Education Statistics to 2025 .................................................................................. 91
D. Mean absolute percentage errors (MAPEs) of projections of high school graduates, by lead time and control of school: MAPEs constructed using projections from Projections of Education Statistics to 2000 through Projections of Education Statistics to 2025 .............................................................................................................. 96
E. Mean absolute percentage errors (MAPEs) of projections of public high school graduates, by lead time and race/ethnicity: MAPEs constructed using projections from Projections of Education Statistics to 2000 through Projections of Education Statistics to 2025 .............................................................................................................. 98
F. Mean absolute percentage errors (MAPEs) of projections for total and per pupil current expenditures for public elementary and secondary education, by lead time: MAPEs constructed using projections from Projections of Education Statistics to 1984–85 through Projections of Education Statistics to 2025 .......................... 102
G. Mean absolute percentage errors (MAPEs) of projected enrollment in degree-granting postsecondary institutions, by lead time, sex, and level of institution: MAPEs constructed using projections from Projections of Education Statistics to 2007 through Projections of Education Statistics to 2025 ................................................. 107
H. Mean absolute percentage errors (MAPEs) of projected enrollment in degree-granting postsecondary institutions, by lead time and race/ethnicity: MAPEs constructed using projections from Projections of Education Statistics to 2015 through Projections of Education Statistics to 2025 .................................................... 109
I. Mean absolute percentage errors (MAPEs) of projected first-time freshmen enrollment in degree-granting postsecondary institutions, by lead time and sex: MAPEs constructed using projections from Projections of Education Statistics to 2018 through Projections of Education Statistics to 2025 .................................................... 110
J. Mean absolute percentage errors (MAPEs) of projected associate’s and bachelor’s degrees conferred by degree-granting postsecondary institutions, by lead time: MAPEs constructed using projections from Projections of Education Statistics to 2018 through Projections of Education Statistics to 2025 .................................................... 125

Projections of Education Statistics to 2026 ix
Table Page
Appendix A. Introduction to Projection MethodologyA-1. Summary of forecast assumptions to 2026 ........................................................................................................... 75A-2. Mean absolute percentage errors (MAPEs), by lead time for selected statistics in all elementary and secondary
schools and degree-granting postsecondary institutions: MAPEs constructed using projections from Projections of Education Statistics to 1984–85 through Projections of Education Statistics to 2025 ............................ 76
A-3. Example of constructing mean absolute percentage errors (MAPEs) on fall enrollment in degree-granting institutions, part 1 ............................................................................................................................................... 77
A-4. Example of constructing mean absolute percentage errors (MAPEs) on fall enrollment in degree-granting institutions, part 2 ............................................................................................................................................... 77
A-5. Actual and projected national public school grade progression rates: Fall 2014, and fall 2015 through fall 2026 ............................................................................................................................................................... 84
A-6. Actual and projected national enrollment rates in public schools, by grade level: Fall 2014, and fall 2015 through fall 2026 ................................................................................................................................................. 84
A-7. Mean absolute percentage errors (MAPEs) for projected prekindergarten–12 enrollment in public elementary and secondary schools, by lead time, region, and state: MAPEs constructed using projections from Projections of Education Statistics to 1984–85 through Projections of Education Statistics to 2025 ............................................. 85
A-8. Mean absolute percentage errors (MAPEs) for projected prekindergarten–8 enrollment in public elementary and secondary schools, by lead time, region, and state: MAPEs constructed using projections from Projections of Education Statistics to 1984–85 through Projections of Education Statistics to 2025 ............................................. 86
A-9. Mean absolute percentage errors (MAPEs) for projected grades 9–12 enrollment in public schools, by lead time, region, and state: MAPEs constructed using projections from Projections of Education Statistics to 1984–85 through Projections of Education Statistics to 2025 .................................................................................. 87
A-10. Estimated equations and model statistics for public elementary and secondary teachers based on data from 1972 to 2014 ....................................................................................................................................................... 93
A-11. Percentage distribution of full-time and part-time school teachers, by age, control of school, and teaching status: School year 2011–12 ................................................................................................................... 93
A-12. Percentage distribution of full-time and part-time newly hired teachers, by age and control of school: Selected school years, 1987–88 through 2011–12 ................................................................................................ 93
A-13. Actual and projected continuation rates of full-time and part-time school teachers, by age and control of school: Selected school years, 1993–94 to 1994–95 through 2026–27 to 2027–28 .......................................... 94
A-14. Mean absolute percentage errors (MAPEs) for the projected number of high school graduates in public schools, by lead time, region, and state: MAPEs constructed using projections from Projections of Education Statistics to 2000 through Projections of Education Statistics to 2025 ...................................................................... 99
A-15. Estimated equations and model statistics for current expenditures per pupil in fall enrollment for public elementary and secondary schools, and education revenue from state sources per capita based on data from 1973–74 to 2013–14 ......................................................................................................................................... 103
A-16. Actual and projected enrollment rates of all students at degree-granting postsecondary institutions, by sex, attendance status, and age: Fall 2015, fall 2021, and fall 2026 ........................................................................... 111
A-17. Estimated equations and model statistics for full-time and part-time enrollment rates of males at degree-granting postsecondary institutions based on data from 2000 to 2015 .................................................... 112
A-18. Estimated equations and model statistics for full-time and part-time enrollment rates of females at degree-granting postsecondary institutions based on data from 2000 to 2015 .................................................... 113
A-19. Actual and projected percentages of full-time students at degree-granting postsecondary institutions, by sex, age group, student level, and level of institution: Fall 2015, and fall 2016 through fall 2026 .................. 114
A-20. Actual and projected percentages of part-time students at degree-granting postsecondary institutions, by sex, age group, student level, and level of institution: Fall 2015, and fall 2016 through fall 2026 .................. 115
A-21. Actual and projected enrollment in public degree-granting postsecondary institutions as a percentage of total postsecondary enrollment, by sex, attendance status, student level, and level of institution: Fall 2015, and fall 2016 through fall 2026 .......................................................................................................................... 116
A-22. Estimated equations and model statistics for full-time and part-time enrollment rates of White males at degree-granting postsecondary institutions based on data from 1980 to 2015 .................................................... 116

x List of Tables
Table PageA-23. Estimated equations and model statistics for full-time and part-time enrollment rates of White females at
degree-granting postsecondary institutions based on data from 1980 to 2015 .................................................... 117A-24. Estimated equations and model statistics for full-time and part-time enrollment rates of Black males at
degree-granting postsecondary institutions based on data from 1980 to 2015 .................................................... 118A-25. Estimated equations and model statistics for full-time and part-time enrollment rates of Black females at
degree-granting postsecondary institutions based on data from 1980 to 2015 .................................................... 119A-26. Estimated equations and model statistics for full-time and part-time enrollment rates of Hispanic males at
degree-granting postsecondary institutions based on data from 1980 to 2015 .................................................... 120A-27. Estimated equations and model statistics for full-time and part-time enrollment rates of Hispanic females at
degree-granting postsecondary institutions based on data from 1980 to 2015 ..................................................... 121A-28. Estimated equations and model statistics for full-time and part-time enrollment rates of Asian/Pacific Islander
males at degree-granting postsecondary institutions based on data from 1989 to 2015 ....................................... 122A-29. Estimated equations and model statistics for full-time and part-time enrollment rates of Asian/Pacific Islander
females at degree-granting postsecondary institutions based on data from 1989 to 2015 .................................... 123A-30. Estimated equations and model statistics for degrees conferred, by degree type and sex based on data from
1970–71 to 2014–15 ......................................................................................................................................... 126
Appendix B. Supplementary TablesB-1. Actual and projected prekindergarten- and kindergarten-age populations, by age: 2001 through 2026 .............. 129B-2. Actual and projected school-age populations, by selected ages: 2001 through 2026 ............................................ 130B-3. Actual and projected college-age populations, by selected ages: 2001 through 2026 ........................................... 131B-4. Actual and projected fall enrollment in public elementary and secondary schools, change in fall enrollment
from previous year, resident population, and fall enrollment as a ratio of the population: School years 2001–02 through 2026–27 ................................................................................................................................ 132
B-5. Actual and projected macroeconomic measures of the economy: School years 2001–02 through 2026–27 ........ 133

Projections of Education Statistics to 2026 xi
List of FiguresFigure Page
1. Actual and projected numbers for enrollment in elementary and secondary schools, by grade level: Fall 2001 through fall 2026 .................................................................................................................................... 4
2. Actual and projected numbers for enrollment in elementary and secondary schools, by control of school: Fall 2001 through fall 2026 .................................................................................................................................... 5
3. Projected percentage change in enrollment in public elementary and secondary schools, by state: Fall 2014 and fall 2026 .......................................................................................................................................................... 6
4. Actual and projected numbers for enrollment in public elementary and secondary schools, by region: Fall 2008, fall 2014, and fall 2026 ......................................................................................................................... 7
5. Actual and projected numbers for enrollment in public elementary and secondary schools, by race/ethnicity: Fall 2001 through fall 2026 .................................................................................................................................... 8
6. Actual and projected numbers for elementary and secondary teachers, by control of school: Fall 2001 through fall 2026 ................................................................................................................................................. 10
7. Actual and projected numbers for the pupil/teacher ratios in elementary and secondary schools, by control of school: Fall 2001 through fall 2026 .................................................................................................................. 11
8. Actual and projected numbers for elementary and secondary new teacher hires, by control of school: Fall 1999, fall 2014, and fall 2026 .............................................................................................................................. 12
9. Actual and projected numbers for high school graduates, by control of school: School years 2001–02 through 2026–27 ................................................................................................................................................. 14
10. Projected percentage change in the number of public high school graduates, by state: School years 2012–13 and 2026–27 ........................................................................................................................................................ 15
11. Actual and projected numbers for public high school graduates, by region: School years 2008–09, 2012–13, and 2026–27 ........................................................................................................................................................ 16
12. Actual and projected numbers for public high school graduates, by race/ethnicity: School years 2001–02 through 2026–27 ................................................................................................................................................. 17
13. Actual and projected current expenditures for public elementary and secondary schools (in constant 2015–16 dollars): School years 2001–02 through 2026–27 .................................................................................................. 20
14. Actual and projected current expenditures per pupil in fall enrollment in public elementary and secondary schools (in constant 2015–16 dollars): School years 2001–02 through 2026–27 ................................................... 21
15. Actual and projected population numbers for 18- to 24-year-olds and 25- to 29-year-olds: 2001 through 2026 ...... 2316. Actual and projected numbers for total enrollment in all degree-granting postsecondary institutions: Fall 2001
through fall 2026 .................................................................................................................................................. 2417. Actual and projected numbers for total enrollment in all degree-granting postsecondary institutions, by age
group: Fall 2001, fall 2015, and fall 2026 ............................................................................................................ 2518. Actual and projected numbers for enrollment in all degree-granting postsecondary institutions, by sex: Fall
2001 through fall 2026 ........................................................................................................................................ 2519. Actual and projected numbers for enrollment in all degree-granting postsecondary institutions, by attendance
status: Fall 2001 through fall 2026 ....................................................................................................................... 2620. Actual and projected numbers for enrollment in all degree-granting postsecondary institutions, by level of
enrollment: Fall 2001 through fall 2026 ............................................................................................................... 26
xii List of Figures
Figure Page
21. Actual and projected numbers for enrollment of U.S. residents in all degree-granting postsecondary institutions, by race/ethnicity: Fall 2001 through fall 2026 .................................................................................. 27
22. Actual and projected numbers for enrollment in all degree-granting postsecondary institutions, by control of institution: Fall 2001 through fall 2026 ........................................................................................................... 28
23. Actual and projected numbers for total first-time freshmen fall enrollment in all degree-granting postsecondary institutions, by sex: Fall 2001 through fall 2026 ............................................................................ 29
24. Actual and projected numbers for full-time-equivalent fall enrollment in all degree-granting postsecondary institutions, by control: Fall 2001 through fall 2026 ............................................................................................ 30
25. Actual and projected numbers for associate’s degrees conferred by degree-granting postsecondary institutions, by sex of recipient: Academic years 2001–02 through 2026–27 ........................................................................... 32
26. Actual and projected numbers for bachelor’s degrees conferred by degree-granting postsecondary institutions, by sex of recipient: Academic years 2001–02 through 2026–27 ........................................................................... 32
27. Actual and projected numbers for master’s degrees conferred by degree-granting postsecondary institutions, by sex of recipient: Academic years 2001–02 through 2026–27 ........................................................................... 33
28. Actual and projected numbers for doctor’s degrees conferred by degree-granting postsecondary institutions, by sex of recipient: Academic years 2001–02 through 2026–27 ........................................................................... 33
Projections of Education Statistics to 2026 1
About This ReportPROJECTIONS This edition of Projections of Education Statistics provides projections for key education statistics, including enrollment, graduates, teachers, and expenditures in elementary and secondary public and private schools, as well as enrollment and degrees conferred at degree-granting postsecondary institutions. Included are national data on enrollment and graduates for at least the past 15 years and projections to the year 2026. Also included are state-level data on enrollment in public elementary and secondary schools and public high schools beginning in 1990, with projections to 2026. This report is organized by the level of schooling with sections 1, 2, 3, and 4 covering aspects of elementary and secondary education and sections 5 and 6 covering aspects of postsecondary education.
There are a number of limitations in projecting some statistics. Because of this, state-level data on enrollment and graduates in private elementary and secondary schools and on enrollment and degrees conferred in degree-granting postsecondary institutions are not included. Neither the actual numbers nor the projections of public and private elementary and secondary school enrollment include homeschooled students. Projections of elementary and secondary school enrollment and public high school graduates by age, state, and race/ethnicity are not included as the projections of the population by age, state, and race/ethnicity are not presently available. While there were enough years of data to produce projections of public elementary and secondary enrollment separately for Asians and Pacific Islanders, there were not enough years of data to produce separate projections for Asians and Pacific Islanders for either public high school graduates or enrollment in degree-granting postsecondary institutions.
Similar methodologies were used to obtain a uniform set of projections for each of the 50 states and the District of Columbia. These projections are further adjusted to agree with the national projections of public elementary and secondary school enrollment and public high school graduates contained in this report.
The summary of projections provides highlights of the national and state data, while the reference tables and figures present more detail. All calculations within Projections of Education Statistics are based on unrounded estimates. Therefore, the reader may find that a calculation, such as a difference or percentage change, cited in the text or figure may not be identical to the calculation obtained by using the rounded values shown in the accompanying tables. Most figures in this report present historical and forecasted data from 2001 through 2026. The shaded area of these figures
highlights the projected data and begins at the last year of actual data and ends in 2026. As the last year of historical data differs by survey, the year in which the shaded area begins also differs.
Most statements in sections 1 through 6 examine a single statistic over a period of time. In each case, a trend test using linear regression was conducted to test for structure in the data over that time period. If the p value for the trend variable was less than .05, the text states that the statistic has either increased or decreased. If the p value was greater than 0.05 and the data for both the first and last years of the time period come from a universe sample and/or are projections, then the text compares the first and last years in the time period. However, if the data for at least one of the two years came from a sample survey, a two-tailed t test at the .05 level was conducted to determine if any apparent difference between the data for the two years is not reliably measurable due to the uncertainty around the data. Depending on the results of the test, the text will either include a comparison of the two numbers or say that there was no measurable difference between the two numbers.
Appendix A describes the methodology and assumptions used to develop the projections; appendix B presents supplementary tables; appendix C describes data sources; appendix D is a list of the references; appendix E presents a list of abbreviations; and appendix F is a glossary of terms.
LIMITATIONS OF PROJECTIONS Projections of a time series usually differ from the final reported data due to errors from many sources, such as the properties of the projection methodologies, which depend on the validity of many assumptions.
The mean absolute percentage error is one way to express the forecast accuracy of past projections. This measure expresses the average of the absolute values of errors in percentage terms, where errors are the differences between past projections and actual data. For example, based on past editions of Projections of Education Statistics, the mean absolute percentage errors of public school enrollment in grades prekindergarten through 12 for lead times of 1, 2, 5, and 10 years were 0.3, 0.5, 1.2, and 2.4 percent, respectively. In contrast, mean absolute percentage errors of private school enrollment in grades prekindergarten through 8 for lead times of 1, 2, 5, and 10 years were 3.1, 5.8, 8.3, and 22.2 percent, respectively. For more information on mean absolute percentage errors, see table A-2 in appendix A.

This page intentionally left blank.

Projections of Education Statistics to 2026 3
Section 1Elementary and
Secondary EnrollmentINTRODUCTIONTotal public and private elementary and secondary school enrollment was 56 million in fall 2014, representing a 3 percent increase since fall 2001 (table 1). Between fall 2014, the last year of actual public school data, and fall 2026, a further increase of 3 percent is expected. Public school enrollment is projected to be higher in 2026 than in 2014 while private school enrollment is projected to be lower. Public school enrollments are projected to be higher in 2026 than in 2014 for Blacks, Hispanics, Asians/Pacific Islanders, and students of Two or more races (table 6). Enrollment is projected to be lower for Whites and American Indians/Alaska Natives. Public school enrollments are projected to be higher in 2026 than in 2014 for the South and West, and to be lower for the Northeast and Midwest (table 3).
Factors affecting the projectionsThe grade progression rate method was used to project school enrollments. This method assumes that future trends in factors affecting enrollments will be consistent with past patterns. It implicitly includes the net effect of factors such as dropouts, deaths, nonpromotion, transfers to and from public schools, and state level migration. See appendixes A.0 and A.1 for more details.
Factors that were not consideredThe projections do not assume changes in policies or attitudes that may affect enrollment levels. For example, they do not account for changing state and local policies on prekindergarten (preK) and kindergarten programs. Continued expansion of these programs could lead to higher enrollments at the elementary school level. Projections exclude the number of students who are homeschooled.
Students of Two or more racesThis is the sixth edition of Projections of Education Statistics to include actual and projected numbers for enrollment in public elementary and secondary schools for students of Two or more races. Collection of enrollment data for this racial/ethnic group began in 2008. The actual values from 2008 through 2014 and all the projected values for enrollments of the other racial/ethnic groups are lower than they would have been if this racial/ethnic category had not been added.
Accuracy of ProjectionsAn analysis of projection errors from the past 33 editions of Projections of Education Statistics indicates that the mean absolute percentage errors (MAPEs) for lead times of 1, 2, 5, and 10 years out for projections of public school enrollment in grades prekindergarten–12 were 0.3, 0.5, 1.2, and 2.4 percent, respectively. For the 1-year-out prediction, this means that the methodology used by the National Center for Education Statistics (NCES) has produced projections that have, on average, deviated from actual observed values by 0.3 percent. For projections of public school enrollment in grades prekindergarten–8, the MAPEs for lead times of 1, 2, 5, and 10 years out were 0.3, 0.6, 1.4, and 3.0 percent, respectively, while the MAPEs for projections of public school enrollment in grades 9–12 were 0.4, 0.7, 1.2, and 2.4 percent, respectively, for the same lead times. An analysis of projection errors from the past 15 editions of Projections of Education Statistics indicates that the MAPEs for lead times of 1, 2, 5, and 10 years out for projections of private school enrollment in grades prekindergarten–12 were 2.8, 5.5, 7.3, and 18.6 percent, respectively. For projections of private school enrollment in grades prekindergarten–8, the MAPEs for lead times of 1, 2, 5, and 10 years out were 3.1, 5.8, 8.3, and 22.2 percent, respectively, while the MAPEs for projections of private school enrollment in grades 9–12 were 2.9, 4.2, 4.1, and 7.2 percent, respectively, for the same lead times. For more information, see table A-2 in appendix A.
4 Section 1. Elementary and Secondary Enrollment
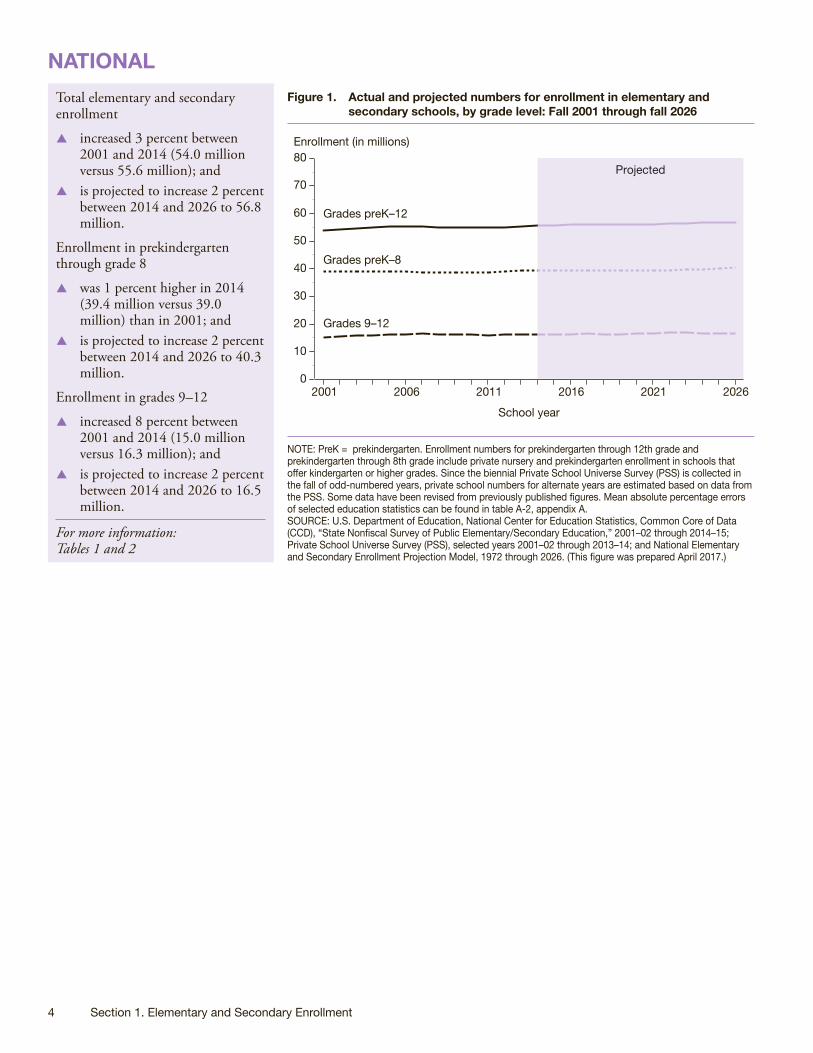
NATIONALTotal elementary and secondary enrollment
S increased 3 percent between 2001 and 2014 (54.0 million versus 55.6 million); and
S is projected to increase 2 percent between 2014 and 2026 to 56.8 million.
Enrollment in prekindergarten through grade 8
S was 1 percent higher in 2014 (39.4 million versus 39.0 million) than in 2001; and
S is projected to increase 2 percent between 2014 and 2026 to 40.3 million.
Enrollment in grades 9–12
S increased 8 percent between 2001 and 2014 (15.0 million versus 16.3 million); and
S is projected to increase 2 percent between 2014 and 2026 to 16.5 million.
For more information: Tables 1 and 2
Figure 1. Actual and projected numbers for enrollment in elementary and secondary schools, by grade level: Fall 2001 through fall 2026
2001 2006 2011 2016 2021 20260
10
20
30
40
50
60
70
80
Grades preK–12
Enrollment (in millions)
Grades preK–8
Grades 9–12
Projected
School year
NOTE: PreK = prekindergarten. Enrollment numbers for prekindergarten through 12th grade and prekindergarten through 8th grade include private nursery and prekindergarten enrollment in schools that offer kindergarten or higher grades. Since the biennial Private School Universe Survey (PSS) is collected in the fall of odd-numbered years, private school numbers for alternate years are estimated based on data from the PSS. Some data have been revised from previously published figures. Mean absolute percentage errors of selected education statistics can be found in table A-2, appendix A. SOURCE: U.S. Department of Education, National Center for Education Statistics, Common Core of Data (CCD), “State Nonfiscal Survey of Public Elementary/Secondary Education,” 2001–02 through 2014–15; Private School Universe Survey (PSS), selected years 2001–02 through 2013–14; and National Elementary and Secondary Enrollment Projection Model, 1972 through 2026. (This figure was prepared April 2017.)
Projections of Education Statistics to 2026 5
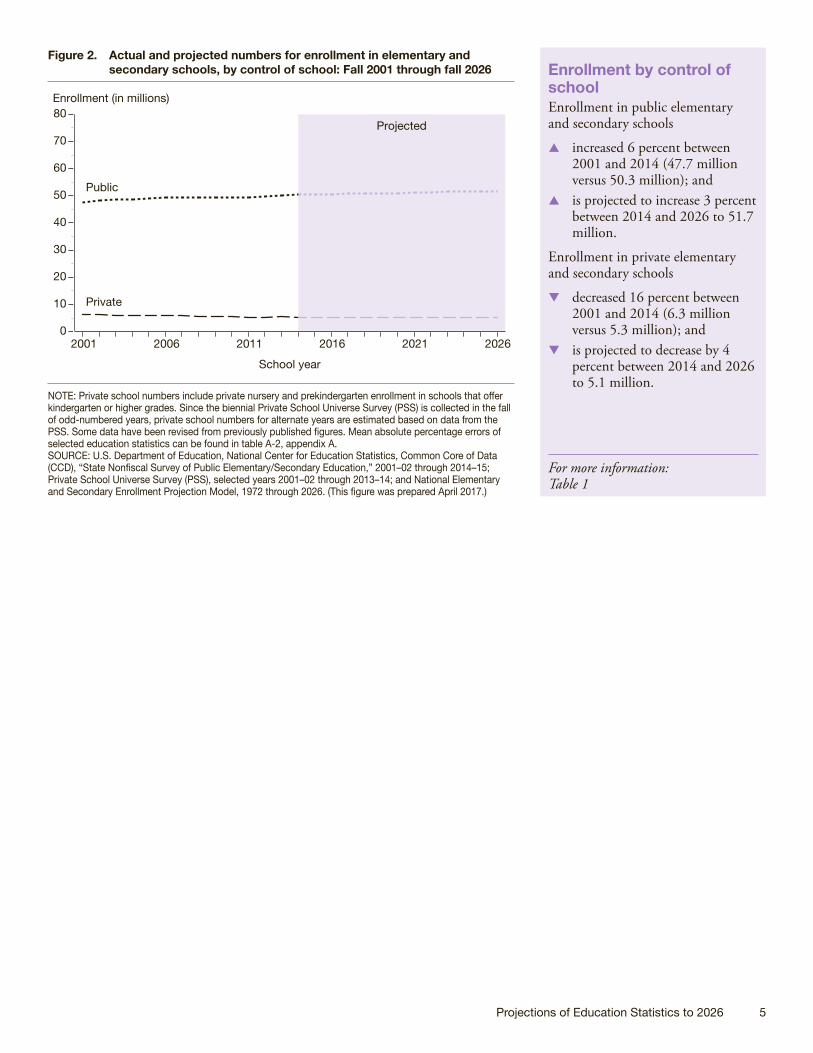
Enrollment by control of schoolEnrollment in public elementary and secondary schools
S increased 6 percent between 2001 and 2014 (47.7 million versus 50.3 million); and
S is projected to increase 3 percent between 2014 and 2026 to 51.7 million.
Enrollment in private elementary and secondary schools
T decreased 16 percent between 2001 and 2014 (6.3 million versus 5.3 million); and
T is projected to decrease by 4 percent between 2014 and 2026 to 5.1 million.
For more information: Table 1
Figure 2. Actual and projected numbers for enrollment in elementary and secondary schools, by control of school: Fall 2001 through fall 2026
2001 2006 2011 2016 2021 20260
10
20
30
40
50
60
70
80
Public
Enrollment (in millions)
Private
Projected
School year
NOTE: Private school numbers include private nursery and prekindergarten enrollment in schools that offer kindergarten or higher grades. Since the biennial Private School Universe Survey (PSS) is collected in the fall of odd-numbered years, private school numbers for alternate years are estimated based on data from the PSS. Some data have been revised from previously published figures. Mean absolute percentage errors of selected education statistics can be found in table A-2, appendix A. SOURCE: U.S. Department of Education, National Center for Education Statistics, Common Core of Data (CCD), “State Nonfiscal Survey of Public Elementary/Secondary Education,” 2001–02 through 2014–15; Private School Universe Survey (PSS), selected years 2001–02 through 2013–14; and National Elementary and Secondary Enrollment Projection Model, 1972 through 2026. (This figure was prepared April 2017.)

6 Section 1. Elementary and Secondary Enrollment
STATE AND REGIONAL (PUBLIC SCHOOL DATA)
Enrollment by stateThe expected 3 percent national increase in public school enrollment between 2014 and 2026 plays out differently among the states.
S Enrollments are projected to be higher in 2026 than in 2014 for 31 states and the District of Columbia, with projected enrollments• 5 percent or more higher in
21 states and the District of Columbia; and
• less than 5 percent higher in 10 states.
T Enrollments are projected to be lower in 2026 than in 2014 for 19 states, with projected enrollments • 5 percent or more lower in 10
states; and• less than 5 percent lower in
9 states.
For more information: Tables 3 through 5
Figure 3. Projected percentage change in enrollment in public elementary and secondary schools, by state: Fall 2014 and fall 2026
5 percent or more lower in 2026 than in 2014
DC
RI
DE
Less than 5 percent lower in 2026 than in 2014 Less than 5 percent higher in 2026 than in 2014 5 percent or more higher in 2026 than in 2014
NOTE: Mean absolute percentage errors of enrollment in public elementary and secondary schools by state and region can be found in table A-7, appendix A. Although rounded numbers are displayed, the figures are based on unrounded numbers. SOURCE: U.S. Department of Education, National Center for Education Statistics, Common Core of Data (CCD), “State Nonfiscal Survey of Public Elementary/Secondary Education,” 2014–15; and State Public Elementary and Secondary Enrollment Projection Model, 1980 through 2026. (This figure was prepared April 2017.)

Projections of Education Statistics to 2026 7
Enrollment by regionPublic elementary and secondary enrollment is projected to
T decrease 5 percent between 2014 and 2026 for students in the Northeast;
T decrease 3 percent between 2014 and 2026 for students in the Midwest;
S increase 8 percent between 2014 and 2026 in the South; and
S increase 4 percent between 2014 and 2026 in the West.
For more information: Tables 3 through 5
Figure 4. Actual and projected numbers for enrollment in public elementary and secondary schools, by region: Fall 2008, fall 2014, and fall 2026
Northeast Midwest South West0
5
10
15
20
25
8.1 8.0 7.6
10.7 10.6 10.2
18.519.5
21.1
12.0 12.3 12.8
Enrollment (in millions)
2008 (actual) 2014 (actual) 2026 (projected)Region
NOTE: Calculations are based on unrounded numbers. See the glossary for a list of the states in each region. Mean absolute percentage errors of enrollment in public elementary and secondary schools by state and region can be found in table A-7, appendix A. Although rounded numbers are displayed, the figures are based on unrounded estimates. Some data have been revised from previously published figures. SOURCE: U.S. Department of Education, National Center for Education Statistics, Common Core of Data (CCD), “State Nonfiscal Survey of Public Elementary/Secondary Education,” 2008–09 and 2014–15; and State Public Elementary and Secondary Enrollment Projection Model, 1980 through 2026. (This figure was prepared April 2017.)

8 Section 1. Elementary and Secondary Enrollment
RACE/ETHNICITY (PUBLIC SCHOOL DATA)
Enrollment by race/ethnicityEnrollment in public elementary and secondary schools is projected to
T decrease 6 percent between 2014 and 2026 for students who are White;
S increase 1 percent between 2014 and 2026 for students who are Black;
S increase 17 percent between 2014 and 2026 for students who are Hispanic;
S increase 18 percent between 2014 and 2026 for students who are Asian/Pacific Islander;
T decrease 12 percent between 2014 and 2026 for students who are American Indian/Alaska Native; and
S increase 19 percent between 2014 and 2026 for students who are of Two or more races. (The line for this racial/ethnic group in figure 5 begins in 2010 when data for that group became available for all 50 states and the District of Columbia.)
For more information: Tables 6 and 7
Figure 5. Actual and projected numbers for enrollment in public elementary and secondary schools, by race/ethnicity: Fall 2001 through fall 2026
2001 2006 2011 2016 2021 20260
10
20
30
40
White
HispanicBlack
Asian/Pacific Islander
American Indian/Alaska Native
Two or more races
Enrollment (in millions)
Projected
School year
NOTE: Race categories exclude persons of Hispanic ethnicity. Enrollment data for students not reported by race/ethnicity were prorated by state and grade to match state totals. Data on students of Two or more races were not collected separately prior to 2008 and data on students of Two or more races from 2008 and 2009 were not reported by all states. Only in 2010 and later years were those data available for all 50 states. Total counts of ungraded students were prorated to prekindergarten through grade 8 and grades 9 through 12 based on prior reports. Some data have been revised from previously published figures. Mean absolute percentage errors of selected education statistics can be found in table A-2, appendix A. SOURCE: U.S. Department of Education, National Center for Education Statistics, Common Core of Data (CCD), “State Nonfiscal Survey of Public Elementary/Secondary Education,” 2001–02 through 2014–15; and National Public Elementary and Secondary Enrollment by Race/Ethnicity Projection Model, 1994 through 2026. (This figure was prepared April 2017.)

Projections of Education Statistics to 2026 9
Section 2Elementary and
Secondary TeachersINTRODUCTIONBetween fall 2014, the last year of actual public school data, and fall 2026, the number of teachers in elementary and secondary schools is projected to rise (table 8). The increase is projected to occur in public schools. The number of teachers in private schools in 2026 is projected to be about the same as 2014. Both public and private schools are projected to experience a decline in pupil/teacher ratios. The annual number of new teacher hires is projected to be higher in 2026 than in 2014 in public and private schools.
Factors affecting the projectionsThe projections of the number of elementary and secondary teachers are related to projected levels of enrollments and education revenue receipts from state sources per capita. For more details, see appendixes A.0 and A.2.
Factors that were not consideredThe projections do not take into account possible changes in the number of teachers due to the effects of government policies.
About pupil/teacher ratiosThe overall elementary and secondary pupil/teacher ratio and pupil/teacher ratios for public and private schools were computed based on elementary and secondary enrollment and the number of classroom teachers by control of school.
About new teacher hiresA teacher is considered to be a new teacher hire for a certain control of school (public or private) for a given year if the teacher teaches in that control that year but had not taught in that control in the previous year. A teacher who moves from teaching in one control of school to the other control is considered a new teacher hire, but a teacher who moves from one school to another school in the same control is not considered a new teacher hire.
Accuracy of ProjectionsAn analysis of projection errors from the past 27 editions of Projections of Education Statistics that included projections of teachers indicates that the mean absolute percentage errors (MAPEs) for projections of classroom teachers in public elementary and secondary schools were 0.7 percent for 1 year out, 1.4 percent for 2 years out, 3.1 percent for 5 years out, and 6.1 percent for 10 years out. For the 1-year-out prediction, this means that one would expect the projection to be within 0.7 percent of the actual value, on average. For more information on the MAPEs of different National Center for Education Statistics (NCES) projection series, see table A-2 in appendix A.

10 Section 2. Elementary and Secondary Teachers
TEACHERS IN ELEMENTARY AND SECONDARY SCHOOLS
Number of teachersThe total number of elementary and secondary teachers
S was 4 percent higher in 2014 than in 2001 (3.6 million versus 3.4 million), a period of 13 years; and
S is projected to increase 6 percent between 2014 and 2026 to 3.8 million, a period of 12 years.
The number of teachers in public elementary and secondary schools
S was 4 percent higher in 2014 than in 2001 (3.1 million versus 3.0 million); and
S is projected to increase 7 percent between 2014 and 2026 to 3.3 million.
The number of teachers in private elementary and secondary schools
� was not measurably different in 2014 (436,000 versus 441,000) than in 2001; and
� is projected to be about the same in 2026 (434,000) as in 2014.
For more information: Table 8
Figure 6. Actual and projected numbers for elementary and secondary teachers, by control of school: Fall 2001 through fall 2026
2001 2006 2011 2016 2021 20260
1
2
3
4
5Teachers (in millions)
School year
Total
Private
Public
Projected
NOTE: Since the biennial Private School Universe Survey (PSS) is collected in the fall of odd-numbered years, private school numbers for alternate years are estimated based on data from the PSS. Data for teachers are expressed in full-time equivalents (FTE). Counts of private school teachers include prekindergarten through grade 12 in schools offering kindergarten or higher grades. Counts of public school teachers include prekindergarten through grade 12. Some data have been revised from previously published figures. Mean absolute percentage errors of selected education statistics can be found in table A-2, appendix A. SOURCE: U.S. Department of Education, National Center for Education Statistics, Common Core of Data (CCD), “State Nonfiscal Survey of Public Elementary/Secondary Education,” 2001–02 through 2014–15; Private School Universe Survey (PSS), selected years, 2001–02 through 2013–14; Elementary and Secondary Teacher Projection Model, 1973 through 2026. (This figure was prepared April 2017.)

Projections of Education Statistics to 2026 11
Pupil/teacher ratiosThe pupil/teacher ratio in all elementary and secondary schools
T was lower in 2014 than in 2001 (15.6 versus 15.7); and
T is projected to decrease to 15.0 in 2026.
The pupil/teacher ratio in public elementary and secondary schools
S was higher in 2014 than in 2001 (16.1 versus 15.9); and
T is projected to decrease to 15.4 in 2026.
The pupil/teacher ratio in private elementary and secondary schools
T decreased from 14.3 to 12.2 between 2001 and 2014; and
T is projected to decrease to 11.8 in 2026.
For more information: Table 8
Figure 7. Actual and projected numbers for the pupil/teacher ratios in elementary and secondary schools, by control of school: Fall 2001 through fall 2026
2001 2006 2011 2016 2021 20260
5
10
15
20
25Ratio
Total
Private
Public
School year
Projected
NOTE: Since the biennial Private School Universe Survey (PSS) is collected in the fall of odd-numbered years, private school numbers for alternate years are estimated based on data from the PSS. Data for teachers are expressed in full-time equivalents (FTE). Counts of private school teachers and enrollment include prekindergarten through grade 12 in schools offering kindergarten or higher grades. Counts of public school teachers and enrollment include prekindergarten through grade 12. Some data have been revised from previously published figures. Mean absolute percentage errors of selected education statistics can be found in table A-2, appendix A. SOURCE: U.S. Department of Education, National Center for Education Statistics, Common Core of Data (CCD), “State Nonfiscal Survey of Public Elementary/Secondary Education,” 2001–02 through 2014–15; Private School Universe Survey (PSS), selected years, 2001–02 through 2013–14; National Elementary and Secondary Enrollment Projection Model, 1972 through 2026; and Elementary and Secondary Teacher Projection Model, 1973 through 2026. (This figure was prepared April 2017.)
12 Section 2. Elementary and Secondary Teachers
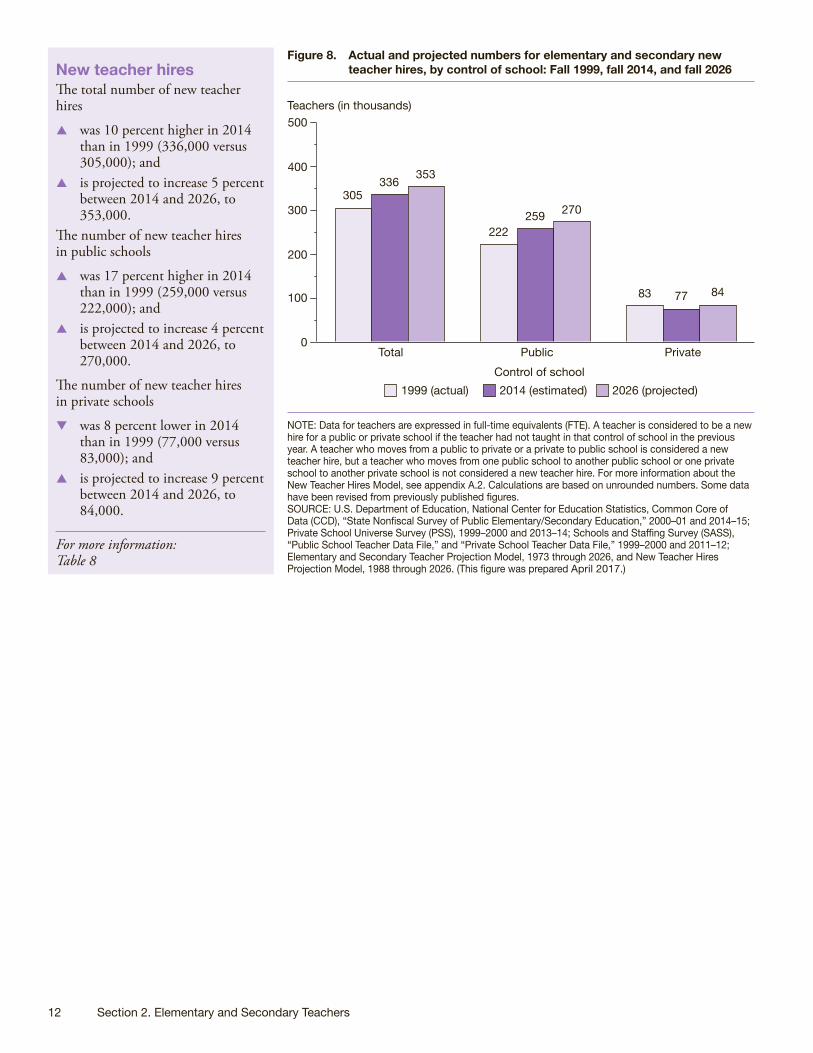
New teacher hiresThe total number of new teacher hires
S was 10 percent higher in 2014 than in 1999 (336,000 versus 305,000); and
S is projected to increase 5 percent between 2014 and 2026, to 353,000.
The number of new teacher hires in public schools
S was 17 percent higher in 2014 than in 1999 (259,000 versus 222,000); and
S is projected to increase 4 percent between 2014 and 2026, to 270,000.
The number of new teacher hires in private schools
T was 8 percent lower in 2014 than in 1999 (77,000 versus 83,000); and
S is projected to increase 9 percent between 2014 and 2026, to 84,000.
For more information: Table 8
Figure 8. Actual and projected numbers for elementary and secondary new teacher hires, by control of school: Fall 1999, fall 2014, and fall 2026
Total Public Private0
100
200
300
400
500
305336 353
222259 270
83 77 84
Teachers (in thousands)
1999 (actual) 2014 (estimated) 2026 (projected)Control of school
NOTE: Data for teachers are expressed in full-time equivalents (FTE). A teacher is considered to be a new hire for a public or private school if the teacher had not taught in that control of school in the previous year. A teacher who moves from a public to private or a private to public school is considered a new teacher hire, but a teacher who moves from one public school to another public school or one private school to another private school is not considered a new teacher hire. For more information about the New Teacher Hires Model, see appendix A.2. Calculations are based on unrounded numbers. Some data have been revised from previously published figures. SOURCE: U.S. Department of Education, National Center for Education Statistics, Common Core of Data (CCD), “State Nonfiscal Survey of Public Elementary/Secondary Education,” 2000–01 and 2014–15; Private School Universe Survey (PSS), 1999–2000 and 2013–14; Schools and Staffing Survey (SASS), “Public School Teacher Data File,” and “Private School Teacher Data File,” 1999–2000 and 2011–12; Elementary and Secondary Teacher Projection Model, 1973 through 2026, and New Teacher Hires Projection Model, 1988 through 2026. (This figure was prepared April 2017.)

Projections of Education Statistics to 2026 13
Section 3 High School Graduates
INTRODUCTIONThe number of high school graduates increased nationally by 20 percent between 2001–02 and 2012–13, the last year of actual data for public schools (table 9). The number of high school graduates is projected to be 3 percent higher in 2026–27 than in 2012–13. The number of public high school graduates is projected to be higher in 2026–27 than in 2012–13 while the number of private high school graduates is projected to be lower. The numbers of public high school graduates are projected to be higher in 2026–27 than in 2012–13 in the South and West and lower in the Northeast and Midwest (table 10).
Factors affecting the projectionsThe projections of high school graduates are related to projections of 12th-graders and the historical relationship between the number of 12th-graders and the number of high school graduates. The methodology implicitly includes the net effect of factors such as dropouts, transfers to and from public schools, and state-level migration. For more details, see appendixes A.0 and A.3.
About high school graduatesA high school graduate is defined as an individual who has received formal recognition from school authorities, by the granting of a diploma, for completing a prescribed course of study. This definition does not include other high school completers or high school equivalency recipients. Projections of graduates could be affected by changes in policies influencing graduation requirements.
High school graduates of Two or more racesThis is the fourth edition of Projections of Education Statistics to include actual and projected numbers for high school graduates of Two or more races. Collection of high school graduate data for this racial/ethnic group began in 2008–09. The actual values from 2008–09 through 2012–13 and all the projected values for high school graduates of the other racial/ethnic groups are lower than they would have been if this racial/ethnic category had not been added.
Accuracy of ProjectionsFor National Center for Education Statistics (NCES) projections of public high school graduates produced over the last 26 editions, the mean absolute percentage errors (MAPEs) for lead times of 1, 2, 5, and 10 years out were 1.0, 1.1, 2.5, and 5.1, respectively. For the 1-year-out prediction, this means that one would expect the projection to be within 0.9 percent of the actual value, on average. For NCES projections of private high school graduates produced over the last 15 editions, the MAPEs for lead times of 1, 2, 5, and 10 years out were 1.8, 1.5, 4.9, and 4.9 percent, respectively. For more information, see table A-2 in appendix A.

14 Section 3. High School Graduates
NATIONAL
The total number of high school graduates
S increased 20 percent between 2001–02 and 2012–13 (2.9 million versus 3.5 million), a period of 11 years; and
S is projected to increase 3 percent between 2012–13 and 2026–27 to 3.6 million.
The number of public high school graduates
S increased 21 percent between 2001–02 and 2012–13 (2.6 million versus 3.2 million); and
S is projected to increase 5 percent between 2012–13 and 2026–27 to 3.3 million.
The number of private high school graduates
S increased 8 percent between 2001–02 and 2012–13 (285,000 versus 309,000); and
T is projected to decrease 13 percent between 2012–13 and 2026–27 to 270,000.
For more information: Table 9
Figure 9. Actual and projected numbers for high school graduates, by control of school: School years 2001–02 through 2026–27
2001–02 2006–07 2011–12 2016–17 2021–22 2026–270
1
2
3
4High school graduates (in millions)
Total
Public
Private
School year
Projected
0
1
2
3
4
NOTE: Since the biennial Private School Universe Survey (PSS) is collected in the fall of odd-numbered years and the numbers collected for high school graduates are for the preceding year, private school numbers for odd years are estimated based on data from the PSS. Includes graduates of regular day school programs. Excludes graduates of other programs, when separately reported, and recipients of high school equivalency certificates. Some data have been revised from previously published figures. Mean absolute percentage errors of selected education statistics can be found in table A-2, appendix A. SOURCE: U.S. Department of Education, National Center for Education Statistics, Common Core of Data (CCD), “State Nonfiscal Survey of Public Elementary/Secondary Education,” 2002–03 through 2009–10; “State Dropout and Completion Data File,” 2010–11 through 2013–14; Private School Universe Survey (PSS), selected years, 2001–02 through 2013–14; and National High School Graduates Projection Model, 1972–73 through 2026–27. (This figure was prepared April 2017.)

Projections of Education Statistics to 2026 15
STATE AND REGIONAL (PUBLIC SCHOOL DATA)
High school graduates by stateThe number of public high school graduates is projected to be higher in 2026–27 than in 2012–13. This plays out differently among the states.
S High school graduates are projected to be higher in 2026–27 than in 2012–13 for 32 states and the District of Columbia, with projected high school graduates• 5 percent or more higher in
29 states and the District of Columbia; and
• less than 5 percent higher in 3 states.
T High school graduates are projected to be lower in 2026–27 than in 2012–13 for 18 states, with projected high school graduates • 5 percent or more lower in 7
states; and • less than 5 percent lower in
11 states.
For more information: Table 10
Figure 10. Projected percentage change in the number of public high school graduates, by state: School years 2012–13 and 2026–27
5 percent or more lower in 2026–27 than in 2012–13
RI
DE
DC
Less than 5 percent lower in 2026–27 than in 2012–13Less than 5 percent higher in 2026–27 than in 2012–135 percent or more higher in 2026–27 than in 2012–13
NOTE: Includes graduates of regular day school programs. Excludes graduates of other programs, when separately reported, and recipients of high school equivalency certificates. Calculations are based on unrounded numbers. Mean absolute percentage errors of public high school graduates by state and region can be found in table A-14, appendix A. SOURCE: U.S. Department of Education, National Center for Education Statistics, Common Core of Data (CCD), “State Dropout and Completion Data File,” 2013–14; and State Public High School Graduates Projection Model, 1980–81 through 2026–27. (This figure was prepared April 2017.)
16 Section 3. High School Graduates
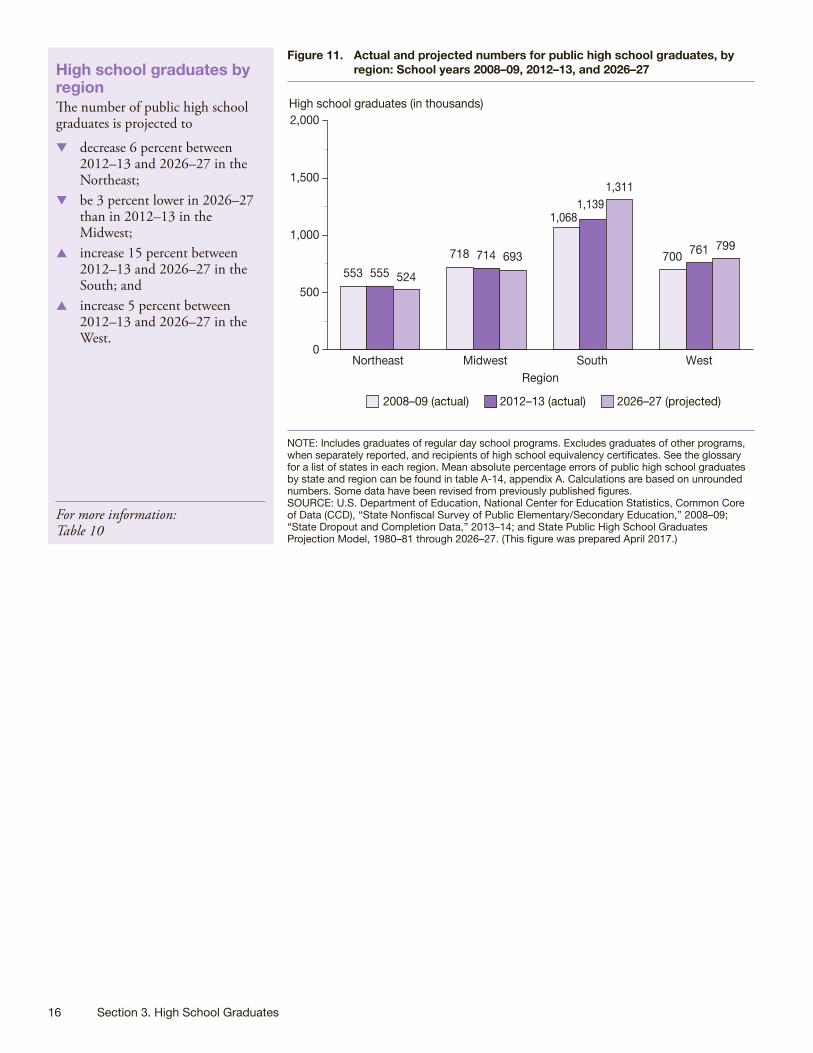
High school graduates by regionThe number of public high school graduates is projected to
T decrease 6 percent between 2012–13 and 2026–27 in the Northeast;
T be 3 percent lower in 2026–27 than in 2012–13 in the Midwest;
S increase 15 percent between 2012–13 and 2026–27 in the South; and
S increase 5 percent between 2012–13 and 2026–27 in the West.
For more information: Table 10
Figure 11. Actual and projected numbers for public high school graduates, by region: School years 2008–09, 2012–13, and 2026–27
Northeast Midwest SouthRegion
West0
500
1,000
1,500
2,000
553 555 524
718 714 693
1,0681,139
1,311
700 761 799
High school graduates (in thousands)
2008–09 (actual) 2012–13 (actual) 2026–27 (projected)
NOTE: Includes graduates of regular day school programs. Excludes graduates of other programs, when separately reported, and recipients of high school equivalency certificates. See the glossary for a list of states in each region. Mean absolute percentage errors of public high school graduates by state and region can be found in table A-14, appendix A. Calculations are based on unrounded numbers. Some data have been revised from previously published figures. SOURCE: U.S. Department of Education, National Center for Education Statistics, Common Core of Data (CCD), “State Nonfiscal Survey of Public Elementary/Secondary Education,” 2008–09; “State Dropout and Completion Data,” 2013–14; and State Public High School Graduates Projection Model, 1980–81 through 2026–27. (This figure was prepared April 2017.)

Projections of Education Statistics to 2026 17
RACE/ETHNICITY (PUBLIC SCHOOL DATA)
High school graduates by race/ethnicityThe number of public high school graduates is projected to
T decrease 10 percent between 2012–13 and 2026–27 (1,791,000 versus 1,617,000) for students who are White;
S increase 19 percent between 2012–13 and 2026–27 (462,000 versus 549,000) for students who are Black;
S increase 30 percent between 2012–13 and 2026–27 (640,000 versus 830,000) for students who are Hispanic;
S increase 18 percent between 2012–13 and 2026–27 (179,000 versus 211,000) for students who are Asian/Pacific Islander;
T decrease 13 percent between 2012–13 and 2026–27 (31,000 versus 27,000) for students who are American Indian/Alaska Native; and
S increase 42 percent between 2012–13 and 2026–27 (66,000 versus 93,000) for students who are of Two or more races.
For more information: Table 11
Figure 12. Actual and projected numbers for public high school graduates, by race/ethnicity: School years 2001–02 through 2026–27
2001–02 2006–07 2011–12 2016–17 2021–22 2026–270
1
2High school graduates (in millions)
School year
White
Hispanic
Black
Asian/Pacific Islander
Two or more races
American Indian/Alaska Native
Projected
NOTE: Race categories exclude persons of Hispanic ethnicity. Data on students of Two or more races were not collected separately prior to 2007–08, and data on students of Two or more races from 2007–08 through 2009–10 were not reported by all states. Therefore, the data are not comparable to figures for 2010–11 and later years. Mean absolute percentage errors of selected education statistics can be found in table A-2, appendix A. Some data have been revised from previously published figures. SOURCE: U.S. Department of Education, National Center for Education Statistics, Common Core of Data (CCD), “State Nonfiscal Survey of Public Elementary/Secondary Education,” 2001–02 through 2009–10; “State Dropout and Completion Data File,” 2010–11 and 2013–14; and National Public High School Graduates by Race/Ethnicity Projection Model, 1995–96 through 2026–27. (This figure was prepared April 2017.)

This page intentionally left blank.

Projections of Education Statistics to 2026 19
Section 4Expenditures for Public Elementary
and Secondary EducationINTRODUCTIONCurrent expenditures (e.g., instruction and support services) for public elementary and secondary education are projected to increase 19 percent in constant dollars (adjusted for inflation) between school years 2013–14, the last year of actual data, and 2026–27 (table 12).
Factors affecting the projectionsThe projections of current expenditures are related to projections of economic growth as measured by disposable income per capita and assistance by state governments to local governments. For more details, see appendixes A.0 and A.4.
Factors that were not consideredMany factors that may affect future school expenditures were not considered in the production of these projections. Such factors include policy initiatives as well as potential changes in the age distribution of elementary and secondary teachers as older teachers retire and are replaced by younger teachers, or as older teachers put off retirement for various reasons.
About constant dollars and current dollarsThroughout this section, projections of current expenditures are presented in constant 2015–16 dollars. The reference tables, later in this report, present these data both in constant 2015–16 dollars and in current dollars. The projections were developed in constant dollars and then placed in current dollars using projections for the Consumer Price Index (CPI) (table B-5 in appendix B).
Accuracy of ProjectionsAn analysis of projection errors from similar models used in the past 26 editions of Projections of Education Statistics that contained expenditure projections indicates that mean absolute percentage errors (MAPEs) for total current expenditures in constant dollars were 1.7 percent for 1 year out, 2.5 percent for 2 years out, 2.8 percent for 5 years out, and 6.2 percent for 10 years out. For the 1-year-out prediction, this means that one would expect the projection to be within 1.7 percent of the actual value, on average. MAPEs for current expenditures per pupil in fall enrollment in constant dollars were 1.7 percent for 1 year out, 2.4 percent for 2 years out, 2.9 percent for 5 years out, and 6.9 percent for 10 years out. See appendix A for further discussion of the accuracy of recent projections of current expenditures, and see table A-2 in appendix A for the MAPEs of these projections.

20 Section 4. Expenditures for Public Elementary and Secondary Education
CURRENT EXPENDITURES
Current expendituresCurrent expenditures in constant 2015–16 dollars
S increased 14 percent from 2001–02 to 2013–14 ($493 billion versus $561 billion), a period of 12 years; and
S are projected to increase 19 percent, to $670 billion, from 2013–14 to 2026–27, a period of 13 years.
For more information: Table 12
Figure 13. Actual and projected current expenditures for public elementary and secondary schools (in constant 2015–16 dollars): School years 2001–02 through 2026–27
Expenditures (in billions)
School year2001–02 2006–07 2011–12 2016–17 2021–22 2026–270
100
200
300
400
500
600
700
$800Projected
NOTE: Numbers were placed in constant dollars using the Consumer Price Index (CPI) for all urban consumers, Bureau of Labor Statistics, U.S. Department of Labor. For more detail about CPI, see table B-5 in appendix B. Current expenditures include instruction, support services, food services, and enterprise operations. Some data have been revised from previously published figures. Mean absolute percentage errors of selected education statistics can be found in table A-2, appendix A. SOURCE: U.S. Department of Education, National Center for Education Statistics, Common Core of Data (CCD), “National Public Education Financial Survey,” 2001–02 through 2013–14; Public Elementary and Secondary School Current Expenditures Projection Model, 1969–70 through 2026–27. (This figure was prepared April 2017.)

Projections of Education Statistics to 2026 21
Current expenditures per pupilCurrent expenditures per pupil in fall enrollment in constant 2015–16 dollars
S increased 9 percent from 2001–02 to 2013–14 ($10,300 versus $11,200); and
S are projected to increase 15 percent, to $12,900, from 2013–14 to 2026–27.
For more information: Table 12
Figure 14. Actual and projected current expenditures per pupil in fall enrollment in public elementary and secondary schools (in constant 2015–16 dollars): School years 2001–02 through 2026–27
2001–02 2006–07 2011–12 2016–17 2021–22 2026–270
2
4
6
8
10
12
$14Expenditures (in thousands)
School year
Projected
NOTE: Numbers were placed in constant dollars using the Consumer Price Index (CPI) for all urban consumers, Bureau of Labor Statistics, U.S. Department of Labor. For more detail about CPI, see table B-5 in appendix B. Current expenditures include instruction, support services, food services, and enterprise operations. Some data have been revised from previously published figures. Mean absolute percentage errors of selected education statistics can be found in table A-2, appendix A. SOURCE: U.S. Department of Education, National Center for Education Statistics, Common Core of Data (CCD), “State Nonfiscal Survey of Public Elementary/Secondary Education,” 2001–02 through 2014–15; “National Public Education Financial Survey,” 2001–02 through 2013–14; National Elementary and Secondary Enrollment Projection Model, 1972 through 2026; and Elementary and Secondary School Current Expenditures Projection Model, 1969–70 through 2026–27. (This figure was prepared April 2017.)

This page intentionally left blank.

Projections of Education Statistics to 2026 23
Section 5Enrollment in Degree-Granting
Postsecondary InstitutionsINTRODUCTIONTotal enrollment in degree-granting postsecondary institutions is expected to increase 13 percent between fall 2015, the last year of actual data, and fall 2026 (table 13). Degree-granting institutions are postsecondary institutions that provide study beyond secondary school and offer programs terminating in an associate’s, baccalaureate, or higher degree and participate in federal financial aid programs. Differential growth is expected by student characteristics such as age, sex, and attendance status (part-time or full-time). Enrollment is expected to increase in both public and private degree-granting postsecondary institutions.
Factors affecting the projectionsThe projections of enrollment levels are related to projec-tions of college-age populations, disposable income, and unemployment rates. For more details, see appendixes A.0 and A.5. An important factor in the enrollment projections is the expected change in the population of 18- to 29-year-olds from 2001 through 2026 (table B-3 in appendix B).
Figure 15. Actual and projected population numbers for 18- to 24-year-olds and 25- to 29-year-olds: 2001 through 2026
Population (in millions)
Year (July 1)2001 2006 2011 2016 2021 2026
0
10
20
30
40
50
60
70
80
18- to 24-year-old population
25- to 29-year-old population
Projected
NOTE: Some data have been revised from previously published figures. Projections are from the U.S. Census Bureau’s 2014 National Population Projections, ratio-adjusted to line up with the most recent historical estimate. SOURCE: U.S. Department of Commerce, Census Bureau, Population Estimates, retrieved August 4, 2015, from https://www2.census.gov/programs-surveys/popest/datasets/2010-2015/; and Population Projections, retrieved August 4, 2015, from https://www.census.gov/programs-surveys/popproj.html; and IHS Global Inc., “U.S. Quarterly Macroeconomic Model, November 2016 Short-Term Baseline Projections.” (This table was prepared April 2017.)
Factors that were not consideredThe enrollment projections do not take into account such factors as the cost of a college education, the economic value of an education, and the impact of distance learning due to technological changes. These factors may produce changes in enrollment levels. The racial/ethnic backgrounds of nonresident aliens are not known.
Accuracy of ProjectionsFor projections of total enrollment in degree-granting postsecondary institutions, an analysis of projection errors based on the past 19 editions of Projections of Education Statistics indicates that the mean absolute percentage errors (MAPEs) for lead times of 1, 2, 5, and 10 years out were 1.5, 2.6, 5.9, and 10.3 percent, respectively. For the 1-year-out prediction, this means that one would expect the projection to be within 1.5 percent of the actual value, on average. For more information, see table A-2 in appendix A.

24 Section 5. Enrollment in Degree-Granting Postsecondary Institutions
TOTAL ENROLLMENT
Total enrollment in degree-granting postsecondary institutions
S increased 25 percent from 2001 to 2015 (15.9 million versus 20.0 million), a period of 14 years; and
S is projected to increase 13 percent, to 22.6 million, from 2015 to 2026, a period of 11 years.
For more information: Table 13
Figure 16. Actual and projected numbers for total enrollment in all degree-granting postsecondary institutions: Fall 2001 through fall 2026
2001 2006 2011 2016 2021 20260
5
10
15
20
25Enrollment (in millions)
Year
Projected
NOTE: Degree-granting institutions grant associate’s or higher degrees and participate in Title IV federal financial aid programs. Some data have been revised from previously published figures. Mean absolute percentage errors of selected education statistics can be found in table A-2, appendix A. SOURCE: U.S. Department of Education, National Center for Education Statistics, Integrated Postsecondary Education Data System (IPEDS) Spring 2001 through Spring 2016, Fall Enrollment component; and Enrollment in Degree-Granting Institutions Projection Model, 2000 through 2026. (This figure was prepared April 2017.)

Projections of Education Statistics to 2026 25
ENROLLMENT BY SELECTED CHARACTERISTICS AND CONTROL OF INSTITUTION
Enrollment by age of studentEnrollment in degree-granting postsecondary institutions of students who are 18 to 24 years old
S increased 26 percent between 2001 and 2015; and
S is projected to increase 17 percent between 2015 and 2026.
Enrollment in degree-granting postsecondary institutions of students who are 25 to 34 years old
S increased 35 percent between 2001 and 2015; and
S is projected to increase 11 percent between 2015 and 2026.
Enrollment in degree-granting postsecondary institutions of students who are 35 years old and over
S increased 13 percent between 2001 and 2015; and
S is projected to increase 4 percent between 2015 and 2026.
For more information: Table 15
Figure 17. Actual and projected numbers for total enrollment in all degree-granting postsecondary institutions, by age group: Fall 2001, fall 2015, and fall 2026
18 to 24 25 to 34 35 years and over0
5,000
10,000
15,000
20,000
25,000
9,262
11,62513,592
3,4814,695 5,211
3,036 3,446 3,594
2001 (actual) 2015 (actual) 2026 (projected)Age group
Enrollment (in thousands)
NOTE: Degree-granting institutions grant associate’s or higher degrees and participate in Title IV federal financial aid programs. Distributions by age are estimates based on samples of the civilian noninstitutional population from the U.S. Census Bureau’s Current Population Survey. Mean absolute percentage errors of selected education statistics can be found in table A-2, appendix A. Calculations are based on unrounded numbers. SOURCE: U.S. Department of Education, National Center for Education Statistics, Integrated Postsecondary Education Data System (IPEDS) Spring 2002 and Spring 2016, Fall Enrollment component; Enrollment in Degree-Granting Institutions Projection Model, 2000 through 2026; and U.S. Department of Commerce, Census Bureau, Current Population Reports, “Social and Economic Characteristics of Students,” various years. (This figure was prepared April 2017.)
Enrollment by sex of studentEnrollment of males in degree-granting postsecondary institutions
S increased 25 percent between 2001 and 2015 (7.0 million versus 8.7 million); and
S is projected to increase 11 percent between 2015 and 2026 to 9.7 million.
Enrollment of females in degree-granting postsecondary institutions
S increased 26 percent between 2001 and 2015 (9.0 million versus 11.3 million); and
S is projected to increase 15 percent between 2015 and 2026 to 13.0 million.
For more information: Tables 13 and 15
Figure 18. Actual and projected numbers for enrollment in all degree-granting postsecondary institutions, by sex: Fall 2001 through fall 2026
Projected
Year2001 2006 2011 2016 2021 2026
0
5
10
15
20
25Enrollment (in millions)
Females
Males
NOTE: Degree-granting institutions grant associate’s or higher degrees and participate in Title IV federal financial aid programs. Some data have been revised from previously published figures. Mean absolute percentage errors of selected education statistics can be found in table A-2, appendix A. SOURCE: U.S. Department of Education, National Center for Education Statistics, Integrated Postsecondary Education Data System (IPEDS) Spring 2002 through Spring 2016, Fall Enrollment component; and Enrollment in Degree-Granting Institutions Projection Model, 2000 through 2026. (This figure was prepared April 2017.)

26 Section 5. Enrollment in Degree-Granting Postsecondary Institutions
Enrollment by attendance status Enrollment of full-time students in degree-granting postsecondary institutions
S increased 30 percent between 2001 and 2015 (9.4 million versus 12.3 million); and
S is projected to increase 12 percent between 2015 and 2026 to 13.8 million.
Enrollment of part-time students in degree-granting postsecondary institutions
S increased 19 percent between 2001 and 2015 (6.5 million versus 7.7 million); and
S is projected to increase 15 percent between 2015 and 2026 to 8.8 million.
For more information: Tables 13–15
Figure 19. Actual and projected numbers for enrollment in all degree-granting postsecondary institutions, by attendance status: Fall 2001 through fall 2026
Projected
Year2001 2006 2011 2016 2021 2026
0
5
10
15
20
25Enrollment (in millions)
Full-time
Part-time
NOTE: Degree-granting institutions grant associate’s or higher degrees and participate in Title IV federal financial aid programs. Some data have been revised from previously published figures. Mean absolute percentage errors of selected education statistics can be found in table A-2, appendix A. SOURCE: U.S. Department of Education, National Center for Education Statistics, Integrated Postsecondary Education Data System (IPEDS) Spring 2002 through Spring 2016, Fall Enrollment component; and Enrollment in Degree-Granting Institutions Projection Model, 2000 through 2026. (This figure was prepared April 2017.)
Enrollment by level of studentEnrollment of undergraduate students in degree-granting postsecondary institutions
S increased 24 percent between 2001 and 2015 (13.7 million versus 17.0 million); and
S is projected to increase 14 percent between 2015 and 2026 to 19.3 million.
Enrollment of postbaccalaureate students in degree-granting postsecondary institutions
S increased 33 percent between 2001 and 2015 (2.2 million versus 2.9 million); and
S is projected to increase 12 percent between 2015 and 2026 to 3.3 million.
For more information: Tables 16–17
Figure 20. Actual and projected numbers for enrollment in all degree-granting postsecondary institutions, by level of enrollment: Fall 2001 through fall 2026
2001 2006 2011 2016 2021 20260
5
10
15
20
25Enrollment (in millions)
Projected
Year
Undergraduate
Postbaccalaureate
NOTE: Degree-granting institutions grant associate’s or higher degrees and participate in Title IV federal financial aid programs. Some data have been revised from previously published figures. Mean absolute percentage errors of selected education statistics can be found in table A-2, appendix A. SOURCE: U.S. Department of Education, National Center for Education Statistics, Integrated Postsecondary Education Data System (IPEDS) Spring 2002 through Spring 2016, Fall Enrollment component; and Enrollment in Degree-Granting Institutions Projection Model, 2000 through 2026. (This figure was prepared April 2017.)

Projections of Education Statistics to 2026 27
Enrollment by race/ethnicity Enrollment of U.S. residents is projected to
S be 1 percent higher in 2026 for students who are White than in 2015 (11.0 million versus 10.9 million);
S increase 20 percent for students who are Black between 2015 and 2026 (2.7 million versus 3.2 million);
S increase 26 percent for students who are Hispanic between 2015 and 2026 (3.3 million versus 4.1 million);
S increase 12 percent for students who are Asian/Pacific Islander between 2015 and 2026 (1.3 million versus 1.4 million);
T be 3 percent lower in 2026 than in 2015 (143,000 versus 146,000) for students who are American Indian/Alaska Native; and
S increase 37 percent for students who are of Two or more races between 2015 and 2026 (660,000 versus 904,000).
For more information: Table 19
Figure 21. Actual and projected numbers for enrollment of U.S. residents in all degree-granting postsecondary institutions, by race/ethnicity: Fall 2001 through fall 2026
Projected
2001 2006 2011 2016 2021 20260
5
10
15
White
Black
HispanicAsian/Pacific Islander
Two or more races
American Indian/Alaska Native
School year
Enrollment (in millions)
NOTE: Degree-granting institutions grant associate’s or higher degrees and participate in Title IV federal financial aid programs. Race categories exclude persons of Hispanic ethnicity. Mean absolute percentage errors of selected education statistics can be found in table A-2, appendix A. Some data have been revised from previously published figures. SOURCE: U.S. Department of Education, National Center for Education Statistics, Integrated Postsecondary Education Data System (IPEDS) Spring 2002 through Spring 2016, Fall Enrollment component; and Enrollment in Degree-Granting Institutions by Race/Ethnicity Projection Model, 1980 through 2026. (This figure was prepared April 2017.)

28 Section 5. Enrollment in Degree-Granting Postsecondary Institutions
Enrollment in public and private institutions Enrollment in public degree-granting postsecondary institutions
S increased 19 percent between 2001 and 2015 (12.2 million versus 14.6 million); and
S is projected to increase 14 percent between 2015 and 2026 to 16.6 million.
Enrollment in private degree-granting postsecondary institutions
S increased 46 percent between 2001 and 2015 (3.7 million versus 5.4 million); and
S is projected to increase 11 percent between 2015 and 2026 to 6.0 million.
For more information: Table 13
Figure 22. Actual and projected numbers for enrollment in all degree-granting postsecondary institutions, by control of institution: Fall 2001 through fall 2026
Projected
Year2001 2006 2011 2016 2021 2026
0
5
10
15
20
25Enrollment (in millions)
Public institutions
Private institutions
NOTE: Degree-granting institutions grant associate’s or higher degrees and participate in Title IV federal financial aid programs. Some data have been revised from previously published figures. Mean absolute percentage errors of selected education statistics can be found in table A-2, appendix A. SOURCE: U.S. Department of Education, National Center for Education Statistics, Integrated Postsecondary Education Data System (IPEDS) Spring 2002 through Spring 2016, Fall Enrollment component; Enrollment in Degree-Granting Institutions Projection Model, 2000 through 2026. (This figure was prepared April 2017.)

Projections of Education Statistics to 2026 29
FIRST-TIME FRESHMEN ENROLLMENT
First-time freshmen fall enrollmentTotal first-time freshmen fall enrollment in all degree-granting postsecondary institutions
S increased 15 percent from 2001 to 2015 (2.5 million versus 2.9 million); and
S is projected to increase 13 percent between 2015 and 2026 to 3.3 million.
First-time freshmen fall enrollment of males in all degree-granting postsecondary institutions
S increased 16 percent from 2001 to 2015 (1.2 million versus 1.3 million); and
S is projected to increase 11 percent between 2015 and 2026 to 1.5 million.
First-time freshmen fall enrollment of females in all degree-granting postsecondary institutions
S increased 15 percent from 2001 to 2015 (1.3 million versus 1.5 million); and
S is projected to increase 16 percent between 2015 and 2026 to 1.8 million.
For more information: Table 18
Figure 23. Actual and projected numbers for total first-time freshmen fall enrollment in all degree-granting postsecondary institutions, by sex: Fall 2001 through fall 2026
Projected
2001 2006 2011 2016 2021 20260
1
2
3
4
5
Females
Total
Males
Year
Enrollment (in millions)
NOTE: Degree-granting institutions grant associate’s or higher degrees and participate in Title IV federal financial aid programs. Some data have been revised from previously published figures. Mean absolute percentage errors of selected education statistics can be found in table A-2, appendix A. SOURCE: U.S. Department of Education, National Center for Education Statistics, Integrated Postsecondary Education Data System (IPEDS) Spring 2002 through Spring 2016, Fall Enrollment component; and First-Time Freshmen Projection Model, 1980 through 2026. (This figure was prepared April 2017.)

30 Section 5. Enrollment in Degree-Granting Postsecondary Institutions
FULL-TIME-EQUIVALENT ENROLLMENT, BY CONTROL OF INSTITUTION
Full-time-equivalent fall enrollment Total full-time-equivalent fall enrollment in degree-granting postsecondary institutions
S increased 28 percent between 2001 and 2015 (11.8 million versus 15.1 million); and
S is projected to increase 13 percent between 2015 and 2026 to 17.0 million.
Full-time-equivalent fall enrollment in public degree-granting postsecondary institutions
S increased 22 percent between 2001 and 2015 (8.6 million versus 10.6 million); and
S is projected to increase 14 percent between 2015 and 2026 to 12.0 million.
Full-time-equivalent fall enrollment in private degree-granting postsecondary institutions
S increased 44 percent between 2001 and 2015 (3.1 million versus 4.5 million); and
S is projected to increase 10 percent between 2015 and 2026 to 5.0 million.
For more information: Table 20
Figure 24. Actual and projected numbers for full-time-equivalent fall enrollment in degree-granting postsecondary institutions, by control: Fall 2001 through fall 2026
Projected
Enrollment (in millions)
2001 2006 2011 2016 2021 20260
5
10
15
20
Year
Public
Total
Private
NOTE: Full-time-equivalent fall enrollment is the full-time enrollment, plus the full-time-equivalent of the part time students. Degree-granting institutions grant associate’s or higher degrees and participate in Title IV federal financial aid programs. Mean absolute percentage errors of selected education statistics can be found in table A-2, appendix A. Some data have been revised from previously published figures. SOURCE: U.S. Department of Education, National Center for Education Statistics, Integrated Postsecondary Education Data System (IPEDS) Spring 2002 through Spring 2016, Fall Enrollment component; Enrollment in Degree-Granting Institutions Projection Model, 2000 through 2026. (This figure was prepared April 2017.)

Projections of Education Statistics to 2026 31
Section 6Postsecondary Degrees Conferred
INTRODUCTIONLong-term growth in enrollment in degree-granting postsecondary institutions has been reflected by increases in the numbers of associate’s, bachelor’s, master’s, and doctor’s degrees conferred (tables 13 and 21). Increases in the number of degrees conferred are expected to continue between academic year 2014–15, the last year of actual data, and academic year 2026–27.
Factors affecting the projectionsThe projections of the number of degrees conferred are related to projections of the college-age populations deve loped by the Census Bureau and college enrollments from this report. For more details, see appendixes A.0 and A.6.
Factors that were not consideredSome factors that may affect future numbers of degrees, such as choice of degree and labor force requirements, were not included in the projection models.
Changes in degree classificationsThe National Center for Education Statistics (NCES) no longer uses the first-professional degree classification. Beginning with academic year 2009–10, most degrees formerly classified as first-professional—such as M.D., D.D.S., and law degrees—are classified as doctor’s degrees. However, master’s of divinity degrees are now classified as master’s degrees. This is the fifth edition of Projections of Education Statistics to use these new classifications. With this change, the actual numbers of master’s and doctor’s degrees conferred are higher than the actual numbers in Projections of Education Statistics to 2020 and earlier editions of this report. The revisions of actual numbers are reflected in the projections.
Accuracy of ProjectionsAn analysis of projection errors from the past eight editions of Projections of Education Statistics indicates that the mean absolute percentage errors (MAPEs) for lead times of 1, 2, and 5 years out for projections of associate’s degrees conferred were 2.8, 5.5, and 12.9 percent, respectively. For the 1-year-out prediction, this means that the methodology used by the National Center for Education Statistics (NCES) has produced projections that have, on average, deviated from actual observed values by 2.8 percent. For projections of bachelor’s degrees conferred, the MAPEs for lead times of 1, 2, and 5 years out were 0.6, 0.6, and 3.6 percent. For projections of master’s degrees conferred, the MAPEs for lead times of 1, 2, and 5 years out were 0.9, 3.4, and 5.8 percent. For projections of doctor’s degrees conferred, the MAPEs for lead times of 1, 2, and 5 years out were 0.2, 0.1, and 0.8 percent. For more information, see table A-2 in appendix A.

32 Section 6. Postsecondary Degrees Conferred
DEGREES, BY LEVEL OF DEGREE AND SEX OF RECIPIENT
Associate’s degrees The total number of associate’s degrees
S increased 70 percent between 2001–02 and 2014–15; and
S is projected to increase 27 percent between 2014–15 and 2026–27.
The number of associate’s degrees awarded to males
S increased 67 percent between 2001–02 and 2014–15; and
S is projected to increase 16 percent between 2014–15 and 2026–27.
The number of associate’s degrees awarded to females
S increased 73 percent between 2001–02 and 2014–15; and
S is projected to increase 34 percent between 2014–15 and 2026–27.
For more information: Table 21
Figure 25. Actual and projected numbers for associate’s degrees conferred by degree-granting postsecondary institutions, by sex of recipient: Academic years 2001–02 through 2026–27
Projected
Females
Total
Males
Academic year
Degrees (in thousands)
2001–02 2006–07 2011–12 2016–17 2021–22 2026–270
500
1,000
1,500
2,000
2,500
NOTE: Some data have been revised from previously published figures. Mean absolute percentage errors of selected education statistics can be found in table A-2, appendix A. SOURCE: U.S. Department of Education, National Center for Education Statistics, Integrated Postsecondary Education Data System (IPEDS); IPEDS Fall 2002 through Fall 2015 Completions component; and Degrees Conferred Projection Model, 1980–81 through 2026–27. (This figure was prepared April 2017.)
Bachelor’s degrees The total number of bachelor’s degrees
S increased 47 percent between 2001–02 and 2014–15; and
S is projected to increase 10 percent between 2014–15 and 2026–27.
The number of bachelor’s degrees awarded to males
S increased 48 percent between 2001–02 and 2014–15; and
S is projected to increase 8 percent between 2014–15 and 2026–27.
The number of bachelor’s degrees awarded to females
S increased 46 percent between 2001–02 and 2014–15; and
S is projected to increase 11 percent between 2014–15 and 2026–27.
For more information: Table 21
Figure 26. Actual and projected numbers for bachelor’s degrees conferred by degree-granting postsecondary institutions, by sex of recipient: Academic years 2001–02 through 2026–27
Projected
2001–02 2006–07 2011–12 2016–17 2021–22 2026–27
Females
Total
Males
Academic year
Degrees (in thousands)
0
500
1,000
1,500
2,000
2,500
NOTE: Some data have been revised from previously published figures. Mean absolute percentage errors of selected education statistics can be found in table A-2, appendix A. SOURCE: U.S. Department of Education, National Center for Education Statistics, Integrated Postsecondary Education Data System (IPEDS); IPEDS Fall 2002 through Fall 2015 Completions component; and Degrees Conferred Projection Model, 1980–81 through 2026–27. (This figure was prepared April 2017.)

Projections of Education Statistics to 2026 33
Master’s degrees The total number of master’s degrees
S increased 56 percent between 2001–02 and 2014–15; and
S is projected to increase 22 percent between 2014–15 and 2026–27.
The number of master’s degrees awarded to males
S increased 51 percent between 2001–02 and 2014–15; and
S is projected to increase 19 percent between 2014–15 and 2026–27.
The number of master’s degrees awarded to females
S increased 59 percent between 2001–02 and 2014–15; and
S is projected to increase 23 percent between 2014–15 and 2026–27.
For more information: Table 21
Figure 27. Actual and projected numbers for master’s degrees conferred by degree-granting postsecondary institutions, by sex of recipient: Academic years 2001–02 through 2026–27
Projected
2001–02 2006–07 2011–12 2016–17 2021–22 2026–27
FemalesTotal
Males
Academic year
Degrees (in thousands)
0
500
1,000
1,500
2,000
2,500
NOTE: Includes some degrees formerly classified as first-professional such as divinity degrees (M.Div. and M.H.L./Rav). Some data have been revised from previously published figures. Mean absolute percentage errors of selected education statistics can be found in table A-2, appendix A. SOURCE: U.S. Department of Education, National Center for Education Statistics, Integrated Postsecondary Education Data System (IPEDS); IPEDS Fall 2002 through Fall 2015 Completions component; and Degrees Conferred Projection Model, 1980–81 through 2026–27. (This figure was prepared April 2017.)
Doctor’s degrees The total number of doctor’s degrees
S increased 49 percent between 2001–02 and 2014–15; and
S is projected to increase 13 percent between 2014–15 and 2026–27.
The number of doctor’s degrees awarded to males
S increased 35 percent between 2001–02 and 2014–15; and
S is projected to increase 8 percent between 2014–15 and 2026–27.
The number of doctor’s degrees awarded to females
S increased 64 percent between 2001–02 and 2014–15; and
S is projected to increase 17 percent between 2014–15 and 2026–27.
For more information: Table 21
Figure 28. Actual and projected numbers for doctor’s degrees conferred by degree-granting postsecondary institutions, by sex of recipient: Academic years 2001–02 through 2026–27
Projected
Females
Total
Males
Academic year
Degrees (in thousands)
2001–02 2006–07 2011–12 2016–17 2021–22 2026–270
50
100
150
200
250
NOTE: Doctor’s degrees include Ph.D., Ed.D., and comparable degrees at the doctoral level. Includes most degrees formerly classified as first-professional, such as M.D., D.D.S., and law degrees. Some data have been revised from previously published figures. Mean absolute percentage errors of selected education statistics can be found in table A-2, appendix A. SOURCE: U.S. Department of Education, National Center for Education Statistics, Integrated Postsecondary Education Data System (IPEDS); IPEDS Fall 2002 through Fall 2015 Completions component; and Degrees Conferred Projection Model, 1980–81 through 2026–27. (This figure was prepared April 2017.)

This page intentionally left blank.

Projections of Education Statistics to 2026 35
Reference Tables

This page intentionally left blank.

Projections of Education Statistics to 2026 37
Table 1. Enrollment in elementary, secondary, and degree-granting postsecondary institutions, by level and control of institution: Selected years, 1869–70 through fall 2026
[In thousands]
Year
Totalenrollment,
all levels
Elementaryand
secondary,total
Public elementary and secondary schools Private elementary and secondary schools1 Degree-granting postsecondary institutions2
Total
Prekinder-garten
throughgrade 8
Grades 9through 12 Total
Prekinder-garten through
grade 8Grades 9
through 12 Total Public Private
1 2 3 4 5 6 7 8 9 10 11 12
1869–70.................................. — — 6,872 6,792 80 — — — 52 — —1879–80.................................. — — 9,868 9,757 110 — — — 116 — —1889–90.................................. 14,491 14,334 12,723 12,520 203 1,611 1,516 95 157 — —1899–1900.............................. 17,092 16,855 15,503 14,984 519 1,352 1,241 111 238 — —1909–10.................................. 19,728 19,372 17,814 16,899 915 1,558 1,441 117 355 — —1919–20.................................. 23,876 23,278 21,578 19,378 2,200 1,699 1,486 214 598 — —
1929–30.................................. 29,430 28,329 25,678 21,279 4,399 2,651 2,310 341 1,101 — —1939–40.................................. 29,539 28,045 25,434 18,832 6,601 2,611 2,153 458 1,494 797 6981949–50.................................. 31,151 28,492 25,111 19,387 5,725 3,380 2,708 672 2,659 1,355 1,304Fall 1959 ................................. 44,497 40,857 35,182 26,911 8,271 5,675 4,640 1,035 3,640 2,181 1,459Fall 1969 ................................. 59,055 51,050 45,550 32,513 13,037 5,500 3 4,200 3 1,300 3 8,005 5,897 2,108Fall 1979 ................................. 58,221 46,651 41,651 28,034 13,616 5,000 3 3,700 3 1,300 3 11,570 9,037 2,533Fall 1985 ................................. 57,226 44,979 39,422 27,034 12,388 5,557 4,195 1,362 12,247 9,479 2,768
Fall 1990 ................................. 60,683 46,864 41,217 29,876 11,341 5,648 3 4,512 3 1,136 3 13,819 10,845 2,974Fall 1991 ................................. 62,087 47,728 42,047 30,503 11,544 5,681 4,550 1,131 14,359 11,310 3,049Fall 1992 ................................. 63,181 48,694 42,823 31,086 11,737 5,870 3 4,746 3 1,125 3 14,487 11,385 3,103Fall 1993 ................................. 63,837 49,532 43,465 31,502 11,963 6,067 4,950 1,118 14,305 11,189 3,116Fall 1994 ................................. 64,385 50,106 44,111 31,896 12,215 5,994 3 4,856 3 1,138 3 14,279 11,134 3,145
Fall 1995 ................................. 65,020 50,759 44,840 32,338 12,502 5,918 4,756 1,163 14,262 11,092 3,169Fall 1996 ................................. 65,911 51,544 45,611 32,762 12,849 5,933 3 4,755 3 1,178 3 14,368 11,120 3,247Fall 1997 ................................. 66,574 52,071 46,127 33,071 13,056 5,944 4,759 1,185 14,502 11,196 3,306Fall 1998 ................................. 67,033 52,526 46,539 33,344 13,195 5,988 3 4,776 3 1,212 3 14,507 11,138 3,369Fall 1999 ................................. 67,725 52,875 46,857 33,486 13,371 6,018 4,789 1,229 14,850 11,376 3,474
Fall 2000 ................................. 68,685 53,373 47,204 33,686 13,517 6,169 3 4,906 3 1,264 3 15,312 11,753 3,560Fall 2001 ................................. 69,920 53,992 47,672 33,936 13,736 6,320 5,023 1,296 15,928 12,233 3,695Fall 2002 ................................. 71,015 54,403 48,183 34,114 14,069 6,220 3 4,915 3 1,306 3 16,612 12,752 3,860Fall 2003 ................................. 71,551 54,639 48,540 34,201 14,339 6,099 4,788 1,311 16,911 12,859 4,053Fall 2004 ................................. 72,154 54,882 48,795 34,178 14,618 6,087 3 4,756 3 1,331 3 17,272 12,980 4,292
Fall 2005 ................................. 72,674 55,187 49,113 34,204 14,909 6,073 4,724 1,349 17,487 13,022 4,466Fall 2006 ................................. 73,066 55,307 49,316 34,235 15,081 5,991 3 4,631 3 1,360 3 17,759 13,180 4,579Fall 2007 ................................. 73,449 55,201 49,291 34,204 15,086 5,910 4,546 1,364 18,248 13,491 4,757Fall 2008 ................................. 74,076 54,973 49,266 34,286 14,980 5,707 3 4,365 3 1,342 3 19,103 13,972 5,131Fall 2009 ................................. 75,163 54,849 49,361 34,409 14,952 5,488 4,179 1,309 20,314 14,811 5,503
Fall 2010 ................................. 75,886 54,867 49,484 34,625 14,860 5,382 3 4,084 3 1,299 3 21,019 15,142 5,877Fall 2011 ................................. 75,800 54,790 49,522 34,773 14,749 5,268 3,977 1,291 21,011 15,116 5,894Fall 2012 ................................. 75,748 55,104 49,771 35,018 14,753 5,333 3 4,031 3 1,302 3 20,644 14,885 5,760Fall 2013 ................................. 75,817 55,440 50,045 35,251 14,794 5,396 4,084 1,312 20,377 14,747 5,630Fall 2014 ................................. 75,843 55,635 50,313 35,370 14,943 5,323 3 3,988 3 1,334 3 20,207 14,655 5,552
Fall 20154 ............................... 75,740 55,763 50,485 35,414 15,070 5,278 3,949 1,329 19,977 14,568 5,409Fall 20164 ............................... 76,044 55,859 50,625 35,514 15,111 5,234 3,918 1,316 20,185 14,844 5,341Fall 20174 ............................... 76,304 55,891 50,710 35,562 15,148 5,181 3,879 1,303 20,413 15,003 5,410Fall 20184 ............................... 76,580 55,892 50,759 35,593 15,166 5,133 3,852 1,281 20,688 15,206 5,481Fall 20194 ............................... 76,957 55,947 50,843 35,657 15,186 5,104 3,845 1,259 21,009 15,443 5,566
Fall 20204 ............................... 77,425 56,079 50,996 35,667 15,329 5,083 3,849 1,234 21,346 15,684 5,662Fall 20214 ............................... 77,875 56,216 51,152 35,639 15,513 5,064 3,855 1,210 21,659 15,910 5,749Fall 20224 ............................... 78,244 56,356 51,301 35,660 15,641 5,055 3,863 1,192 21,888 16,078 5,810Fall 20234 ............................... 78,637 56,513 51,455 35,815 15,640 5,058 3,882 1,176 22,124 16,251 5,873Fall 20244 ............................... 78,963 56,632 51,562 35,982 15,579 5,070 3,902 1,169 22,331 16,407 5,924
Fall 20254 ............................... 79,218 56,715 51,632 36,156 15,476 5,083 3,921 1,161 22,504 16,541 5,962Fall 20264 ............................... 79,465 56,834 51,738 36,362 15,376 5,096 3,942 1,154 22,631 16,642 5,990
—Not available.1Beginning in fall 1985, data include estimates for an expanded universe of private schools.Therefore, direct comparisons with earlier years should be avoided. 2Data for 1869–70 through 1949–50 include resident degree-credit students enrolled at anytime during the academic year. Beginning in 1959, data include all resident and extensionstudents enrolled at the beginning of the fall term.3Estimated.4Projected data. Fall 2015 data for degree-granting institutions are actual. NOTE: Data for 1869–70 through 1949–50 reflect enrollment for the entire school year. Ele-mentary and secondary enrollment includes students in local public school systems and inmost private schools (religiously affiliated and nonsectarian), but generally excludes home-schooled children and students in subcollegiate departments of colleges and in federalschools. Excludes preprimary pupils in private schools that do not offer kindergarten orabove. Postsecondary data through 1995 are for institutions of higher education, while laterdata are for degree-granting institutions. Degree-granting institutions grant associate’s orhigher degrees and participate in Title IV federal financial aid programs. The degree-grant-ing classification is very similar to the earlier higher education classification, but it includes
more 2-year colleges and excludes a few higher education institutions that did not grantdegrees. Some data have been revised from previously published figures. Detail may notsum to totals because of rounding. SOURCE: U.S. Department of Education, National Center for Education Statistics, AnnualReport of the Commissioner of Education, 1870 to 1910; Biennial Survey of Education inthe United States, 1919–20 through 1949–50; Statistics of Public Elementary and Second-ary School Systems, 1959 through 1979; Statistics of Nonpublic Elementary and Second-ary Schools, 1959 through 1980; 1985–86 Private School Survey; Common Core of Data(CCD), “State Nonfiscal Survey of Public Elementary and Secondary Education,” 1985–86through 2014–15; Private School Universe Survey (PSS), 1991–92 through 2013–14;National Elementary and Secondary Enrollment Projection Model, 1972 through 2026;Opening (Fall) Enrollment in Higher Education, 1959; Higher Education General Informa-tion Survey (HEGIS), “Fall Enrollment in Institutions of Higher Education” surveys, 1969,1979, and 1985; Integrated Postsecondary Education Data System (IPEDS), “Fall Enroll-ment Survey” (IPEDS-EF:90–99); IPEDS Spring 2001 through Spring 2016, Fall Enroll-ment component; and Enrollment in Degree-Granting Institutions Projection Model, 2000through 2026. (This table was prepared February 2017.)
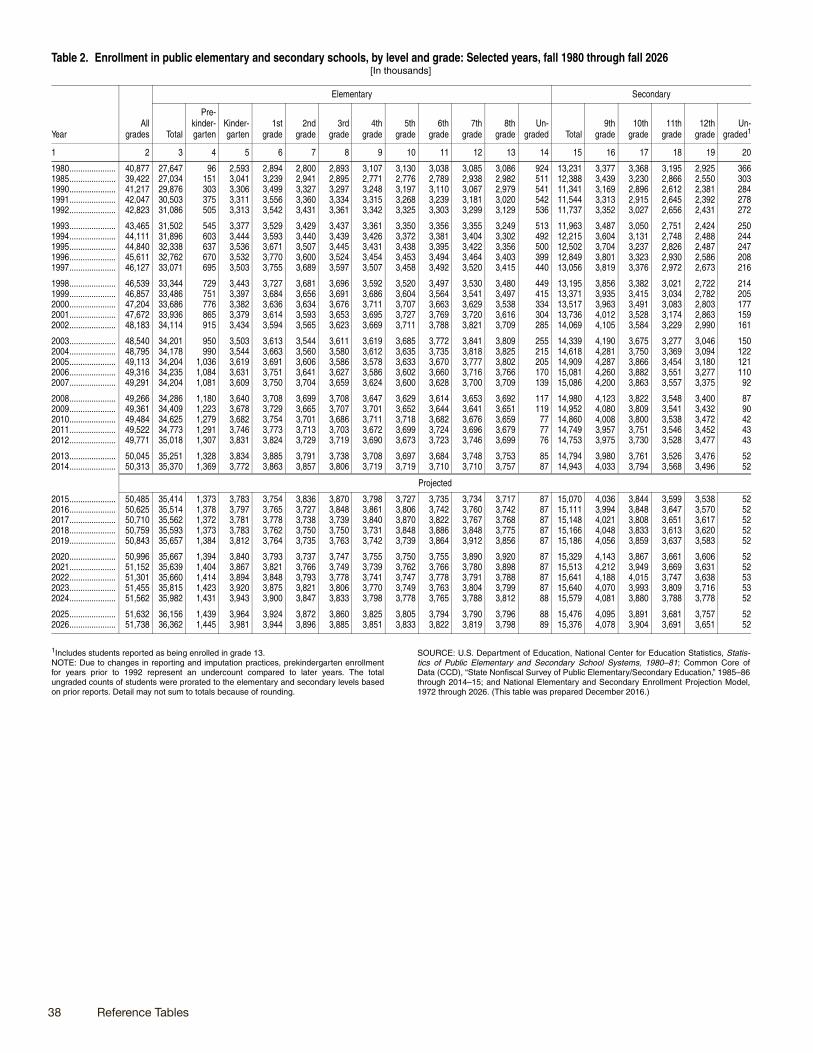
38 Reference Tables
Table 2. Enrollment in public elementary and secondary schools, by level and grade: Selected years, fall 1980 through fall 2026[In thousands]
Year All
grades
Elementary Secondary
Total
Pre-kinder-garten
Kinder-garten
1stgrade
2ndgrade
3rdgrade
4thgrade
5thgrade
6thgrade
7thgrade
8thgrade
Un-graded Total
9thgrade
10thgrade
11thgrade
12thgrade
Un-graded1
1 2 3 4 5 6 7 8 9 10 11 12 13 14 15 16 17 18 19 20
1980..................... 40,877 27,647 96 2,593 2,894 2,800 2,893 3,107 3,130 3,038 3,085 3,086 924 13,231 3,377 3,368 3,195 2,925 3661985..................... 39,422 27,034 151 3,041 3,239 2,941 2,895 2,771 2,776 2,789 2,938 2,982 511 12,388 3,439 3,230 2,866 2,550 3031990..................... 41,217 29,876 303 3,306 3,499 3,327 3,297 3,248 3,197 3,110 3,067 2,979 541 11,341 3,169 2,896 2,612 2,381 2841991..................... 42,047 30,503 375 3,311 3,556 3,360 3,334 3,315 3,268 3,239 3,181 3,020 542 11,544 3,313 2,915 2,645 2,392 2781992..................... 42,823 31,086 505 3,313 3,542 3,431 3,361 3,342 3,325 3,303 3,299 3,129 536 11,737 3,352 3,027 2,656 2,431 272
1993..................... 43,465 31,502 545 3,377 3,529 3,429 3,437 3,361 3,350 3,356 3,355 3,249 513 11,963 3,487 3,050 2,751 2,424 2501994..................... 44,111 31,896 603 3,444 3,593 3,440 3,439 3,426 3,372 3,381 3,404 3,302 492 12,215 3,604 3,131 2,748 2,488 2441995..................... 44,840 32,338 637 3,536 3,671 3,507 3,445 3,431 3,438 3,395 3,422 3,356 500 12,502 3,704 3,237 2,826 2,487 2471996..................... 45,611 32,762 670 3,532 3,770 3,600 3,524 3,454 3,453 3,494 3,464 3,403 399 12,849 3,801 3,323 2,930 2,586 2081997..................... 46,127 33,071 695 3,503 3,755 3,689 3,597 3,507 3,458 3,492 3,520 3,415 440 13,056 3,819 3,376 2,972 2,673 216
1998..................... 46,539 33,344 729 3,443 3,727 3,681 3,696 3,592 3,520 3,497 3,530 3,480 449 13,195 3,856 3,382 3,021 2,722 2141999..................... 46,857 33,486 751 3,397 3,684 3,656 3,691 3,686 3,604 3,564 3,541 3,497 415 13,371 3,935 3,415 3,034 2,782 2052000..................... 47,204 33,686 776 3,382 3,636 3,634 3,676 3,711 3,707 3,663 3,629 3,538 334 13,517 3,963 3,491 3,083 2,803 1772001..................... 47,672 33,936 865 3,379 3,614 3,593 3,653 3,695 3,727 3,769 3,720 3,616 304 13,736 4,012 3,528 3,174 2,863 1592002..................... 48,183 34,114 915 3,434 3,594 3,565 3,623 3,669 3,711 3,788 3,821 3,709 285 14,069 4,105 3,584 3,229 2,990 161
2003..................... 48,540 34,201 950 3,503 3,613 3,544 3,611 3,619 3,685 3,772 3,841 3,809 255 14,339 4,190 3,675 3,277 3,046 1502004..................... 48,795 34,178 990 3,544 3,663 3,560 3,580 3,612 3,635 3,735 3,818 3,825 215 14,618 4,281 3,750 3,369 3,094 1222005..................... 49,113 34,204 1,036 3,619 3,691 3,606 3,586 3,578 3,633 3,670 3,777 3,802 205 14,909 4,287 3,866 3,454 3,180 1212006..................... 49,316 34,235 1,084 3,631 3,751 3,641 3,627 3,586 3,602 3,660 3,716 3,766 170 15,081 4,260 3,882 3,551 3,277 1102007..................... 49,291 34,204 1,081 3,609 3,750 3,704 3,659 3,624 3,600 3,628 3,700 3,709 139 15,086 4,200 3,863 3,557 3,375 92
2008..................... 49,266 34,286 1,180 3,640 3,708 3,699 3,708 3,647 3,629 3,614 3,653 3,692 117 14,980 4,123 3,822 3,548 3,400 872009..................... 49,361 34,409 1,223 3,678 3,729 3,665 3,707 3,701 3,652 3,644 3,641 3,651 119 14,952 4,080 3,809 3,541 3,432 902010..................... 49,484 34,625 1,279 3,682 3,754 3,701 3,686 3,711 3,718 3,682 3,676 3,659 77 14,860 4,008 3,800 3,538 3,472 422011..................... 49,522 34,773 1,291 3,746 3,773 3,713 3,703 3,672 3,699 3,724 3,696 3,679 77 14,749 3,957 3,751 3,546 3,452 432012..................... 49,771 35,018 1,307 3,831 3,824 3,729 3,719 3,690 3,673 3,723 3,746 3,699 76 14,753 3,975 3,730 3,528 3,477 43
2013..................... 50,045 35,251 1,328 3,834 3,885 3,791 3,738 3,708 3,697 3,684 3,748 3,753 85 14,794 3,980 3,761 3,526 3,476 522014..................... 50,313 35,370 1,369 3,772 3,863 3,857 3,806 3,719 3,719 3,710 3,710 3,757 87 14,943 4,033 3,794 3,568 3,496 52
Projected
2015..................... 50,485 35,414 1,373 3,783 3,754 3,836 3,870 3,798 3,727 3,735 3,734 3,717 87 15,070 4,036 3,844 3,599 3,538 522016..................... 50,625 35,514 1,378 3,797 3,765 3,727 3,848 3,861 3,806 3,742 3,760 3,742 87 15,111 3,994 3,848 3,647 3,570 522017..................... 50,710 35,562 1,372 3,781 3,778 3,738 3,739 3,840 3,870 3,822 3,767 3,768 87 15,148 4,021 3,808 3,651 3,617 522018..................... 50,759 35,593 1,373 3,783 3,762 3,750 3,750 3,731 3,848 3,886 3,848 3,775 87 15,166 4,048 3,833 3,613 3,620 522019..................... 50,843 35,657 1,384 3,812 3,764 3,735 3,763 3,742 3,739 3,864 3,912 3,856 87 15,186 4,056 3,859 3,637 3,583 52
2020..................... 50,996 35,667 1,394 3,840 3,793 3,737 3,747 3,755 3,750 3,755 3,890 3,920 87 15,329 4,143 3,867 3,661 3,606 522021..................... 51,152 35,639 1,404 3,867 3,821 3,766 3,749 3,739 3,762 3,766 3,780 3,898 87 15,513 4,212 3,949 3,669 3,631 522022..................... 51,301 35,660 1,414 3,894 3,848 3,793 3,778 3,741 3,747 3,778 3,791 3,788 87 15,641 4,188 4,015 3,747 3,638 532023..................... 51,455 35,815 1,423 3,920 3,875 3,821 3,806 3,770 3,749 3,763 3,804 3,799 87 15,640 4,070 3,993 3,809 3,716 532024..................... 51,562 35,982 1,431 3,943 3,900 3,847 3,833 3,798 3,778 3,765 3,788 3,812 88 15,579 4,081 3,880 3,788 3,778 52
2025..................... 51,632 36,156 1,439 3,964 3,924 3,872 3,860 3,825 3,805 3,794 3,790 3,796 88 15,476 4,095 3,891 3,681 3,757 522026..................... 51,738 36,362 1,445 3,981 3,944 3,896 3,885 3,851 3,833 3,822 3,819 3,798 89 15,376 4,078 3,904 3,691 3,651 52
1Includes students reported as being enrolled in grade 13.NOTE: Due to changes in reporting and imputation practices, prekindergarten enrollmentfor years prior to 1992 represent an undercount compared to later years. The totalungraded counts of students were prorated to the elementary and secondary levels basedon prior reports. Detail may not sum to totals because of rounding.
SOURCE: U.S. Department of Education, National Center for Education Statistics, Statis-tics of Public Elementary and Secondary School Systems, 1980–81; Common Core ofData (CCD), “State Nonfiscal Survey of Public Elementary/Secondary Education,” 1985–86through 2014–15; and National Elementary and Secondary Enrollment Projection Model,1972 through 2026. (This table was prepared December 2016.)

This page intentionally left blank.

40 Reference Tables
See notes at end of table.
Table 3. Enrollment in public elementary and secondary schools, by region, state, and jurisdiction: Selected years, fall 1990 through fall 2026
Region, state, and jurisdiction
Actual total enrollment
Fall 1990 Fall 2000 Fall 2004 Fall 2005 Fall 2006 Fall 2007 Fall 2008 Fall 2009 Fall 2010 Fall 2011 Fall 2012 Fall 2013 Fall 2014
1 2 3 4 5 6 7 8 9 10 11 12 13 14
United States............ 41,216,683 47,203,539 48,795,465 49,113,298 49,315,842 49,290,559 49,265,572 49,360,982 49,484,181 49,521,669 49,771,118 50,044,522 50,312,581Region
Northeast .......................... 7,281,763 8,222,127 8,271,259 8,240,160 8,257,889 8,122,022 8,052,985 8,092,029 8,071,335 7,953,981 7,959,128 7,961,243 7,979,856Midwest............................. 9,943,761 10,729,987 10,775,409 10,818,815 10,819,248 10,770,210 10,742,973 10,672,171 10,609,604 10,573,792 10,559,230 10,572,920 10,560,539South................................. 14,807,016 17,007,261 17,891,987 18,103,166 18,293,633 18,422,773 18,490,770 18,651,889 18,805,000 18,955,932 19,128,376 19,298,714 19,506,193West .................................. 9,184,143 11,244,164 11,856,810 11,951,157 11,945,072 11,975,554 11,978,844 11,944,893 11,998,242 12,037,964 12,124,384 12,211,645 12,265,993
StateAlabama............................ 721,806 739,992 730,140 741,761 743,632 742,919 745,668 748,889 755,552 744,621 744,637 746,204 744,164Alaska................................ 113,903 133,356 132,970 133,288 132,608 131,029 130,662 131,661 132,104 131,167 131,489 130,944 131,176Arizona.............................. 639,853 877,696 1,043,298 1,094,454 1,068,249 1,087,447 1,087,817 1,077,831 1,071,751 1,080,319 1,089,384 1,102,445 1,111,695Arkansas........................... 436,286 449,959 463,115 474,206 476,409 479,016 478,965 480,559 482,114 483,114 486,157 489,979 490,917California ........................... 4,950,474 6,140,814 6,441,557 6,437,202 6,406,750 6,343,471 6,322,528 6,263,438 6,289,578 6,287,834 6,299,451 6,312,623 6,312,161
Colorado............................ 574,213 724,508 765,976 779,826 794,026 801,867 818,443 832,368 843,316 854,265 863,561 876,999 889,006Connecticut ....................... 469,123 562,179 577,390 575,059 575,100 570,626 567,198 563,968 560,546 554,437 550,954 546,200 542,678Delaware........................... 99,658 114,676 119,091 120,937 122,254 122,574 125,430 126,801 129,403 128,946 129,026 131,687 134,042District of Columbia........... 80,694 68,925 76,714 76,876 72,850 78,422 68,681 69,433 71,284 73,911 76,140 78,153 80,958Florida ............................... 1,861,592 2,434,821 2,639,336 2,675,024 2,671,513 2,666,811 2,631,020 2,634,522 2,643,347 2,668,156 2,692,162 2,720,744 2,756,944
Georgia ............................. 1,151,687 1,444,937 1,553,437 1,598,461 1,629,157 1,649,589 1,655,792 1,667,685 1,677,067 1,685,016 1,703,332 1,723,909 1,744,437Hawaii................................ 171,708 184,360 183,185 182,818 180,728 179,897 179,478 180,196 179,601 182,706 184,760 186,825 182,384Idaho ................................. 220,840 245,117 256,084 261,982 267,380 272,119 275,051 276,299 275,859 279,873 284,834 296,476 290,885Illinois................................. 1,821,407 2,048,792 2,097,503 2,111,706 2,118,276 2,112,805 2,119,707 2,104,175 2,091,654 2,083,097 2,072,880 2,066,990 2,050,239Indiana............................... 954,525 989,267 1,021,348 1,035,074 1,045,940 1,046,764 1,046,147 1,046,661 1,047,232 1,040,765 1,041,369 1,047,385 1,046,269
Iowa................................... 483,652 495,080 478,319 483,482 483,122 485,115 487,559 491,842 495,775 495,870 499,825 502,964 505,311Kansas .............................. 437,034 470,610 469,136 467,525 469,506 468,295 471,060 474,489 483,701 486,108 489,043 496,440 497,275Kentucky............................ 636,401 665,850 674,796 679,878 683,152 666,225 670,030 680,089 673,128 681,987 685,167 677,389 688,640Louisiana........................... 784,757 743,089 724,281 654,526 675,851 681,038 684,873 690,915 696,558 703,390 710,903 711,491 716,800Maine................................. 215,149 207,037 198,820 195,498 193,986 196,245 192,935 189,225 189,077 188,969 185,739 183,995 182,470
Maryland ........................... 715,176 852,920 865,561 860,020 851,640 845,700 843,861 848,412 852,211 854,086 859,638 866,169 874,514Massachusetts.................. 834,314 975,150 975,574 971,909 968,661 962,958 958,910 957,053 955,563 953,369 954,773 955,739 955,844Michigan............................ 1,584,431 1,720,626 1,751,290 1,742,282 1,722,656 1,692,739 1,659,921 1,649,082 1,587,067 1,573,537 1,555,370 1,548,841 1,537,922Minnesota.......................... 756,374 854,340 838,503 839,243 840,565 837,578 836,048 837,053 838,037 839,738 845,404 850,973 857,235Mississippi......................... 502,417 497,871 495,376 494,954 495,026 494,122 491,962 492,481 490,526 490,619 493,650 492,586 490,917
Missouri............................. 816,558 912,744 905,449 917,705 920,353 917,188 917,871 917,982 918,710 916,584 917,900 918,288 917,785Montana............................ 152,974 154,875 146,705 145,416 144,418 142,823 141,899 141,807 141,693 142,349 142,908 144,129 144,532Nebraska........................... 274,081 286,199 285,761 286,646 287,580 291,244 292,590 295,368 298,500 301,296 303,505 307,677 312,635Nevada.............................. 201,316 340,706 400,083 412,395 424,766 429,362 433,371 428,947 437,149 439,634 445,707 451,831 459,189New Hampshire................ 172,785 208,461 206,852 205,767 203,572 200,772 197,934 197,140 194,711 191,900 188,974 186,310 184,670
New Jersey ....................... 1,089,646 1,313,405 1,393,347 1,395,602 1,388,850 1,382,348 1,381,420 1,396,029 1,402,548 1,356,431 1,372,203 1,370,295 1,400,579New Mexico....................... 301,881 320,306 326,102 326,758 328,220 329,040 330,245 334,419 338,122 337,225 338,220 339,244 340,365New York ........................... 2,598,337 2,882,188 2,836,337 2,815,581 2,809,649 2,765,435 2,740,592 2,766,052 2,734,955 2,704,718 2,710,703 2,732,770 2,741,185North Carolina................... 1,086,871 1,293,638 1,385,754 1,416,436 1,444,481 1,489,492 1,488,645 1,483,397 1,490,605 1,507,864 1,518,465 1,530,857 1,548,895North Dakota..................... 117,825 109,201 100,513 98,283 96,670 95,059 94,728 95,073 96,323 97,646 101,111 103,947 106,586
Ohio................................... 1,771,089 1,835,049 1,840,032 1,839,683 1,836,722 1,827,184 1,817,163 1,764,297 1,754,191 1,740,030 1,729,916 1,724,111 1,724,810Oklahoma.......................... 579,087 623,110 629,476 634,739 639,391 642,065 645,108 654,802 659,911 666,120 673,483 681,848 688,511Oregon .............................. 472,394 546,231 552,505 552,194 562,574 565,586 575,393 582,839 570,720 568,208 587,564 593,000 601,318Pennsylvania..................... 1,667,834 1,814,311 1,828,089 1,830,684 1,871,060 1,801,971 1,775,029 1,785,993 1,793,284 1,771,395 1,763,677 1,755,236 1,743,160Rhode Island..................... 138,813 157,347 156,498 153,422 151,612 147,629 145,342 145,118 143,793 142,854 142,481 142,008 141,959
South Carolina.................. 622,112 677,411 703,736 701,544 708,021 712,317 718,113 723,143 725,838 727,186 735,998 745,657 756,523South Dakota .................... 129,164 128,603 122,798 122,012 121,158 121,606 126,429 123,713 126,128 128,016 130,471 130,890 133,040Tennessee......................... 824,595 909,161 941,091 953,928 978,368 964,259 971,950 972,549 987,422 999,693 993,496 993,556 995,475Texas ................................. 3,382,887 4,059,619 4,405,215 4,525,394 4,599,509 4,674,832 4,752,148 4,850,210 4,935,715 5,000,470 5,077,659 5,153,702 5,233,765Utah................................... 446,652 481,485 503,607 508,430 523,386 576,244 559,778 571,586 585,552 598,832 613,279 625,461 635,577
Vermont............................. 95,762 102,049 98,352 96,638 95,399 94,038 93,625 91,451 96,858 89,908 89,624 88,690 87,311Virginia .............................. 998,601 1,144,915 1,204,739 1,213,616 1,220,440 1,230,857 1,235,795 1,245,340 1,251,440 1,257,883 1,265,419 1,273,825 1,280,381Washington....................... 839,709 1,004,770 1,020,005 1,031,985 1,026,774 1,030,247 1,037,018 1,035,347 1,043,788 1,045,453 1,051,694 1,058,936 1,073,638West Virginia..................... 322,389 286,367 280,129 280,866 281,939 282,535 282,729 282,662 282,879 282,870 283,044 280,958 280,310Wisconsin.......................... 797,621 879,476 864,757 875,174 876,700 874,633 873,750 872,436 872,286 871,105 872,436 874,414 871,432Wyoming ........................... 98,226 89,940 84,733 84,409 85,193 86,422 87,161 88,155 89,009 90,099 91,533 92,732 94,067
JurisdictionBureau of Indian
Education ................... — 46,938 45,828 50,938 — — 40,927 41,351 41,962 — — — —DoD, overseas................... — 73,581 68,327 62,543 60,891 57,247 56,768 — — — — — —DoD, domestic................... — 34,174 29,151 28,329 26,631 27,548 28,013 — — — — — —Other jurisdictions
American Samoa.......... 12,463 15,702 16,126 16,438 16,400 — — — — — — — —Guam............................ 26,391 32,473 30,605 30,986 — — — — 31,618 31,243 31,186 33,414 31,144Northern Marianas ....... 6,449 10,004 11,601 11,718 11,695 11,299 10,913 10,961 11,105 11,011 10,646 10,638 —Puerto Rico................... 644,734 612,725 575,648 563,490 544,138 526,565 503,635 493,393 473,735 452,740 434,609 423,934 410,950U.S. Virgin Islands ........ 21,750 19,459 16,429 16,750 16,284 15,903 15,768 15,493 15,495 15,711 15,192 14,953 14,241

Projections of Education Statistics to 2026 41
Table 3. Enrollment in public elementary and secondary schools, by region, state, and jurisdiction: Selected years, fall 1990 through fall 2026—Continued
Region, state, and jurisdiction
Percent changein total enrollment,
2009 to 2014
Projected total enrollment Percent changein total enrollment,
2014 to 2026Fall 2015 Fall 2016 Fall 2017 Fall 2018 Fall 2020 Fall 2026
1 15 16 17 18 19 20 21 22
United States............ 1.9 50,484,900 50,624,900 50,709,700 50,759,300 50,996,200 51,737,900 2.8Region
Northeast .......................... -1.4 7,947,000 7,922,300 7,897,000 7,863,500 7,811,100 7,583,500 -5.0Midwest............................. -1.0 10,542,400 10,525,200 10,494,300 10,459,100 10,404,900 10,234,500 -3.1South................................. 4.6 19,687,200 19,838,400 19,956,100 20,053,100 20,308,300 21,131,300 8.3West .................................. 2.7 12,308,200 12,339,000 12,362,300 12,383,700 12,471,800 12,788,600 4.3
StateAlabama............................ -0.6 740,200 735,900 731,900 728,500 725,900 724,800 -2.6Alaska................................ -0.4 131,800 132,900 133,600 134,400 136,700 142,100 8.4Arizona.............................. 3.1 1,119,200 1,126,900 1,133,800 1,143,700 1,168,800 1,258,900 13.2Arkansas........................... 2.2 491,600 492,300 492,500 492,600 493,700 500,400 1.9California ........................... 0.8 6,294,600 6,275,200 6,255,600 6,232,100 6,215,200 6,202,400 -1.7
Colorado............................ 6.8 901,100 910,200 917,700 923,800 936,900 982,300 10.5Connecticut ....................... -3.8 535,800 529,500 522,400 515,200 502,100 465,000 -14.3Delaware........................... 5.7 135,500 137,200 138,700 139,900 142,600 146,700 9.5District of Columbia........... 16.6 83,500 86,300 89,300 92,200 98,600 114,700 41.7Florida ............................... 4.6 2,789,500 2,818,700 2,840,900 2,863,300 2,919,000 3,104,600 12.6
Georgia ............................. 4.6 1,761,200 1,774,700 1,784,400 1,793,300 1,817,000 1,912,900 9.7Hawaii................................ 1.2 187,000 188,500 189,800 190,900 193,300 193,900 6.3Idaho ................................. 5.3 292,100 293,100 293,400 293,500 293,900 301,600 3.7Illinois................................. -2.6 2,043,700 2,038,700 2,031,000 2,022,300 2,003,100 1,938,900 -5.4Indiana............................... # 1,043,500 1,040,100 1,035,400 1,030,200 1,020,800 1,012,900 -3.2
Iowa................................... 2.7 508,200 510,100 511,200 511,800 514,500 514,800 1.9Kansas .............................. 4.8 499,200 500,500 501,200 501,400 503,400 506,400 1.8Kentucky............................ 1.3 692,600 696,000 699,500 702,100 708,400 718,900 4.4Louisiana........................... 3.7 720,800 723,700 725,600 725,400 729,100 736,300 2.7Maine................................. -3.6 180,700 178,700 176,900 175,000 171,800 161,200 -11.7
Maryland ........................... 3.1 882,800 891,200 899,100 905,100 917,300 926,900 6.0Massachusetts.................. -0.1 953,900 950,900 947,600 943,800 937,600 921,700 -3.6Michigan............................ -6.7 1,520,900 1,504,800 1,487,400 1,469,700 1,440,800 1,378,400 -10.4Minnesota.......................... 2.4 866,200 873,100 878,700 883,700 892,500 896,500 4.6Mississippi......................... -0.3 489,700 487,500 484,500 480,600 475,700 462,000 -5.9
Missouri............................. # 917,000 915,600 914,000 912,200 911,700 908,400 -1.0Montana............................ 1.9 145,500 146,500 147,400 148,600 151,100 159,200 10.2Nebraska........................... 5.8 315,400 318,300 320,500 322,100 325,200 332,900 6.5Nevada.............................. 7.1 464,900 471,000 476,300 481,600 492,700 526,200 14.6New Hampshire................ -6.3 182,300 179,700 177,200 174,600 170,000 159,000 -13.9
New Jersey ....................... 0.3 1,389,100 1,385,000 1,380,700 1,375,300 1,365,600 1,322,600 -5.6New Mexico....................... 1.8 339,900 339,700 338,900 338,500 338,300 340,700 0.1New York ........................... -0.9 2,746,100 2,751,900 2,755,600 2,754,000 2,757,500 2,714,600 -1.0North Carolina................... 4.4 1,562,200 1,571,600 1,577,900 1,579,400 1,589,400 1,643,300 6.1North Dakota..................... 12.1 109,500 112,600 115,600 118,800 124,900 136,700 28.3
Ohio................................... -2.2 1,715,000 1,708,100 1,698,500 1,688,900 1,672,500 1,626,500 -5.7Oklahoma.......................... 5.1 692,200 697,200 700,700 703,800 711,700 733,200 6.5Oregon .............................. 3.2 605,300 608,700 611,600 614,800 623,100 641,900 6.7Pennsylvania..................... -2.4 1,731,500 1,720,500 1,711,600 1,701,000 1,684,700 1,625,700 -6.7Rhode Island..................... -2.2 141,500 140,700 140,800 140,700 139,200 135,100 -4.8
South Carolina.................. 4.6 765,500 772,400 777,800 782,300 793,900 820,700 8.5South Dakota .................... 7.5 133,900 135,600 136,900 138,200 140,900 143,100 7.6Tennessee......................... 2.4 997,500 999,200 1,000,200 1,001,500 1,008,400 1,039,600 4.4Texas ................................. 7.9 5,314,600 5,381,000 5,435,900 5,485,000 5,594,600 5,948,400 13.7Utah................................... 11.2 646,200 655,300 663,100 670,700 688,200 750,700 18.1
Vermont............................. -4.5 86,100 85,300 84,400 83,700 82,600 78,800 -9.8Virginia .............................. 2.8 1,288,300 1,294,700 1,299,300 1,301,200 1,308,100 1,325,400 3.5Washington ....................... 3.7 1,084,900 1,094,700 1,103,700 1,112,800 1,133,800 1,185,700 10.4West Virginia..................... -0.8 279,600 278,900 278,000 276,800 274,900 272,500 -2.8Wisconsin.......................... -0.1 869,900 867,800 863,900 859,900 854,700 838,800 -3.7Wyoming ........................... 6.7 95,400 96,400 97,400 98,200 100,000 102,800 9.3
JurisdictionBureau of Indian
Education ................... — — — — — — — —DoD, overseas................... — — — — — — — —DoD, domestic................... — — — — — — — —Other jurisdictions
American Samoa.......... — — — — — — — —Guam............................ — — — — — — — —Northern Marianas ....... — — — — — — — —Puerto Rico................... -16.7 — — — — — — —U.S. Virgin Islands ........ -8.1 — — — — — — —
—Not available.#Rounds to zero.NOTE: DoD = Department of Defense. Detail may not sum to totals because of rounding.Some data have been revised from previously published figures.
SOURCE: U.S. Department of Education, National Center for Education Statistics, Com-mon Core of Data (CCD), “State Nonfiscal Survey of Public Elementary/Secondary Educa-tion,” 1990–91 through 2014–15; and State Public Elementary and Secondary EnrollmentProjection Model, 1980 through 2026. (This table was prepared November 2016.)
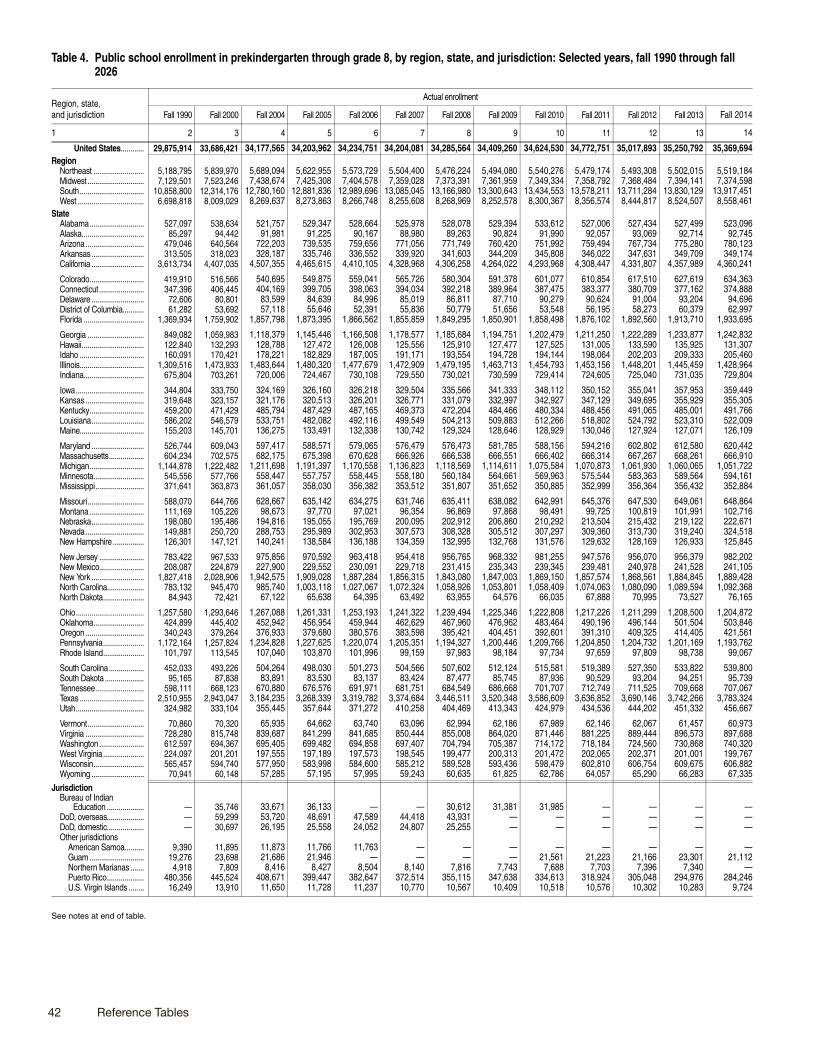
42 Reference Tables
See notes at end of table.
Table 4. Public school enrollment in prekindergarten through grade 8, by region, state, and jurisdiction: Selected years, fall 1990 through fall 2026
Region, state, and jurisdiction
Actual enrollment
Fall 1990 Fall 2000 Fall 2004 Fall 2005 Fall 2006 Fall 2007 Fall 2008 Fall 2009 Fall 2010 Fall 2011 Fall 2012 Fall 2013 Fall 2014
1 2 3 4 5 6 7 8 9 10 11 12 13 14
United States............ 29,875,914 33,686,421 34,177,565 34,203,962 34,234,751 34,204,081 34,285,564 34,409,260 34,624,530 34,772,751 35,017,893 35,250,792 35,369,694Region
Northeast .......................... 5,188,795 5,839,970 5,689,094 5,622,955 5,573,729 5,504,400 5,476,224 5,494,080 5,540,276 5,479,174 5,493,308 5,502,015 5,519,184Midwest............................. 7,129,501 7,523,246 7,438,674 7,425,308 7,404,578 7,359,028 7,373,391 7,361,959 7,349,334 7,358,792 7,368,484 7,394,141 7,374,598South................................. 10,858,800 12,314,176 12,780,160 12,881,836 12,989,696 13,085,045 13,166,980 13,300,643 13,434,553 13,578,211 13,711,284 13,830,129 13,917,451West .................................. 6,698,818 8,009,029 8,269,637 8,273,863 8,266,748 8,255,608 8,268,969 8,252,578 8,300,367 8,356,574 8,444,817 8,524,507 8,558,461
StateAlabama............................ 527,097 538,634 521,757 529,347 528,664 525,978 528,078 529,394 533,612 527,006 527,434 527,499 523,096Alaska................................ 85,297 94,442 91,981 91,225 90,167 88,980 89,263 90,824 91,990 92,057 93,069 92,714 92,745Arizona.............................. 479,046 640,564 722,203 739,535 759,656 771,056 771,749 760,420 751,992 759,494 767,734 775,280 780,123Arkansas........................... 313,505 318,023 328,187 335,746 336,552 339,920 341,603 344,209 345,808 346,022 347,631 349,709 349,174California ........................... 3,613,734 4,407,035 4,507,355 4,465,615 4,410,105 4,328,968 4,306,258 4,264,022 4,293,968 4,308,447 4,331,807 4,357,989 4,360,241
Colorado............................ 419,910 516,566 540,695 549,875 559,041 565,726 580,304 591,378 601,077 610,854 617,510 627,619 634,363Connecticut ....................... 347,396 406,445 404,169 399,705 398,063 394,034 392,218 389,964 387,475 383,377 380,709 377,162 374,888Delaware........................... 72,606 80,801 83,599 84,639 84,996 85,019 86,811 87,710 90,279 90,624 91,004 93,204 94,696District of Columbia........... 61,282 53,692 57,118 55,646 52,391 55,836 50,779 51,656 53,548 56,195 58,273 60,379 62,997Florida ............................... 1,369,934 1,759,902 1,857,798 1,873,395 1,866,562 1,855,859 1,849,295 1,850,901 1,858,498 1,876,102 1,892,560 1,913,710 1,933,695
Georgia ............................. 849,082 1,059,983 1,118,379 1,145,446 1,166,508 1,178,577 1,185,684 1,194,751 1,202,479 1,211,250 1,222,289 1,233,877 1,242,832Hawaii................................ 122,840 132,293 128,788 127,472 126,008 125,556 125,910 127,477 127,525 131,005 133,590 135,925 131,307Idaho ................................. 160,091 170,421 178,221 182,829 187,005 191,171 193,554 194,728 194,144 198,064 202,203 209,333 205,460Illinois................................. 1,309,516 1,473,933 1,483,644 1,480,320 1,477,679 1,472,909 1,479,195 1,463,713 1,454,793 1,453,156 1,448,201 1,445,459 1,428,964Indiana............................... 675,804 703,261 720,006 724,467 730,108 729,550 730,021 730,599 729,414 724,605 725,040 731,035 729,804
Iowa................................... 344,804 333,750 324,169 326,160 326,218 329,504 335,566 341,333 348,112 350,152 355,041 357,953 359,449Kansas .............................. 319,648 323,157 321,176 320,513 326,201 326,771 331,079 332,997 342,927 347,129 349,695 355,929 355,305Kentucky............................ 459,200 471,429 485,794 487,429 487,165 469,373 472,204 484,466 480,334 488,456 491,065 485,001 491,766Louisiana........................... 586,202 546,579 533,751 482,082 492,116 499,549 504,213 509,883 512,266 518,802 524,792 523,310 522,009Maine................................. 155,203 145,701 136,275 133,491 132,338 130,742 129,324 128,646 128,929 130,046 127,924 127,071 126,109
Maryland ........................... 526,744 609,043 597,417 588,571 579,065 576,479 576,473 581,785 588,156 594,216 602,802 612,580 620,442Massachusetts.................. 604,234 702,575 682,175 675,398 670,628 666,926 666,538 666,551 666,402 666,314 667,267 668,261 666,910Michigan............................ 1,144,878 1,222,482 1,211,698 1,191,397 1,170,558 1,136,823 1,118,569 1,114,611 1,075,584 1,070,873 1,061,930 1,060,065 1,051,722Minnesota.......................... 545,556 577,766 558,447 557,757 558,445 558,180 560,184 564,661 569,963 575,544 583,363 589,564 594,161Mississippi......................... 371,641 363,873 361,057 358,030 356,382 353,512 351,807 351,652 350,885 352,999 356,364 356,432 352,884
Missouri............................. 588,070 644,766 628,667 635,142 634,275 631,746 635,411 638,082 642,991 645,376 647,530 649,061 648,864Montana............................ 111,169 105,226 98,673 97,770 97,021 96,354 96,869 97,868 98,491 99,725 100,819 101,991 102,716Nebraska........................... 198,080 195,486 194,816 195,055 195,769 200,095 202,912 206,860 210,292 213,504 215,432 219,122 222,671Nevada.............................. 149,881 250,720 288,753 295,989 302,953 307,573 308,328 305,512 307,297 309,360 313,730 319,240 324,518New Hampshire................ 126,301 147,121 140,241 138,584 136,188 134,359 132,995 132,768 131,576 129,632 128,169 126,933 125,845
New Jersey ....................... 783,422 967,533 975,856 970,592 963,418 954,418 956,765 968,332 981,255 947,576 956,070 956,379 982,202New Mexico....................... 208,087 224,879 227,900 229,552 230,091 229,718 231,415 235,343 239,345 239,481 240,978 241,528 241,105New York ........................... 1,827,418 2,028,906 1,942,575 1,909,028 1,887,284 1,856,315 1,843,080 1,847,003 1,869,150 1,857,574 1,868,561 1,884,845 1,889,428North Carolina................... 783,132 945,470 985,740 1,003,118 1,027,067 1,072,324 1,058,926 1,053,801 1,058,409 1,074,063 1,080,090 1,089,594 1,092,368North Dakota..................... 84,943 72,421 67,122 65,638 64,395 63,492 63,955 64,576 66,035 67,888 70,995 73,527 76,165
Ohio................................... 1,257,580 1,293,646 1,267,088 1,261,331 1,253,193 1,241,322 1,239,494 1,225,346 1,222,808 1,217,226 1,211,299 1,208,500 1,204,872Oklahoma.......................... 424,899 445,402 452,942 456,954 459,944 462,629 467,960 476,962 483,464 490,196 496,144 501,504 503,846Oregon .............................. 340,243 379,264 376,933 379,680 380,576 383,598 395,421 404,451 392,601 391,310 409,325 414,405 421,561Pennsylvania..................... 1,172,164 1,257,824 1,234,828 1,227,625 1,220,074 1,205,351 1,194,327 1,200,446 1,209,766 1,204,850 1,204,732 1,201,169 1,193,762Rhode Island..................... 101,797 113,545 107,040 103,870 101,996 99,159 97,983 98,184 97,734 97,659 97,809 98,738 99,067
South Carolina.................. 452,033 493,226 504,264 498,030 501,273 504,566 507,602 512,124 515,581 519,389 527,350 533,822 539,800South Dakota .................... 95,165 87,838 83,891 83,530 83,137 83,424 87,477 85,745 87,936 90,529 93,204 94,251 95,739Tennessee......................... 598,111 668,123 670,880 676,576 691,971 681,751 684,549 686,668 701,707 712,749 711,525 709,668 707,067Texas ................................. 2,510,955 2,943,047 3,184,235 3,268,339 3,319,782 3,374,684 3,446,511 3,520,348 3,586,609 3,636,852 3,690,146 3,742,266 3,783,324Utah................................... 324,982 333,104 355,445 357,644 371,272 410,258 404,469 413,343 424,979 434,536 444,202 451,332 456,667
Vermont............................. 70,860 70,320 65,935 64,662 63,740 63,096 62,994 62,186 67,989 62,146 62,067 61,457 60,973Virginia .............................. 728,280 815,748 839,687 841,299 841,685 850,444 855,008 864,020 871,446 881,225 889,444 896,573 897,688Washington....................... 612,597 694,367 695,405 699,482 694,858 697,407 704,794 705,387 714,172 718,184 724,560 730,868 740,320West Virginia..................... 224,097 201,201 197,555 197,189 197,573 198,545 199,477 200,313 201,472 202,065 202,371 201,001 199,767Wisconsin.......................... 565,457 594,740 577,950 583,998 584,600 585,212 589,528 593,436 598,479 602,810 606,754 609,675 606,882Wyoming ........................... 70,941 60,148 57,285 57,195 57,995 59,243 60,635 61,825 62,786 64,057 65,290 66,283 67,335
JurisdictionBureau of Indian
Education ................... — 35,746 33,671 36,133 — — 30,612 31,381 31,985 — — — —DoD, overseas................... — 59,299 53,720 48,691 47,589 44,418 43,931 — — — — — —DoD, domestic................... — 30,697 26,195 25,558 24,052 24,807 25,255 — — — — — —Other jurisdictions
American Samoa.......... 9,390 11,895 11,873 11,766 11,763 — — — — — — — —Guam............................ 19,276 23,698 21,686 21,946 — — — — 21,561 21,223 21,166 23,301 21,112Northern Marianas ....... 4,918 7,809 8,416 8,427 8,504 8,140 7,816 7,743 7,688 7,703 7,396 7,340 —Puerto Rico................... 480,356 445,524 408,671 399,447 382,647 372,514 355,115 347,638 334,613 318,924 305,048 294,976 284,246U.S. Virgin Islands ........ 16,249 13,910 11,650 11,728 11,237 10,770 10,567 10,409 10,518 10,576 10,302 10,283 9,724

Projections of Education Statistics to 2026 43
Table 4. Public school enrollment in prekindergarten through grade 8, by region, state, and jurisdiction: Selected years, fall 1990 through fall 2026—Continued
Region, state, and jurisdiction
Percent change in enrollment,2009 to 2014
Projected enrollment Percent changein enrollment,2014 to 2026Fall 2015 Fall 2016 Fall 2017 Fall 2018 Fall 2020 Fall 2026
1 15 16 17 18 19 20 21 22
United States............ 2.8 35,414,400 35,513,900 35,561,600 35,593,500 35,667,100 36,361,700 2.8Region
Northeast .......................... 0.5 5,488,100 5,478,200 5,456,900 5,433,000 5,386,100 5,222,300 -5.4Midwest............................. 0.2 7,347,400 7,332,500 7,307,700 7,270,500 7,210,000 7,135,800 -3.2South................................. 4.6 13,995,500 14,095,200 14,183,400 14,273,400 14,449,700 15,026,700 8.0West .................................. 3.7 8,583,300 8,608,000 8,613,600 8,616,600 8,621,300 8,977,000 4.9
StateAlabama............................ -1.2 520,500 520,300 520,800 520,900 521,900 519,100 -0.8Alaska................................ 2.1 93,400 94,500 95,600 96,700 98,200 100,700 8.6Arizona.............................. 2.6 787,600 796,100 803,100 809,900 823,100 898,000 15.1Arkansas........................... 1.4 349,100 349,400 350,100 350,800 353,900 357,200 2.3California ........................... 2.3 4,345,000 4,331,000 4,306,400 4,280,100 4,225,300 4,332,900 -0.6
Colorado............................ 7.3 639,500 643,300 644,700 646,900 652,900 693,000 9.2Connecticut ....................... -3.9 369,200 364,700 358,600 353,200 343,100 321,500 -14.2Delaware........................... 8.0 95,900 97,000 97,700 98,400 99,300 101,700 7.4District of Columbia........... 22.0 65,600 68,700 71,500 74,400 79,500 89,500 42.0Florida ............................... 4.5 1,951,200 1,973,500 1,994,500 2,014,600 2,051,800 2,179,100 12.7
Georgia ............................. 4.0 1,249,200 1,257,000 1,265,000 1,273,000 1,289,900 1,365,000 9.8Hawaii................................ 3.0 136,300 137,300 138,200 138,700 139,200 138,300 5.3Idaho ................................. 5.5 205,200 204,900 204,300 203,800 203,600 213,600 4.0Illinois................................. -2.4 1,422,000 1,414,200 1,403,400 1,388,800 1,363,000 1,342,000 -6.1Indiana............................... -0.1 723,500 720,800 719,200 716,000 713,400 711,200 -2.5
Iowa................................... 5.3 361,500 363,100 363,600 364,100 364,100 362,200 0.8Kansas .............................. 6.7 355,900 357,000 357,300 357,500 357,700 360,000 1.3Kentucky............................ 1.5 493,200 496,900 499,800 502,200 506,400 509,300 3.6Louisiana........................... 2.4 523,400 524,700 526,800 525,900 531,500 534,400 2.4Maine................................. -2.0 124,800 123,800 122,600 121,100 118,200 111,500 -11.6
Maryland ........................... 6.6 628,300 634,000 637,900 641,000 644,800 642,000 3.5Massachusetts.................. 0.1 663,800 661,900 658,700 655,500 651,500 644,200 -3.4Michigan............................ -5.6 1,036,400 1,025,800 1,014,800 1,001,600 982,100 958,300 -8.9Minnesota.......................... 5.2 599,900 604,800 607,300 608,100 608,600 607,600 2.3Mississippi......................... 0.4 350,500 349,200 348,300 347,000 344,100 331,600 -6.0
Missouri............................. 1.7 648,100 648,600 648,200 647,500 645,900 644,600 -0.7Montana............................ 5.0 103,700 104,500 105,400 106,200 107,700 113,800 10.8Nebraska........................... 7.6 223,600 224,400 224,700 224,600 225,400 232,900 4.6Nevada.............................. 6.2 328,500 332,700 336,900 341,000 348,000 369,500 13.9New Hampshire................ -5.2 124,000 122,100 120,300 118,300 115,000 109,500 -13.0
New Jersey ....................... 1.4 970,100 968,600 964,200 958,800 949,400 918,100 -6.5New Mexico....................... 2.4 240,300 240,000 239,700 239,300 238,600 242,500 0.6New York ........................... 2.3 1,890,400 1,896,000 1,898,500 1,900,600 1,898,600 1,852,000 -2.0North Carolina................... 3.7 1,092,600 1,096,000 1,098,900 1,110,700 1,119,900 1,155,300 5.8North Dakota..................... 17.9 78,800 81,500 83,800 85,700 89,100 94,100 23.6
Ohio................................... -1.7 1,196,100 1,190,900 1,185,800 1,179,900 1,168,600 1,138,100 -5.5Oklahoma.......................... 5.6 505,100 508,500 510,800 512,900 519,900 533,900 6.0Oregon .............................. 4.2 425,200 429,400 432,300 435,000 440,300 449,800 6.7Pennsylvania..................... -0.6 1,187,000 1,183,300 1,177,300 1,170,100 1,157,000 1,116,900 -6.4Rhode Island..................... 0.9 98,500 97,900 97,300 96,500 95,400 93,200 -6.0
South Carolina.................. 5.4 544,500 550,300 555,400 560,100 567,400 578,900 7.2South Dakota .................... 11.7 96,700 98,000 99,000 99,800 100,500 100,700 5.2Tennessee......................... 3.0 707,300 709,400 711,600 714,000 717,800 747,300 5.7Texas ................................. 7.5 3,821,000 3,860,500 3,892,800 3,925,500 3,996,900 4,264,300 12.7Utah................................... 10.5 462,200 467,000 470,600 474,400 484,800 538,200 17.9
Vermont............................. -2.0 60,300 59,900 59,400 58,900 57,900 55,400 -9.1Virginia .............................. 3.9 899,600 902,400 904,900 906,000 909,400 922,800 2.8Washington ....................... 5.0 748,200 758,100 766,700 774,500 789,300 814,500 10.0West Virginia..................... -0.3 198,500 197,600 196,800 196,000 195,300 195,300 -2.2Wisconsin.......................... 2.3 605,000 603,500 600,500 596,800 591,600 584,100 -3.8Wyoming ........................... 8.9 68,300 69,200 69,600 70,100 70,500 72,000 6.9
JurisdictionBureau of Indian
Education ................... — — — — — — — —DoD, overseas................... — — — — — — — —DoD, domestic................... — — — — — — — —Other jurisdictions
American Samoa.......... — — — — — — — —Guam............................ — — — — — — — —Northern Marianas ....... — — — — — — — —Puerto Rico................... -18.2 — — — — — — —U.S. Virgin Islands ........ -6.6 — — — — — — —
—Not available.NOTE: DoD = Department of Defense. The total ungraded counts of students were pro-rated to the elementary level (prekindergarten through grade 8) and the secondary level(grades 9 through 12) based on prior reports. Detail may not sum to totals because ofrounding. Some data have been revised from previously published figures.
SOURCE: U.S. Department of Education, National Center for Education Statistics, Com-mon Core of Data (CCD), “State Nonfiscal Survey of Public Elementary/Secondary Educa-tion,” 1990–91 through 2014–15; and State Public Elementary and Secondary EnrollmentProjection Model, 1980 through 2026. (This table was prepared November 2016.)

44 Reference Tables
See notes at end of table.
Table 5. Public school enrollment in grades 9 through 12, by region, state, and jurisdiction: Selected years, fall 1990 through fall 2026
Region, state, and jurisdiction
Actual enrollment
Fall 1990 Fall 2000 Fall 2004 Fall 2005 Fall 2006 Fall 2007 Fall 2008 Fall 2009 Fall 2010 Fall 2011 Fall 2012 Fall 2013 Fall 2014
1 2 3 4 5 6 7 8 9 10 11 12 13 14
United States............ 11,340,769 13,517,118 14,617,900 14,909,336 15,081,091 15,086,478 14,980,008 14,951,722 14,859,651 14,748,918 14,753,225 14,793,730 14,942,887Region
Northeast .......................... 2,092,968 2,382,157 2,582,165 2,617,205 2,684,160 2,617,622 2,576,761 2,597,949 2,531,059 2,474,807 2,465,820 2,459,228 2,460,672Midwest............................. 2,814,260 3,206,741 3,336,735 3,393,507 3,414,670 3,411,182 3,369,582 3,310,212 3,260,270 3,215,000 3,190,746 3,178,779 3,185,941South................................. 3,948,216 4,693,085 5,111,827 5,221,330 5,303,937 5,337,728 5,323,790 5,351,246 5,370,447 5,377,721 5,417,092 5,468,585 5,588,742West .................................. 2,485,325 3,235,135 3,587,173 3,677,294 3,678,324 3,719,946 3,709,875 3,692,315 3,697,875 3,681,390 3,679,567 3,687,138 3,707,532
StateAlabama............................ 194,709 201,358 208,383 212,414 214,968 216,941 217,590 219,495 221,940 217,615 217,203 218,705 221,068Alaska................................ 28,606 38,914 40,989 42,063 42,441 42,049 41,399 40,837 40,114 39,110 38,420 38,230 38,431Arizona.............................. 160,807 237,132 321,095 354,919 308,593 316,391 316,068 317,411 319,759 320,825 321,650 327,165 331,572Arkansas........................... 122,781 131,936 134,928 138,460 139,857 139,096 137,362 136,350 136,306 137,092 138,526 140,270 141,743California ........................... 1,336,740 1,733,779 1,934,202 1,971,587 1,996,645 2,014,503 2,016,270 1,999,416 1,995,610 1,979,387 1,967,644 1,954,634 1,951,920
Colorado............................ 154,303 207,942 225,281 229,951 234,985 236,141 238,139 240,990 242,239 243,411 246,051 249,380 254,643Connecticut ....................... 121,727 155,734 173,221 175,354 177,037 176,592 174,980 174,004 173,071 171,060 170,245 169,038 167,790Delaware........................... 27,052 33,875 35,492 36,298 37,258 37,555 38,619 39,091 39,124 38,322 38,022 38,483 39,346District of Columbia........... 19,412 15,233 19,596 21,230 20,459 22,586 17,902 17,777 17,736 17,716 17,867 17,774 17,961Florida ............................... 491,658 674,919 781,538 801,629 804,951 810,952 781,725 783,621 784,849 792,054 799,602 807,034 823,249
Georgia ............................. 302,605 384,954 435,058 453,015 462,649 471,012 470,108 472,934 474,588 473,766 481,043 490,032 501,605Hawaii................................ 48,868 52,067 54,397 55,346 54,720 54,341 53,568 52,719 52,076 51,701 51,170 50,900 51,077Idaho ................................. 60,749 74,696 77,863 79,153 80,375 80,948 81,497 81,571 81,715 81,809 82,631 87,143 85,425Illinois................................. 511,891 574,859 613,859 631,386 640,597 639,896 640,512 640,462 636,861 629,941 624,679 621,531 621,275Indiana............................... 278,721 286,006 301,342 310,607 315,832 317,214 316,126 316,062 317,818 316,160 316,329 316,350 316,465
Iowa................................... 138,848 161,330 154,150 157,322 156,904 155,611 151,993 150,509 147,663 145,718 144,784 145,011 145,862Kansas .............................. 117,386 147,453 147,960 147,012 143,305 141,524 139,981 141,492 140,774 138,979 139,348 140,511 141,970Kentucky............................ 177,201 194,421 189,002 192,449 195,987 196,852 197,826 195,623 192,794 193,531 194,102 192,388 196,874Louisiana........................... 198,555 196,510 190,530 172,444 183,735 181,489 180,660 181,032 184,292 184,588 186,111 188,181 194,791Maine................................. 59,946 61,336 62,545 62,007 61,648 65,503 63,611 60,579 60,148 58,923 57,815 56,924 56,361
Maryland ........................... 188,432 243,877 268,144 271,449 272,575 269,221 267,388 266,627 264,055 259,870 256,836 253,589 254,072Massachusetts.................. 230,080 272,575 293,399 296,511 298,033 296,032 292,372 290,502 289,161 287,055 287,506 287,478 288,934Michigan............................ 439,553 498,144 539,592 550,885 552,098 555,916 541,352 534,471 511,483 502,664 493,440 488,776 486,200Minnesota.......................... 210,818 276,574 280,056 281,486 282,120 279,398 275,864 272,392 268,074 264,194 262,041 261,409 263,074Mississippi......................... 130,776 133,998 134,319 136,924 138,644 140,610 140,155 140,829 139,641 137,620 137,286 136,154 138,033
Missouri............................. 228,488 267,978 276,782 282,563 286,078 285,442 282,460 279,900 275,719 271,208 270,370 269,227 268,921Montana............................ 41,805 49,649 48,032 47,646 47,397 46,469 45,030 43,939 43,202 42,624 42,089 42,138 41,816Nebraska........................... 76,001 90,713 90,945 91,591 91,811 91,149 89,678 88,508 88,208 87,792 88,073 88,555 89,964Nevada.............................. 51,435 89,986 111,330 116,406 121,813 121,789 125,043 123,435 129,852 130,274 131,977 132,591 134,671New Hampshire................ 46,484 61,340 66,611 67,183 67,384 66,413 64,939 64,372 63,135 62,268 60,805 59,377 58,825
New Jersey ....................... 306,224 345,872 417,491 425,010 425,432 427,930 424,655 427,697 421,293 408,855 416,133 413,916 418,377New Mexico....................... 93,794 95,427 98,202 97,206 98,129 99,322 98,830 99,076 98,777 97,744 97,242 97,716 99,260New York ........................... 770,919 853,282 893,762 906,553 922,365 909,120 897,512 919,049 865,805 847,144 842,142 847,925 851,757North Carolina................... 303,739 348,168 400,014 413,318 417,414 417,168 429,719 429,596 432,196 433,801 438,375 441,263 456,527North Dakota..................... 32,882 36,780 33,391 32,645 32,275 31,567 30,773 30,497 30,288 29,758 30,116 30,420 30,421
Ohio................................... 513,509 541,403 572,944 578,352 583,529 585,862 577,669 538,951 531,383 522,804 518,617 515,611 519,938Oklahoma.......................... 154,188 177,708 176,534 177,785 179,447 179,436 177,148 177,840 176,447 175,924 177,339 180,344 184,665Oregon .............................. 132,151 166,967 175,572 172,514 181,998 181,988 179,972 178,388 178,119 176,898 178,239 178,595 179,757Pennsylvania..................... 495,670 556,487 593,261 603,059 650,986 596,620 580,702 585,547 583,518 566,545 558,945 554,067 549,398Rhode Island..................... 37,016 43,802 49,458 49,552 49,616 48,470 47,359 46,934 46,059 45,195 44,672 43,270 42,892
South Carolina.................. 170,079 184,185 199,472 203,514 206,748 207,751 210,511 211,019 210,257 207,797 208,648 211,835 216,723South Dakota .................... 33,999 40,765 38,907 38,482 38,021 38,182 38,952 37,968 38,192 37,487 37,267 36,639 37,301Tennessee......................... 226,484 241,038 270,211 277,352 286,397 282,508 287,401 285,881 285,715 286,944 281,971 283,888 288,408Texas ................................. 871,932 1,116,572 1,220,980 1,257,055 1,279,727 1,300,148 1,305,637 1,329,862 1,349,106 1,363,618 1,387,513 1,411,436 1,450,441Utah................................... 121,670 148,381 148,162 150,786 152,114 165,986 155,309 158,243 160,573 164,296 169,077 174,129 178,910
Vermont............................. 24,902 31,729 32,417 31,976 31,659 30,942 30,631 29,265 28,869 27,762 27,557 27,233 26,338Virginia .............................. 270,321 329,167 365,052 372,317 378,755 380,413 380,787 381,320 379,994 376,658 375,975 377,252 382,693Washington....................... 227,112 310,403 324,600 332,503 331,916 332,840 332,224 329,960 329,616 327,269 327,134 328,068 333,318West Virginia..................... 98,292 85,166 82,574 83,677 84,366 83,990 83,252 82,349 81,407 80,805 80,673 79,957 80,543Wisconsin.......................... 232,164 284,736 286,807 291,176 292,100 289,421 284,222 279,000 273,807 268,295 265,682 264,739 264,550Wyoming ........................... 27,285 29,792 27,448 27,214 27,198 27,179 26,526 26,330 26,223 26,042 26,243 26,449 26,732
JurisdictionBureau of Indian
Education ................... — 11,192 12,157 14,805 — — 10,315 9,970 9,977 — — — —DoD, overseas................... — 14,282 14,607 13,852 13,302 12,829 12,837 — — — — — —DoD, domestic................... — 3,477 2,956 2,771 2,579 2,741 2,758 — — — — — —Other jurisdictions
American Samoa.......... 3,073 3,807 4,253 4,672 4,637 — — — — — — — —Guam............................ 7,115 8,775 8,919 9,040 — — — — 10,057 10,020 10,020 10,113 10,032Northern Marianas ....... 1,531 2,195 3,185 3,291 3,191 3,159 3,097 3,218 3,417 3,308 3,250 3,298 —Puerto Rico................... 164,378 167,201 166,977 164,043 161,491 154,051 148,520 145,755 139,122 133,816 129,561 128,958 126,704U.S. Virgin Islands ........ 5,501 5,549 4,779 5,022 5,047 5,133 5,201 5,084 4,977 5,135 4,890 4,670 4,517

Projections of Education Statistics to 2026 45
Table 5. Public school enrollment in grades 9 through 12, by region, state, and jurisdiction: Selected years, fall 1990 through fall 2026—Continued
Region, state, and jurisdiction
Percent changein enrollment,2009 to 2014
Projected enrollment Percent changein enrollment,2014 to 2026Fall 2015 Fall 2016 Fall 2017 Fall 2018 Fall 2020 Fall 2026
1 15 16 17 18 19 20 21 22
United States............ -0.1 15,070,500 15,111,000 15,148,100 15,165,800 15,329,000 15,376,200 2.9Region
Northeast .......................... -5.3 2,458,900 2,444,100 2,440,100 2,430,500 2,424,900 2,361,200 -4.0Midwest............................. -3.8 3,195,000 3,192,800 3,186,600 3,188,600 3,194,900 3,098,800 -2.7South................................. 4.4 5,691,700 5,743,200 5,772,600 5,779,700 5,858,700 6,104,600 9.2West .................................. 0.4 3,724,800 3,730,900 3,748,700 3,767,100 3,850,500 3,811,600 2.8
StateAlabama............................ 0.7 219,700 215,600 211,100 207,600 204,000 205,700 -7.0Alaska................................ -5.9 38,500 38,400 38,000 37,800 38,500 41,400 7.7Arizona.............................. 4.5 331,600 330,800 330,700 333,800 345,700 360,900 8.8Arkansas........................... 4.0 142,500 142,900 142,400 141,800 139,900 143,200 1.1California ........................... -2.4 1,949,600 1,944,200 1,949,100 1,952,000 1,989,900 1,869,500 -4.2
Colorado............................ 5.7 261,600 267,000 272,900 276,900 284,000 289,300 13.6Connecticut ....................... -3.6 166,600 164,900 163,800 162,000 159,000 143,400 -14.5Delaware........................... 0.7 39,700 40,200 41,000 41,500 43,300 45,000 14.4District of Columbia........... 1.0 17,900 17,600 17,700 17,800 19,100 25,200 40.5Florida ............................... 5.1 838,300 845,200 846,500 848,600 867,200 925,500 12.4
Georgia ............................. 6.1 512,000 517,700 519,500 520,300 527,100 547,900 9.2Hawaii................................ -3.1 50,800 51,200 51,600 52,200 54,000 55,700 9.0Idaho ................................. 4.7 86,900 88,200 89,100 89,800 90,300 88,000 3.0Illinois................................. -3.0 621,700 624,600 627,600 633,500 640,100 597,000 -3.9Indiana............................... 0.1 320,000 319,300 316,200 314,100 307,400 301,700 -4.7
Iowa................................... -3.1 146,700 147,100 147,600 147,700 150,400 152,700 4.7Kansas .............................. 0.3 143,400 143,400 143,900 143,900 145,700 146,500 3.2Kentucky............................ 0.6 199,400 199,100 199,700 199,900 202,000 209,600 6.5Louisiana........................... 7.6 197,400 199,000 198,800 199,500 197,600 201,800 3.6Maine................................. -7.0 55,900 55,000 54,300 53,900 53,500 49,700 -11.9
Maryland ........................... -4.7 254,500 257,200 261,200 264,100 272,500 284,900 12.2Massachusetts.................. -0.5 290,000 288,900 288,900 288,300 286,000 277,400 -4.0Michigan............................ -9.0 484,400 479,000 472,600 468,100 458,700 420,000 -13.6Minnesota.......................... -3.4 266,300 268,300 271,400 275,600 283,900 288,900 9.8Mississippi......................... -2.0 139,100 138,400 136,200 133,700 131,600 130,300 -5.6
Missouri............................. -3.9 268,900 267,000 265,900 264,700 265,700 263,800 -1.9Montana............................ -4.8 41,900 42,000 41,900 42,400 43,400 45,400 8.6Nebraska........................... 1.6 91,800 93,800 95,800 97,500 99,800 100,000 11.2Nevada.............................. 9.1 136,400 138,200 139,400 140,600 144,700 156,700 16.3New Hampshire................ -8.6 58,300 57,600 56,900 56,300 55,000 49,500 -15.9
New Jersey ....................... -2.2 419,000 416,400 416,500 416,500 416,300 404,500 -3.3New Mexico....................... 0.2 99,600 99,700 99,200 99,200 99,700 98,200 -1.1New York ........................... -7.3 855,700 855,900 857,100 853,400 858,900 862,600 1.3North Carolina................... 6.3 469,600 475,600 479,000 468,700 469,500 488,000 6.9North Dakota..................... -0.2 30,700 31,100 31,800 33,000 35,800 42,600 40.1
Ohio................................... -3.5 518,900 517,200 512,700 509,000 503,800 488,400 -6.1Oklahoma.......................... 3.8 187,200 188,700 189,900 190,900 191,800 199,300 7.9Oregon .............................. 0.8 180,200 179,300 179,300 179,800 182,800 192,000 6.8Pennsylvania..................... -6.2 544,500 537,200 534,300 530,900 527,700 508,800 -7.4Rhode Island..................... -8.6 43,000 42,800 43,500 44,300 43,900 41,900 -2.3
South Carolina.................. 2.7 221,000 222,100 222,400 222,200 226,500 241,800 11.6South Dakota .................... -1.8 37,300 37,600 37,900 38,300 40,400 42,400 13.7Tennessee......................... 0.9 290,100 289,800 288,600 287,500 290,600 292,300 1.4Texas ................................. 9.1 1,493,700 1,520,600 1,543,200 1,559,600 1,597,600 1,684,100 16.1Utah................................... 13.1 184,100 188,200 192,500 196,300 203,400 212,500 18.8
Vermont............................. -10.0 25,900 25,400 24,900 24,800 24,600 23,400 -11.2Virginia .............................. 0.4 388,600 392,300 394,400 395,200 398,700 402,700 5.2Washington ....................... 1.0 336,700 336,500 337,100 338,300 344,500 371,200 11.4West Virginia..................... -2.2 81,100 81,300 81,200 80,800 79,600 77,200 -4.2Wisconsin.......................... -5.2 264,900 264,300 263,400 263,100 263,100 254,800 -3.7Wyoming ........................... 1.5 27,100 27,300 27,800 28,100 29,600 30,800 15.4
JurisdictionBureau of Indian
Education ................... — — — — — — — —DoD, overseas................... — — — — — — — —DoD, domestic................... — — — — — — — —Other jurisdictions
American Samoa.......... — — — — — — — —Guam............................ — — — — — — — —Northern Marianas ....... — — — — — — — —Puerto Rico................... -13.1 — — — — — — —U.S. Virgin Islands ........ -11.2 — — — — — — —
—Not available. NOTE: DoD = Department of Defense. The total ungraded counts of students were proratedto the elementary level (prekindergarten through grade 8) and the secondary level (grades 9through 12) based on prior reports. In addition to students in grades 9 through 12 andungraded secondary students, this table includes a small number of students reported as
being enrolled in grade 13. Detail may not sum to totals because of rounding. Some datahave been revised from previously published figures. SOURCE: U.S. Department of Education, National Center for Education Statistics, Com-mon Core of Data (CCD), “State Nonfiscal Survey of Public Elementary/Secondary Educa-tion,” 1990–91 through 2014–15; and State Public Elementary and Secondary EnrollmentProjection Model, 1980 through 2026. (This table was prepared November 2016.)
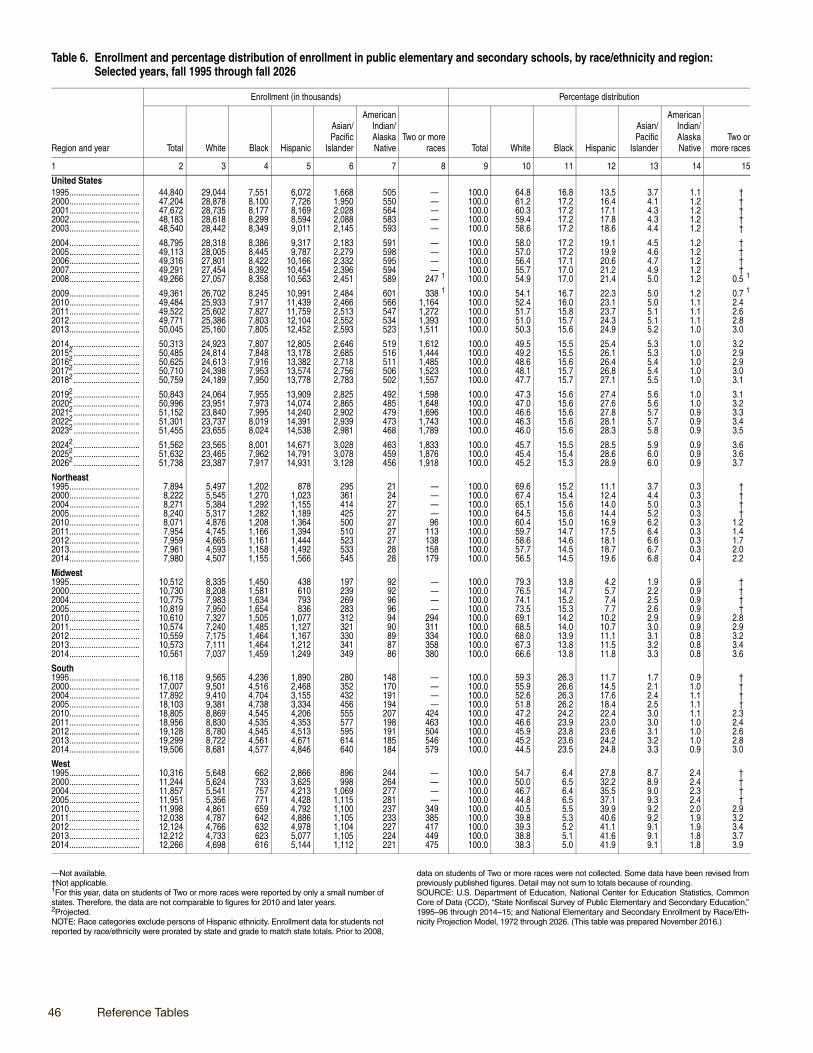
46 Reference Tables
Table 6. Enrollment and percentage distribution of enrollment in public elementary and secondary schools, by race/ethnicity and region: Selected years, fall 1995 through fall 2026
Region and year
Enrollment (in thousands) Percentage distribution
Total White Black Hispanic
Asian/Pacific
Islander
AmericanIndian/AlaskaNative
Two or moreraces Total White Black Hispanic
Asian/Pacific
Islander
AmericanIndian/AlaskaNative
Two ormore races
1 2 3 4 5 6 7 8 9 10 11 12 13 14 15
United States1995................................ 44,840 29,044 7,551 6,072 1,668 505 — 100.0 64.8 16.8 13.5 3.7 1.1 †2000................................ 47,204 28,878 8,100 7,726 1,950 550 — 100.0 61.2 17.2 16.4 4.1 1.2 †2001................................ 47,672 28,735 8,177 8,169 2,028 564 — 100.0 60.3 17.2 17.1 4.3 1.2 †2002................................ 48,183 28,618 8,299 8,594 2,088 583 — 100.0 59.4 17.2 17.8 4.3 1.2 †2003................................ 48,540 28,442 8,349 9,011 2,145 593 — 100.0 58.6 17.2 18.6 4.4 1.2 †
2004................................ 48,795 28,318 8,386 9,317 2,183 591 — 100.0 58.0 17.2 19.1 4.5 1.2 †2005................................ 49,113 28,005 8,445 9,787 2,279 598 — 100.0 57.0 17.2 19.9 4.6 1.2 †2006................................ 49,316 27,801 8,422 10,166 2,332 595 — 100.0 56.4 17.1 20.6 4.7 1.2 †2007................................ 49,291 27,454 8,392 10,454 2,396 594 — 100.0 55.7 17.0 21.2 4.9 1.2 †2008................................ 49,266 27,057 8,358 10,563 2,451 589 247 1 100.0 54.9 17.0 21.4 5.0 1.2 0.5 1
2009................................ 49,361 26,702 8,245 10,991 2,484 601 338 1 100.0 54.1 16.7 22.3 5.0 1.2 0.7 1
2010................................ 49,484 25,933 7,917 11,439 2,466 566 1,164 100.0 52.4 16.0 23.1 5.0 1.1 2.42011................................ 49,522 25,602 7,827 11,759 2,513 547 1,272 100.0 51.7 15.8 23.7 5.1 1.1 2.62012................................ 49,771 25,386 7,803 12,104 2,552 534 1,393 100.0 51.0 15.7 24.3 5.1 1.1 2.82013................................ 50,045 25,160 7,805 12,452 2,593 523 1,511 100.0 50.3 15.6 24.9 5.2 1.0 3.0
2014................................ 50,313 24,923 7,807 12,805 2,646 519 1,612 100.0 49.5 15.5 25.4 5.3 1.0 3.220152 .............................. 50,485 24,814 7,848 13,178 2,685 516 1,444 100.0 49.2 15.5 26.1 5.3 1.0 2.920162 .............................. 50,625 24,613 7,916 13,382 2,718 511 1,485 100.0 48.6 15.6 26.4 5.4 1.0 2.920172 .............................. 50,710 24,398 7,953 13,574 2,756 506 1,523 100.0 48.1 15.7 26.8 5.4 1.0 3.020182 .............................. 50,759 24,189 7,950 13,778 2,783 502 1,557 100.0 47.7 15.7 27.1 5.5 1.0 3.1
20192 .............................. 50,843 24,064 7,955 13,909 2,825 492 1,598 100.0 47.3 15.6 27.4 5.6 1.0 3.120202 .............................. 50,996 23,951 7,973 14,074 2,865 485 1,648 100.0 47.0 15.6 27.6 5.6 1.0 3.220212 .............................. 51,152 23,840 7,995 14,240 2,902 479 1,696 100.0 46.6 15.6 27.8 5.7 0.9 3.320222 .............................. 51,301 23,737 8,019 14,391 2,939 473 1,743 100.0 46.3 15.6 28.1 5.7 0.9 3.420232 .............................. 51,455 23,655 8,024 14,538 2,981 468 1,789 100.0 46.0 15.6 28.3 5.8 0.9 3.5
20242 .............................. 51,562 23,565 8,001 14,671 3,028 463 1,833 100.0 45.7 15.5 28.5 5.9 0.9 3.620252 .............................. 51,632 23,465 7,962 14,791 3,078 459 1,876 100.0 45.4 15.4 28.6 6.0 0.9 3.620262 .............................. 51,738 23,387 7,917 14,931 3,128 456 1,918 100.0 45.2 15.3 28.9 6.0 0.9 3.7
Northeast1995................................ 7,894 5,497 1,202 878 295 21 — 100.0 69.6 15.2 11.1 3.7 0.3 †2000................................ 8,222 5,545 1,270 1,023 361 24 — 100.0 67.4 15.4 12.4 4.4 0.3 †2004................................ 8,271 5,384 1,292 1,155 414 27 — 100.0 65.1 15.6 14.0 5.0 0.3 †2005................................ 8,240 5,317 1,282 1,189 425 27 — 100.0 64.5 15.6 14.4 5.2 0.3 †2010................................ 8,071 4,876 1,208 1,364 500 27 96 100.0 60.4 15.0 16.9 6.2 0.3 1.22011................................ 7,954 4,745 1,166 1,394 510 27 113 100.0 59.7 14.7 17.5 6.4 0.3 1.42012................................ 7,959 4,665 1,161 1,444 523 27 138 100.0 58.6 14.6 18.1 6.6 0.3 1.72013................................ 7,961 4,593 1,158 1,492 533 28 158 100.0 57.7 14.5 18.7 6.7 0.3 2.02014................................ 7,980 4,507 1,155 1,566 545 28 179 100.0 56.5 14.5 19.6 6.8 0.4 2.2
Midwest1995................................ 10,512 8,335 1,450 438 197 92 — 100.0 79.3 13.8 4.2 1.9 0.9 †2000................................ 10,730 8,208 1,581 610 239 92 — 100.0 76.5 14.7 5.7 2.2 0.9 †2004................................ 10,775 7,983 1,634 793 269 96 — 100.0 74.1 15.2 7.4 2.5 0.9 †2005................................ 10,819 7,950 1,654 836 283 96 — 100.0 73.5 15.3 7.7 2.6 0.9 †2010................................ 10,610 7,327 1,505 1,077 312 94 294 100.0 69.1 14.2 10.2 2.9 0.9 2.82011................................ 10,574 7,240 1,485 1,127 321 90 311 100.0 68.5 14.0 10.7 3.0 0.9 2.92012................................ 10,559 7,175 1,464 1,167 330 89 334 100.0 68.0 13.9 11.1 3.1 0.8 3.22013................................ 10,573 7,111 1,464 1,212 341 87 358 100.0 67.3 13.8 11.5 3.2 0.8 3.42014................................ 10,561 7,037 1,459 1,249 349 86 380 100.0 66.6 13.8 11.8 3.3 0.8 3.6
South1995................................ 16,118 9,565 4,236 1,890 280 148 — 100.0 59.3 26.3 11.7 1.7 0.9 †2000................................ 17,007 9,501 4,516 2,468 352 170 — 100.0 55.9 26.6 14.5 2.1 1.0 †2004................................ 17,892 9,410 4,704 3,155 432 191 — 100.0 52.6 26.3 17.6 2.4 1.1 †2005................................ 18,103 9,381 4,738 3,334 456 194 — 100.0 51.8 26.2 18.4 2.5 1.1 †2010................................ 18,805 8,869 4,545 4,206 555 207 424 100.0 47.2 24.2 22.4 3.0 1.1 2.32011................................ 18,956 8,830 4,535 4,353 577 198 463 100.0 46.6 23.9 23.0 3.0 1.0 2.42012................................ 19,128 8,780 4,545 4,513 595 191 504 100.0 45.9 23.8 23.6 3.1 1.0 2.62013................................ 19,299 8,722 4,561 4,671 614 185 546 100.0 45.2 23.6 24.2 3.2 1.0 2.82014................................ 19,506 8,681 4,577 4,846 640 184 579 100.0 44.5 23.5 24.8 3.3 0.9 3.0
West1995................................ 10,316 5,648 662 2,866 896 244 — 100.0 54.7 6.4 27.8 8.7 2.4 †2000................................ 11,244 5,624 733 3,625 998 264 — 100.0 50.0 6.5 32.2 8.9 2.4 †2004................................ 11,857 5,541 757 4,213 1,069 277 — 100.0 46.7 6.4 35.5 9.0 2.3 †2005................................ 11,951 5,356 771 4,428 1,115 281 — 100.0 44.8 6.5 37.1 9.3 2.4 †2010................................ 11,998 4,861 659 4,792 1,100 237 349 100.0 40.5 5.5 39.9 9.2 2.0 2.92011................................ 12,038 4,787 642 4,886 1,105 233 385 100.0 39.8 5.3 40.6 9.2 1.9 3.22012................................ 12,124 4,766 632 4,978 1,104 227 417 100.0 39.3 5.2 41.1 9.1 1.9 3.42013................................ 12,212 4,733 623 5,077 1,105 224 449 100.0 38.8 5.1 41.6 9.1 1.8 3.72014................................ 12,266 4,698 616 5,144 1,112 221 475 100.0 38.3 5.0 41.9 9.1 1.8 3.9
—Not available.†Not applicable.1For this year, data on students of Two or more races were reported by only a small number ofstates. Therefore, the data are not comparable to figures for 2010 and later years.2Projected.NOTE: Race categories exclude persons of Hispanic ethnicity. Enrollment data for students notreported by race/ethnicity were prorated by state and grade to match state totals. Prior to 2008,
data on students of Two or more races were not collected. Some data have been revised frompreviously published figures. Detail may not sum to totals because of rounding.SOURCE: U.S. Department of Education, National Center for Education Statistics, CommonCore of Data (CCD), “State Nonfiscal Survey of Public Elementary and Secondary Education,”1995–96 through 2014–15; and National Elementary and Secondary Enrollment by Race/Eth-nicity Projection Model, 1972 through 2026. (This table was prepared November 2016.)

This page intentionally left blank.

48 Reference Tables
Table 7. Enrollment and percentage distribution of enrollment in public elementary and secondary schools, by race/ethnicity and level of education: Fall 1999 through fall 2026
Level of education and year
Enrollment (in thousands) Percentage distribution
Total White BlackHis-
panic
Asian/Pacific Islander AmericanIndian/AlaskaNative
Two ormoreraces Total White Black
His-panic
Asian/Pacific Islander AmericanIndian/AlaskaNative
Two ormoreracesTotal Asian
PacificIslander Total Asian
PacificIslander
1 2 3 4 5 6 7 8 9 10 11 12 13 14 15 16 17 18 19
Total1999............................... 46,857 29,035 8,066 7,327 1,887 — — 542 — 100.0 62.0 17.2 15.6 4.0 † † 1.2 †2000............................... 47,204 28,878 8,100 7,726 1,950 — — 550 — 100.0 61.2 17.2 16.4 4.1 † † 1.2 †2001............................... 47,672 28,735 8,177 8,169 2,028 — — 564 — 100.0 60.3 17.2 17.1 4.3 † † 1.2 †2002............................... 48,183 28,618 8,299 8,594 2,088 — — 583 — 100.0 59.4 17.2 17.8 4.3 † † 1.2 †2003............................... 48,540 28,442 8,349 9,011 2,145 — — 593 — 100.0 58.6 17.2 18.6 4.4 † † 1.2 †
2004............................... 48,795 28,318 8,386 9,317 2,183 — — 591 — 100.0 58.0 17.2 19.1 4.5 † † 1.2 †2005............................... 49,113 28,005 8,445 9,787 2,279 — — 598 — 100.0 57.0 17.2 19.9 4.6 † † 1.2 †2006............................... 49,316 27,801 8,422 10,166 2,332 — — 595 — 100.0 56.4 17.1 20.6 4.7 † † 1.2 †2007............................... 49,291 27,454 8,392 10,454 2,396 — — 594 — 100.0 55.7 17.0 21.2 4.9 † † 1.2 †2008............................... 49,266 27,057 8,358 10,563 2,451 2,405 46 589 247 1 100.0 54.9 17.0 21.4 5.0 4.9 0.1 1.2 0.5 1
2009............................... 49,361 26,702 8,245 10,991 2,484 2,435 49 601 338 1 100.0 54.1 16.7 22.3 5.0 4.9 0.1 1.2 0.7 1
2010............................... 49,484 25,933 7,917 11,439 2,466 2,296 171 566 1,164 100.0 52.4 16.0 23.1 5.0 4.6 0.3 1.1 2.42011............................... 49,522 25,602 7,827 11,759 2,513 2,334 179 547 1,272 100.0 51.7 15.8 23.7 5.1 4.7 0.4 1.1 2.62012............................... 49,771 25,386 7,803 12,104 2,552 2,372 180 534 1,393 100.0 51.0 15.7 24.3 5.1 4.8 0.4 1.1 2.82013............................... 50,045 25,160 7,805 12,452 2,593 2,417 176 523 1,511 100.0 50.3 15.6 24.9 5.2 4.8 0.4 1.0 3.0
2014............................... 50,313 24,923 7,807 12,805 2,646 2,470 176 519 1,612 100.0 49.5 15.5 25.4 5.3 4.9 0.3 1.0 3.220152 ............................. 50,485 24,814 7,848 13,178 2,685 2,508 177 516 1,444 100.0 49.2 15.5 26.1 5.3 5.0 0.4 1.0 2.920162 ............................. 50,625 24,613 7,916 13,382 2,718 2,540 178 511 1,485 100.0 48.6 15.6 26.4 5.4 5.0 0.4 1.0 2.920172 ............................. 50,710 24,398 7,953 13,574 2,756 2,578 178 506 1,523 100.0 48.1 15.7 26.8 5.4 5.1 0.4 1.0 3.020182 ............................. 50,759 24,189 7,950 13,778 2,783 2,604 178 502 1,557 100.0 47.7 15.7 27.1 5.5 5.1 0.4 1.0 3.1
20192 ............................. 50,843 24,064 7,955 13,909 2,825 2,648 178 492 1,598 100.0 47.3 15.6 27.4 5.6 5.2 0.3 1.0 3.120202 ............................. 50,996 23,951 7,973 14,074 2,865 2,689 177 485 1,648 100.0 47.0 15.6 27.6 5.6 5.3 0.3 1.0 3.220212 ............................. 51,152 23,840 7,995 14,240 2,902 2,726 175 479 1,696 100.0 46.6 15.6 27.8 5.7 5.3 0.3 0.9 3.320222 ............................. 51,301 23,737 8,019 14,391 2,939 2,764 174 473 1,743 100.0 46.3 15.6 28.1 5.7 5.4 0.3 0.9 3.420232 ............................. 51,455 23,655 8,024 14,538 2,981 2,808 173 468 1,789 100.0 46.0 15.6 28.3 5.8 5.5 0.3 0.9 3.5
20242 ............................. 51,562 23,565 8,001 14,671 3,028 2,856 173 463 1,833 100.0 45.7 15.5 28.5 5.9 5.5 0.3 0.9 3.620252 ............................. 51,632 23,465 7,962 14,791 3,078 2,905 173 459 1,876 100.0 45.4 15.4 28.6 6.0 5.6 0.3 0.9 3.620262 ............................. 51,738 23,387 7,917 14,931 3,128 2,955 173 456 1,918 100.0 45.2 15.3 28.9 6.0 5.7 0.3 0.9 3.7
Prekindergarten through grade 8
1999............................... 33,486 20,327 5,952 5,512 1,303 — — 391 — 100.0 60.7 17.8 16.5 3.9 † † 1.2 †2000............................... 33,686 20,130 5,981 5,830 1,349 — — 397 — 100.0 59.8 17.8 17.3 4.0 † † 1.2 †2001............................... 33,936 19,960 6,004 6,159 1,409 — — 405 — 100.0 58.8 17.7 18.1 4.2 † † 1.2 †2002............................... 34,114 19,764 6,042 6,446 1,447 — — 415 — 100.0 57.9 17.7 18.9 4.2 † † 1.2 †2003............................... 34,201 19,558 6,015 6,729 1,483 — — 415 — 100.0 57.2 17.6 19.7 4.3 † † 1.2 †
2004............................... 34,178 19,368 5,983 6,909 1,504 — — 413 — 100.0 56.7 17.5 20.2 4.4 † † 1.2 †2005............................... 34,204 19,051 5,954 7,216 1,569 — — 412 — 100.0 55.7 17.4 21.1 4.6 † † 1.2 †2006............................... 34,235 18,863 5,882 7,465 1,611 — — 414 — 100.0 55.1 17.2 21.8 4.7 † † 1.2 †2007............................... 34,204 18,679 5,821 7,632 1,660 — — 412 — 100.0 54.6 17.0 22.3 4.9 † † 1.2 †2008............................... 34,286 18,501 5,793 7,689 1,705 1,674 31 410 187 1 100.0 54.0 16.9 22.4 5.0 4.9 0.1 1.2 0.5 1
2009............................... 34,409 18,316 5,713 7,977 1,730 1,697 33 419 254 1 100.0 53.2 16.6 23.2 5.0 4.9 0.1 1.2 0.7 1
2010............................... 34,625 17,823 5,495 8,314 1,711 1,589 122 394 887 100.0 51.5 15.9 24.0 4.9 4.6 0.4 1.1 2.62011............................... 34,773 17,654 5,470 8,558 1,744 1,616 128 384 963 100.0 50.8 15.7 24.6 5.0 4.6 0.4 1.1 2.82012............................... 35,018 17,535 5,473 8,804 1,773 1,644 129 375 1,057 100.0 50.1 15.6 25.1 5.1 4.7 0.4 1.1 3.02013............................... 35,251 17,390 5,483 9,054 1,809 1,683 126 367 1,148 100.0 49.3 15.6 25.7 5.1 4.8 0.4 1.0 3.3
2014............................... 35,370 17,193 5,471 9,273 1,842 1,718 124 363 1,227 100.0 48.6 15.5 26.2 5.2 4.9 0.4 1.0 3.520152 ............................. 35,414 17,079 5,434 9,579 1,869 1,745 125 361 1,092 100.0 48.2 15.3 27.0 5.3 4.9 0.4 1.0 3.120162 ............................. 35,514 16,934 5,453 9,757 1,890 1,766 124 356 1,124 100.0 47.7 15.4 27.5 5.3 5.0 0.4 1.0 3.220172 ............................. 35,562 16,778 5,470 9,905 1,904 1,780 124 351 1,153 100.0 47.2 15.4 27.9 5.4 5.0 0.3 1.0 3.220182 ............................. 35,593 16,637 5,482 10,036 1,912 1,789 123 348 1,180 100.0 46.7 15.4 28.2 5.4 5.0 0.3 1.0 3.3
20192 ............................. 35,657 16,586 5,469 10,117 1,939 1,818 121 340 1,207 100.0 46.5 15.3 28.4 5.4 5.1 0.3 1.0 3.420202 ............................. 35,667 16,507 5,431 10,187 1,967 1,847 120 334 1,241 100.0 46.3 15.2 28.6 5.5 5.2 0.3 0.9 3.520212 ............................. 35,639 16,421 5,374 10,245 1,997 1,878 119 329 1,274 100.0 46.1 15.1 28.7 5.6 5.3 0.3 0.9 3.620222 ............................. 35,660 16,362 5,313 10,328 2,028 1,910 118 324 1,304 100.0 45.9 14.9 29.0 5.7 5.4 0.3 0.9 3.720232 ............................. 35,815 16,369 5,324 10,394 2,072 1,954 119 322 1,334 100.0 45.7 14.9 29.0 5.8 5.5 0.3 0.9 3.7
20242 ............................. 35,982 16,382 5,343 10,456 2,114 1,995 119 320 1,367 100.0 45.5 14.8 29.1 5.9 5.5 0.3 0.9 3.820252 ............................. 36,156 16,394 5,363 10,524 2,156 2,037 119 318 1,401 100.0 45.3 14.8 29.1 6.0 5.6 0.3 0.9 3.920262 ............................. 36,362 16,408 5,385 10,614 2,200 2,081 119 317 1,438 100.0 45.1 14.8 29.2 6.1 5.7 0.3 0.9 4.0
See notes at end of table.

Projections of Education Statistics to 2026 49
Grades 9 through 121999............................... 13,371 8,708 2,114 1,815 584 — — 151 — 100.0 65.1 15.8 13.6 4.4 † † 1.1 †2000............................... 13,517 8,747 2,119 1,896 601 — — 153 — 100.0 64.7 15.7 14.0 4.4 † † 1.1 †2001............................... 13,736 8,774 2,173 2,011 619 — — 159 — 100.0 63.9 15.8 14.6 4.5 † † 1.2 †2002............................... 14,069 8,854 2,257 2,148 642 — — 168 — 100.0 62.9 16.0 15.3 4.6 † † 1.2 †2003............................... 14,339 8,884 2,334 2,282 663 — — 177 — 100.0 62.0 16.3 15.9 4.6 † † 1.2 †
2004............................... 14,618 8,950 2,403 2,408 679 — — 178 — 100.0 61.2 16.4 16.5 4.6 † † 1.2 †2005............................... 14,909 8,954 2,490 2,570 709 — — 186 — 100.0 60.1 16.7 17.2 4.8 † † 1.2 †2006............................... 15,081 8,938 2,540 2,701 720 — — 181 — 100.0 59.3 16.8 17.9 4.8 † † 1.2 †2007............................... 15,086 8,775 2,571 2,821 736 — — 183 — 100.0 58.2 17.0 18.7 4.9 † † 1.2 †2008............................... 14,980 8,556 2,565 2,874 746 731 15 179 59 1 100.0 57.1 17.1 19.2 5.0 4.9 0.1 1.2 0.4 1
2009............................... 14,952 8,385 2,532 3,014 754 738 16 182 84 1 100.0 56.1 16.9 20.2 5.0 4.9 0.1 1.2 0.6 1
2010............................... 14,860 8,109 2,422 3,125 755 707 49 171 277 100.0 54.6 16.3 21.0 5.1 4.8 0.3 1.2 1.92011............................... 14,749 7,948 2,357 3,202 769 719 50 163 309 100.0 53.9 16.0 21.7 5.2 4.9 0.3 1.1 2.12012............................... 14,753 7,851 2,330 3,300 779 727 51 158 335 100.0 53.2 15.8 22.4 5.3 4.9 0.3 1.1 2.32013............................... 14,794 7,770 2,322 3,398 784 733 51 156 363 100.0 52.5 15.7 23.0 5.3 5.0 0.3 1.1 2.5
2014............................... 14,943 7,730 2,336 3,532 804 753 52 156 385 100.0 51.7 15.6 23.6 5.4 5.0 0.3 1.0 2.620152 ............................. 15,070 7,735 2,414 3,599 816 763 53 156 351 100.0 51.3 16.0 23.9 5.4 5.1 0.4 1.0 2.320162 ............................. 15,111 7,678 2,463 3,625 828 774 54 155 362 100.0 50.8 16.3 24.0 5.5 5.1 0.4 1.0 2.420172 ............................. 15,148 7,621 2,483 3,669 852 797 54 154 369 100.0 50.3 16.4 24.2 5.6 5.3 0.4 1.0 2.420182 ............................. 15,166 7,553 2,469 3,742 870 815 55 154 378 100.0 49.8 16.3 24.7 5.7 5.4 0.4 1.0 2.5
20192 ............................. 15,186 7,478 2,486 3,792 886 829 57 152 391 100.0 49.2 16.4 25.0 5.8 5.5 0.4 1.0 2.620202 ............................. 15,329 7,444 2,542 3,887 898 842 57 151 406 100.0 48.6 16.6 25.4 5.9 5.5 0.4 1.0 2.720212 ............................. 15,513 7,420 2,621 3,995 905 848 57 150 422 100.0 47.8 16.9 25.8 5.8 5.5 0.4 1.0 2.720222 ............................. 15,641 7,375 2,706 4,062 910 854 56 148 439 100.0 47.2 17.3 26.0 5.8 5.5 0.4 0.9 2.820232 ............................. 15,640 7,286 2,700 4,144 909 854 55 146 455 100.0 46.6 17.3 26.5 5.8 5.5 0.3 0.9 2.9
20242 ............................. 15,579 7,183 2,658 4,215 915 860 54 144 466 100.0 46.1 17.1 27.1 5.9 5.5 0.3 0.9 3.020252 ............................. 15,476 7,071 2,600 4,267 922 868 54 141 475 100.0 45.7 16.8 27.6 6.0 5.6 0.3 0.9 3.120262 ............................. 15,376 6,979 2,532 4,318 928 874 54 139 480 100.0 45.4 16.5 28.1 6.0 5.7 0.4 0.9 3.1
Table 7. Enrollment and percentage distribution of enrollment in public elementary and secondary schools, by race/ethnicity and level of education: Fall 1999 through fall 2026—Continued
Level of education and year
Enrollment (in thousands) Percentage distribution
Total White BlackHis-
panic
Asian/Pacific Islander AmericanIndian/AlaskaNative
Two ormoreraces Total White Black
His-panic
Asian/Pacific Islander AmericanIndian/AlaskaNative
Two ormoreracesTotal Asian
PacificIslander Total Asian
PacificIslander
1 2 3 4 5 6 7 8 9 10 11 12 13 14 15 16 17 18 19
—Not available.†Not applicable.1For this year, data on students of Two or more races were reported by only a small numberof states. Therefore, the data are not comparable to figures for 2010 and later years.2Projected.NOTE: Race categories exclude persons of Hispanic ethnicity. Enrollment data for studentsnot reported by race/ethnicity were prorated by state and grade to match state totals. Priorto 2008, data on students of Two or more races were not collected. Total counts of
ungraded students were prorated to prekindergarten through grade 8 and grades 9 through12 based on prior reports. Some data have been revised from previously published figures.Detail may not sum to totals because of rounding.SOURCE: U.S. Department of Education, National Center for Education Statistics, Com-mon Core of Data (CCD), “State Nonfiscal Survey of Public Elementary and SecondaryEducation,” 1998–99 through 2014–15; and National Elementary and Secondary Enroll-ment by Race/Ethnicity Projection Model, 1972 through 2026. (This table was preparedNovember 2016.)
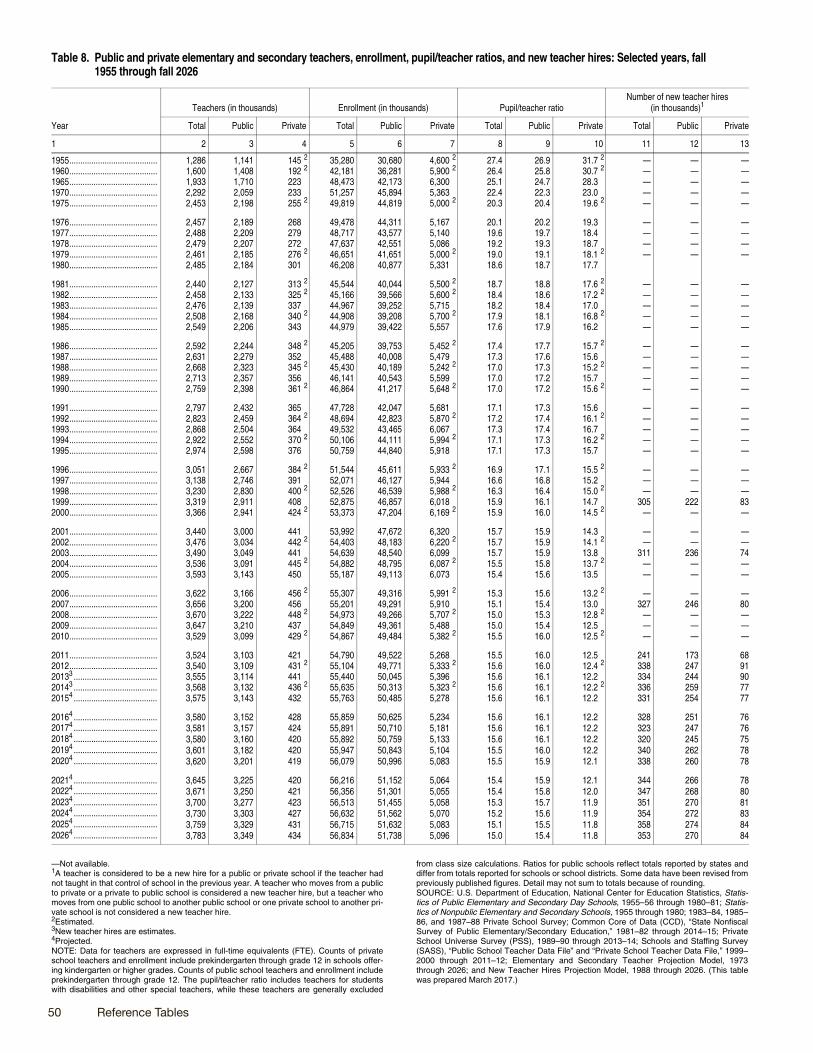
50 Reference Tables
Table 8. Public and private elementary and secondary teachers, enrollment, pupil/teacher ratios, and new teacher hires: Selected years, fall 1955 through fall 2026
Year
Teachers (in thousands) Enrollment (in thousands) Pupil/teacher ratioNumber of new teacher hires
(in thousands)1
Total Public Private Total Public Private Total Public Private Total Public Private
1 2 3 4 5 6 7 8 9 10 11 12 13
1955........................................ 1,286 1,141 145 2 35,280 30,680 4,600 2 27.4 26.9 31.7 2 — — —1960........................................ 1,600 1,408 192 2 42,181 36,281 5,900 2 26.4 25.8 30.7 2 — — —1965........................................ 1,933 1,710 223 48,473 42,173 6,300 25.1 24.7 28.3 — — —1970........................................ 2,292 2,059 233 51,257 45,894 5,363 22.4 22.3 23.0 — — —1975........................................ 2,453 2,198 255 2 49,819 44,819 5,000 2 20.3 20.4 19.6 2 — — —
1976........................................ 2,457 2,189 268 49,478 44,311 5,167 20.1 20.2 19.3 — — —1977........................................ 2,488 2,209 279 48,717 43,577 5,140 19.6 19.7 18.4 — — —1978........................................ 2,479 2,207 272 47,637 42,551 5,086 19.2 19.3 18.7 — — —1979........................................ 2,461 2,185 276 2 46,651 41,651 5,000 2 19.0 19.1 18.1 2 — — —1980........................................ 2,485 2,184 301 46,208 40,877 5,331 18.6 18.7 17.7
1981........................................ 2,440 2,127 313 2 45,544 40,044 5,500 2 18.7 18.8 17.6 2 — — —1982........................................ 2,458 2,133 325 2 45,166 39,566 5,600 2 18.4 18.6 17.2 2 — — —1983........................................ 2,476 2,139 337 44,967 39,252 5,715 18.2 18.4 17.0 — — —1984........................................ 2,508 2,168 340 2 44,908 39,208 5,700 2 17.9 18.1 16.8 2 — — —1985........................................ 2,549 2,206 343 44,979 39,422 5,557 17.6 17.9 16.2 — — —
1986........................................ 2,592 2,244 348 2 45,205 39,753 5,452 2 17.4 17.7 15.7 2 — — —1987........................................ 2,631 2,279 352 45,488 40,008 5,479 17.3 17.6 15.6 — — —1988........................................ 2,668 2,323 345 2 45,430 40,189 5,242 2 17.0 17.3 15.2 2 — — —1989........................................ 2,713 2,357 356 46,141 40,543 5,599 17.0 17.2 15.7 — — —1990........................................ 2,759 2,398 361 2 46,864 41,217 5,648 2 17.0 17.2 15.6 2 — — —
1991........................................ 2,797 2,432 365 47,728 42,047 5,681 17.1 17.3 15.6 — — —1992........................................ 2,823 2,459 364 2 48,694 42,823 5,870 2 17.2 17.4 16.1 2 — — —1993........................................ 2,868 2,504 364 49,532 43,465 6,067 17.3 17.4 16.7 — — —1994........................................ 2,922 2,552 370 2 50,106 44,111 5,994 2 17.1 17.3 16.2 2 — — —1995........................................ 2,974 2,598 376 50,759 44,840 5,918 17.1 17.3 15.7 — — —
1996........................................ 3,051 2,667 384 2 51,544 45,611 5,933 2 16.9 17.1 15.5 2 — — —1997........................................ 3,138 2,746 391 52,071 46,127 5,944 16.6 16.8 15.2 — — —1998........................................ 3,230 2,830 400 2 52,526 46,539 5,988 2 16.3 16.4 15.0 2 — — —1999........................................ 3,319 2,911 408 52,875 46,857 6,018 15.9 16.1 14.7 305 222 832000........................................ 3,366 2,941 424 2 53,373 47,204 6,169 2 15.9 16.0 14.5 2 — — —
2001........................................ 3,440 3,000 441 53,992 47,672 6,320 15.7 15.9 14.3 — — —2002........................................ 3,476 3,034 442 2 54,403 48,183 6,220 2 15.7 15.9 14.1 2 — — —2003........................................ 3,490 3,049 441 54,639 48,540 6,099 15.7 15.9 13.8 311 236 742004........................................ 3,536 3,091 445 2 54,882 48,795 6,087 2 15.5 15.8 13.7 2 — — —2005........................................ 3,593 3,143 450 55,187 49,113 6,073 15.4 15.6 13.5 — — —
2006........................................ 3,622 3,166 456 2 55,307 49,316 5,991 2 15.3 15.6 13.2 2 — — —2007........................................ 3,656 3,200 456 55,201 49,291 5,910 15.1 15.4 13.0 327 246 802008........................................ 3,670 3,222 448 2 54,973 49,266 5,707 2 15.0 15.3 12.8 2 — — —2009........................................ 3,647 3,210 437 54,849 49,361 5,488 15.0 15.4 12.5 — — —2010........................................ 3,529 3,099 429 2 54,867 49,484 5,382 2 15.5 16.0 12.5 2 — — —
2011........................................ 3,524 3,103 421 54,790 49,522 5,268 15.5 16.0 12.5 241 173 682012........................................ 3,540 3,109 431 2 55,104 49,771 5,333 2 15.6 16.0 12.4 2 338 247 9120133 ...................................... 3,555 3,114 441 55,440 50,045 5,396 15.6 16.1 12.2 334 244 9020143 ...................................... 3,568 3,132 436 2 55,635 50,313 5,323 2 15.6 16.1 12.2 2 336 259 7720154 ...................................... 3,575 3,143 432 55,763 50,485 5,278 15.6 16.1 12.2 331 254 77
20164 ...................................... 3,580 3,152 428 55,859 50,625 5,234 15.6 16.1 12.2 328 251 7620174 ...................................... 3,581 3,157 424 55,891 50,710 5,181 15.6 16.1 12.2 323 247 7620184 ...................................... 3,580 3,160 420 55,892 50,759 5,133 15.6 16.1 12.2 320 245 7520194 ...................................... 3,601 3,182 420 55,947 50,843 5,104 15.5 16.0 12.2 340 262 7820204 ...................................... 3,620 3,201 419 56,079 50,996 5,083 15.5 15.9 12.1 338 260 78
20214 ...................................... 3,645 3,225 420 56,216 51,152 5,064 15.4 15.9 12.1 344 266 7820224 ...................................... 3,671 3,250 421 56,356 51,301 5,055 15.4 15.8 12.0 347 268 8020234 ...................................... 3,700 3,277 423 56,513 51,455 5,058 15.3 15.7 11.9 351 270 8120244 ...................................... 3,730 3,303 427 56,632 51,562 5,070 15.2 15.6 11.9 354 272 8320254 ...................................... 3,759 3,329 431 56,715 51,632 5,083 15.1 15.5 11.8 358 274 8420264 ...................................... 3,783 3,349 434 56,834 51,738 5,096 15.0 15.4 11.8 353 270 84
—Not available.1A teacher is considered to be a new hire for a public or private school if the teacher hadnot taught in that control of school in the previous year. A teacher who moves from a publicto private or a private to public school is considered a new teacher hire, but a teacher whomoves from one public school to another public school or one private school to another pri-vate school is not considered a new teacher hire. 2Estimated. 3New teacher hires are estimates. 4Projected. NOTE: Data for teachers are expressed in full-time equivalents (FTE). Counts of privateschool teachers and enrollment include prekindergarten through grade 12 in schools offer-ing kindergarten or higher grades. Counts of public school teachers and enrollment includeprekindergarten through grade 12. The pupil/teacher ratio includes teachers for studentswith disabilities and other special teachers, while these teachers are generally excluded
from class size calculations. Ratios for public schools reflect totals reported by states anddiffer from totals reported for schools or school districts. Some data have been revised frompreviously published figures. Detail may not sum to totals because of rounding.SOURCE: U.S. Department of Education, National Center for Education Statistics, Statis-tics of Public Elementary and Secondary Day Schools, 1955–56 through 1980–81; Statis-tics of Nonpublic Elementary and Secondary Schools, 1955 through 1980; 1983–84, 1985–86, and 1987–88 Private School Survey; Common Core of Data (CCD), “State NonfiscalSurvey of Public Elementary/Secondary Education,” 1981–82 through 2014–15; PrivateSchool Universe Survey (PSS), 1989–90 through 2013–14; Schools and Staffing Survey(SASS), “Public School Teacher Data File” and “Private School Teacher Data File,” 1999–2000 through 2011–12; Elementary and Secondary Teacher Projection Model, 1973through 2026; and New Teacher Hires Projection Model, 1988 through 2026. (This tablewas prepared March 2017.)

Projections of Education Statistics to 2026 51
Table 9. High school graduates, by sex and control of school: Selected years, 1869–70 through 2026–27
School year
High school graduates Averagedfreshman
graduationrate for
publicschools3
Population17 years old4
Graduates asa ratio of 17-
year-oldpopulationTotal1
Sex Control
Males Females
Public2
Private, totalTotal Males Females
1 2 3 4 5 6 7 8 9 10 11
1869–70................................................ 16,000 7,064 8,936 — — — — — 815,000 2.01879–80................................................ 23,634 10,605 13,029 — — — — — 946,026 2.51889–90................................................ 43,731 18,549 25,182 21,882 — — 21,849 5 — 1,259,177 3.51899–1900............................................ 94,883 38,075 56,808 61,737 — — 33,146 5 — 1,489,146 6.41909–10................................................ 156,429 63,676 92,753 111,363 — — 45,066 5 — 1,786,240 8.81919–20................................................ 311,266 123,684 187,582 230,902 — — 80,364 5 — 1,855,173 16.8
1929–30................................................ 666,904 300,376 366,528 591,719 — — 75,185 5 — 2,295,822 29.01939–40................................................ 1,221,475 578,718 642,757 1,143,246 538,273 604,973 78,229 5 — 2,403,074 50.81949–50................................................ 1,199,700 570,700 629,000 1,063,444 505,394 558,050 136,256 5 — 2,034,450 59.01959–60................................................ 1,858,023 895,000 963,000 1,627,050 791,426 835,624 230,973 — 2,672,000 69.51969–70................................................ 2,888,639 1,430,000 1,459,000 2,588,639 1,285,895 1,302,744 300,000 5 78.7 3,757,000 76.91975–76................................................ 3,142,120 1,552,000 1,590,000 2,837,129 1,401,064 1,436,065 304,991 74.9 4,272,000 73.6
1979–80................................................ 3,042,214 1,503,000 1,539,000 2,747,678 — — 294,536 71.5 4,262,000 71.41980–81................................................ 3,020,285 1,492,000 1,528,000 2,725,285 — — 295,000 5 72.2 4,212,000 71.71981–82................................................ 2,994,758 1,479,000 1,515,000 2,704,758 — — 290,000 5 72.9 4,134,000 72.41982–83................................................ 2,887,604 1,426,000 1,461,000 2,597,604 — — 290,000 5 73.8 3,962,000 72.91983–84................................................ 2,766,797 — — 2,494,797 — — 272,000 5 74.5 3,784,000 73.1
1984–85................................................ 2,676,917 — — 2,413,917 — — 263,000 5 74.2 3,699,000 72.41985–86................................................ 2,642,616 — — 2,382,616 — — 260,000 5 74.3 3,670,000 72.01986–87................................................ 2,693,803 — — 2,428,803 — — 265,000 5 74.3 3,754,000 71.81987–88................................................ 2,773,020 — — 2,500,020 — — 273,000 5 74.2 3,849,000 72.01988–89................................................ 2,743,743 — — 2,458,800 — — 284,943 73.4 3,842,000 71.4
1989–906 .............................................. 2,574,162 — — 2,320,337 — — 253,825 7 73.6 3,505,000 73.41990–91................................................ 2,492,988 — — 2,234,893 — — 258,095 73.7 3,417,913 72.91991–92................................................ 2,480,399 — — 2,226,016 — — 254,383 7 74.2 3,398,884 73.01992–93................................................ 2,480,519 — — 2,233,241 — — 247,278 73.8 3,449,143 71.91993–94................................................ 2,463,849 — — 2,220,849 — — 243,000 5 73.1 3,442,521 71.6
1994–95................................................ 2,519,084 — — 2,273,541 — — 245,543 71.8 3,635,803 69.31995–96................................................ 2,518,109 — — 2,273,109 — — 245,000 5 71.0 3,640,132 69.21996–97................................................ 2,611,988 — — 2,358,403 — — 253,585 71.3 3,792,207 68.91997–98................................................ 2,704,050 — — 2,439,050 1,187,647 1,251,403 265,000 5 71.3 4,008,416 67.51998–99................................................ 2,758,655 — — 2,485,630 1,212,924 1,272,706 273,025 71.1 3,917,885 70.4
1999–2000............................................ 2,832,844 — — 2,553,844 1,241,631 1,312,213 279,000 5 71.7 4,056,639 69.82000–01................................................ 2,847,973 — — 2,569,200 1,251,931 1,317,269 278,773 71.7 4,023,686 70.82001–02................................................ 2,906,534 — — 2,621,534 1,275,813 1,345,721 285,000 5 72.6 4,023,968 72.22002–03................................................ 3,015,735 — — 2,719,947 1,330,973 1,388,974 295,788 73.9 4,125,087 73.12003–046,8............................................ 3,054,438 — — 2,753,438 1,347,800 1,405,638 301,000 5 74.3 4,113,074 74.3
2004–05................................................ 3,106,499 — — 2,799,250 1,369,749 1,429,501 307,249 74.7 4,120,073 75.42005–066 .............................................. 3,122,544 — — 2,815,544 1,376,458 1,439,086 307,000 5 73.4 4,200,554 74.32006–07................................................ 3,199,650 — — 2,893,045 1,414,069 1,478,976 306,605 73.9 4,297,239 74.52007–08................................................ 3,312,337 — — 3,001,337 1,467,180 1,534,157 311,000 5 74.7 4,436,955 74.72008–096 .............................................. 3,347,828 — — 3,039,015 1,490,317 1,548,698 308,813 75.5 4,336,950 77.2
2009–10................................................ 3,439,102 — — 3,128,022 1,542,684 9 1,585,338 9 311,080 5 78.2 4,311,831 79.82010–11................................................ 3,449,940 — — 3,144,100 1,552,981 1,591,113 305,840 79.6 4,368,154 79.02011–12................................................ 3,455,405 — — 3,149,185 1,558,489 1,590,694 306,220 5 80.8 4,294,956 80.52012–13................................................ 3,478,027 — — 3,169,257 1,569,675 1,599,579 308,770 81.9 4,257,599 81.72013–1410 ............................................ 3,479,920 — — 3,168,450 — — 311,480 — 4,187,691 83.1
2014–1510 ............................................ 3,498,350 — — 3,187,000 — — 311,360 — 4,172,212 83.82015–1610 ............................................ 3,538,820 — — 3,225,160 — — 313,660 — — —2016–1710 ............................................ 3,568,400 — — 3,253,730 — — 314,670 — — —2017–1810 ............................................ 3,612,500 — — 3,297,050 — — 315,450 — — —2018–1910 ............................................ 3,606,230 — — 3,299,910 — — 306,330 — — —
2019–2010 ............................................ 3,566,910 — — 3,265,550 — — 301,370 — — —2020–2110 ............................................ 3,589,040 — — 3,287,230 — — 301,810 — — —2021–2210 ............................................ 3,604,150 — — 3,309,540 — — 294,610 — — —2022–2310 ............................................ 3,601,740 — — 3,316,280 — — 285,470 — — —2023–2410 ............................................ 3,664,390 — — 3,386,980 — — 277,410 — — —
2024–2510 ............................................ 3,721,920 — — 3,443,430 — — 278,490 — — —2025–2610 ............................................ 3,701,840 — — 3,424,140 — — 277,700 — — —2026–2710 ............................................ 3,597,370 — — 3,327,500 — — 269,860 — — —
—Not available.1Includes graduates of public and private schools.2Data for 1929–30 and preceding years are from Statistics of Public High Schools and excludegraduates from high schools that failed to report to the Office of Education. Includes estimates forjurisdictions not reporting counts of graduates by sex.3The averaged freshman graduation rate provides an estimate of the percentage of students whoreceive a regular diploma within 4 years of entering ninth grade. The rate uses aggregate studentenrollment data to estimate the size of an incoming freshman class and aggregate counts of thenumber of diplomas awarded 4 years later. Averaged freshman graduation rates in this table arebased on reported totals of enrollment by grade and high school graduates, rather than on detailsreported by race/ethnicity.4Derived from Current Population Reports, Series P-25. For years 1869–70 through 1989–90,17-year-old population is an estimate of the October 17-year-old population based on July data.Data for 1990–91 and later years are October resident population estimates prepared by theCensus Bureau. 5Estimated. 6Includes imputations for nonreporting states. 7Projected by private schools responding to the Private School Universe Survey. 8Includes estimates for public schools in New York and Wisconsin. Without estimates for thesetwo states, the averaged freshman graduation rate for the remaining 48 states and the District ofColumbia is 75.0 percent.
9Includes estimate for Connecticut, which did not report graduates by sex.10Projected by NCES.NOTE: Includes graduates of regular day school programs. Excludes graduates of other pro-grams, when separately reported, and recipients of high school equivalency certificates. Somedata have been revised from previously published figures. Detail may not sum to totals because ofrounding and adjustments to protect student privacy.SOURCE: U.S. Department of Education, National Center for Education Statistics,Annual Report of the Commissioner of Education, 1870 through 1910; Biennial Survey ofEducation in the United States, 1919–20 through 1949–50; Statistics of State SchoolSystems, 1951–52 through 1957–58; Statistics of Public Elementary and SecondarySchool Systems, 1958–59 through 1980–81; Statistics of Nonpublic Elementary andSecondary Schools, 1959 through 1980; Common Core of Data (CCD), “State NonfiscalSurvey of Public Elementary/Secondary Education,” 1981–82 through 2009–10; “StateDropout and Completion Data File,” 2005–06 through 2012–13; Public School Graduatesand Dropouts From the Common Core of Data, 2007–08 and 2008–09; Private SchoolUniverse Survey (PSS), 1989 through 2013; and National High School Graduates Pro-jection Model, 1972–73 through 2026–27. U.S. Department of Commerce, CensusBureau, Population Estimates, retrieved August 11, 2011, from https://www2.census.gov/programs-surveys/popest/datasets/2000-2009/ and Population Estimates, retrievedDecember 18, 2015, from https://www2.census.gov/programs-surveys/popest/datasets/2010-2015/. (This table was prepared May 2017.)
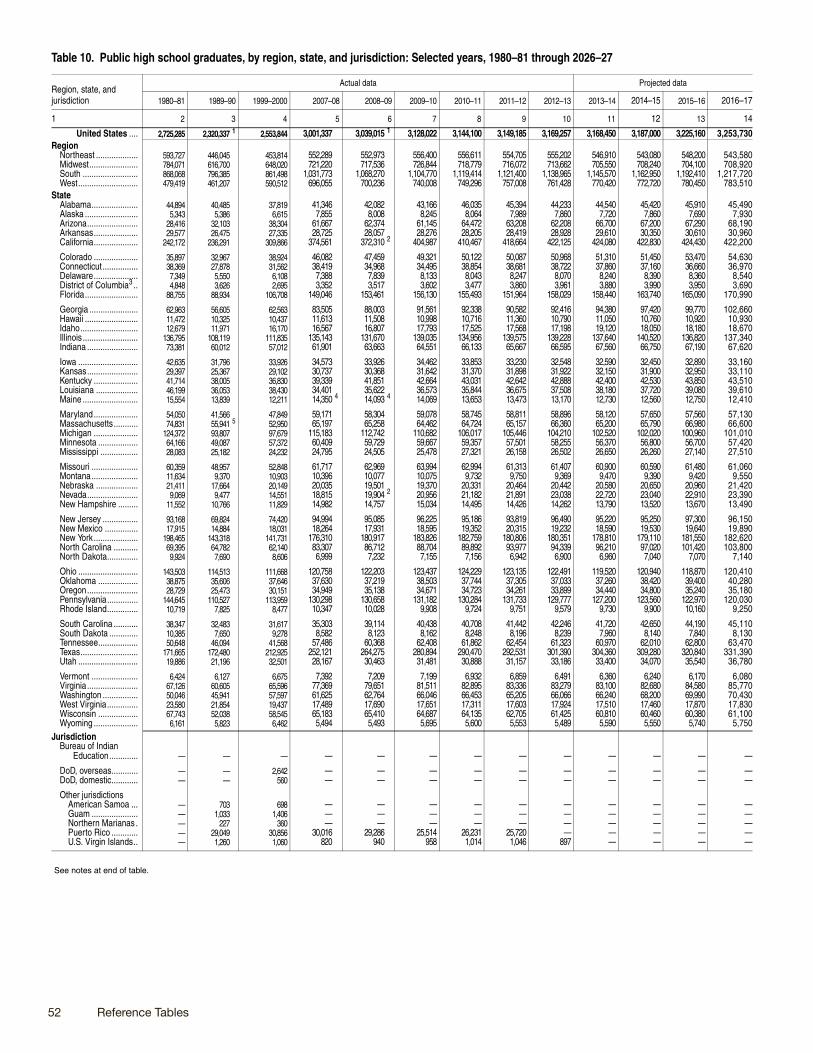
52 Reference Tables
Table 10. Public high school graduates, by region, state, and jurisdiction: Selected years, 1980–81 through 2026–27
Region, state, and jurisdiction
Actual data Projected data
1980–81 1989–90 1999–2000 2007–08 2008–09 2009–10 2010–11 2011–12 2012–13 2013–14 2014–15 2015–16 2016–17
1 2 3 4 5 6 7 8 9 10 11 12 13 14
United States .... 2,725,285 2,320,337 1 2,553,844 3,001,337 3,039,015 1 3,128,022 3,144,100 3,149,185 3,169,257 3,168,450 3,187,000 3,225,160 3,253,730Region
Northeast ................... 593,727 446,045 453,814 552,289 552,973 556,400 556,611 554,705 555,202 546,910 543,080 548,200 543,580Midwest...................... 784,071 616,700 648,020 721,220 717,536 726,844 718,779 716,072 713,662 705,550 708,240 704,100 708,920South ......................... 868,068 796,385 861,498 1,031,773 1,068,270 1,104,770 1,119,414 1,121,400 1,138,965 1,145,570 1,162,950 1,192,410 1,217,720West........................... 479,419 461,207 590,512 696,055 700,236 740,008 749,296 757,008 761,428 770,420 772,720 780,450 783,510
StateAlabama..................... 44,894 40,485 37,819 41,346 42,082 43,166 46,035 45,394 44,233 44,540 45,420 45,910 45,490Alaska ........................ 5,343 5,386 6,615 7,855 8,008 8,245 8,064 7,989 7,860 7,720 7,860 7,690 7,930Arizona....................... 28,416 32,103 38,304 61,667 62,374 61,145 64,472 63,208 62,208 66,700 67,200 67,290 68,190Arkansas.................... 29,577 26,475 27,335 28,725 28,057 28,276 28,205 28,419 28,928 29,610 30,350 30,610 30,960California.................... 242,172 236,291 309,866 374,561 372,310 2 404,987 410,467 418,664 422,125 424,080 422,830 424,430 422,200
Colorado .................... 35,897 32,967 38,924 46,082 47,459 49,321 50,122 50,087 50,968 51,310 51,450 53,470 54,630Connecticut ................ 38,369 27,878 31,562 38,419 34,968 34,495 38,854 38,681 38,722 37,860 37,160 36,660 36,970Delaware.................... 7,349 5,550 6,108 7,388 7,839 8,133 8,043 8,247 8,070 8,240 8,390 8,360 8,540District of Columbia3 .. 4,848 3,626 2,695 3,352 3,517 3,602 3,477 3,860 3,961 3,880 3,990 3,950 3,690Florida........................ 88,755 88,934 106,708 149,046 153,461 156,130 155,493 151,964 158,029 158,440 163,740 165,090 170,990
Georgia ...................... 62,963 56,605 62,563 83,505 88,003 91,561 92,338 90,582 92,416 94,380 97,420 99,770 102,660Hawaii ........................ 11,472 10,325 10,437 11,613 11,508 10,998 10,716 11,360 10,790 11,050 10,760 10,920 10,930Idaho.......................... 12,679 11,971 16,170 16,567 16,807 17,793 17,525 17,568 17,198 19,120 18,050 18,180 18,670Illinois ......................... 136,795 108,119 111,835 135,143 131,670 139,035 134,956 139,575 139,228 137,640 140,520 136,820 137,340Indiana ....................... 73,381 60,012 57,012 61,901 63,663 64,551 66,133 65,667 66,595 67,560 66,750 67,190 67,620
Iowa ........................... 42,635 31,796 33,926 34,573 33,926 34,462 33,853 33,230 32,548 32,590 32,450 32,890 33,160Kansas....................... 29,397 25,367 29,102 30,737 30,368 31,642 31,370 31,898 31,922 32,150 31,900 32,950 33,110Kentucky .................... 41,714 38,005 36,830 39,339 41,851 42,664 43,031 42,642 42,888 42,400 42,530 43,850 43,510Louisiana ................... 46,199 36,053 38,430 34,401 35,622 36,573 35,844 36,675 37,508 38,180 37,720 39,080 39,610Maine ......................... 15,554 13,839 12,211 14,350 4 14,093 4 14,069 13,653 13,473 13,170 12,730 12,560 12,750 12,410
Maryland.................... 54,050 41,566 47,849 59,171 58,304 59,078 58,745 58,811 58,896 58,120 57,650 57,560 57,130Massachusetts........... 74,831 55,941 5 52,950 65,197 65,258 64,462 64,724 65,157 66,360 65,200 65,790 66,980 66,600Michigan .................... 124,372 93,807 97,679 115,183 112,742 110,682 106,017 105,446 104,210 102,520 102,020 100,960 101,010Minnesota .................. 64,166 49,087 57,372 60,409 59,729 59,667 59,357 57,501 58,255 56,370 56,800 56,700 57,420Mississippi ................. 28,083 25,182 24,232 24,795 24,505 25,478 27,321 26,158 26,502 26,650 26,260 27,140 27,510
Missouri ..................... 60,359 48,957 52,848 61,717 62,969 63,994 62,994 61,313 61,407 60,900 60,590 61,480 61,060Montana..................... 11,634 9,370 10,903 10,396 10,077 10,075 9,732 9,750 9,369 9,470 9,390 9,420 9,550Nebraska ................... 21,411 17,664 20,149 20,035 19,501 19,370 20,331 20,464 20,442 20,580 20,650 20,960 21,420Nevada....................... 9,069 9,477 14,551 18,815 19,904 2 20,956 21,182 21,891 23,038 22,720 23,040 22,910 23,390New Hampshire ......... 11,552 10,766 11,829 14,982 14,757 15,034 14,495 14,426 14,262 13,790 13,520 13,670 13,490
New Jersey ................ 93,168 69,824 74,420 94,994 95,085 96,225 95,186 93,819 96,490 95,220 95,250 97,300 96,150New Mexico ............... 17,915 14,884 18,031 18,264 17,931 18,595 19,352 20,315 19,232 18,590 19,530 19,640 19,890New York.................... 198,465 143,318 141,731 176,310 180,917 183,826 182,759 180,806 180,351 178,810 179,110 181,550 182,620North Carolina ........... 69,395 64,782 62,140 83,307 86,712 88,704 89,892 93,977 94,339 96,210 97,020 101,420 103,800North Dakota.............. 9,924 7,690 8,606 6,999 7,232 7,155 7,156 6,942 6,900 6,960 7,040 7,070 7,140
Ohio ........................... 143,503 114,513 111,668 120,758 122,203 123,437 124,229 123,135 122,491 119,520 120,940 118,870 120,410Oklahoma .................. 38,875 35,606 37,646 37,630 37,219 38,503 37,744 37,305 37,033 37,260 38,420 39,400 40,280Oregon....................... 28,729 25,473 30,151 34,949 35,138 34,671 34,723 34,261 33,899 34,440 34,800 35,240 35,180Pennsylvania.............. 144,645 110,527 113,959 130,298 130,658 131,182 130,284 131,733 129,777 127,200 123,560 122,970 120,030Rhode Island.............. 10,719 7,825 8,477 10,347 10,028 9,908 9,724 9,751 9,579 9,730 9,900 10,160 9,250
South Carolina ........... 38,347 32,483 31,617 35,303 39,114 40,438 40,708 41,442 42,246 41,720 42,650 44,190 45,110South Dakota ............. 10,385 7,650 9,278 8,582 8,123 8,162 8,248 8,196 8,239 7,960 8,140 7,840 8,130Tennessee.................. 50,648 46,094 41,568 57,486 60,368 62,408 61,862 62,454 61,323 60,970 62,010 62,800 63,470Texas.......................... 171,665 172,480 212,925 252,121 264,275 280,894 290,470 292,531 301,390 304,360 309,280 320,840 331,390Utah ........................... 19,886 21,196 32,501 28,167 30,463 31,481 30,888 31,157 33,186 33,400 34,070 35,540 36,780
Vermont ..................... 6,424 6,127 6,675 7,392 7,209 7,199 6,932 6,859 6,491 6,360 6,240 6,170 6,080Virginia....................... 67,126 60,605 65,596 77,369 79,651 81,511 82,895 83,336 83,279 83,100 82,680 84,580 85,770Washington ................ 50,046 45,941 57,597 61,625 62,764 66,046 66,453 65,205 66,066 66,240 68,200 69,990 70,430West Virginia.............. 23,580 21,854 19,437 17,489 17,690 17,651 17,311 17,603 17,924 17,510 17,460 17,870 17,830Wisconsin .................. 67,743 52,038 58,545 65,183 65,410 64,687 64,135 62,705 61,425 60,810 60,460 60,380 61,100Wyoming .................... 6,161 5,823 6,462 5,494 5,493 5,695 5,600 5,553 5,489 5,590 5,550 5,740 5,750
JurisdictionBureau of Indian
Education............. — — — — — — — — — — — — —
DoD, overseas............ — — 2,642 — — — — — — — — — —DoD, domestic............ — — 560 — — — — — — — — — —
Other jurisdictionsAmerican Samoa ... — 703 698 — — — — — — — — — —Guam ..................... — 1,033 1,406 — — — — — — — — — —Northern Marianas . — 227 360 — — — — — — — — — —Puerto Rico ............ — 29,049 30,856 30,016 29,286 25,514 26,231 25,720 — — — — —U.S. Virgin Islands.. — 1,260 1,060 820 940 958 1,014 1,046 897 — — — —
See notes at end of table.

Projections of Education Statistics to 2026 53
Table 10. Public high school graduates, by region, state, and jurisdiction: Selected years, 1980–81 through 2026–27—Continued
Region, state, and jurisdiction
Projected data
2017–18 2018–19 2019–20 2020–21 2021–22 2022–23 2023–24 2024–25 2025–26 2026–27
Percent change,2012–13 to
2026–27
1 15 16 17 18 19 20 21 22 23 24 25
United States .... 3,297,050 3,299,910 3,265,550 3,287,230 3,309,540 3,316,280 3,386,980 3,443,430 3,424,140 3,327,500 5.0Region
Northeast ................... 547,690 542,370 535,360 539,600 538,460 533,830 539,470 547,590 542,430 524,270 -5.6Midwest...................... 713,060 715,500 703,240 703,940 714,180 705,660 719,350 727,720 717,890 693,320 -2.9South ......................... 1,247,340 1,255,590 1,242,010 1,246,320 1,252,900 1,265,780 1,297,030 1,340,120 1,342,950 1,311,130 15.1West........................... 788,960 786,440 784,940 797,370 804,000 811,000 831,130 827,990 820,870 798,780 4.9
StateAlabama..................... 45,100 44,400 42,750 41,800 42,060 41,890 42,070 43,330 43,570 42,210 -4.6Alaska ........................ 7,940 7,880 7,650 7,590 7,730 7,950 8,200 8,530 8,620 8,380 6.6Arizona....................... 66,760 67,240 66,550 68,050 69,230 70,780 72,770 75,270 74,870 72,760 17.0Arkansas.................... 30,970 31,010 30,990 30,510 30,510 30,220 30,110 32,190 31,930 30,920 6.9California.................... 426,140 420,520 419,670 425,880 428,690 431,410 442,160 427,290 418,940 406,100 -3.8
Colorado .................... 56,300 57,330 58,000 59,620 59,600 60,030 61,370 62,430 62,890 61,280 20.2Connecticut ................ 36,440 36,090 35,220 35,890 34,910 34,710 34,120 34,500 33,470 32,000 -17.4Delaware.................... 8,780 8,690 8,790 9,190 9,270 9,360 9,670 9,710 9,970 9,690 20.1District of Columbia3 .. 3,820 3,930 3,690 3,810 3,830 4,140 4,390 4,820 4,950 5,070 28.0Florida........................ 173,290 176,060 171,230 172,080 174,950 178,000 183,980 190,880 191,140 187,730 18.8
Georgia ...................... 104,820 106,090 105,030 104,480 105,380 106,740 109,140 112,230 113,150 110,210 19.3Hawaii ........................ 11,060 10,580 11,190 11,290 11,430 11,710 11,740 12,110 12,120 11,830 9.6Idaho.......................... 18,940 19,340 19,330 19,390 19,540 19,660 19,520 19,720 19,460 19,040 10.7Illinois ......................... 138,320 140,550 139,380 140,030 143,440 142,830 143,090 145,890 140,460 134,620 -3.3Indiana ....................... 68,200 69,730 66,680 65,120 66,400 64,530 66,050 66,940 66,590 64,500 -3.1
Iowa ........................... 33,590 33,200 33,210 33,640 33,670 34,060 34,850 35,510 35,590 34,650 6.5Kansas....................... 33,610 33,270 33,050 33,460 33,570 33,670 34,400 35,060 35,040 33,980 6.4Kentucky .................... 44,380 44,830 43,630 44,110 44,470 44,310 45,910 47,620 47,650 46,100 7.5Louisiana ................... 42,120 40,330 40,580 39,740 42,070 38,650 41,010 42,510 42,350 40,980 9.3Maine ......................... 12,340 12,160 11,910 11,810 11,990 11,930 11,790 11,880 11,630 11,180 -15.1
Maryland.................... 58,670 58,010 59,890 60,680 61,270 61,970 63,650 65,760 66,570 64,840 10.1Massachusetts........... 66,880 66,840 66,020 66,500 66,300 65,040 65,810 66,980 66,690 64,000 -3.6Michigan .................... 101,490 100,500 96,670 95,800 97,450 94,330 95,080 94,990 91,460 88,050 -15.5Minnesota .................. 57,950 59,100 58,450 60,020 61,590 61,630 63,290 65,150 64,770 62,740 7.7Mississippi ................. 28,230 27,360 26,710 25,890 26,060 25,800 26,400 27,790 27,070 26,100 -1.5
Missouri ..................... 61,250 60,670 59,780 59,940 60,150 60,300 61,050 62,330 61,850 59,950 -2.4Montana..................... 9,300 9,440 9,520 9,500 9,710 9,690 10,160 10,140 10,400 10,140 8.2Nebraska ................... 22,150 22,400 22,890 23,210 23,760 23,490 24,030 22,820 24,770 23,640 15.7Nevada....................... 23,720 24,200 24,210 24,190 24,550 25,230 25,950 27,260 27,310 26,900 16.8New Hampshire ......... 13,340 13,090 13,040 12,790 12,810 12,440 12,480 12,340 12,090 11,550 -19.0
New Jersey ................ 96,510 96,190 94,850 96,200 96,470 94,960 96,170 97,710 97,050 93,700 -2.9New Mexico ............... 19,520 19,800 19,700 19,520 19,550 19,790 19,990 20,520 20,320 19,480 1.3New York.................... 186,250 183,100 182,090 183,500 182,720 183,440 186,540 190,120 188,960 183,680 1.8North Carolina ........... 108,230 109,450 107,420 107,340 99,670 106,850 109,340 112,790 113,190 109,720 16.3North Dakota.............. 7,080 7,330 7,430 7,800 8,190 8,380 8,980 9,320 9,660 9,700 40.5
Ohio ........................... 120,010 119,850 117,740 116,370 116,520 113,300 118,960 118,500 117,310 113,330 -7.5Oklahoma .................. 40,810 40,700 40,770 41,310 41,600 39,890 42,470 43,550 43,420 42,500 14.7Oregon....................... 35,100 35,090 34,580 35,170 35,460 35,410 36,640 37,710 37,930 37,210 9.8Pennsylvania.............. 120,760 119,150 116,570 117,380 117,520 115,780 117,170 118,410 116,920 113,210 -12.8Rhode Island.............. 9,350 9,960 9,950 9,870 10,060 9,750 9,820 9,900 9,890 9,500 -0.9
South Carolina ........... 46,180 46,340 45,420 45,450 45,900 46,650 48,250 50,770 50,690 49,710 17.7South Dakota ............. 8,180 8,090 8,140 8,360 8,530 8,910 9,080 9,320 9,350 9,110 10.6Tennessee.................. 63,720 63,590 62,630 62,430 62,670 63,530 65,190 66,290 64,780 63,320 3.3Texas.......................... 341,620 348,740 346,410 352,070 356,260 361,470 367,620 379,470 382,770 375,520 24.6Utah ........................... 37,680 38,220 38,890 40,180 40,730 40,800 42,070 43,170 43,290 42,340 27.6
Vermont ..................... 5,810 5,790 5,720 5,670 5,680 5,790 5,570 5,760 5,720 5,460 -15.8Virginia....................... 88,470 88,100 87,990 87,710 89,090 88,710 90,460 92,650 92,160 89,500 7.5Washington ................ 70,640 70,930 69,800 70,800 71,650 72,110 73,980 77,060 77,940 76,700 16.1West Virginia.............. 18,140 17,970 18,070 17,740 17,840 17,620 17,410 17,790 17,630 17,030 -5.0Wisconsin .................. 61,230 60,820 59,810 60,200 60,910 60,230 60,510 61,880 61,050 59,040 -3.9Wyoming .................... 5,870 5,870 5,870 6,190 6,130 6,430 6,580 6,790 6,780 6,630 20.8
JurisdictionBureau of Indian
Education............. — — — — — — — — — — —
DoD, overseas............ — — — — — — — — — — —DoD, domestic............ — — — — — — — — — — —
Other jurisdictionsAmerican Samoa ... — — — — — — — — — — —Guam ..................... — — — — — — — — — — —Northern Marianas . — — — — — — — — — — —Puerto Rico ............ — — — — — — — — — — —U.S. Virgin Islands.. — — — — — — — — — — —
—Not available.1U.S. total includes estimates for nonreporting states.2Estimated high school graduates from NCES 2011-312, Public School Graduates and Drop-outs from the Common Core of Data: School Year 2008–09.3Beginning in 1989–90, graduates from adult programs are excluded.4Includes 1,161 graduates in 2007–08 and 1,169 graduates in 2008–09 from private highschools that received a majority of their funding from public sources.5Projected data from NCES 91-490, Projections of Education Statistics to 2002.NOTE: Data include regular diploma recipients, but exclude students receiving a certificate ofattendance and persons receiving high school equivalency certificates. DoD = Department of
Defense. Some data have been revised from previously published figures. Detail may notsum to totals because of rounding.SOURCE: U.S. Department of Education, National Center for Education Statistics, CommonCore of Data (CCD), “State Nonfiscal Survey of Public Elementary/Secondary Education,”1981–82 through 2005–06; “State Dropout and Completion Data File,” 2005–06 through2012–13; Public School Graduates and Dropouts From the Common Core of Data, 2007–08and 2008–09; and State High School Graduates Projection Model, 1980–81 through 2026–27. (This table was prepared May 2017.)

54 Reference Tables
Table 11. Public high school graduates, by race/ethnicity: 1998–99 through 2026–27
Year
Number of high school graduates Percentage distribution of graduates
Total White Black Hispanic
Asian/Pacific
Islander
AmericanIndian/AlaskaNative
Two ormore races Total White Black Hispanic
Asian/Pacific
Islander
AmericanIndian/AlaskaNative
Two ormore races
1 2 3 4 5 6 7 8 9 10 11 12 13 14 15
1998–99............................. 2,485,630 1,749,561 325,708 270,836 115,216 24,309 — 100.0 70.4 13.1 10.9 4.6 1.0 †1999–2000......................... 2,553,844 1,778,370 338,116 289,139 122,344 25,875 — 100.0 69.6 13.2 11.3 4.8 1.0 †2000–01............................. 2,569,200 1,775,036 339,578 301,740 126,465 26,381 — 100.0 69.1 13.2 11.7 4.9 1.0 †2001–02............................. 2,621,534 1,796,110 348,969 317,197 132,182 27,076 — 100.0 68.5 13.3 12.1 5.0 1.0 †2002–03............................. 2,719,947 1,856,454 359,920 340,182 135,588 27,803 — 100.0 68.3 13.2 12.5 5.0 1.0 †
2003–04............................. 2,753,438 1,829,177 383,443 374,492 137,496 28,830 — 100.0 66.4 13.9 13.6 5.0 1.0 †2004–05............................. 2,799,250 1,855,198 385,987 383,714 143,729 30,622 — 100.0 66.3 13.8 13.7 5.1 1.1 †2005–06............................. 2,815,544 1,838,765 399,406 396,820 150,925 29,628 — 100.0 65.3 14.2 14.1 5.4 1.1 †2006–07............................. 2,893,045 1,868,056 418,113 421,036 154,837 31,003 — 100.0 64.6 14.5 14.6 5.4 1.1 †2007–08............................. 3,001,337 1,898,367 429,840 448,887 159,410 32,036 32,797 1 100.0 63.3 14.3 15.0 5.3 1.1 1.1 1
2008–09............................. 3,039,015 1,883,382 451,384 481,698 163,575 32,213 26,763 1 100.0 62.0 14.9 15.9 5.4 1.1 0.9 1
2009–10............................. 3,128,022 1,871,980 472,261 545,518 167,840 34,131 36,292 1 100.0 59.8 15.1 17.4 5.4 1.1 1.2 1
2010–11............................. 3,144,100 1,835,332 471,461 583,907 168,875 32,768 51,748 100.0 58.4 15.0 18.6 5.4 1.0 1.62011–12............................. 3,149,185 1,807,528 467,932 608,726 173,835 32,450 58,703 100.0 57.4 14.9 19.3 5.5 1.0 1.92012–13............................. 3,169,257 1,791,147 461,919 640,413 179,101 31,100 65,569 100.0 56.5 14.6 20.2 5.7 1.0 2.1
2013–142 ........................... 3,168,450 1,771,700 453,800 657,520 183,010 30,230 72,190 100.0 55.9 14.3 20.8 5.8 1.0 2.32014–152 ........................... 3,187,000 1,753,050 458,850 682,300 186,300 30,100 76,400 100.0 55.0 14.4 21.4 5.8 0.9 2.42015–162 ........................... 3,225,160 1,765,020 483,000 691,180 188,050 30,340 67,560 100.0 54.7 15.0 21.4 5.8 0.9 2.12016–172 ........................... 3,253,730 1,769,620 511,300 687,500 185,460 29,970 69,870 100.0 54.4 15.7 21.1 5.7 0.9 2.12017–182 ........................... 3,297,050 1,771,600 543,540 686,200 194,720 29,020 71,980 100.0 53.7 16.5 20.8 5.9 0.9 2.2
2018–192 ........................... 3,299,910 1,749,570 529,540 721,800 195,970 29,630 73,390 100.0 53.0 16.0 21.9 5.9 0.9 2.22019–202 ........................... 3,265,550 1,718,830 528,590 712,440 199,840 29,890 75,970 100.0 52.6 16.2 21.8 6.1 0.9 2.32020–212 ........................... 3,287,230 1,718,740 529,760 723,120 208,060 29,300 78,250 100.0 52.3 16.1 22.0 6.3 0.9 2.42021–222 ........................... 3,309,540 1,711,660 531,690 744,120 212,500 29,150 80,430 100.0 51.7 16.1 22.5 6.4 0.9 2.42022–232 ........................... 3,316,280 1,687,420 545,590 760,620 211,480 28,560 82,610 100.0 50.9 16.5 22.9 6.4 0.9 2.5
2023–242 ........................... 3,386,980 1,695,180 577,510 787,910 212,340 28,720 85,330 100.0 50.0 17.1 23.3 6.3 0.8 2.52024–252 ........................... 3,443,430 1,702,470 599,190 810,220 215,260 28,530 87,750 100.0 49.4 17.4 23.5 6.3 0.8 2.52025–262 ........................... 3,424,140 1,676,630 607,630 802,500 218,310 28,230 90,850 100.0 49.0 17.7 23.4 6.4 0.8 2.72026–272 ........................... 3,327,500 1,617,250 548,730 830,000 211,420 27,090 93,010 100.0 48.6 16.5 24.9 6.4 0.8 2.8
—Not available.†Not applicable.1Data on students of Two or more races were not reported by all states; therefore, the dataare not comparable to figures for 2010–11 and later years.2Projected.NOTE: Race categories exclude persons of Hispanic ethnicity. Prior to 2007–08, data onstudents of Two or more races were not collected separately. Some data have been revised
from previously published figures. Detail may not sum to totals because of rounding andstatistical methods used to prevent the identification of individual students.SOURCE: U.S. Department of Education, National Center for Education Statistics, Com-mon Core of Data (CCD), “State Nonfiscal Survey of Public Elementary/Secondary Educa-tion,” 1999–2000 through 2005–06; “State Dropout and Completion Data File,” 2005–06through 2012–13; and National Public High School Graduates by Race/Ethnicity ProjectionModel, 1995–96 through 2026–27. (This table was prepared May 2017.)

Projections of Education Statistics to 2026 55
Table 12. Current expenditures and current expenditures per pupil in public elementary and secondary schools: 1989–90 through 2026–27
School year
Current expenditures in unadjusted dollars1 Current expenditures in constant 2015–16 dollars2
Total, in billionsPer pupil in
fall enrollment
Per pupil inaverage daily
attendance(ADA)
Total current expenditures Per pupil in fall enrollmentPer pupil in average
daily attendance (ADA)
In billions
Annualpercentage
change Per pupil enrolled
Annualpercentage
change Per pupil in ADA
Annualpercentage
change
1 2 3 4 5 6 7 8 9 10
1989–90............................. $188.2 $4,643 $4,980 $353.2 3.8 $8,712 2.9 $9,345 2.31990–91............................. 202.0 4,902 5,258 359.5 1.8 8,722 0.1 9,355 0.11991–92............................. 211.2 5,023 5,421 364.1 1.3 8,660 -0.7 9,346 -0.11992–93............................. 220.9 5,160 5,584 369.4 1.4 8,626 -0.4 9,335 -0.11993–94............................. 231.5 5,327 5,767 377.3 2.1 8,681 0.6 9,399 0.7
1994–95............................. 243.9 5,529 5,989 386.4 2.4 8,758 0.9 9,488 0.91995–96............................. 255.1 5,689 6,147 393.4 1.8 8,774 0.2 9,480 -0.11996–97............................. 270.2 5,923 6,393 405.1 3.0 8,882 1.2 9,586 1.11997–98............................. 285.5 6,189 6,676 420.6 3.8 9,118 2.7 9,834 2.61998–99............................. 302.9 6,508 7,013 438.6 4.3 9,424 3.4 10,156 3.3
1999–2000......................... 323.9 6,912 7,394 455.9 3.9 9,729 3.2 10,406 2.52000–01............................. 348.4 7,380 7,904 474.1 4.0 10,043 3.2 10,756 3.42001–02............................. 368.4 7,727 8,259 492.6 3.9 10,333 2.9 11,043 2.72002–03............................. 387.6 8,044 8,610 507.1 3.0 10,525 1.9 11,265 2.02003–04............................. 403.4 8,310 8,900 516.5 1.8 10,641 1.1 11,395 1.2
2004–05............................. 425.0 8,711 9,316 528.3 2.3 10,828 1.8 11,580 1.62005–06............................. 449.1 9,145 9,778 537.8 1.8 10,950 1.1 11,709 1.12006–07............................. 476.8 9,679 10,336 556.6 3.5 11,298 3.2 12,064 3.02007–08............................. 506.9 10,298 10,982 570.5 2.5 11,591 2.6 12,361 2.52008–09............................. 518.9 10,540 11,239 576.0 1.0 11,699 0.9 12,475 0.9
2009–10............................. 524.7 10,636 11,427 576.9 0.1 11,693 -0.1 12,563 0.72010–11............................. 527.3 10,663 11,433 568.3 -1.5 11,492 -1.7 12,322 -1.92011–12............................. 527.2 10,648 11,362 552.0 -2.9 11,149 -3.0 11,897 -3.52012–13............................. 535.8 10,771 11,509 551.8 # 11,093 -0.5 11,854 -0.42013–14............................. 553.5 11,070 11,830 561.3 1.7 11,226 1.2 12,000 1.2
2014–153 ........................... 565.2 11,230 12,020 569.0 1.4 11,310 0.8 12,100 0.82015–163 ........................... 580.3 11,490 12,300 580.3 2.0 11,490 1.6 12,300 1.62016–173 ........................... 599.6 11,840 12,670 588.5 1.4 11,630 1.1 12,430 1.12017–183 ........................... 623.5 12,300 13,150 596.7 1.4 11,770 1.2 12,590 1.22018–193 ........................... 647.9 12,760 13,650 605.5 1.5 11,930 1.4 12,760 1.4
2019–203 ........................... 672.8 13,230 14,150 613.8 1.4 12,070 1.2 12,910 1.22020–213 ........................... 699.1 13,710 14,660 622.4 1.4 12,200 1.1 13,050 1.12021–223 ........................... 726.6 14,200 15,190 631.5 1.5 12,340 1.2 13,200 1.22022–233 ........................... 755.3 14,720 15,750 640.3 1.4 12,480 1.1 13,350 1.12023–243 ........................... 785.2 15,260 16,320 649.2 1.4 12,620 1.1 13,500 1.1
2024–253 ........................... 814.7 15,800 16,900 657.5 1.3 12,750 1.1 13,640 1.12025–263 ........................... 844.1 16,350 17,490 664.8 1.1 12,870 1.0 13,770 1.02026–273 ........................... 865.9 16,740 17,900 669.5 0.7 12,940 0.5 13,840 0.5
#Rounds to zero.1Unadjusted (or “current”) dollars have not been adjusted to compensate for inflation.2Constant dollars based on the Consumer Price Index, prepared by the Bureau of LaborStatistics, U.S. Department of Labor, adjusted to a school-year basis.3Projected.NOTE: Current expenditures include instruction, support services, food services, andenterprise operations. Some data have been revised from previously published figures.
SOURCE: U.S. Department of Education, National Center for Education Statistics, Com-mon Core of Data (CCD), “National Public Education Financial Survey,” 1989–90 through2013–14; National Elementary and Secondary Enrollment Projection Model, 1972 through2026; and Public Elementary and Secondary Education Current Expenditure ProjectionModel, 1973–74 through 2026–27. (This table was prepared March 2017.)

56 Reference Tables
Table 13. Total fall enrollment in degree-granting postsecondary institutions, by attendance status, sex of student, and control of institution: Selected years, 1947 through 2026
YearTotal
enrollment
Attendance status Sex of student Control of institution
Full-time Part-timePercent
part-time Male FemalePercentfemale Public
Private
Total Nonprofit For-profit
1 2 3 4 5 6 7 8 9 10 11 12
19471 ............................... 2,338,226 — — — 1,659,249 678,977 29.0 1,152,377 1,185,849 — —19481 ............................... 2,403,396 — — — 1,709,367 694,029 28.9 1,185,588 1,217,808 — —19491 ............................... 2,444,900 — — — 1,721,572 723,328 29.6 1,207,151 1,237,749 — —19501 ............................... 2,281,298 — — — 1,560,392 720,906 31.6 1,139,699 1,141,599 — —19511 ............................... 2,101,962 — — — 1,390,740 711,222 33.8 1,037,938 1,064,024 — —
19521 ............................... 2,134,242 — — — 1,380,357 753,885 35.3 1,101,240 1,033,002 — —19531 ............................... 2,231,054 — — — 1,422,598 808,456 36.2 1,185,876 1,045,178 — —19541 ............................... 2,446,693 — — — 1,563,382 883,311 36.1 1,353,531 1,093,162 — —19551 ............................... 2,653,034 — — — 1,733,184 919,850 34.7 1,476,282 1,176,752 — —19561 ............................... 2,918,212 — — — 1,911,458 1,006,754 34.5 1,656,402 1,261,810 — —
1957................................. 3,323,783 — — — 2,170,765 1,153,018 34.7 1,972,673 1,351,110 — —1959................................. 3,639,847 2,421,016 1,218,831 2 33.5 2,332,617 1,307,230 35.9 2,180,982 1,458,865 — —1961................................. 4,145,065 2,785,133 1,359,932 2 32.8 2,585,821 1,559,244 37.6 2,561,447 1,583,618 — —1963................................. 4,779,609 3,183,833 1,595,776 2 33.4 2,961,540 1,818,069 38.0 3,081,279 1,698,330 — —1964................................. 5,280,020 3,573,238 1,706,782 2 32.3 3,248,713 2,031,307 38.5 3,467,708 1,812,312 — —
1965................................. 5,920,864 4,095,728 1,825,136 2 30.8 3,630,020 2,290,844 38.7 3,969,596 1,951,268 — —1966................................. 6,389,872 4,438,606 1,951,266 2 30.5 3,856,216 2,533,656 39.7 4,348,917 2,040,955 — —1967................................. 6,911,748 4,793,128 2,118,620 2 30.7 4,132,800 2,778,948 40.2 4,816,028 2,095,720 2,074,041 21,6791968................................. 7,513,091 5,210,155 2,302,936 30.7 4,477,649 3,035,442 40.4 5,430,652 2,082,439 2,061,211 21,2281969................................. 8,004,660 5,498,883 2,505,777 31.3 4,746,201 3,258,459 40.7 5,896,868 2,107,792 2,087,653 20,139
1970................................. 8,580,887 5,816,290 2,764,597 32.2 5,043,642 3,537,245 41.2 6,428,134 2,152,753 2,134,420 18,3331971................................. 8,948,644 6,077,232 2,871,412 32.1 5,207,004 3,741,640 41.8 6,804,309 2,144,335 2,121,913 22,4221972................................. 9,214,860 6,072,389 3,142,471 34.1 5,238,757 3,976,103 43.1 7,070,635 2,144,225 2,123,245 20,9801973................................. 9,602,123 6,189,493 3,412,630 35.5 5,371,052 4,231,071 44.1 7,419,516 2,182,607 2,148,784 33,8231974................................. 10,223,729 6,370,273 3,853,456 37.7 5,622,429 4,601,300 45.0 7,988,500 2,235,229 2,200,963 34,266
1975................................. 11,184,859 6,841,334 4,343,525 38.8 6,148,997 5,035,862 45.0 8,834,508 2,350,351 2,311,448 38,9031976................................. 11,012,137 6,717,058 4,295,079 39.0 5,810,828 5,201,309 47.2 8,653,477 2,358,660 2,314,298 44,3621977................................. 11,285,787 6,792,925 4,492,862 39.8 5,789,016 5,496,771 48.7 8,846,993 2,438,794 2,386,652 52,1421978................................. 11,260,092 6,667,657 4,592,435 40.8 5,640,998 5,619,094 49.9 8,785,893 2,474,199 2,408,331 65,8681979................................. 11,569,899 6,794,039 4,775,860 41.3 5,682,877 5,887,022 50.9 9,036,822 2,533,077 2,461,773 71,304
1980................................. 12,096,895 7,097,958 4,998,937 41.3 5,874,374 6,222,521 51.4 9,457,394 2,639,501 2,527,787 111,714 3
1981................................. 12,371,672 7,181,250 5,190,422 42.0 5,975,056 6,396,616 51.7 9,647,032 2,724,640 2,572,405 152,235 3
1982................................. 12,425,780 7,220,618 5,205,162 41.9 6,031,384 6,394,396 51.5 9,696,087 2,729,693 2,552,739 176,954 3
1983................................. 12,464,661 7,261,050 5,203,611 41.7 6,023,725 6,440,936 51.7 9,682,734 2,781,927 2,589,187 192,7401984................................. 12,241,940 7,098,388 5,143,552 42.0 5,863,574 6,378,366 52.1 9,477,370 2,764,570 2,574,419 190,151
1985................................. 12,247,055 7,075,221 5,171,834 42.2 5,818,450 6,428,605 52.5 9,479,273 2,767,782 2,571,791 195,9911986................................. 12,503,511 7,119,550 5,383,961 43.1 5,884,515 6,618,996 52.9 9,713,893 2,789,618 2,572,479 217,139 4
1987................................. 12,766,642 7,231,085 5,535,557 43.4 5,932,056 6,834,586 53.5 9,973,254 2,793,388 2,602,350 191,038 4
1988................................. 13,055,337 7,436,768 5,618,569 43.0 6,001,896 7,053,441 54.0 10,161,388 2,893,949 2,673,567 220,3821989................................. 13,538,560 7,660,950 5,877,610 43.4 6,190,015 7,348,545 54.3 10,577,963 2,960,597 2,731,174 229,423
1990................................. 13,818,637 7,820,985 5,997,652 43.4 6,283,909 7,534,728 54.5 10,844,717 2,973,920 2,760,227 213,6931991................................. 14,358,953 8,115,329 6,243,624 43.5 6,501,844 7,857,109 54.7 11,309,563 3,049,390 2,819,041 230,3491992................................. 14,487,359 8,162,118 6,325,241 43.7 6,523,989 7,963,370 55.0 11,384,567 3,102,792 2,872,523 230,2691993................................. 14,304,803 8,127,618 6,177,185 43.2 6,427,450 7,877,353 55.1 11,189,088 3,115,715 2,888,897 226,8181994................................. 14,278,790 8,137,776 6,141,014 43.0 6,371,898 7,906,892 55.4 11,133,680 3,145,110 2,910,107 235,003
1995................................. 14,261,781 8,128,802 6,132,979 43.0 6,342,539 7,919,242 55.5 11,092,374 3,169,407 2,929,044 240,3631996................................. 14,367,520 8,302,953 6,064,567 42.2 6,352,825 8,014,695 55.8 11,120,499 3,247,021 2,942,556 304,4651997................................. 14,502,334 8,438,062 6,064,272 41.8 6,396,028 8,106,306 55.9 11,196,119 3,306,215 2,977,614 328,6011998................................. 14,506,967 8,563,338 5,943,629 41.0 6,369,265 8,137,702 56.1 11,137,769 3,369,198 3,004,925 364,2731999................................. 14,849,691 8,803,139 6,046,552 40.7 6,515,164 8,334,527 56.1 11,375,739 3,473,952 3,055,029 418,923
2000................................. 15,312,289 9,009,600 6,302,689 41.2 6,721,769 8,590,520 56.1 11,752,786 3,559,503 3,109,419 450,0842001................................. 15,927,987 9,447,502 6,480,485 40.7 6,960,815 8,967,172 56.3 12,233,156 3,694,831 3,167,330 527,5012002................................. 16,611,711 9,946,359 6,665,352 40.1 7,202,116 9,409,595 56.6 12,751,993 3,859,718 3,265,476 594,2422003................................. 16,911,481 10,326,133 6,585,348 38.9 7,260,264 9,651,217 57.1 12,858,698 4,052,783 3,341,048 711,7352004................................. 17,272,044 10,610,177 6,661,867 38.6 7,387,262 9,884,782 57.2 12,980,112 4,291,932 3,411,685 880,247
2005................................. 17,487,475 10,797,011 6,690,464 38.3 7,455,925 10,031,550 57.4 13,021,834 4,465,641 3,454,692 1,010,9492006................................. 17,758,870 10,957,305 6,801,565 38.3 7,574,815 10,184,055 57.3 13,180,133 4,578,737 3,512,866 1,065,8712007................................. 18,248,128 11,269,892 6,978,236 38.2 7,815,914 10,432,214 57.2 13,490,780 4,757,348 3,571,150 1,186,1982008................................. 19,102,814 11,747,743 7,355,071 38.5 8,188,895 10,913,919 57.1 13,972,153 5,130,661 3,661,519 1,469,1422009................................. 20,313,594 12,605,355 7,708,239 37.9 8,732,953 11,580,641 57.0 14,810,768 5,502,826 3,767,672 1,735,154
2010................................. 21,019,438 13,087,182 7,932,256 37.7 9,045,759 11,973,679 57.0 15,142,171 5,877,267 3,854,482 2,022,7852011................................. 21,010,590 13,002,531 8,008,059 38.1 9,034,256 11,976,334 57.0 15,116,303 5,894,287 3,926,819 1,967,4682012................................. 20,644,478 12,734,404 7,910,074 38.3 8,919,006 11,725,472 56.8 14,884,667 5,759,811 3,951,388 1,808,4232013................................. 20,376,677 12,596,610 7,780,067 38.2 8,861,197 11,515,480 56.5 14,746,848 5,629,829 3,971,390 1,658,4392014................................. 20,207,369 12,453,975 7,753,394 38.2 8,797,061 11,410,308 57.0 14,655,015 5,552,354 3,996,089 1,556,265
See notes at end of table.

Projections of Education Statistics to 2026 57
2015................................. 19,977,270 12,290,829 7,686,441 38.2 8,721,403 11,255,867 57.0 14,568,103 5,409,167 4,063,372 1,345,79520165 ............................... 20,185,000 12,396,000 7,789,000 38.5 8,855,000 11,330,000 57.6 14,844,000 5,341,000 — —20175 ............................... 20,413,000 12,564,000 7,849,000 38.6 8,869,000 11,544,000 57.9 15,003,000 5,410,000 — —20185 ............................... 20,688,000 12,716,000 7,972,000 38.7 8,962,000 11,726,000 58.1 15,206,000 5,481,000 — —20195 ............................... 21,009,000 12,899,000 8,110,000 38.8 9,082,000 11,928,000 58.2 15,443,000 5,566,000 — —
20205 ............................... 21,346,000 13,114,000 8,232,000 38.9 9,212,000 12,135,000 58.4 15,684,000 5,662,000 — —20215 ............................... 21,659,000 13,302,000 8,357,000 39.0 9,331,000 12,328,000 58.5 15,910,000 5,749,000 — —20225 ............................... 21,888,000 13,426,000 8,462,000 39.0 9,415,000 12,473,000 58.7 16,078,000 5,810,000 — —20235 ............................... 22,124,000 13,569,000 8,555,000 39.1 9,499,000 12,625,000 58.8 16,251,000 5,873,000 — —20245 ............................... 22,331,000 13,680,000 8,651,000 39.1 9,574,000 12,757,000 58.8 16,407,000 5,924,000 — —
20255 ............................... 22,504,000 13,750,000 8,754,000 39.1 9,634,000 12,870,000 58.8 16,541,000 5,962,000 — —20265 ............................... 22,631,000 13,797,000 8,835,000 39.1 9,678,000 12,953,000 58.8 16,642,000 5,990,000 — —
Table 13. Total fall enrollment in degree-granting postsecondary institutions, by attendance status, sex of student, and control of institution: Selected years, 1947 through 2026—Continued
YearTotal
enrollment
Attendance status Sex of student Control of institution
Full-time Part-timePercent
part-time Male FemalePercentfemale Public
Private
Total Nonprofit For-profit
1 2 3 4 5 6 7 8 9 10 11 12
—Not available.1Degree-credit enrollment only.2Includes part-time resident students and all extension students (students attending courses atsites separate from the primary reporting campus). In later years, part-time student enrollmentwas collected as a distinct category.3Large increases are due to the addition of schools accredited by the Accrediting Commissionof Career Schools and Colleges of Technology.4Because of imputation techniques, data are not consistent with figures for other years.5Projected.NOTE: Data through 1995 are for institutions of higher education, while later data are for degree-granting institutions. Degree-granting institutions grant associate’s or higher degrees and partici-
pate in Title IV federal financial aid programs. The degree-granting classification is very similar tothe earlier higher education classification, but it includes more 2-year colleges and excludes afew higher education institutions that did not grant degrees. Some data have been revised frompreviously published figures.SOURCE: U.S. Department of Education, National Center for Education Statistics, BiennialSurvey of Education in the United States; Opening Fall Enrollment in Higher Education, 1963through 1965; Higher Education General Information Survey (HEGIS), “Fall Enrollment in Col-leges and Universities” surveys, 1966 through 1985; Integrated Postsecondary Education DataSystem (IPEDS), “Fall Enrollment Survey” (IPEDS-EF:86–99); IPEDS Spring 2001 throughSpring 2016, Fall Enrollment component; and Enrollment in Degree-Granting Institutions Pro-jection Model, 2000 through 2026. (This table was prepared February 2017.)
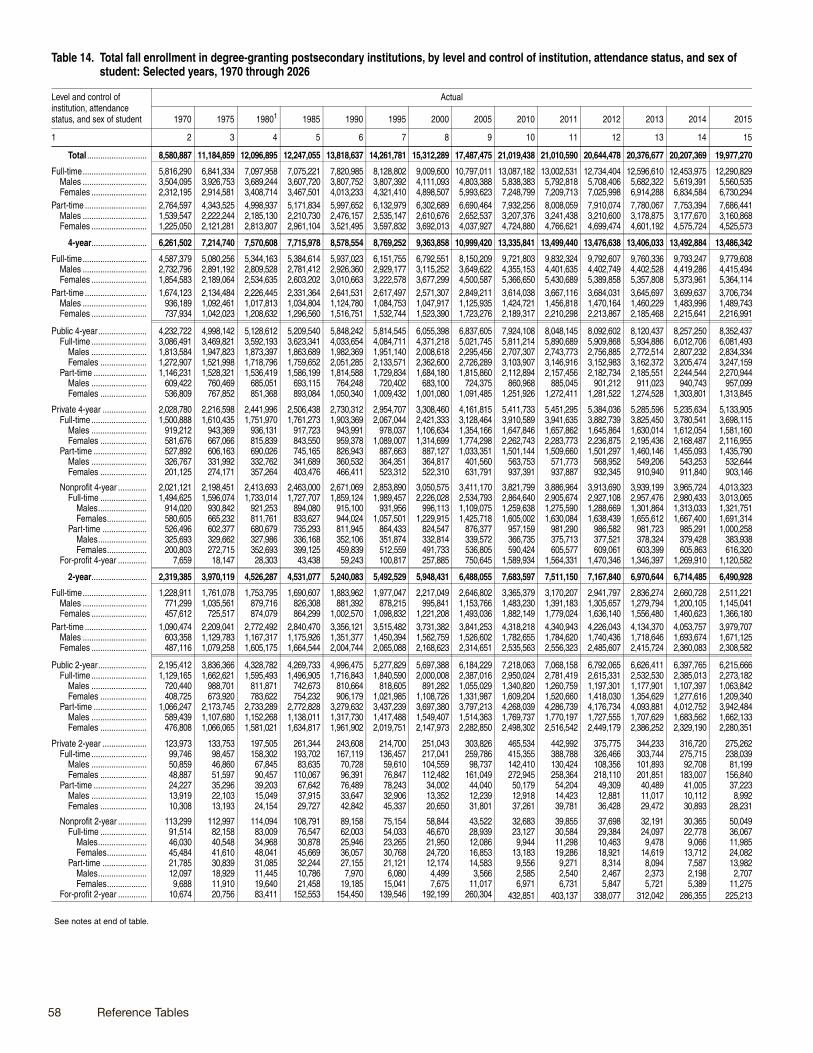
58 Reference Tables
Table 14. Total fall enrollment in degree-granting postsecondary institutions, by level and control of institution, attendance status, and sex of student: Selected years, 1970 through 2026
Level and control of institution, attendance status, and sex of student
Actual
1970 1975 19801 1985 1990 1995 2000 2005 2010 2011 2012 2013 2014 2015
1 2 3 4 5 6 7 8 9 10 11 12 13 14 15
Total ........................... 8,580,887 11,184,859 12,096,895 12,247,055 13,818,637 14,261,781 15,312,289 17,487,475 21,019,438 21,010,590 20,644,478 20,376,677 20,207,369 19,977,270
Full-time............................. 5,816,290 6,841,334 7,097,958 7,075,221 7,820,985 8,128,802 9,009,600 10,797,011 13,087,182 13,002,531 12,734,404 12,596,610 12,453,975 12,290,829Males ............................. 3,504,095 3,926,753 3,689,244 3,607,720 3,807,752 3,807,392 4,111,093 4,803,388 5,838,383 5,792,818 5,708,406 5,682,322 5,619,391 5,560,535Females ......................... 2,312,195 2,914,581 3,408,714 3,467,501 4,013,233 4,321,410 4,898,507 5,993,623 7,248,799 7,209,713 7,025,998 6,914,288 6,834,584 6,730,294
Part-time ............................ 2,764,597 4,343,525 4,998,937 5,171,834 5,997,652 6,132,979 6,302,689 6,690,464 7,932,256 8,008,059 7,910,074 7,780,067 7,753,394 7,686,441Males ............................. 1,539,547 2,222,244 2,185,130 2,210,730 2,476,157 2,535,147 2,610,676 2,652,537 3,207,376 3,241,438 3,210,600 3,178,875 3,177,670 3,160,868Females ......................... 1,225,050 2,121,281 2,813,807 2,961,104 3,521,495 3,597,832 3,692,013 4,037,927 4,724,880 4,766,621 4,699,474 4,601,192 4,575,724 4,525,573
4-year......................... 6,261,502 7,214,740 7,570,608 7,715,978 8,578,554 8,769,252 9,363,858 10,999,420 13,335,841 13,499,440 13,476,638 13,406,033 13,492,884 13,486,342
Full-time............................. 4,587,379 5,080,256 5,344,163 5,384,614 5,937,023 6,151,755 6,792,551 8,150,209 9,721,803 9,832,324 9,792,607 9,760,336 9,793,247 9,779,608Males ............................. 2,732,796 2,891,192 2,809,528 2,781,412 2,926,360 2,929,177 3,115,252 3,649,622 4,355,153 4,401,635 4,402,749 4,402,528 4,419,286 4,415,494Females ......................... 1,854,583 2,189,064 2,534,635 2,603,202 3,010,663 3,222,578 3,677,299 4,500,587 5,366,650 5,430,689 5,389,858 5,357,808 5,373,961 5,364,114
Part-time ............................ 1,674,123 2,134,484 2,226,445 2,331,364 2,641,531 2,617,497 2,571,307 2,849,211 3,614,038 3,667,116 3,684,031 3,645,697 3,699,637 3,706,734Males ............................. 936,189 1,092,461 1,017,813 1,034,804 1,124,780 1,084,753 1,047,917 1,125,935 1,424,721 1,456,818 1,470,164 1,460,229 1,483,996 1,489,743Females ......................... 737,934 1,042,023 1,208,632 1,296,560 1,516,751 1,532,744 1,523,390 1,723,276 2,189,317 2,210,298 2,213,867 2,185,468 2,215,641 2,216,991
Public 4-year...................... 4,232,722 4,998,142 5,128,612 5,209,540 5,848,242 5,814,545 6,055,398 6,837,605 7,924,108 8,048,145 8,092,602 8,120,437 8,257,250 8,352,437Full-time ......................... 3,086,491 3,469,821 3,592,193 3,623,341 4,033,654 4,084,711 4,371,218 5,021,745 5,811,214 5,890,689 5,909,868 5,934,886 6,012,706 6,081,493
Males ......................... 1,813,584 1,947,823 1,873,397 1,863,689 1,982,369 1,951,140 2,008,618 2,295,456 2,707,307 2,743,773 2,756,885 2,772,514 2,807,232 2,834,334Females ..................... 1,272,907 1,521,998 1,718,796 1,759,652 2,051,285 2,133,571 2,362,600 2,726,289 3,103,907 3,146,916 3,152,983 3,162,372 3,205,474 3,247,159
Part-time ........................ 1,146,231 1,528,321 1,536,419 1,586,199 1,814,588 1,729,834 1,684,180 1,815,860 2,112,894 2,157,456 2,182,734 2,185,551 2,244,544 2,270,944Males ......................... 609,422 760,469 685,051 693,115 764,248 720,402 683,100 724,375 860,968 885,045 901,212 911,023 940,743 957,099Females ..................... 536,809 767,852 851,368 893,084 1,050,340 1,009,432 1,001,080 1,091,485 1,251,926 1,272,411 1,281,522 1,274,528 1,303,801 1,313,845
Private 4-year .................... 2,028,780 2,216,598 2,441,996 2,506,438 2,730,312 2,954,707 3,308,460 4,161,815 5,411,733 5,451,295 5,384,036 5,285,596 5,235,634 5,133,905Full-time ......................... 1,500,888 1,610,435 1,751,970 1,761,273 1,903,369 2,067,044 2,421,333 3,128,464 3,910,589 3,941,635 3,882,739 3,825,450 3,780,541 3,698,115
Males ......................... 919,212 943,369 936,131 917,723 943,991 978,037 1,106,634 1,354,166 1,647,846 1,657,862 1,645,864 1,630,014 1,612,054 1,581,160Females ..................... 581,676 667,066 815,839 843,550 959,378 1,089,007 1,314,699 1,774,298 2,262,743 2,283,773 2,236,875 2,195,436 2,168,487 2,116,955
Part-time ........................ 527,892 606,163 690,026 745,165 826,943 887,663 887,127 1,033,351 1,501,144 1,509,660 1,501,297 1,460,146 1,455,093 1,435,790Males ......................... 326,767 331,992 332,762 341,689 360,532 364,351 364,817 401,560 563,753 571,773 568,952 549,206 543,253 532,644Females ..................... 201,125 274,171 357,264 403,476 466,411 523,312 522,310 631,791 937,391 937,887 932,345 910,940 911,840 903,146
Nonprofit 4-year ............. 2,021,121 2,198,451 2,413,693 2,463,000 2,671,069 2,853,890 3,050,575 3,411,170 3,821,799 3,886,964 3,913,690 3,939,199 3,965,724 4,013,323Full-time ..................... 1,494,625 1,596,074 1,733,014 1,727,707 1,859,124 1,989,457 2,226,028 2,534,793 2,864,640 2,905,674 2,927,108 2,957,476 2,980,433 3,013,065
Males...................... 914,020 930,842 921,253 894,080 915,100 931,956 996,113 1,109,075 1,259,638 1,275,590 1,288,669 1,301,864 1,313,033 1,321,751Females.................. 580,605 665,232 811,761 833,627 944,024 1,057,501 1,229,915 1,425,718 1,605,002 1,630,084 1,638,439 1,655,612 1,667,400 1,691,314
Part-time .................... 526,496 602,377 680,679 735,293 811,945 864,433 824,547 876,377 957,159 981,290 986,582 981,723 985,291 1,000,258Males...................... 325,693 329,662 327,986 336,168 352,106 351,874 332,814 339,572 366,735 375,713 377,521 378,324 379,428 383,938Females.................. 200,803 272,715 352,693 399,125 459,839 512,559 491,733 536,805 590,424 605,577 609,061 603,399 605,863 616,320
For-profit 4-year ............. 7,659 18,147 28,303 43,438 59,243 100,817 257,885 750,645 1,589,934 1,564,331 1,470,346 1,346,397 1,269,910 1,120,582
2-year......................... 2,319,385 3,970,119 4,526,287 4,531,077 5,240,083 5,492,529 5,948,431 6,488,055 7,683,597 7,511,150 7,167,840 6,970,644 6,714,485 6,490,928
Full-time............................. 1,228,911 1,761,078 1,753,795 1,690,607 1,883,962 1,977,047 2,217,049 2,646,802 3,365,379 3,170,207 2,941,797 2,836,274 2,660,728 2,511,221Males ............................. 771,299 1,035,561 879,716 826,308 881,392 878,215 995,841 1,153,766 1,483,230 1,391,183 1,305,657 1,279,794 1,200,105 1,145,041Females ......................... 457,612 725,517 874,079 864,299 1,002,570 1,098,832 1,221,208 1,493,036 1,882,149 1,779,024 1,636,140 1,556,480 1,460,623 1,366,180
Part-time ............................ 1,090,474 2,209,041 2,772,492 2,840,470 3,356,121 3,515,482 3,731,382 3,841,253 4,318,218 4,340,943 4,226,043 4,134,370 4,053,757 3,979,707Males ............................. 603,358 1,129,783 1,167,317 1,175,926 1,351,377 1,450,394 1,562,759 1,526,602 1,782,655 1,784,620 1,740,436 1,718,646 1,693,674 1,671,125Females ......................... 487,116 1,079,258 1,605,175 1,664,544 2,004,744 2,065,088 2,168,623 2,314,651 2,535,563 2,556,323 2,485,607 2,415,724 2,360,083 2,308,582
Public 2-year...................... 2,195,412 3,836,366 4,328,782 4,269,733 4,996,475 5,277,829 5,697,388 6,184,229 7,218,063 7,068,158 6,792,065 6,626,411 6,397,765 6,215,666Full-time ......................... 1,129,165 1,662,621 1,595,493 1,496,905 1,716,843 1,840,590 2,000,008 2,387,016 2,950,024 2,781,419 2,615,331 2,532,530 2,385,013 2,273,182
Males ......................... 720,440 988,701 811,871 742,673 810,664 818,605 891,282 1,055,029 1,340,820 1,260,759 1,197,301 1,177,901 1,107,397 1,063,842Females ..................... 408,725 673,920 783,622 754,232 906,179 1,021,985 1,108,726 1,331,987 1,609,204 1,520,660 1,418,030 1,354,629 1,277,616 1,209,340
Part-time ........................ 1,066,247 2,173,745 2,733,289 2,772,828 3,279,632 3,437,239 3,697,380 3,797,213 4,268,039 4,286,739 4,176,734 4,093,881 4,012,752 3,942,484Males ......................... 589,439 1,107,680 1,152,268 1,138,011 1,317,730 1,417,488 1,549,407 1,514,363 1,769,737 1,770,197 1,727,555 1,707,629 1,683,562 1,662,133Females ..................... 476,808 1,066,065 1,581,021 1,634,817 1,961,902 2,019,751 2,147,973 2,282,850 2,498,302 2,516,542 2,449,179 2,386,252 2,329,190 2,280,351
Private 2-year .................... 123,973 133,753 197,505 261,344 243,608 214,700 251,043 303,826 465,534 442,992 375,775 344,233 316,720 275,262Full-time ......................... 99,746 98,457 158,302 193,702 167,119 136,457 217,041 259,786 415,355 388,788 326,466 303,744 275,715 238,039
Males ......................... 50,859 46,860 67,845 83,635 70,728 59,610 104,559 98,737 142,410 130,424 108,356 101,893 92,708 81,199Females ..................... 48,887 51,597 90,457 110,067 96,391 76,847 112,482 161,049 272,945 258,364 218,110 201,851 183,007 156,840
Part-time ........................ 24,227 35,296 39,203 67,642 76,489 78,243 34,002 44,040 50,179 54,204 49,309 40,489 41,005 37,223Males ......................... 13,919 22,103 15,049 37,915 33,647 32,906 13,352 12,239 12,918 14,423 12,881 11,017 10,112 8,992Females ..................... 10,308 13,193 24,154 29,727 42,842 45,337 20,650 31,801 37,261 39,781 36,428 29,472 30,893 28,231
Nonprofit 2-year ............. 113,299 112,997 114,094 108,791 89,158 75,154 58,844 43,522 32,683 39,855 37,698 32,191 30,365 50,049Full-time ..................... 91,514 82,158 83,009 76,547 62,003 54,033 46,670 28,939 23,127 30,584 29,384 24,097 22,778 36,067
Males...................... 46,030 40,548 34,968 30,878 25,946 23,265 21,950 12,086 9,944 11,298 10,463 9,478 9,066 11,985Females.................. 45,484 41,610 48,041 45,669 36,057 30,768 24,720 16,853 13,183 19,286 18,921 14,619 13,712 24,082
Part-time .................... 21,785 30,839 31,085 32,244 27,155 21,121 12,174 14,583 9,556 9,271 8,314 8,094 7,587 13,982Males...................... 12,097 18,929 11,445 10,786 7,970 6,080 4,499 3,566 2,585 2,540 2,467 2,373 2,198 2,707Females.................. 9,688 11,910 19,640 21,458 19,185 15,041 7,675 11,017 6,971 6,731 5,847 5,721 5,389 11,275
For-profit 2-year ............. 10,674 20,756 83,411 152,553 154,450 139,546 192,199 260,304 432,851 403,137 338,077 312,042 286,355 225,213
See notes at end of table.

Projections of Education Statistics to 2026 59
Table 14. Total fall enrollment in degree-granting postsecondary institutions, by level and control of institution, attendance status, and sex of student: Selected years, 1970 through 2026—Continued
Level and control of institution, attendance status, and sex of student
Projected
2016 2017 2018 2019 2020 2021 2022 2023 2024 2015 2026
1 16 17 18 19 20 21 22 23 24 25 26
Total ........................... 20,185,000 20,413,000 20,688,000 21,009,000 21,346,000 21,659,000 21,888,000 22,124,000 22,331,000 22,504,000 22,631,000
Full-time............................. 12,396,000 12,564,000 12,716,000 12,899,000 13,114,000 13,302,000 13,426,000 13,569,000 13,680,000 13,750,000 13,797,000Males ............................. 5,679,000 5,670,000 5,725,000 5,796,000 5,882,000 5,958,000 6,009,000 6,068,000 6,116,000 6,145,000 6,163,000Females ......................... 6,717,000 6,893,000 6,991,000 7,103,000 7,231,000 7,344,000 7,417,000 7,501,000 7,565,000 7,604,000 7,634,000
Part-time ............................ 7,789,000 7,849,000 7,972,000 8,110,000 8,232,000 8,357,000 8,462,000 8,555,000 8,651,000 8,754,000 8,835,000Males ............................. 3,176,000 3,199,000 3,237,000 3,285,000 3,329,000 3,373,000 3,406,000 3,431,000 3,458,000 3,489,000 3,515,000Females ......................... 4,613,000 4,651,000 4,735,000 4,825,000 4,903,000 4,984,000 5,056,000 5,124,000 5,193,000 5,265,000 5,320,000
4-year......................... 13,216,000 13,379,000 13,552,000 13,758,000 13,992,000 14,204,000 14,351,000 14,505,000 14,634,000 14,730,000 14,801,000
Full-time............................. 9,604,000 9,734,000 9,849,000 9,990,000 10,161,000 10,309,000 10,403,000 10,513,000 10,598,000 10,649,000 10,685,000Males ............................. 4,407,000 4,401,000 4,442,000 4,496,000 4,566,000 4,627,000 4,666,000 4,710,000 4,746,000 4,768,000 4,781,000Females ......................... 5,197,000 5,333,000 5,407,000 5,493,000 5,595,000 5,683,000 5,738,000 5,802,000 5,851,000 5,881,000 5,905,000
Part-time ............................ 3,612,000 3,645,000 3,703,000 3,769,000 3,831,000 3,895,000 3,947,000 3,993,000 4,036,000 4,081,000 4,116,000Males ............................. 1,443,000 1,454,000 1,472,000 1,495,000 1,517,000 1,540,000 1,556,000 1,569,000 1,580,000 1,592,000 1,603,000Females ......................... 2,168,000 2,191,000 2,231,000 2,274,000 2,313,000 2,355,000 2,391,000 2,424,000 2,456,000 2,488,000 2,513,000
Public 4-year...................... 8,181,000 8,279,000 8,385,000 8,512,000 8,655,000 8,784,000 8,873,000 8,968,000 9,048,000 9,109,000 9,154,000Full-time ......................... 5,972,000 6,051,000 6,122,000 6,209,000 6,314,000 6,405,000 6,463,000 6,530,000 6,584,000 6,618,000 6,641,000
Males ......................... 2,826,000 2,821,000 2,848,000 2,883,000 2,927,000 2,966,000 2,990,000 3,019,000 3,043,000 3,057,000 3,066,000Females ..................... 3,146,000 3,230,000 3,274,000 3,326,000 3,387,000 3,440,000 3,472,000 3,511,000 3,541,000 3,560,000 3,575,000
Part-time ........................ 2,209,000 2,228,000 2,263,000 2,303,000 2,340,000 2,379,000 2,411,000 2,438,000 2,464,000 2,491,000 2,512,000Males ......................... 925,000 932,000 943,000 958,000 972,000 986,000 997,000 1,005,000 1,012,000 1,020,000 1,027,000Females ..................... 1,283,000 1,296,000 1,320,000 1,345,000 1,368,000 1,393,000 1,414,000 1,433,000 1,452,000 1,471,000 1,486,000
Private 4-year .................... 5,035,000 5,100,000 5,167,000 5,247,000 5,337,000 5,420,000 5,477,000 5,537,000 5,585,000 5,621,000 5,647,000Full-time ......................... 3,632,000 3,683,000 3,727,000 3,781,000 3,847,000 3,904,000 3,941,000 3,982,000 4,013,000 4,031,000 4,044,000
Males ......................... 1,582,000 1,580,000 1,594,000 1,614,000 1,639,000 1,661,000 1,675,000 1,691,000 1,703,000 1,710,000 1,714,000Females ..................... 2,051,000 2,104,000 2,133,000 2,167,000 2,208,000 2,243,000 2,265,000 2,291,000 2,310,000 2,321,000 2,330,000
Part-time ........................ 1,403,000 1,417,000 1,440,000 1,466,000 1,490,000 1,516,000 1,537,000 1,555,000 1,572,000 1,590,000 1,603,000Males ......................... 518,000 522,000 529,000 537,000 545,000 554,000 560,000 564,000 568,000 572,000 576,000Females ..................... 885,000 895,000 911,000 929,000 945,000 962,000 977,000 991,000 1,004,000 1,017,000 1,027,000
Nonprofit 4-year ............. — — — — — — — — — — —Full-time ..................... — — — — — — — — — — —
Males...................... — — — — — — — — — — —Females.................. — — — — — — — — — — —
Part-time .................... — — — — — — — — — — —Males...................... — — — — — — — — — — —Females.................. — — — — — — — — — — —
For-profit 4-year ............. — — — — — — — — — — —
2-year......................... 6,969,000 7,034,000 7,136,000 7,251,000 7,354,000 7,455,000 7,537,000 7,619,000 7,697,000 7,774,000 7,831,000
Full-time............................. 2,792,000 2,829,000 2,867,000 2,909,000 2,952,000 2,992,000 3,023,000 3,057,000 3,083,000 3,101,000 3,111,000Males ............................. 1,272,000 1,269,000 1,284,000 1,300,000 1,316,000 1,331,000 1,343,000 1,358,000 1,369,000 1,378,000 1,382,000Females ......................... 1,521,000 1,560,000 1,583,000 1,609,000 1,636,000 1,661,000 1,679,000 1,699,000 1,714,000 1,723,000 1,729,000
Part-time ............................ 4,177,000 4,204,000 4,269,000 4,342,000 4,401,000 4,463,000 4,515,000 4,562,000 4,614,000 4,673,000 4,719,000Males ............................. 1,733,000 1,745,000 1,765,000 1,790,000 1,812,000 1,833,000 1,849,000 1,862,000 1,878,000 1,896,000 1,912,000Females ......................... 2,444,000 2,460,000 2,504,000 2,551,000 2,590,000 2,629,000 2,665,000 2,700,000 2,737,000 2,777,000 2,807,000
Public 2-year...................... 6,664,000 6,723,000 6,821,000 6,932,000 7,030,000 7,126,000 7,205,000 7,283,000 7,358,000 7,432,000 7,488,000Full-time ......................... 2,527,000 2,560,000 2,594,000 2,632,000 2,671,000 2,707,000 2,735,000 2,765,000 2,789,000 2,805,000 2,815,000
Males ......................... 1,181,000 1,179,000 1,192,000 1,208,000 1,223,000 1,237,000 1,248,000 1,261,000 1,272,000 1,280,000 1,284,000Females ..................... 1,346,000 1,381,000 1,402,000 1,425,000 1,449,000 1,470,000 1,486,000 1,504,000 1,517,000 1,525,000 1,530,000
Part-time ........................ 4,136,000 4,163,000 4,227,000 4,299,000 4,358,000 4,419,000 4,471,000 4,518,000 4,569,000 4,627,000 4,673,000Males ......................... 1,723,000 1,735,000 1,755,000 1,780,000 1,801,000 1,823,000 1,839,000 1,852,000 1,867,000 1,886,000 1,901,000Females ..................... 2,413,000 2,429,000 2,473,000 2,519,000 2,557,000 2,596,000 2,632,000 2,666,000 2,702,000 2,742,000 2,772,000
Private 2-year .................... 306,000 310,000 315,000 319,000 324,000 329,000 332,000 336,000 339,000 341,000 343,000Full-time ......................... 265,000 269,000 273,000 277,000 281,000 285,000 288,000 291,000 294,000 296,000 297,000
Males ......................... 90,000 90,000 91,000 92,000 93,000 94,000 95,000 96,000 97,000 98,000 98,000Females ..................... 175,000 179,000 182,000 185,000 188,000 191,000 193,000 195,000 197,000 198,000 199,000
Part-time ........................ 41,000 41,000 42,000 42,000 43,000 44,000 44,000 45,000 45,000 46,000 46,000Males ......................... 10,000 10,000 10,000 10,000 10,000 10,000 11,000 11,000 11,000 11,000 11,000Females ..................... 31,000 31,000 32,000 32,000 33,000 33,000 34,000 34,000 35,000 35,000 35,000
Nonprofit 2-year ............. — — — — — — — — — — —Full-time ..................... — — — — — — — — — — —
Males...................... — — — — — — — — — — —Females.................. — — — — — — — — — — —
Part-time .................... — — — — — — — — — — —Males...................... — — — — — — — — — — —Females.................. — — — — — — — — — — —
For-profit 2-year ............. — — — — — — — — — — —
—Not available.1Large increase in private 2-year institutions in 1980 is due to the addition of schools accred-ited by the Accrediting Commission of Career Schools and Colleges of Technology. NOTE: Data through 1995 are for institutions of higher education, while later data are fordegree-granting institutions. Degree-granting institutions grant associate’s or higher degreesand participate in Title IV federal financial aid programs. The degree-granting classification isvery similar to the earlier higher education classification, but it includes more 2-year colleges
and excludes a few higher education institutions that did not grant degrees. Some data havebeen revised from previously published figures. SOURCE: U.S. Department of Education, National Center for Education Statistics, HigherEducation General Information Survey (HEGIS), “Fall Enrollment in Colleges and Universi-ties” surveys, 1970 through 1985; Integrated Postsecondary Education Data System(IPEDS), “Fall Enrollment Survey” (IPEDS-EF:90–99); IPEDS Spring 2001 through Spring2016, Fall Enrollment component; and Enrollment in Degree-Granting Institutions ProjectionModel, 2000 through 2026. (This table was prepared February 2017.)

60 Reference Tables
Table 15. Total fall enrollment in degree-granting postsecondary institutions, by attendance status, sex, and age: Selected years, 1970 through 2026[In thousands]
Attendance status, sex, and age 1970 1980 1990 2000 2005 2006 2007 2008 2009 2010 2011 2012 2013 2014 2015
Projected
2016 2017 2020 2026
1 2 3 4 5 6 7 8 9 10 11 12 13 14 15 16 17 18 19 20
All students ................. 8,581 12,097 13,819 15,312 17,487 17,759 18,248 19,103 20,314 21,019 21,011 20,644 20,377 20,207 19,977 20,185 20,413 21,346 22,63114 to 17 years old ................. 263 257 153 131 187 184 200 195 215 202 221 242 256 239 211 216 219 223 23418 and 19 years old .............. 2,579 2,852 2,777 3,258 3,444 3,561 3,690 3,813 4,009 4,057 3,956 3,782 3,720 3,720 3,691 4,029 4,091 4,237 4,53420 and 21 years old .............. 1,885 2,395 2,593 3,005 3,563 3,573 3,570 3,649 3,916 4,103 4,269 4,235 4,183 4,162 4,125 4,520 4,547 4,767 4,96622 to 24 years old ................. 1,469 1,947 2,202 2,600 3,114 3,185 3,280 3,443 3,571 3,759 3,793 3,951 3,964 3,910 3,809 3,639 3,674 3,786 4,09325 to 29 years old ................. 1,091 1,843 2,083 2,044 2,469 2,506 2,651 2,840 3,082 3,254 3,272 3,155 3,050 3,084 3,110 3,121 3,196 3,354 3,43130 to 34 years old ................. 527 1,227 1,384 1,333 1,438 1,472 1,519 1,609 1,735 1,805 1,788 1,684 1,606 1,586 1,585 1,589 1,594 1,704 1,78035 years old and over ........... 767 1,577 2,627 2,942 3,272 3,277 3,339 3,554 3,785 3,840 3,712 3,597 3,597 3,506 3,446 3,072 3,092 3,275 3,594Males.................................... 5,044 5,874 6,284 6,722 7,456 7,575 7,816 8,189 8,733 9,046 9,034 8,919 8,861 8,797 8,721 8,855 8,869 9,212 9,678
14 to 17 years old ............. 125 106 66 58 68 69 88 93 103 94 104 119 125 117 106 107 107 106 10418 and 19 years old .......... 1,355 1,368 1,298 1,464 1,523 1,604 1,669 1,704 1,795 1,820 1,782 1,707 1,661 1,673 1,657 1,858 1,859 1,919 2,05320 and 21 years old .......... 1,064 1,219 1,259 1,411 1,658 1,628 1,634 1,695 1,866 1,948 1,985 1,960 1,955 1,960 1,957 2,108 2,100 2,198 2,28922 to 24 years old ............. 1,004 1,075 1,129 1,222 1,410 1,445 1,480 1,555 1,599 1,723 1,769 1,864 1,846 1,789 1,747 1,746 1,740 1,771 1,88825 to 29 years old ............. 796 983 1,024 908 1,057 1,040 1,148 1,222 1,378 1,410 1,404 1,353 1,356 1,378 1,383 1,371 1,397 1,461 1,47230 to 34 years old ............. 333 564 605 581 591 628 638 691 707 731 700 661 634 643 650 645 645 685 70935 years old and over ....... 366 559 902 1,077 1,149 1,160 1,159 1,228 1,285 1,320 1,290 1,255 1,283 1,237 1,221 1,021 1,020 1,071 1,163
Females ............................... 3,537 6,223 7,535 8,591 10,032 10,184 10,432 10,914 11,581 11,974 11,976 11,725 11,515 11,410 11,256 11,330 11,544 12,135 12,95314 to 17 years old ............. 137 151 87 73 119 115 112 102 113 108 116 123 131 121 105 110 112 118 13018 and 19 years old .......... 1,224 1,484 1,479 1,794 1,920 1,956 2,021 2,109 2,214 2,237 2,173 2,074 2,059 2,047 2,034 2,170 2,231 2,318 2,48120 and 21 years old .......... 821 1,177 1,334 1,593 1,905 1,945 1,936 1,954 2,050 2,155 2,284 2,276 2,228 2,202 2,167 2,412 2,447 2,568 2,67722 to 24 years old ............. 464 871 1,073 1,378 1,704 1,740 1,800 1,888 1,972 2,036 2,024 2,087 2,118 2,121 2,063 1,892 1,934 2,015 2,20425 to 29 years old ............. 296 859 1,059 1,136 1,413 1,466 1,502 1,618 1,704 1,844 1,868 1,802 1,694 1,706 1,726 1,750 1,799 1,893 1,96030 to 34 years old ............. 194 663 779 752 847 844 881 918 1,028 1,074 1,088 1,022 972 943 935 943 949 1,018 1,07135 years old and over ....... 401 1,018 1,725 1,865 2,123 2,117 2,180 2,326 2,500 2,520 2,422 2,341 2,314 2,270 2,225 2,052 2,072 2,204 2,431
Full-time............................... 5,816 7,098 7,821 9,010 10,797 10,957 11,270 11,748 12,605 13,087 13,003 12,734 12,597 12,454 12,291 12,396 12,564 13,114 13,79714 to 17 years old ............. 246 231 134 121 152 148 169 168 179 170 185 207 210 200 177 183 186 189 19718 and 19 years old .......... 2,374 2,544 2,471 2,823 3,026 3,120 3,244 3,359 3,481 3,496 3,351 3,226 3,199 3,174 3,151 3,196 3,255 3,372 3,59720 and 21 years old .......... 1,649 2,007 2,137 2,452 2,976 2,972 2,985 3,043 3,241 3,364 3,427 3,386 3,327 3,326 3,296 3,481 3,518 3,694 3,83622 to 24 years old ............. 904 1,181 1,405 1,714 2,122 2,127 2,205 2,347 2,511 2,585 2,580 2,603 2,650 2,597 2,571 2,471 2,511 2,598 2,80825 to 29 years old ............. 426 641 791 886 1,174 1,225 1,299 1,369 1,506 1,605 1,600 1,555 1,528 1,525 1,509 1,490 1,518 1,587 1,59030 to 34 years old ............. 113 272 383 418 547 571 556 571 657 745 763 711 664 626 607 632 632 677 70035 years old and over ....... 104 221 500 596 800 794 812 890 1,030 1,122 1,096 1,047 1,018 1,005 980 944 944 997 1,068Males ................................ 3,504 3,689 3,808 4,111 4,803 4,879 5,029 5,234 5,632 5,838 5,793 5,708 5,682 5,619 5,561 5,679 5,670 5,882 6,163
14 to 17 years old ......... 121 95 55 51 53 52 74 73 77 71 85 102 106 100 90 85 85 83 8018 and 19 years old ...... 1,261 1,219 1,171 1,252 1,339 1,404 1,465 1,516 1,570 1,574 1,510 1,461 1,423 1,402 1,380 1,466 1,462 1,510 1,61620 and 21 years old ...... 955 1,046 1,035 1,156 1,398 1,372 1,366 1,407 1,536 1,586 1,586 1,537 1,542 1,549 1,569 1,630 1,625 1,704 1,77322 to 24 years old ......... 686 717 768 834 982 992 1,043 1,105 1,169 1,215 1,217 1,254 1,270 1,236 1,222 1,196 1,193 1,218 1,29925 to 29 years old ......... 346 391 433 410 506 533 578 597 661 715 727 728 734 732 711 698 707 735 72930 to 34 years old ......... 77 142 171 186 225 235 231 249 279 301 299 278 257 242 236 256 254 271 28035 years old and over ... 58 80 174 222 300 291 273 287 341 376 369 349 351 360 353 348 344 361 387
Females ........................... 2,312 3,409 4,013 4,899 5,994 6,078 6,240 6,513 6,973 7,249 7,210 7,026 6,914 6,835 6,730 6,717 6,893 7,231 7,63414 to 17 years old ......... 125 136 78 70 98 95 95 95 102 99 100 105 104 101 86 99 101 106 11718 and 19 years old ...... 1,113 1,325 1,300 1,571 1,687 1,716 1,779 1,843 1,911 1,922 1,842 1,765 1,776 1,773 1,771 1,730 1,793 1,862 1,98120 and 21 years old ...... 693 961 1,101 1,296 1,578 1,601 1,619 1,636 1,705 1,778 1,840 1,849 1,785 1,777 1,727 1,852 1,893 1,989 2,06222 to 24 years old ......... 218 464 638 880 1,140 1,135 1,163 1,242 1,343 1,370 1,364 1,349 1,380 1,362 1,350 1,275 1,318 1,380 1,50925 to 29 years old ......... 80 250 358 476 668 692 721 772 845 891 873 827 794 793 798 791 811 851 86130 to 34 years old ......... 37 130 212 232 322 336 324 322 378 444 464 433 408 384 370 375 377 406 42135 years old and over ... 46 141 326 374 500 503 539 603 690 746 727 698 667 645 627 596 600 636 681
Part-time .............................. 2,765 4,999 5,998 6,303 6,690 6,802 6,978 7,355 7,708 7,932 8,008 7,910 7,780 7,753 7,686 7,789 7,849 8,232 8,83514 to 17 years old ............. 16 26 19 10 36 36 31 27 36 32 36 35 47 38 34 33 33 34 3718 and 19 years old .......... 205 308 306 435 417 440 446 453 528 561 604 556 521 545 540 833 835 864 93720 and 21 years old .......... 236 388 456 553 586 601 585 606 675 738 842 850 855 836 829 1,039 1,029 1,073 1,13022 to 24 years old ............. 564 765 796 886 992 1,058 1,074 1,096 1,059 1,174 1,212 1,348 1,314 1,313 1,238 1,168 1,163 1,188 1,28425 to 29 years old ............. 665 1,202 1,291 1,158 1,296 1,282 1,352 1,471 1,576 1,648 1,672 1,600 1,522 1,559 1,600 1,631 1,679 1,767 1,84130 to 34 years old ............. 414 954 1,001 915 891 901 963 1,037 1,079 1,060 1,025 973 942 960 979 957 962 1,027 1,07935 years old and over ....... 663 1,356 2,127 2,345 2,472 2,483 2,527 2,664 2,754 2,718 2,616 2,550 2,579 2,501 2,466 2,129 2,148 2,278 2,526Males ................................ 1,540 2,185 2,476 2,611 2,653 2,696 2,786 2,955 3,101 3,207 3,241 3,211 3,179 3,178 3,161 3,176 3,199 3,329 3,515
14 to 17 years old ......... 4 12 11 7 15 17 14 20 25 23 20 17 20 18 16 22 22 23 2418 and 19 years old ...... 94 149 127 212 184 200 204 188 226 245 273 246 239 271 277 392 398 409 43720 and 21 years old ...... 108 172 224 255 260 257 269 289 330 362 398 423 413 411 389 478 475 494 51622 to 24 years old ......... 318 359 361 388 428 452 438 450 430 508 552 610 576 553 525 550 547 554 59025 to 29 years old ......... 450 592 591 498 551 507 570 625 718 695 677 625 622 646 673 673 691 725 74330 to 34 years old ......... 257 422 435 395 365 393 406 442 428 430 401 383 377 401 414 389 390 414 42935 years old and over ... 309 479 728 855 850 869 886 941 944 944 921 906 932 877 868 673 676 710 776
Females ........................... 1,225 2,814 3,521 3,692 4,038 4,106 4,192 4,401 4,607 4,725 4,767 4,699 4,601 4,576 4,526 4,613 4,651 4,903 5,32014 to 17 years old ......... 12 14 9 3 21 20 17 7 11 9 16 18 27 20 19 11 11 12 1318 and 19 years old ...... 112 159 179 223 233 240 242 265 303 316 332 310 283 274 263 441 438 456 49920 and 21 years old ...... 128 216 233 298 327 344 317 318 345 377 444 427 443 425 440 561 554 579 61422 to 24 years old ......... 246 407 435 497 564 605 637 646 629 666 660 738 738 760 713 618 615 634 69525 to 29 years old ......... 216 609 700 660 745 774 781 846 859 953 995 975 900 913 928 958 988 1,042 1,09830 to 34 years old ......... 158 532 567 520 526 508 557 595 651 630 624 589 565 559 565 568 572 613 65035 years old and over ... 354 876 1,399 1,491 1,623 1,614 1,640 1,723 1,810 1,774 1,695 1,643 1,647 1,625 1,598 1,456 1,473 1,568 1,750
NOTE: Distributions by age are estimates based on samples of the civilian noninstitutionalizedpopulation from the U.S. Census Bureau’s Current Population Survey. Data through 1995 arefor institutions of higher education, while later data are for degree-granting institutions. Degree-granting institutions grant associate’s or higher degrees and participate in Title IV federal finan-cial aid programs. The degree-granting classification is very similar to the earlier higher educa-tion classification, but it includes more 2-year colleges and excludes a few higher educationinstitutions that did not grant degrees. Some data have been revised from previously publishedfigures. Detail may not sum to totals because of rounding.
SOURCE: U.S. Department of Education, National Center for Education Statistics, HigherEducation General Information Survey (HEGIS), “Fall Enrollment in Colleges and Universities”surveys, 1970 and 1980; Integrated Postsecondary Education Data System (IPEDS), “FallEnrollment Survey” (IPEDS-EF:90–99); IPEDS Spring 2001 through Spring 2016, Fall Enroll-ment component; and Enrollment in Degree-Granting Institutions Projection Model, 2000through 2026. U.S. Department of Commerce, Census Bureau, Current Population Survey(CPS), October, selected years, 1970 through 2015. (This table was prepared April 2017.)

This page intentionally left blank.
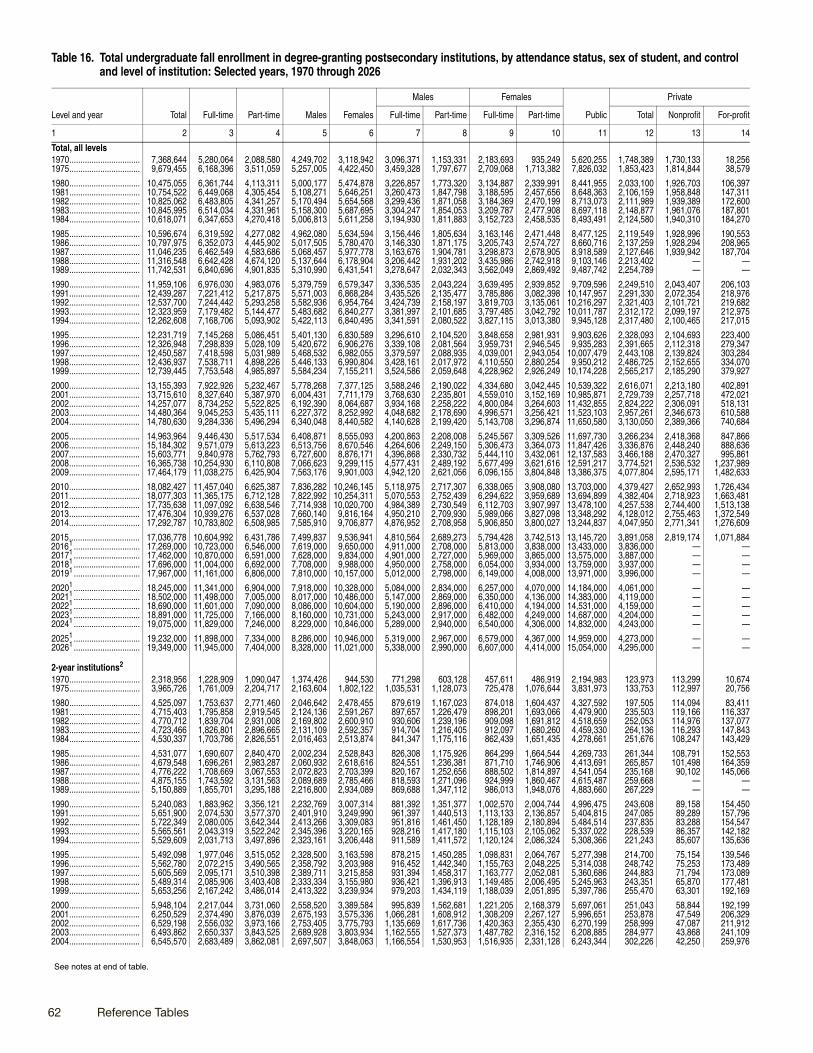
62 Reference Tables
Table 16. Total undergraduate fall enrollment in degree-granting postsecondary institutions, by attendance status, sex of student, and control and level of institution: Selected years, 1970 through 2026
Level and year Total Full-time Part-time Males Females
Males Females
Public
Private
Full-time Part-time Full-time Part-time Total Nonprofit For-profit
1 2 3 4 5 6 7 8 9 10 11 12 13 14
Total, all levels1970................................ 7,368,644 5,280,064 2,088,580 4,249,702 3,118,942 3,096,371 1,153,331 2,183,693 935,249 5,620,255 1,748,389 1,730,133 18,2561975................................ 9,679,455 6,168,396 3,511,059 5,257,005 4,422,450 3,459,328 1,797,677 2,709,068 1,713,382 7,826,032 1,853,423 1,814,844 38,579
1980................................ 10,475,055 6,361,744 4,113,311 5,000,177 5,474,878 3,226,857 1,773,320 3,134,887 2,339,991 8,441,955 2,033,100 1,926,703 106,3971981................................ 10,754,522 6,449,068 4,305,454 5,108,271 5,646,251 3,260,473 1,847,798 3,188,595 2,457,656 8,648,363 2,106,159 1,958,848 147,3111982................................ 10,825,062 6,483,805 4,341,257 5,170,494 5,654,568 3,299,436 1,871,058 3,184,369 2,470,199 8,713,073 2,111,989 1,939,389 172,6001983................................ 10,845,995 6,514,034 4,331,961 5,158,300 5,687,695 3,304,247 1,854,053 3,209,787 2,477,908 8,697,118 2,148,877 1,961,076 187,8011984................................ 10,618,071 6,347,653 4,270,418 5,006,813 5,611,258 3,194,930 1,811,883 3,152,723 2,458,535 8,493,491 2,124,580 1,940,310 184,270
1985................................ 10,596,674 6,319,592 4,277,082 4,962,080 5,634,594 3,156,446 1,805,634 3,163,146 2,471,448 8,477,125 2,119,549 1,928,996 190,5531986................................ 10,797,975 6,352,073 4,445,902 5,017,505 5,780,470 3,146,330 1,871,175 3,205,743 2,574,727 8,660,716 2,137,259 1,928,294 208,9651987................................ 11,046,235 6,462,549 4,583,686 5,068,457 5,977,778 3,163,676 1,904,781 3,298,873 2,678,905 8,918,589 2,127,646 1,939,942 187,7041988................................ 11,316,548 6,642,428 4,674,120 5,137,644 6,178,904 3,206,442 1,931,202 3,435,986 2,742,918 9,103,146 2,213,402 — —1989................................ 11,742,531 6,840,696 4,901,835 5,310,990 6,431,541 3,278,647 2,032,343 3,562,049 2,869,492 9,487,742 2,254,789 — —
1990................................ 11,959,106 6,976,030 4,983,076 5,379,759 6,579,347 3,336,535 2,043,224 3,639,495 2,939,852 9,709,596 2,249,510 2,043,407 206,1031991................................ 12,439,287 7,221,412 5,217,875 5,571,003 6,868,284 3,435,526 2,135,477 3,785,886 3,082,398 10,147,957 2,291,330 2,072,354 218,9761992................................ 12,537,700 7,244,442 5,293,258 5,582,936 6,954,764 3,424,739 2,158,197 3,819,703 3,135,061 10,216,297 2,321,403 2,101,721 219,6821993................................ 12,323,959 7,179,482 5,144,477 5,483,682 6,840,277 3,381,997 2,101,685 3,797,485 3,042,792 10,011,787 2,312,172 2,099,197 212,9751994................................ 12,262,608 7,168,706 5,093,902 5,422,113 6,840,495 3,341,591 2,080,522 3,827,115 3,013,380 9,945,128 2,317,480 2,100,465 217,015
1995................................ 12,231,719 7,145,268 5,086,451 5,401,130 6,830,589 3,296,610 2,104,520 3,848,658 2,981,931 9,903,626 2,328,093 2,104,693 223,4001996................................ 12,326,948 7,298,839 5,028,109 5,420,672 6,906,276 3,339,108 2,081,564 3,959,731 2,946,545 9,935,283 2,391,665 2,112,318 279,3471997................................ 12,450,587 7,418,598 5,031,989 5,468,532 6,982,055 3,379,597 2,088,935 4,039,001 2,943,054 10,007,479 2,443,108 2,139,824 303,2841998................................ 12,436,937 7,538,711 4,898,226 5,446,133 6,990,804 3,428,161 2,017,972 4,110,550 2,880,254 9,950,212 2,486,725 2,152,655 334,0701999................................ 12,739,445 7,753,548 4,985,897 5,584,234 7,155,211 3,524,586 2,059,648 4,228,962 2,926,249 10,174,228 2,565,217 2,185,290 379,927
2000................................ 13,155,393 7,922,926 5,232,467 5,778,268 7,377,125 3,588,246 2,190,022 4,334,680 3,042,445 10,539,322 2,616,071 2,213,180 402,8912001................................ 13,715,610 8,327,640 5,387,970 6,004,431 7,711,179 3,768,630 2,235,801 4,559,010 3,152,169 10,985,871 2,729,739 2,257,718 472,0212002................................ 14,257,077 8,734,252 5,522,825 6,192,390 8,064,687 3,934,168 2,258,222 4,800,084 3,264,603 11,432,855 2,824,222 2,306,091 518,1312003................................ 14,480,364 9,045,253 5,435,111 6,227,372 8,252,992 4,048,682 2,178,690 4,996,571 3,256,421 11,523,103 2,957,261 2,346,673 610,5882004................................ 14,780,630 9,284,336 5,496,294 6,340,048 8,440,582 4,140,628 2,199,420 5,143,708 3,296,874 11,650,580 3,130,050 2,389,366 740,684
2005................................ 14,963,964 9,446,430 5,517,534 6,408,871 8,555,093 4,200,863 2,208,008 5,245,567 3,309,526 11,697,730 3,266,234 2,418,368 847,8662006................................ 15,184,302 9,571,079 5,613,223 6,513,756 8,670,546 4,264,606 2,249,150 5,306,473 3,364,073 11,847,426 3,336,876 2,448,240 888,6362007................................ 15,603,771 9,840,978 5,762,793 6,727,600 8,876,171 4,396,868 2,330,732 5,444,110 3,432,061 12,137,583 3,466,188 2,470,327 995,8612008................................ 16,365,738 10,254,930 6,110,808 7,066,623 9,299,115 4,577,431 2,489,192 5,677,499 3,621,616 12,591,217 3,774,521 2,536,532 1,237,9892009................................ 17,464,179 11,038,275 6,425,904 7,563,176 9,901,003 4,942,120 2,621,056 6,096,155 3,804,848 13,386,375 4,077,804 2,595,171 1,482,633
2010................................ 18,082,427 11,457,040 6,625,387 7,836,282 10,246,145 5,118,975 2,717,307 6,338,065 3,908,080 13,703,000 4,379,427 2,652,993 1,726,4342011................................ 18,077,303 11,365,175 6,712,128 7,822,992 10,254,311 5,070,553 2,752,439 6,294,622 3,959,689 13,694,899 4,382,404 2,718,923 1,663,4812012................................ 17,735,638 11,097,092 6,638,546 7,714,938 10,020,700 4,984,389 2,730,549 6,112,703 3,907,997 13,478,100 4,257,538 2,744,400 1,513,1382013................................ 17,476,304 10,939,276 6,537,028 7,660,140 9,816,164 4,950,210 2,709,930 5,989,066 3,827,098 13,348,292 4,128,012 2,755,463 1,372,5492014................................ 17,292,787 10,783,802 6,508,985 7,585,910 9,706,877 4,876,952 2,708,958 5,906,850 3,800,027 13,244,837 4,047,950 2,771,341 1,276,609
2015................................ 17,036,778 10,604,992 6,431,786 7,499,837 9,536,941 4,810,564 2,689,273 5,794,428 3,742,513 13,145,720 3,891,058 2,819,174 1,071,88420161 .............................. 17,269,000 10,723,000 6,546,000 7,619,000 9,650,000 4,911,000 2,708,000 5,813,000 3,838,000 13,433,000 3,836,000 — —20171 .............................. 17,462,000 10,870,000 6,591,000 7,628,000 9,834,000 4,901,000 2,727,000 5,969,000 3,865,000 13,575,000 3,887,000 — —20181 .............................. 17,696,000 11,004,000 6,692,000 7,708,000 9,988,000 4,950,000 2,758,000 6,054,000 3,934,000 13,759,000 3,937,000 — —20191 .............................. 17,967,000 11,161,000 6,806,000 7,810,000 10,157,000 5,012,000 2,798,000 6,149,000 4,008,000 13,971,000 3,996,000 — —
20201 .............................. 18,245,000 11,341,000 6,904,000 7,918,000 10,328,000 5,084,000 2,834,000 6,257,000 4,070,000 14,184,000 4,061,000 — —20211 .............................. 18,502,000 11,498,000 7,005,000 8,017,000 10,486,000 5,147,000 2,869,000 6,350,000 4,136,000 14,383,000 4,119,000 — —20221 .............................. 18,690,000 11,601,000 7,090,000 8,086,000 10,604,000 5,190,000 2,896,000 6,410,000 4,194,000 14,531,000 4,159,000 — —20231 .............................. 18,891,000 11,725,000 7,166,000 8,160,000 10,731,000 5,243,000 2,917,000 6,482,000 4,249,000 14,687,000 4,204,000 — —20241 .............................. 19,075,000 11,829,000 7,246,000 8,229,000 10,846,000 5,289,000 2,940,000 6,540,000 4,306,000 14,832,000 4,243,000 — —
20251 .............................. 19,232,000 11,898,000 7,334,000 8,286,000 10,946,000 5,319,000 2,967,000 6,579,000 4,367,000 14,959,000 4,273,000 — —20261 .............................. 19,349,000 11,945,000 7,404,000 8,328,000 11,021,000 5,338,000 2,990,000 6,607,000 4,414,000 15,054,000 4,295,000 — —
2-year institutions2
1970................................ 2,318,956 1,228,909 1,090,047 1,374,426 944,530 771,298 603,128 457,611 486,919 2,194,983 123,973 113,299 10,6741975................................ 3,965,726 1,761,009 2,204,717 2,163,604 1,802,122 1,035,531 1,128,073 725,478 1,076,644 3,831,973 133,753 112,997 20,756
1980................................ 4,525,097 1,753,637 2,771,460 2,046,642 2,478,455 879,619 1,167,023 874,018 1,604,437 4,327,592 197,505 114,094 83,4111981................................ 4,715,403 1,795,858 2,919,545 2,124,136 2,591,267 897,657 1,226,479 898,201 1,693,066 4,479,900 235,503 119,166 116,3371982................................ 4,770,712 1,839,704 2,931,008 2,169,802 2,600,910 930,606 1,239,196 909,098 1,691,812 4,518,659 252,053 114,976 137,0771983................................ 4,723,466 1,826,801 2,896,665 2,131,109 2,592,357 914,704 1,216,405 912,097 1,680,260 4,459,330 264,136 116,293 147,8431984................................ 4,530,337 1,703,786 2,826,551 2,016,463 2,513,874 841,347 1,175,116 862,439 1,651,435 4,278,661 251,676 108,247 143,429
1985................................ 4,531,077 1,690,607 2,840,470 2,002,234 2,528,843 826,308 1,175,926 864,299 1,664,544 4,269,733 261,344 108,791 152,5531986................................ 4,679,548 1,696,261 2,983,287 2,060,932 2,618,616 824,551 1,236,381 871,710 1,746,906 4,413,691 265,857 101,498 164,3591987................................ 4,776,222 1,708,669 3,067,553 2,072,823 2,703,399 820,167 1,252,656 888,502 1,814,897 4,541,054 235,168 90,102 145,0661988................................ 4,875,155 1,743,592 3,131,563 2,089,689 2,785,466 818,593 1,271,096 924,999 1,860,467 4,615,487 259,668 — —1989................................ 5,150,889 1,855,701 3,295,188 2,216,800 2,934,089 869,688 1,347,112 986,013 1,948,076 4,883,660 267,229 — —
1990................................ 5,240,083 1,883,962 3,356,121 2,232,769 3,007,314 881,392 1,351,377 1,002,570 2,004,744 4,996,475 243,608 89,158 154,4501991................................ 5,651,900 2,074,530 3,577,370 2,401,910 3,249,990 961,397 1,440,513 1,113,133 2,136,857 5,404,815 247,085 89,289 157,7961992................................ 5,722,349 2,080,005 3,642,344 2,413,266 3,309,083 951,816 1,461,450 1,128,189 2,180,894 5,484,514 237,835 83,288 154,5471993................................ 5,565,561 2,043,319 3,522,242 2,345,396 3,220,165 928,216 1,417,180 1,115,103 2,105,062 5,337,022 228,539 86,357 142,1821994................................ 5,529,609 2,031,713 3,497,896 2,323,161 3,206,448 911,589 1,411,572 1,120,124 2,086,324 5,308,366 221,243 85,607 135,636
1995................................ 5,492,098 1,977,046 3,515,052 2,328,500 3,163,598 878,215 1,450,285 1,098,831 2,064,767 5,277,398 214,700 75,154 139,5461996................................ 5,562,780 2,072,215 3,490,565 2,358,792 3,203,988 916,452 1,442,340 1,155,763 2,048,225 5,314,038 248,742 75,253 173,4891997................................ 5,605,569 2,095,171 3,510,398 2,389,711 3,215,858 931,394 1,458,317 1,163,777 2,052,081 5,360,686 244,883 71,794 173,0891998................................ 5,489,314 2,085,906 3,403,408 2,333,334 3,155,980 936,421 1,396,913 1,149,485 2,006,495 5,245,963 243,351 65,870 177,4811999................................ 5,653,256 2,167,242 3,486,014 2,413,322 3,239,934 979,203 1,434,119 1,188,039 2,051,895 5,397,786 255,470 63,301 192,169
2000................................ 5,948,104 2,217,044 3,731,060 2,558,520 3,389,584 995,839 1,562,681 1,221,205 2,168,379 5,697,061 251,043 58,844 192,1992001................................ 6,250,529 2,374,490 3,876,039 2,675,193 3,575,336 1,066,281 1,608,912 1,308,209 2,267,127 5,996,651 253,878 47,549 206,3292002................................ 6,529,198 2,556,032 3,973,166 2,753,405 3,775,793 1,135,669 1,617,736 1,420,363 2,355,430 6,270,199 258,999 47,087 211,9122003................................ 6,493,862 2,650,337 3,843,525 2,689,928 3,803,934 1,162,555 1,527,373 1,487,782 2,316,152 6,208,885 284,977 43,868 241,1092004................................ 6,545,570 2,683,489 3,862,081 2,697,507 3,848,063 1,166,554 1,530,953 1,516,935 2,331,128 6,243,344 302,226 42,250 259,976
See notes at end of table.
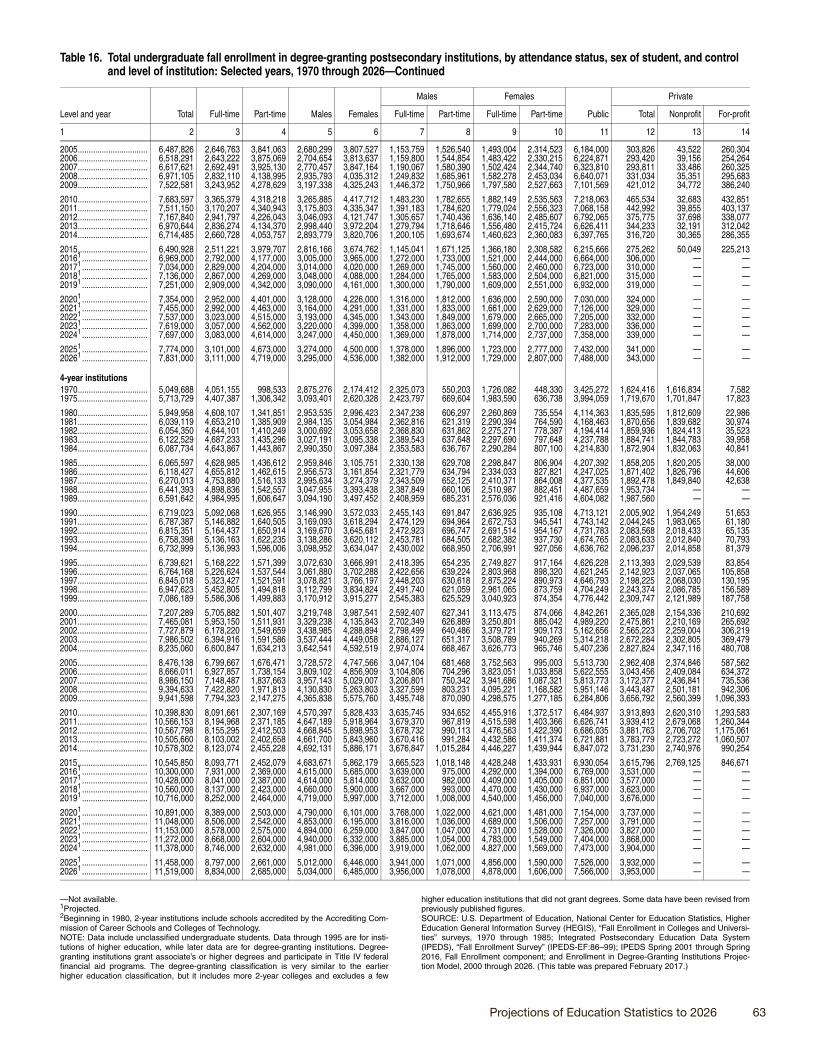
Projections of Education Statistics to 2026 63
2005................................ 6,487,826 2,646,763 3,841,063 2,680,299 3,807,527 1,153,759 1,526,540 1,493,004 2,314,523 6,184,000 303,826 43,522 260,3042006................................ 6,518,291 2,643,222 3,875,069 2,704,654 3,813,637 1,159,800 1,544,854 1,483,422 2,330,215 6,224,871 293,420 39,156 254,2642007................................ 6,617,621 2,692,491 3,925,130 2,770,457 3,847,164 1,190,067 1,580,390 1,502,424 2,344,740 6,323,810 293,811 33,486 260,3252008................................ 6,971,105 2,832,110 4,138,995 2,935,793 4,035,312 1,249,832 1,685,961 1,582,278 2,453,034 6,640,071 331,034 35,351 295,6832009................................ 7,522,581 3,243,952 4,278,629 3,197,338 4,325,243 1,446,372 1,750,966 1,797,580 2,527,663 7,101,569 421,012 34,772 386,240
2010................................ 7,683,597 3,365,379 4,318,218 3,265,885 4,417,712 1,483,230 1,782,655 1,882,149 2,535,563 7,218,063 465,534 32,683 432,8512011................................ 7,511,150 3,170,207 4,340,943 3,175,803 4,335,347 1,391,183 1,784,620 1,779,024 2,556,323 7,068,158 442,992 39,855 403,1372012................................ 7,167,840 2,941,797 4,226,043 3,046,093 4,121,747 1,305,657 1,740,436 1,636,140 2,485,607 6,792,065 375,775 37,698 338,0772013................................ 6,970,644 2,836,274 4,134,370 2,998,440 3,972,204 1,279,794 1,718,646 1,556,480 2,415,724 6,626,411 344,233 32,191 312,0422014................................ 6,714,485 2,660,728 4,053,757 2,893,779 3,820,706 1,200,105 1,693,674 1,460,623 2,360,083 6,397,765 316,720 30,365 286,355
2015................................ 6,490,928 2,511,221 3,979,707 2,816,166 3,674,762 1,145,041 1,671,125 1,366,180 2,308,582 6,215,666 275,262 50,049 225,21320161 .............................. 6,969,000 2,792,000 4,177,000 3,005,000 3,965,000 1,272,000 1,733,000 1,521,000 2,444,000 6,664,000 306,000 — —20171 .............................. 7,034,000 2,829,000 4,204,000 3,014,000 4,020,000 1,269,000 1,745,000 1,560,000 2,460,000 6,723,000 310,000 — —20181 .............................. 7,136,000 2,867,000 4,269,000 3,048,000 4,088,000 1,284,000 1,765,000 1,583,000 2,504,000 6,821,000 315,000 — —20191 .............................. 7,251,000 2,909,000 4,342,000 3,090,000 4,161,000 1,300,000 1,790,000 1,609,000 2,551,000 6,932,000 319,000 — —
20201 .............................. 7,354,000 2,952,000 4,401,000 3,128,000 4,226,000 1,316,000 1,812,000 1,636,000 2,590,000 7,030,000 324,000 — —20211 .............................. 7,455,000 2,992,000 4,463,000 3,164,000 4,291,000 1,331,000 1,833,000 1,661,000 2,629,000 7,126,000 329,000 — —20221 .............................. 7,537,000 3,023,000 4,515,000 3,193,000 4,345,000 1,343,000 1,849,000 1,679,000 2,665,000 7,205,000 332,000 — —20231 .............................. 7,619,000 3,057,000 4,562,000 3,220,000 4,399,000 1,358,000 1,863,000 1,699,000 2,700,000 7,283,000 336,000 — —20241 .............................. 7,697,000 3,083,000 4,614,000 3,247,000 4,450,000 1,369,000 1,878,000 1,714,000 2,737,000 7,358,000 339,000 — —
20251 .............................. 7,774,000 3,101,000 4,673,000 3,274,000 4,500,000 1,378,000 1,896,000 1,723,000 2,777,000 7,432,000 341,000 — —20261 .............................. 7,831,000 3,111,000 4,719,000 3,295,000 4,536,000 1,382,000 1,912,000 1,729,000 2,807,000 7,488,000 343,000 — —
4-year institutions1970................................ 5,049,688 4,051,155 998,533 2,875,276 2,174,412 2,325,073 550,203 1,726,082 448,330 3,425,272 1,624,416 1,616,834 7,5821975................................ 5,713,729 4,407,387 1,306,342 3,093,401 2,620,328 2,423,797 669,604 1,983,590 636,738 3,994,059 1,719,670 1,701,847 17,823
1980................................ 5,949,958 4,608,107 1,341,851 2,953,535 2,996,423 2,347,238 606,297 2,260,869 735,554 4,114,363 1,835,595 1,812,609 22,9861981................................ 6,039,119 4,653,210 1,385,909 2,984,135 3,054,984 2,362,816 621,319 2,290,394 764,590 4,168,463 1,870,656 1,839,682 30,9741982................................ 6,054,350 4,644,101 1,410,249 3,000,692 3,053,658 2,368,830 631,862 2,275,271 778,387 4,194,414 1,859,936 1,824,413 35,5231983................................ 6,122,529 4,687,233 1,435,296 3,027,191 3,095,338 2,389,543 637,648 2,297,690 797,648 4,237,788 1,884,741 1,844,783 39,9581984................................ 6,087,734 4,643,867 1,443,867 2,990,350 3,097,384 2,353,583 636,767 2,290,284 807,100 4,214,830 1,872,904 1,832,063 40,841
1985................................ 6,065,597 4,628,985 1,436,612 2,959,846 3,105,751 2,330,138 629,708 2,298,847 806,904 4,207,392 1,858,205 1,820,205 38,0001986................................ 6,118,427 4,655,812 1,462,615 2,956,573 3,161,854 2,321,779 634,794 2,334,033 827,821 4,247,025 1,871,402 1,826,796 44,6061987................................ 6,270,013 4,753,880 1,516,133 2,995,634 3,274,379 2,343,509 652,125 2,410,371 864,008 4,377,535 1,892,478 1,849,840 42,6381988................................ 6,441,393 4,898,836 1,542,557 3,047,955 3,393,438 2,387,849 660,106 2,510,987 882,451 4,487,659 1,953,734 — —1989................................ 6,591,642 4,984,995 1,606,647 3,094,190 3,497,452 2,408,959 685,231 2,576,036 921,416 4,604,082 1,987,560 — —
1990................................ 6,719,023 5,092,068 1,626,955 3,146,990 3,572,033 2,455,143 691,847 2,636,925 935,108 4,713,121 2,005,902 1,954,249 51,6531991................................ 6,787,387 5,146,882 1,640,505 3,169,093 3,618,294 2,474,129 694,964 2,672,753 945,541 4,743,142 2,044,245 1,983,065 61,1801992................................ 6,815,351 5,164,437 1,650,914 3,169,670 3,645,681 2,472,923 696,747 2,691,514 954,167 4,731,783 2,083,568 2,018,433 65,1351993................................ 6,758,398 5,136,163 1,622,235 3,138,286 3,620,112 2,453,781 684,505 2,682,382 937,730 4,674,765 2,083,633 2,012,840 70,7931994................................ 6,732,999 5,136,993 1,596,006 3,098,952 3,634,047 2,430,002 668,950 2,706,991 927,056 4,636,762 2,096,237 2,014,858 81,379
1995................................ 6,739,621 5,168,222 1,571,399 3,072,630 3,666,991 2,418,395 654,235 2,749,827 917,164 4,626,228 2,113,393 2,029,539 83,8541996................................ 6,764,168 5,226,624 1,537,544 3,061,880 3,702,288 2,422,656 639,224 2,803,968 898,320 4,621,245 2,142,923 2,037,065 105,8581997................................ 6,845,018 5,323,427 1,521,591 3,078,821 3,766,197 2,448,203 630,618 2,875,224 890,973 4,646,793 2,198,225 2,068,030 130,1951998................................ 6,947,623 5,452,805 1,494,818 3,112,799 3,834,824 2,491,740 621,059 2,961,065 873,759 4,704,249 2,243,374 2,086,785 156,5891999................................ 7,086,189 5,586,306 1,499,883 3,170,912 3,915,277 2,545,383 625,529 3,040,923 874,354 4,776,442 2,309,747 2,121,989 187,758
2000................................ 7,207,289 5,705,882 1,501,407 3,219,748 3,987,541 2,592,407 627,341 3,113,475 874,066 4,842,261 2,365,028 2,154,336 210,6922001................................ 7,465,081 5,953,150 1,511,931 3,329,238 4,135,843 2,702,349 626,889 3,250,801 885,042 4,989,220 2,475,861 2,210,169 265,6922002................................ 7,727,879 6,178,220 1,549,659 3,438,985 4,288,894 2,798,499 640,486 3,379,721 909,173 5,162,656 2,565,223 2,259,004 306,2192003................................ 7,986,502 6,394,916 1,591,586 3,537,444 4,449,058 2,886,127 651,317 3,508,789 940,269 5,314,218 2,672,284 2,302,805 369,4792004................................ 8,235,060 6,600,847 1,634,213 3,642,541 4,592,519 2,974,074 668,467 3,626,773 965,746 5,407,236 2,827,824 2,347,116 480,708
2005................................ 8,476,138 6,799,667 1,676,471 3,728,572 4,747,566 3,047,104 681,468 3,752,563 995,003 5,513,730 2,962,408 2,374,846 587,5622006................................ 8,666,011 6,927,857 1,738,154 3,809,102 4,856,909 3,104,806 704,296 3,823,051 1,033,858 5,622,555 3,043,456 2,409,084 634,3722007................................ 8,986,150 7,148,487 1,837,663 3,957,143 5,029,007 3,206,801 750,342 3,941,686 1,087,321 5,813,773 3,172,377 2,436,841 735,5362008................................ 9,394,633 7,422,820 1,971,813 4,130,830 5,263,803 3,327,599 803,231 4,095,221 1,168,582 5,951,146 3,443,487 2,501,181 942,3062009................................ 9,941,598 7,794,323 2,147,275 4,365,838 5,575,760 3,495,748 870,090 4,298,575 1,277,185 6,284,806 3,656,792 2,560,399 1,096,393
2010................................ 10,398,830 8,091,661 2,307,169 4,570,397 5,828,433 3,635,745 934,652 4,455,916 1,372,517 6,484,937 3,913,893 2,620,310 1,293,5832011................................ 10,566,153 8,194,968 2,371,185 4,647,189 5,918,964 3,679,370 967,819 4,515,598 1,403,366 6,626,741 3,939,412 2,679,068 1,260,3442012................................ 10,567,798 8,155,295 2,412,503 4,668,845 5,898,953 3,678,732 990,113 4,476,563 1,422,390 6,686,035 3,881,763 2,706,702 1,175,0612013................................ 10,505,660 8,103,002 2,402,658 4,661,700 5,843,960 3,670,416 991,284 4,432,586 1,411,374 6,721,881 3,783,779 2,723,272 1,060,5072014................................ 10,578,302 8,123,074 2,455,228 4,692,131 5,886,171 3,676,847 1,015,284 4,446,227 1,439,944 6,847,072 3,731,230 2,740,976 990,254
2015................................ 10,545,850 8,093,771 2,452,079 4,683,671 5,862,179 3,665,523 1,018,148 4,428,248 1,433,931 6,930,054 3,615,796 2,769,125 846,67120161 .............................. 10,300,000 7,931,000 2,369,000 4,615,000 5,685,000 3,639,000 975,000 4,292,000 1,394,000 6,769,000 3,531,000 — —20171 .............................. 10,428,000 8,041,000 2,387,000 4,614,000 5,814,000 3,632,000 982,000 4,409,000 1,405,000 6,851,000 3,577,000 — —20181 .............................. 10,560,000 8,137,000 2,423,000 4,660,000 5,900,000 3,667,000 993,000 4,470,000 1,430,000 6,937,000 3,623,000 — —20191 .............................. 10,716,000 8,252,000 2,464,000 4,719,000 5,997,000 3,712,000 1,008,000 4,540,000 1,456,000 7,040,000 3,676,000 — —
20201 .............................. 10,891,000 8,389,000 2,503,000 4,790,000 6,101,000 3,768,000 1,022,000 4,621,000 1,481,000 7,154,000 3,737,000 — —20211 .............................. 11,048,000 8,506,000 2,542,000 4,853,000 6,195,000 3,816,000 1,036,000 4,689,000 1,506,000 7,257,000 3,791,000 — —20221 .............................. 11,153,000 8,578,000 2,575,000 4,894,000 6,259,000 3,847,000 1,047,000 4,731,000 1,528,000 7,326,000 3,827,000 — —20231 .............................. 11,272,000 8,668,000 2,604,000 4,940,000 6,332,000 3,885,000 1,054,000 4,783,000 1,549,000 7,404,000 3,868,000 — —20241 .............................. 11,378,000 8,746,000 2,632,000 4,981,000 6,396,000 3,919,000 1,062,000 4,827,000 1,569,000 7,473,000 3,904,000 — —
20251 .............................. 11,458,000 8,797,000 2,661,000 5,012,000 6,446,000 3,941,000 1,071,000 4,856,000 1,590,000 7,526,000 3,932,000 — —20261 .............................. 11,519,000 8,834,000 2,685,000 5,034,000 6,485,000 3,956,000 1,078,000 4,878,000 1,606,000 7,566,000 3,953,000 — —
Table 16. Total undergraduate fall enrollment in degree-granting postsecondary institutions, by attendance status, sex of student, and control and level of institution: Selected years, 1970 through 2026—Continued
Level and year Total Full-time Part-time Males Females
Males Females
Public
Private
Full-time Part-time Full-time Part-time Total Nonprofit For-profit
1 2 3 4 5 6 7 8 9 10 11 12 13 14
—Not available.1Projected.2Beginning in 1980, 2-year institutions include schools accredited by the Accrediting Com-mission of Career Schools and Colleges of Technology.NOTE: Data include unclassified undergraduate students. Data through 1995 are for insti-tutions of higher education, while later data are for degree-granting institutions. Degree-granting institutions grant associate’s or higher degrees and participate in Title IV federalfinancial aid programs. The degree-granting classification is very similar to the earlierhigher education classification, but it includes more 2-year colleges and excludes a few
higher education institutions that did not grant degrees. Some data have been revised frompreviously published figures.SOURCE: U.S. Department of Education, National Center for Education Statistics, HigherEducation General Information Survey (HEGIS), “Fall Enrollment in Colleges and Universi-ties” surveys, 1970 through 1985; Integrated Postsecondary Education Data System(IPEDS), “Fall Enrollment Survey” (IPEDS-EF:86–99); IPEDS Spring 2001 through Spring2016, Fall Enrollment component; and Enrollment in Degree-Granting Institutions Projec-tion Model, 2000 through 2026. (This table was prepared February 2017.)

64 Reference Tables
Table 17. Total postbaccalaureate fall enrollment in degree-granting postsecondary institutions, by attendance status, sex of student, and control of institution: 1967 through 2026
Year Total Full-time Part-time Males Females
Males Females
Public
Private
Full-time Part-time Full-time Part-time Total Nonprofit For-profit
1 2 3 4 5 6 7 8 9 10 11 12 13 14
1967................................. 896,065 448,238 447,827 630,701 265,364 354,628 276,073 93,610 171,754 522,623 373,442 373,336 1061968................................. 1,037,377 469,747 567,630 696,649 340,728 358,686 337,963 111,061 229,667 648,657 388,720 388,681 391969................................. 1,120,175 506,833 613,342 738,673 381,502 383,630 355,043 123,203 258,299 738,551 381,624 381,558 66
1970................................. 1,212,243 536,226 676,017 793,940 418,303 407,724 386,216 128,502 289,801 807,879 404,364 404,287 771971................................. 1,204,390 564,236 640,154 789,131 415,259 428,167 360,964 136,069 279,190 796,516 407,874 407,804 701972................................. 1,272,421 583,299 689,122 810,164 462,257 436,533 373,631 146,766 315,491 848,031 424,390 424,278 1121973................................. 1,342,452 610,935 731,517 833,453 508,999 444,219 389,234 166,716 342,283 897,104 445,348 445,205 1431974................................. 1,425,001 643,927 781,074 856,847 568,154 454,706 402,141 189,221 378,933 956,770 468,231 467,950 281
1975................................. 1,505,404 672,938 832,466 891,992 613,412 467,425 424,567 205,513 407,899 1,008,476 496,928 496,604 3241976................................. 1,577,546 683,825 893,721 904,551 672,995 459,286 445,265 224,539 448,456 1,033,115 544,431 541,064 3,3671977................................. 1,569,084 698,902 870,182 891,819 677,265 462,038 429,781 236,864 440,401 1,004,013 565,071 561,384 3,6871978................................. 1,575,693 704,831 870,862 879,931 695,762 458,865 421,066 245,966 449,796 998,608 577,085 573,563 3,5221979................................. 1,571,922 714,624 857,298 862,754 709,168 456,197 406,557 258,427 450,741 989,991 581,931 578,425 3,506
1980................................. 1,621,840 736,214 885,626 874,197 747,643 462,387 411,810 273,827 473,816 1,015,439 606,401 601,084 5,3171981................................. 1,617,150 732,182 884,968 866,785 750,365 452,364 414,421 279,818 470,547 998,669 618,481 613,557 4,9241982................................. 1,600,718 736,813 863,905 860,890 739,828 453,519 407,371 283,294 456,534 983,014 617,704 613,350 4,3541983................................. 1,618,666 747,016 871,650 865,425 753,241 455,540 409,885 291,476 461,765 985,616 633,050 628,111 4,9391984................................. 1,623,869 750,735 873,134 856,761 767,108 452,579 404,182 298,156 468,952 983,879 639,990 634,109 5,881
1985................................. 1,650,381 755,629 894,752 856,370 794,011 451,274 405,096 304,355 489,656 1,002,148 648,233 642,795 5,4381986................................. 1,705,536 767,477 938,059 867,010 838,526 452,717 414,293 314,760 523,766 1,053,177 652,359 644,185 8,1741987................................. 1,720,407 768,536 951,871 863,599 856,808 447,212 416,387 321,324 535,484 1,054,665 665,742 662,408 3,3341988................................. 1,738,789 794,340 944,449 864,252 874,537 455,337 408,915 339,003 535,534 1,058,242 680,547 — —1989................................. 1,796,029 820,254 975,775 879,025 917,004 461,596 417,429 358,658 558,346 1,090,221 705,808 — —
1990................................. 1,859,531 844,955 1,014,576 904,150 955,381 471,217 432,933 373,738 581,643 1,135,121 724,410 716,820 7,5901991................................. 1,919,666 893,917 1,025,749 930,841 988,825 493,849 436,992 400,068 588,757 1,161,606 758,060 746,687 11,3731992................................. 1,949,659 917,676 1,031,983 941,053 1,008,606 502,166 438,887 415,510 593,096 1,168,270 781,389 770,802 10,5871993................................. 1,980,844 948,136 1,032,708 943,768 1,037,076 508,574 435,194 439,562 597,514 1,177,301 803,543 789,700 13,8431994................................. 2,016,182 969,070 1,047,112 949,785 1,066,397 513,592 436,193 455,478 610,919 1,188,552 827,630 809,642 17,988
1995................................. 2,030,062 983,534 1,046,528 941,409 1,088,653 510,782 430,627 472,752 615,901 1,188,748 841,314 824,351 16,9631996................................. 2,040,572 1,004,114 1,036,458 932,153 1,108,419 512,100 420,053 492,014 616,405 1,185,216 855,356 830,238 25,1181997................................. 2,051,747 1,019,464 1,032,283 927,496 1,124,251 510,845 416,651 508,619 615,632 1,188,640 863,107 837,790 25,3171998................................. 2,070,030 1,024,627 1,045,403 923,132 1,146,898 505,492 417,640 519,135 627,763 1,187,557 882,473 852,270 30,2031999................................. 2,110,246 1,049,591 1,060,655 930,930 1,179,316 508,930 422,000 540,661 638,655 1,201,511 908,735 869,739 38,996
2000................................. 2,156,896 1,086,674 1,070,222 943,501 1,213,395 522,847 420,654 563,827 649,568 1,213,464 943,432 896,239 47,1932001................................. 2,212,377 1,119,862 1,092,515 956,384 1,255,993 531,260 425,124 588,602 667,391 1,247,285 965,092 909,612 55,4802002................................. 2,354,634 1,212,107 1,142,527 1,009,726 1,344,908 566,930 442,796 645,177 699,731 1,319,138 1,035,496 959,385 76,1112003................................. 2,431,117 1,280,880 1,150,237 1,032,892 1,398,225 589,190 443,702 691,690 706,535 1,335,595 1,095,522 994,375 101,1472004................................. 2,491,414 1,325,841 1,165,573 1,047,214 1,444,200 598,727 448,487 727,114 717,086 1,329,532 1,161,882 1,022,319 139,563
2005................................. 2,523,511 1,350,581 1,172,930 1,047,054 1,476,457 602,525 444,529 748,056 728,401 1,324,104 1,199,407 1,036,324 163,0832006................................. 2,574,568 1,386,226 1,188,342 1,061,059 1,513,509 614,709 446,350 771,517 741,992 1,332,707 1,241,861 1,064,626 177,2352007................................. 2,644,357 1,428,914 1,215,443 1,088,314 1,556,043 632,576 455,738 796,338 759,705 1,353,197 1,291,160 1,100,823 190,3372008................................. 2,737,076 1,492,813 1,244,263 1,122,272 1,614,804 656,926 465,346 835,887 778,917 1,380,936 1,356,140 1,124,987 231,1532009................................. 2,849,415 1,567,080 1,282,335 1,169,777 1,679,638 689,977 479,800 877,103 802,535 1,424,393 1,425,022 1,172,501 252,521
2010................................. 2,937,011 1,630,142 1,306,869 1,209,477 1,727,534 719,408 490,069 910,734 816,800 1,439,171 1,497,840 1,201,489 296,3512011................................. 2,933,287 1,637,356 1,295,931 1,211,264 1,722,023 722,265 488,999 915,091 806,932 1,421,404 1,511,883 1,207,896 303,9872012................................. 2,908,840 1,637,312 1,271,528 1,204,068 1,704,772 724,017 480,051 913,295 791,477 1,406,567 1,502,273 1,206,988 295,2852013................................. 2,900,373 1,657,334 1,243,039 1,201,057 1,699,316 732,112 468,945 925,222 774,094 1,398,556 1,501,817 1,215,927 285,8902014................................. 2,914,582 1,670,173 1,244,409 1,211,151 1,703,431 742,439 468,712 927,734 775,697 1,410,178 1,504,404 1,224,748 279,656
2015................................. 2,940,492 1,685,837 1,254,655 1,221,566 1,718,926 749,971 471,595 935,866 783,060 1,422,383 1,518,109 1,244,198 273,91120161 ............................... 2,916,000 1,673,000 1,243,000 1,236,000 1,680,000 768,000 468,000 905,000 775,000 1,411,000 1,504,000 — —20171 ............................... 2,951,000 1,693,000 1,258,000 1,241,000 1,710,000 769,000 472,000 924,000 786,000 1,428,000 1,523,000 — —20181 ............................... 2,992,000 1,712,000 1,280,000 1,254,000 1,738,000 775,000 479,000 937,000 801,000 1,448,000 1,544,000 — —20191 ............................... 3,042,000 1,738,000 1,304,000 1,272,000 1,770,000 785,000 487,000 953,000 817,000 1,472,000 1,570,000 — —
20201 ............................... 3,101,000 1,773,000 1,328,000 1,294,000 1,807,000 798,000 496,000 974,000 833,000 1,500,000 1,601,000 — —20211 ............................... 3,157,000 1,804,000 1,353,000 1,314,000 1,842,000 810,000 504,000 994,000 849,000 1,527,000 1,629,000 — —20221 ............................... 3,198,000 1,825,000 1,372,000 1,328,000 1,869,000 819,000 510,000 1,007,000 863,000 1,547,000 1,651,000 — —20231 ............................... 3,234,000 1,845,000 1,389,000 1,339,000 1,894,000 825,000 514,000 1,019,000 875,000 1,564,000 1,670,000 — —20241 ............................... 3,256,000 1,852,000 1,404,000 1,345,000 1,911,000 827,000 518,000 1,024,000 887,000 1,575,000 1,681,000 — —
20251 ............................... 3,271,000 1,852,000 1,420,000 1,348,000 1,923,000 826,000 522,000 1,025,000 898,000 1,583,000 1,689,000 — —20261 ............................... 3,282,000 1,852,000 1,431,000 1,350,000 1,933,000 825,000 525,000 1,026,000 906,000 1,588,000 1,694,000 — —
—Not available.1Projected.NOTE: Data include unclassified graduate students. Data through 1995 are for institutions ofhigher education, while later data are for degree-granting institutions. Degree-granting institu-tions grant associate’s or higher degrees and participate in Title IV federal financial aid programs.The degree-granting classification is very similar to the earlier higher education classification, butit includes more 2-year colleges and excludes a few higher education institutions that did notgrant degrees. Some data have been revised from previously published figures.
SOURCE: U.S. Department of Education, National Center for Education Statistics, Higher Edu-cation General Information Survey (HEGIS), “Fall Enrollment in Colleges and Universities” sur-veys, 1967 through 1985; Integrated Postsecondary Education Data System (IPEDS), “FallEnrollment Survey” (IPEDS-EF:86–99); IPEDS Spring 2001 through Spring 2016, Fall Enroll-ment component; and Enrollment in Degree-Granting Institutions Projection Model, 2000through 2026. (This table was prepared February 2017.)

Projections of Education Statistics to 2026 65
Table 18. Total fall enrollment of first-time degree/certificate-seeking students in degree-granting postsecondary institutions, by attendance status, sex of student, and level and control of institution: 1955 through 2026
Year Total Full-time Part-time
Males Females 4-year 2-year
Total Full-time Part-time Total Full-time Part-time Public Private Public Private
1 2 3 4 5 6 7 8 9 10 11 12 13 14
19551 ............................... 670,013 — — 415,604 — — 254,409 — — 283,084 2 246,960 2 117,288 2 22,681 2
19561 ............................... 717,504 — — 442,903 — — 274,601 — — 292,743 2 261,951 2 137,406 2 25,404 2
19571 ............................... 723,879 — — 441,969 — — 281,910 — — 293,544 2 262,695 2 140,522 2 27,118 2
19581 ............................... 775,308 — — 465,422 — — 309,886 — — 328,242 2 272,117 2 146,379 2 28,570 2
19591 ............................... 821,520 — — 487,890 — — 333,630 — — 348,150 2 291,691 2 153,393 2 28,286 2
19601 ............................... 923,069 — — 539,512 — — 383,557 — — 395,884 2 313,209 2 181,860 2 32,116 2
19611 ............................... 1,018,361 — — 591,913 — — 426,448 — — 438,135 2 336,449 2 210,101 2 33,676 2
19621 ............................... 1,030,554 — — 598,099 — — 432,455 — — 445,191 2 324,923 2 224,537 2 35,903 2
19631 ............................... 1,046,424 — — 604,282 — — 442,142 — — — — — —19641 ............................... 1,224,840 — — 701,524 — — 523,316 — — 539,251 2 363,348 2 275,413 2 46,828 2
19651 ............................... 1,441,822 — — 829,215 — — 612,607 — — 642,233 2 398,792 2 347,788 2 53,009 2
1966................................. 1,554,337 — — 889,516 — — 664,821 — — 626,472 2 382,889 2 478,459 2 66,517 2
1967................................. 1,640,936 1,335,512 305,424 931,127 761,299 169,828 709,809 574,213 135,596 644,525 368,300 561,488 66,6231968................................. 1,892,849 1,470,653 422,196 1,082,367 847,005 235,362 810,482 623,648 186,834 724,377 378,052 718,562 71,8581969................................. 1,967,104 1,525,290 441,814 1,118,269 876,280 241,989 848,835 649,010 199,825 699,167 391,508 814,132 62,297
1970................................. 2,063,397 1,587,072 476,325 1,151,960 896,281 255,679 911,437 690,791 220,646 717,449 395,886 890,703 59,3591971................................. 2,119,018 1,606,036 512,982 1,170,518 895,715 274,803 948,500 710,321 238,179 704,052 384,695 971,295 58,9761972................................. 2,152,778 1,574,197 578,581 1,157,501 858,254 299,247 995,277 715,943 279,334 680,337 380,982 1,036,616 54,8431973................................. 2,226,041 1,607,269 618,772 1,182,173 867,314 314,859 1,043,868 739,955 303,913 698,777 378,994 1,089,182 59,0881974................................. 2,365,761 1,673,333 692,428 1,243,790 896,077 347,713 1,121,971 777,256 344,715 745,637 386,391 1,175,759 57,974
1975................................. 2,515,155 1,763,296 751,859 1,327,935 942,198 385,737 1,187,220 821,098 366,122 771,725 395,440 1,283,523 64,4671976................................. 2,347,014 1,662,333 684,681 1,170,326 854,597 315,729 1,176,688 807,736 368,952 717,373 413,961 1,152,944 62,7361977................................. 2,394,426 1,680,916 713,510 1,155,856 839,848 316,008 1,238,570 841,068 397,502 737,497 404,631 1,185,648 66,6501978................................. 2,389,627 1,650,848 738,779 1,141,777 817,294 324,483 1,247,850 833,554 414,296 736,703 406,669 1,173,544 72,7111979................................. 2,502,896 1,706,732 796,164 1,179,846 840,315 339,531 1,323,050 866,417 456,633 760,119 415,126 1,253,854 73,797
1980................................. 2,587,644 1,749,928 837,716 1,218,961 862,458 356,503 1,368,683 887,470 481,213 765,395 417,937 1,313,591 90,721 3
1981................................. 2,595,421 1,737,714 857,707 1,217,680 851,833 365,847 1,377,741 885,881 491,860 754,007 419,257 1,318,436 103,721 3
1982................................. 2,505,466 1,688,620 816,846 1,199,237 837,223 362,014 1,306,229 851,397 454,832 730,775 404,252 1,254,193 116,246 3
1983................................. 2,443,703 1,678,071 765,632 1,159,049 824,609 334,440 1,284,654 853,462 431,192 728,244 403,882 1,189,869 121,7081984................................. 2,356,898 1,613,185 743,713 1,112,303 786,099 326,204 1,244,595 827,086 417,509 713,790 402,959 1,130,311 109,838
1985................................. 2,292,222 1,602,038 690,184 1,075,736 774,858 300,878 1,216,486 827,180 389,306 717,199 398,556 1,060,275 116,1921986................................. 2,219,208 1,589,451 629,757 1,046,527 768,856 277,671 1,172,681 820,595 352,086 719,974 391,673 990,973 116,5881987................................. 2,246,359 1,626,719 619,640 1,046,615 779,226 267,389 1,199,744 847,493 352,251 757,833 405,113 979,820 103,5931988................................. 2,378,803 1,698,927 679,876 1,100,026 807,319 292,707 1,278,777 891,608 387,169 783,358 425,907 1,048,914 120,6241989................................. 2,341,035 1,656,594 684,441 1,094,750 791,295 303,455 1,246,285 865,299 380,986 762,217 413,836 1,048,529 116,453
1990................................. 2,256,624 1,617,118 639,506 1,045,191 771,372 273,819 1,211,433 845,746 365,687 727,264 400,120 1,041,097 88,1431991................................. 2,277,920 1,652,983 624,937 1,068,433 798,043 270,390 1,209,487 854,940 354,547 717,697 392,904 1,070,048 97,2711992................................. 2,184,113 1,603,737 580,376 1,013,058 760,290 252,768 1,171,055 843,447 327,608 697,393 408,306 993,074 85,3401993................................. 2,160,710 1,608,274 552,436 1,007,647 762,240 245,407 1,153,063 846,034 307,029 702,273 410,688 973,545 74,2041994................................. 2,133,205 1,603,106 530,099 984,558 751,081 233,477 1,148,647 852,025 296,622 709,042 405,917 952,468 65,778
1995................................. 2,168,831 1,646,812 522,019 1,001,052 767,185 233,867 1,167,779 879,627 288,152 731,836 419,025 954,595 63,3751996................................. 2,274,319 1,739,852 534,467 1,046,662 805,982 240,680 1,227,657 933,870 293,787 741,164 427,442 989,536 116,1771997................................. 2,219,255 1,733,512 485,743 1,026,058 806,054 220,004 1,193,197 927,458 265,739 755,362 442,397 923,954 97,5421998................................. 2,212,593 1,775,412 437,181 1,022,656 825,577 197,079 1,189,937 949,835 240,102 792,772 460,948 858,417 100,4561999................................. 2,357,590 1,849,741 507,849 1,094,539 865,545 228,994 1,263,051 984,196 278,855 819,503 474,223 955,499 108,365
2000................................. 2,427,551 1,918,093 509,458 1,123,948 894,432 229,516 1,303,603 1,023,661 279,942 842,228 498,532 952,175 134,6162001................................. 2,497,078 1,989,179 507,899 1,152,837 926,393 226,444 1,344,241 1,062,786 281,455 866,619 508,030 988,726 133,7032002................................. 2,570,611 2,053,065 517,546 1,170,609 945,938 224,671 1,400,002 1,107,127 292,875 886,297 517,621 1,037,267 129,4262003................................. 2,591,754 2,102,394 489,360 1,175,856 965,075 210,781 1,415,898 1,137,319 278,579 918,602 537,726 1,004,428 130,9982004................................. 2,630,243 2,147,546 482,697 1,190,268 981,591 208,677 1,439,975 1,165,955 274,020 925,249 562,485 1,009,082 133,427
2005................................. 2,657,338 2,189,884 467,454 1,200,055 995,610 204,445 1,457,283 1,194,274 263,009 953,903 606,712 977,224 119,4992006................................. 2,707,213 2,219,853 487,360 1,228,665 1,015,585 213,080 1,478,548 1,204,268 274,280 990,262 598,412 1,013,080 105,4592007................................. 2,776,168 2,293,855 482,313 1,267,030 1,052,600 214,430 1,509,138 1,241,255 267,883 1,023,543 633,296 1,016,262 103,0672008................................. 3,024,723 2,427,740 596,983 1,389,302 1,115,500 273,802 1,635,421 1,312,240 323,181 1,053,838 673,581 1,186,576 110,7282009................................. 3,156,882 2,534,440 622,442 1,464,424 1,177,119 287,305 1,692,458 1,357,321 335,137 1,090,980 658,808 1,275,974 131,120
2010................................. 3,156,727 2,533,636 623,091 1,461,016 1,171,090 289,926 1,695,711 1,362,546 333,165 1,110,601 674,573 1,238,491 133,0622011................................. 3,091,496 2,479,155 612,341 1,424,140 1,140,843 283,297 1,667,356 1,338,312 329,044 1,131,091 656,864 1,195,083 108,4582012................................. 2,994,187 2,408,063 586,124 1,387,316 1,115,266 272,050 1,606,871 1,292,797 314,074 1,128,344 642,716 1,137,927 85,2002013................................. 2,985,366 2,415,969 569,397 1,383,852 1,117,525 266,327 1,601,514 1,298,444 303,070 1,144,102 633,184 1,126,978 81,1022014................................. 2,925,026 2,381,676 543,350 1,354,494 1,099,039 255,455 1,570,532 1,282,637 287,895 1,170,274 612,106 1,070,700 71,946
2015................................. 2,880,966 2,366,068 514,898 1,337,696 1,095,783 241,913 1,543,270 1,270,285 272,985 1,190,426 599,202 1,029,032 62,30620164 ............................... 2,921,000 — — 1,359,000 — — 1,562,000 — — — — — —20174 ............................... 2,952,000 — — 1,361,000 — — 1,591,000 — — — — — —20184 ............................... 2,991,000 — — 1,375,000 — — 1,616,000 — — — — — —20194 ............................... 3,037,000 — — 1,393,000 — — 1,644,000 — — — — — —
20204 ............................... 3,084,000 — — 1,413,000 — — 1,671,000 — — — — — —20214 ............................... 3,127,000 — — 1,430,000 — — 1,697,000 — — — — — —20224 ............................... 3,159,000 — — 1,443,000 — — 1,716,000 — — — — — —20234 ............................... 3,192,000 — — 1,456,000 — — 1,736,000 — — — — — —20244 ............................... 3,223,000 — — 1,468,000 — — 1,755,000 — — — — — —
20254 ............................... 3,250,000 — — 1,478,000 — — 1,771,000 — — — — — —20264 ............................... 3,269,000 — — 1,486,000 — — 1,783,000 — — — — — —
—Not available. 1Excludes first-time degree/certificate-seeking students in occupational programs not creditabletowards a bachelor’s degree. 2Data for 2-year branches of 4-year college systems are aggregated with the 4-year institutions. 3Large increases are due to the addition of schools accredited by the Accrediting Commissionof Career Schools and Colleges of Technology.4Projected.NOTE: Data through 1995 are for institutions of higher education, while later data are fordegree-granting institutions. Degree-granting institutions grant associate’s or higher degreesand participate in Title IV federal financial aid programs. The degree-granting classification is
very similar to the earlier higher education classification, but it includes more 2-year collegesand excludes a few higher education institutions that did not grant degrees. Alaska and Hawaiiare included in all years. Some data have been revised from previously published figures. SOURCE: U.S. Department of Education, National Center for Education Statistics, BiennialSurvey of Education in the United States; Opening Fall Enrollment in Higher Education, 1963through 1965; Higher Education General Information Survey (HEGIS), “Fall Enrollment in Col-leges and Universities” surveys, 1966 through 1985; Integrated Postsecondary Education DataSystem (IPEDS), “Fall Enrollment Survey” (IPEDS-EF:86–99); IPEDS Spring 2001 throughSpring 2016, Fall Enrollment component; and First-Time Freshmen Projection Model, 1980through 2026. (This table was prepared February 2017.)
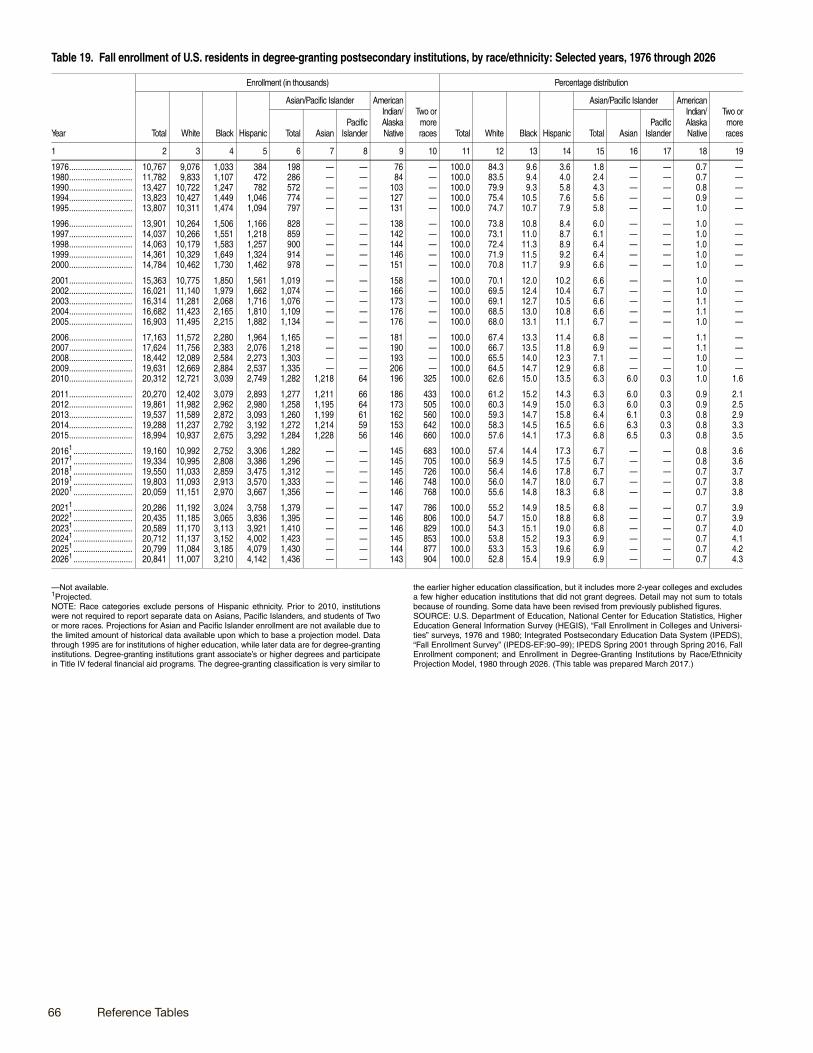
66 Reference Tables
Table 19. Fall enrollment of U.S. residents in degree-granting postsecondary institutions, by race/ethnicity: Selected years, 1976 through 2026
Year
Enrollment (in thousands) Percentage distribution
Total White Black Hispanic
Asian/Pacific Islander AmericanIndian/AlaskaNative
Two ormoreraces Total White Black Hispanic
Asian/Pacific Islander AmericanIndian/AlaskaNative
Two ormoreracesTotal Asian
PacificIslander Total Asian
PacificIslander
1 2 3 4 5 6 7 8 9 10 11 12 13 14 15 16 17 18 19
1976............................. 10,767 9,076 1,033 384 198 — — 76 — 100.0 84.3 9.6 3.6 1.8 — — 0.7 —1980............................. 11,782 9,833 1,107 472 286 — — 84 — 100.0 83.5 9.4 4.0 2.4 — — 0.7 —1990............................. 13,427 10,722 1,247 782 572 — — 103 — 100.0 79.9 9.3 5.8 4.3 — — 0.8 —1994............................. 13,823 10,427 1,449 1,046 774 — — 127 — 100.0 75.4 10.5 7.6 5.6 — — 0.9 —1995............................. 13,807 10,311 1,474 1,094 797 — — 131 — 100.0 74.7 10.7 7.9 5.8 — — 1.0 —
1996............................. 13,901 10,264 1,506 1,166 828 — — 138 — 100.0 73.8 10.8 8.4 6.0 — — 1.0 —1997............................. 14,037 10,266 1,551 1,218 859 — — 142 — 100.0 73.1 11.0 8.7 6.1 — — 1.0 —1998............................. 14,063 10,179 1,583 1,257 900 — — 144 — 100.0 72.4 11.3 8.9 6.4 — — 1.0 —1999............................. 14,361 10,329 1,649 1,324 914 — — 146 — 100.0 71.9 11.5 9.2 6.4 — — 1.0 —2000............................. 14,784 10,462 1,730 1,462 978 — — 151 — 100.0 70.8 11.7 9.9 6.6 — — 1.0 —
2001............................. 15,363 10,775 1,850 1,561 1,019 — — 158 — 100.0 70.1 12.0 10.2 6.6 — — 1.0 —2002............................. 16,021 11,140 1,979 1,662 1,074 — — 166 — 100.0 69.5 12.4 10.4 6.7 — — 1.0 —2003............................. 16,314 11,281 2,068 1,716 1,076 — — 173 — 100.0 69.1 12.7 10.5 6.6 — — 1.1 —2004............................. 16,682 11,423 2,165 1,810 1,109 — — 176 — 100.0 68.5 13.0 10.8 6.6 — — 1.1 —2005............................. 16,903 11,495 2,215 1,882 1,134 — — 176 — 100.0 68.0 13.1 11.1 6.7 — — 1.0 —
2006............................. 17,163 11,572 2,280 1,964 1,165 — — 181 — 100.0 67.4 13.3 11.4 6.8 — — 1.1 —2007............................. 17,624 11,756 2,383 2,076 1,218 — — 190 — 100.0 66.7 13.5 11.8 6.9 — — 1.1 —2008............................. 18,442 12,089 2,584 2,273 1,303 — — 193 — 100.0 65.5 14.0 12.3 7.1 — — 1.0 —2009............................. 19,631 12,669 2,884 2,537 1,335 — — 206 — 100.0 64.5 14.7 12.9 6.8 — — 1.0 —2010............................. 20,312 12,721 3,039 2,749 1,282 1,218 64 196 325 100.0 62.6 15.0 13.5 6.3 6.0 0.3 1.0 1.6
2011............................. 20,270 12,402 3,079 2,893 1,277 1,211 66 186 433 100.0 61.2 15.2 14.3 6.3 6.0 0.3 0.9 2.12012............................. 19,861 11,982 2,962 2,980 1,258 1,195 64 173 505 100.0 60.3 14.9 15.0 6.3 6.0 0.3 0.9 2.52013............................. 19,537 11,589 2,872 3,093 1,260 1,199 61 162 560 100.0 59.3 14.7 15.8 6.4 6.1 0.3 0.8 2.92014............................. 19,288 11,237 2,792 3,192 1,272 1,214 59 153 642 100.0 58.3 14.5 16.5 6.6 6.3 0.3 0.8 3.32015............................. 18,994 10,937 2,675 3,292 1,284 1,228 56 146 660 100.0 57.6 14.1 17.3 6.8 6.5 0.3 0.8 3.5
20161 ........................... 19,160 10,992 2,752 3,306 1,282 — — 145 683 100.0 57.4 14.4 17.3 6.7 — — 0.8 3.620171 ........................... 19,334 10,995 2,808 3,386 1,296 — — 145 705 100.0 56.9 14.5 17.5 6.7 — — 0.8 3.620181 ........................... 19,550 11,033 2,859 3,475 1,312 — — 145 726 100.0 56.4 14.6 17.8 6.7 — — 0.7 3.720191 ........................... 19,803 11,093 2,913 3,570 1,333 — — 146 748 100.0 56.0 14.7 18.0 6.7 — — 0.7 3.820201 ........................... 20,059 11,151 2,970 3,667 1,356 — — 146 768 100.0 55.6 14.8 18.3 6.8 — — 0.7 3.8
20211 ........................... 20,286 11,192 3,024 3,758 1,379 — — 147 786 100.0 55.2 14.9 18.5 6.8 — — 0.7 3.920221 ........................... 20,435 11,185 3,065 3,836 1,395 — — 146 806 100.0 54.7 15.0 18.8 6.8 — — 0.7 3.920231 ........................... 20,589 11,170 3,113 3,921 1,410 — — 146 829 100.0 54.3 15.1 19.0 6.8 — — 0.7 4.020241 ........................... 20,712 11,137 3,152 4,002 1,423 — — 145 853 100.0 53.8 15.2 19.3 6.9 — — 0.7 4.120251 ........................... 20,799 11,084 3,185 4,079 1,430 — — 144 877 100.0 53.3 15.3 19.6 6.9 — — 0.7 4.220261 ........................... 20,841 11,007 3,210 4,142 1,436 — — 143 904 100.0 52.8 15.4 19.9 6.9 — — 0.7 4.3
—Not available.1Projected.NOTE: Race categories exclude persons of Hispanic ethnicity. Prior to 2010, institutionswere not required to report separate data on Asians, Pacific Islanders, and students of Twoor more races. Projections for Asian and Pacific Islander enrollment are not available due tothe limited amount of historical data available upon which to base a projection model. Datathrough 1995 are for institutions of higher education, while later data are for degree-grantinginstitutions. Degree-granting institutions grant associate’s or higher degrees and participatein Title IV federal financial aid programs. The degree-granting classification is very similar to
the earlier higher education classification, but it includes more 2-year colleges and excludesa few higher education institutions that did not grant degrees. Detail may not sum to totalsbecause of rounding. Some data have been revised from previously published figures.SOURCE: U.S. Department of Education, National Center for Education Statistics, HigherEducation General Information Survey (HEGIS), “Fall Enrollment in Colleges and Universi-ties” surveys, 1976 and 1980; Integrated Postsecondary Education Data System (IPEDS),“Fall Enrollment Survey” (IPEDS-EF:90–99); IPEDS Spring 2001 through Spring 2016, FallEnrollment component; and Enrollment in Degree-Granting Institutions by Race/EthnicityProjection Model, 1980 through 2026. (This table was prepared March 2017.)

Projections of Education Statistics to 2026 67
Table 20. Full-time-equivalent fall enrollment in degree-granting postsecondary institutions, by control and level of institution: 1967 through 2026
Year
All institutions Public institutions
Private institutions
Total
4-year 2-year
Total 4-year 2-year Total 4-year 2-year Total Nonprofit For-profit Total Nonprofit For-profit
1 2 3 4 5 6 7 8 9 10 11 12 13 14
1967............................... 5,499,360 4,448,302 1,051,058 3,777,701 2,850,432 927,269 1,721,659 1,597,870 — — 123,789 — —1968............................... 5,977,768 4,729,522 1,248,246 4,248,639 3,128,057 1,120,582 1,729,129 1,601,465 — — 127,664 — —1969............................... 6,333,357 4,899,034 1,434,323 4,577,353 3,259,323 1,318,030 1,756,004 1,639,711 — — 116,293 — —
1970............................... 6,737,819 5,145,422 1,592,397 4,953,144 3,468,569 1,484,575 1,784,675 1,676,853 — — 107,822 — —1971............................... 7,148,558 5,357,647 1,790,911 5,344,402 3,660,626 1,683,776 1,804,156 1,697,021 — — 107,135 — —1972............................... 7,253,757 5,406,833 1,846,924 5,452,854 3,706,238 1,746,616 1,800,903 1,700,595 — — 100,308 — —1973............................... 7,453,463 5,439,230 2,014,233 5,629,563 3,721,037 1,908,526 1,823,900 1,718,193 — — 105,707 — —1974............................... 7,805,452 5,606,247 2,199,205 5,944,799 3,847,543 2,097,256 1,860,653 1,758,704 — — 101,949 — —
1975............................... 8,479,698 5,900,408 2,579,290 6,522,319 4,056,502 2,465,817 1,957,379 1,843,906 — — 113,473 — —1976............................... 8,312,502 5,848,001 2,464,501 6,349,903 3,998,450 2,351,453 1,962,599 1,849,551 — — 113,048 — —1977............................... 8,415,339 5,935,076 2,480,263 6,396,476 4,039,071 2,357,405 2,018,863 1,896,005 — — 122,858 — —1978............................... 8,348,482 5,932,357 2,416,125 6,279,199 3,996,126 2,283,073 2,069,283 1,936,231 — — 133,052 — —1979............................... 8,487,317 6,016,072 2,471,245 6,392,617 4,059,304 2,333,313 2,094,700 1,956,768 — — 137,932 — —
1980............................... 8,819,013 6,161,372 2,657,641 6,642,294 4,158,267 2,484,027 2,176,719 2,003,105 — — 173,614 1 — —1981............................... 9,014,521 6,249,847 2,764,674 6,781,300 4,208,506 2,572,794 2,233,221 2,041,341 — — 191,880 1 — —1982............................... 9,091,648 6,248,923 2,842,725 6,850,589 4,220,648 2,629,941 2,241,059 2,028,275 — — 212,784 1 — —1983............................... 9,166,398 6,325,222 2,841,176 6,881,479 4,265,807 2,615,672 2,284,919 2,059,415 — — 225,504 — —1984............................... 8,951,695 6,292,711 2,658,984 6,684,664 4,237,895 2,446,769 2,267,031 2,054,816 — — 212,215 — —
1985............................... 8,943,433 6,294,339 2,649,094 6,667,781 4,239,622 2,428,159 2,275,652 2,054,717 — — 220,935 — —1986............................... 9,064,165 6,360,325 2,703,842 6,778,045 4,295,494 2,482,551 2,286,122 2,064,831 — — 221,291 2 — —1987............................... 9,229,736 6,486,504 2,743,230 6,937,690 4,395,728 2,541,961 2,292,045 2,090,776 — — 201,269 2 — —1988............................... 9,464,271 6,664,146 2,800,125 7,096,905 4,505,774 2,591,131 2,367,366 2,158,372 — — 208,994 — —1989............................... 9,780,881 6,813,602 2,967,279 7,371,590 4,619,828 2,751,762 2,409,291 2,193,774 — — 215,517 — —
1990............................... 9,983,436 6,968,008 3,015,428 7,557,982 4,740,049 2,817,933 2,425,454 2,227,959 2,177,668 50,291 197,495 72,785 124,7101991............................... 10,360,606 7,081,454 3,279,152 7,862,845 4,795,704 3,067,141 2,497,761 2,285,750 2,223,463 62,287 212,011 72,545 139,4661992............................... 10,436,776 7,129,379 3,307,397 7,911,701 4,797,884 3,113,817 2,525,075 2,331,495 2,267,373 64,122 193,580 66,647 126,9331993............................... 10,351,415 7,120,921 3,230,494 7,812,394 4,765,983 3,046,411 2,539,021 2,354,938 2,282,643 72,295 184,083 70,469 113,6141994............................... 10,348,072 7,137,341 3,210,731 7,784,396 4,749,524 3,034,872 2,563,676 2,387,817 2,301,063 86,754 175,859 69,578 106,281
1995............................... 10,334,956 7,172,844 3,162,112 7,751,815 4,757,223 2,994,592 2,583,141 2,415,621 2,328,730 86,891 167,520 62,416 105,1041996............................... 10,481,886 7,234,541 3,247,345 7,794,895 4,767,117 3,027,778 2,686,991 2,467,424 2,353,561 113,863 219,567 63,954 155,6131997............................... 10,615,028 7,338,794 3,276,234 7,869,764 4,813,849 3,055,915 2,745,264 2,524,945 2,389,627 135,318 220,319 61,761 158,5581998............................... 10,698,775 7,467,828 3,230,947 7,880,135 4,868,857 3,011,278 2,818,640 2,598,971 2,436,188 162,783 219,669 56,834 162,8351999............................... 10,974,519 7,634,247 3,340,272 8,059,240 4,949,851 3,109,389 2,915,279 2,684,396 2,488,140 196,256 230,883 53,956 176,927
2000............................... 11,267,025 7,795,139 3,471,886 8,266,932 5,025,588 3,241,344 3,000,093 2,769,551 2,549,676 219,875 230,542 51,503 179,0392001............................... 11,765,945 8,087,980 3,677,965 8,639,154 5,194,035 3,445,119 3,126,791 2,893,945 2,612,833 281,112 232,846 41,037 191,8092002............................... 12,331,319 8,439,064 3,892,255 9,061,411 5,406,283 3,655,128 3,269,908 3,032,781 2,699,702 333,079 237,127 40,110 197,0172003............................... 12,687,597 8,744,188 3,943,409 9,240,724 5,557,680 3,683,044 3,446,873 3,186,508 2,776,850 409,658 260,365 36,815 223,5502004............................... 13,000,994 9,018,024 3,982,970 9,348,081 5,640,650 3,707,431 3,652,913 3,377,374 2,837,251 540,123 275,539 34,202 241,337
2005............................... 13,200,790 9,261,634 3,939,156 9,390,216 5,728,327 3,661,889 3,810,574 3,533,307 2,878,354 654,953 277,267 34,729 242,5382006............................... 13,403,097 9,456,166 3,946,931 9,503,558 5,824,768 3,678,790 3,899,539 3,631,398 2,936,172 695,226 268,141 31,203 236,9382007............................... 13,782,702 9,769,560 4,013,142 9,739,709 5,994,230 3,745,479 4,042,993 3,775,330 2,993,729 781,601 267,663 26,134 241,5292008............................... 14,394,238 10,169,454 4,224,784 10,061,812 6,139,525 3,922,287 4,332,426 4,029,929 3,060,308 969,621 302,497 28,065 274,4322009............................... 15,379,473 10,695,816 4,683,657 10,746,637 6,452,414 4,294,223 4,632,836 4,243,402 3,153,294 1,090,108 389,434 27,964 361,470
2010............................... 15,947,474 11,129,239 4,818,235 11,018,756 6,635,799 4,382,957 4,928,718 4,493,440 3,235,149 1,258,291 435,278 26,920 408,3582011............................... 15,892,792 11,261,845 4,630,947 10,954,754 6,734,116 4,220,638 4,938,038 4,527,729 3,285,711 1,242,018 410,309 34,267 376,0422012............................... 15,593,434 11,229,774 4,363,660 10,781,798 6,764,184 4,017,614 4,811,636 4,465,590 3,309,242 1,156,348 346,046 32,684 313,3622013............................... 15,410,058 11,183,239 4,226,819 10,697,939 6,790,930 3,907,009 4,712,119 4,392,309 3,337,799 1,054,510 319,810 27,313 292,4972014............................... 15,262,196 11,237,953 4,024,243 10,624,769 6,892,523 3,732,246 4,637,427 4,345,430 3,362,197 983,233 291,997 25,797 266,200
2015............................... 15,076,819 11,227,177 3,849,642 10,568,724 6,971,897 3,596,827 4,508,095 4,255,280 3,400,612 854,668 252,815 41,619 211,19620163 ............................. 15,212,000 11,015,000 4,197,000 10,754,000 6,838,000 3,916,000 4,458,000 4,177,000 — — 281,000 — —20173 ............................. 15,401,000 11,158,000 4,243,000 10,882,000 6,924,000 3,958,000 4,519,000 4,233,000 — — 285,000 — —20183 ............................. 15,598,000 11,295,000 4,302,000 11,022,000 7,009,000 4,013,000 4,575,000 4,286,000 — — 289,000 — —20193 ............................. 15,830,000 11,461,000 4,369,000 11,187,000 7,111,000 4,075,000 4,644,000 4,350,000 — — 294,000 — —
20203 ............................. 16,090,000 11,657,000 4,432,000 11,366,000 7,232,000 4,134,000 4,724,000 4,426,000 — — 298,000 — —20213 ............................. 16,323,000 11,830,000 4,493,000 11,528,000 7,338,000 4,190,000 4,795,000 4,493,000 — — 302,000 — —20223 ............................. 16,485,000 11,945,000 4,541,000 11,642,000 7,407,000 4,235,000 4,843,000 4,537,000 — — 306,000 — —20233 ............................. 16,662,000 12,072,000 4,591,000 11,767,000 7,486,000 4,282,000 4,895,000 4,586,000 — — 309,000 — —20243 ............................. 16,808,000 12,173,000 4,635,000 11,873,000 7,550,000 4,323,000 4,935,000 4,623,000 — — 312,000 — —
20253 ............................. 16,914,000 12,242,000 4,672,000 11,953,000 7,594,000 4,358,000 4,962,000 4,648,000 — — 314,000 — —20263 ............................. 16,990,000 12,292,000 4,698,000 12,009,000 7,626,000 4,383,000 4,981,000 4,666,000 — — 315,000 — —
—Not available.1Large increases are due to the addition of schools accredited by the Accrediting Commis-sion of Career Schools and Colleges of Technology. 2Because of imputation techniques, data are not consistent with figures for other years. 3Projected.NOTE: Full-time-equivalent enrollment is the number of full-time students enrolled, plus thefull-time equivalent of the part-time students. Data through 1995 are for institutions of highereducation, while later data are for degree-granting institutions. Degree-granting institutionsgrant associate’s or higher degrees and participate in Title IV federal financial aid programs.The degree-granting classification is very similar to the earlier higher education classification,
but it includes more 2-year colleges and excludes a few higher education institutions that didnot grant degrees. Some data have been revised from previously published figures. Detailmay not sum to totals because of rounding.SOURCE: U.S. Department of Education, National Center for Education Statistics, HigherEducation General Information Survey (HEGIS), “Fall Enrollment in Colleges and Universi-ties” surveys, 1967 through 1985; Integrated Postsecondary Education Data System(IPEDS), “Fall Enrollment Survey” (IPEDS-EF:86–99); IPEDS Spring 2001 through Spring2016, Fall Enrollment component; and Enrollment in Degree-Granting Institutions ProjectionModel, 2000 through 2026. (This table was prepared February 2017.)

68 Reference Tables
Table 21. Degrees conferred by postsecondary institutions, by level of degree and sex of student: Selected years, 1869–70 through 2026–27
Year
Associate’s degrees Bachelor’s degrees Master’s degrees Doctor’s degrees1
Total Males FemalesPercentfemale Total Males Females
Percentfemale Total Males Females
Percentfemale Total Males Females
Percentfemale
1 2 3 4 5 6 7 8 9 10 11 12 13 14 15 16 17
1869–70.................. — — — — 9,371 2 7,993 2 1,378 2 14.7 0 0 0 — 1 1 0 0.01879–80.................. — — — — 12,896 2 10,411 2 2,485 2 19.3 879 868 11 1.3 54 51 3 5.61889–90.................. — — — — 15,539 2 12,857 2 2,682 2 17.3 1,015 821 194 19.1 149 147 2 1.31899–1900.............. — — — — 27,410 2 22,173 2 5,237 2 19.1 1,583 1,280 303 19.1 382 359 23 6.01909–10.................. — — — — 37,199 2 28,762 2 8,437 2 22.7 2,113 1,555 558 26.4 443 399 44 9.9
1919–20.................. — — — — 48,622 2 31,980 2 16,642 2 34.2 4,279 2,985 1,294 30.2 615 522 93 15.11929–30.................. — — — — 122,484 2 73,615 2 48,869 2 39.9 14,969 8,925 6,044 40.4 2,299 1,946 353 15.41939–40.................. — — — — 186,500 2 109,546 2 76,954 2 41.3 26,731 16,508 10,223 38.2 3,290 2,861 429 13.01949–50.................. — — — — 432,058 2 328,841 2 103,217 2 23.9 58,183 41,220 16,963 29.2 6,420 5,804 616 9.61959–60.................. — — — — 392,440 2 254,063 2 138,377 2 35.3 74,435 50,898 23,537 31.6 9,829 8,801 1,028 10.51969–70.................. 206,023 117,432 88,591 43.0 792,316 451,097 341,219 43.1 213,589 130,799 82,790 38.8 59,486 53,792 5,694 9.6
1970–71.................. 252,311 144,144 108,167 42.9 839,730 475,594 364,136 43.4 235,564 143,083 92,481 39.3 64,998 58,137 6,861 10.61971–72.................. 292,014 166,227 125,787 43.1 887,273 500,590 386,683 43.6 257,201 155,010 102,191 39.7 71,206 63,353 7,853 11.01972–73.................. 316,174 175,413 140,761 44.5 922,362 518,191 404,171 43.8 268,654 159,569 109,085 40.6 79,512 69,959 9,553 12.01973–74.................. 343,924 188,591 155,333 45.2 945,776 527,313 418,463 44.2 282,074 162,606 119,468 42.4 82,591 71,131 11,460 13.91974–75.................. 360,171 191,017 169,154 47.0 922,933 504,841 418,092 45.3 297,545 166,318 131,227 44.1 84,904 71,025 13,879 16.3
1975–76.................. 391,454 209,996 181,458 46.4 925,746 504,925 420,821 45.5 317,477 172,519 144,958 45.7 91,007 73,888 17,119 18.81976–77.................. 406,377 210,842 195,535 48.1 919,549 495,545 424,004 46.1 323,025 173,090 149,935 46.4 91,730 72,209 19,521 21.31977–78.................. 412,246 204,718 207,528 50.3 921,204 487,347 433,857 47.1 317,987 166,857 151,130 47.5 92,345 70,283 22,062 23.91978–79.................. 402,702 192,091 210,611 52.3 921,390 477,344 444,046 48.2 307,686 159,111 148,575 48.3 94,971 70,452 24,519 25.81979–80.................. 400,910 183,737 217,173 54.2 929,417 473,611 455,806 49.0 305,196 156,882 148,314 48.6 95,631 69,526 26,105 27.3
1980–81.................. 416,377 188,638 227,739 54.7 935,140 469,883 465,257 49.8 302,637 152,979 149,658 49.5 98,016 69,567 28,449 29.01981–82.................. 434,526 196,944 237,582 54.7 952,998 473,364 479,634 50.3 302,447 151,349 151,098 50.0 97,838 68,630 29,208 29.91982–83.................. 449,620 203,991 245,629 54.6 969,510 479,140 490,370 50.6 296,415 150,092 146,323 49.4 99,335 67,757 31,578 31.81983–84.................. 452,240 202,704 249,536 55.2 974,309 482,319 491,990 50.5 291,141 149,268 141,873 48.7 100,799 67,769 33,030 32.81984–85.................. 454,712 202,932 251,780 55.4 979,477 482,528 496,949 50.7 293,472 149,276 144,196 49.1 100,785 66,269 34,516 34.2
1985–86.................. 446,047 196,166 249,881 56.0 987,823 485,923 501,900 50.8 295,850 149,373 146,477 49.5 100,280 65,215 35,065 35.01986–87.................. 436,304 190,839 245,465 56.3 991,264 480,782 510,482 51.5 296,530 147,063 149,467 50.4 98,477 62,790 35,687 36.21987–88.................. 435,085 190,047 245,038 56.3 994,829 477,203 517,626 52.0 305,783 150,243 155,540 50.9 99,139 63,019 36,120 36.41988–89.................. 436,764 186,316 250,448 57.3 1,018,755 483,346 535,409 52.6 316,626 153,993 162,633 51.4 100,571 63,055 37,516 37.31989–90.................. 455,102 191,195 263,907 58.0 1,051,344 491,696 559,648 53.2 330,152 158,052 172,100 52.1 103,508 63,963 39,545 38.2
1990–91.................. 481,720 198,634 283,086 58.8 1,094,538 504,045 590,493 53.9 342,863 160,842 182,021 53.1 105,547 64,242 41,305 39.11991–92.................. 504,231 207,481 296,750 58.9 1,136,553 520,811 615,742 54.2 358,089 165,867 192,222 53.7 109,554 66,603 42,951 39.21992–93.................. 514,756 211,964 302,792 58.8 1,165,178 532,881 632,297 54.3 375,032 173,354 201,678 53.8 112,072 67,130 44,942 40.11993–94.................. 530,632 215,261 315,371 59.4 1,169,275 532,422 636,853 54.5 393,037 180,571 212,466 54.1 112,636 66,773 45,863 40.71994–95.................. 539,691 218,352 321,339 59.5 1,160,134 526,131 634,003 54.6 403,609 183,043 220,566 54.6 114,266 67,324 46,942 41.1
1995–96.................. 555,216 219,514 335,702 60.5 1,164,792 522,454 642,338 55.1 412,180 183,481 228,699 55.5 115,507 67,189 48,318 41.81996–97.................. 571,226 223,948 347,278 60.8 1,172,879 520,515 652,364 55.6 425,260 185,270 239,990 56.4 118,747 68,387 50,360 42.41997–98.................. 558,555 217,613 340,942 61.0 1,184,406 519,956 664,450 56.1 436,037 188,718 247,319 56.7 118,735 67,232 51,503 43.41998–99.................. 564,984 220,508 344,476 61.0 1,202,239 519,961 682,278 56.8 446,038 190,230 255,808 57.4 116,700 65,340 51,360 44.01999–2000.............. 564,933 224,721 340,212 60.2 1,237,875 530,367 707,508 57.2 463,185 196,129 267,056 57.7 118,736 64,930 53,806 45.3
2000–01.................. 578,865 231,645 347,220 60.0 1,244,171 531,840 712,331 57.3 473,502 197,770 275,732 58.2 119,585 64,171 55,414 46.32001–02.................. 595,133 238,109 357,024 60.0 1,291,900 549,816 742,084 57.4 487,313 202,604 284,709 58.4 119,663 62,731 56,932 47.62002–03.................. 634,016 253,451 380,565 60.0 1,348,811 573,258 775,553 57.5 518,699 215,172 303,527 58.5 121,579 62,730 58,849 48.42003–04.................. 665,301 260,033 405,268 60.9 1,399,542 595,425 804,117 57.5 564,272 233,056 331,216 58.7 126,087 63,981 62,106 49.32004–05.................. 696,660 267,536 429,124 61.6 1,439,264 613,000 826,264 57.4 580,151 237,155 342,996 59.1 134,387 67,257 67,130 50.0
2005–06.................. 713,066 270,095 442,971 62.1 1,485,242 630,600 854,642 57.5 599,731 241,656 358,075 59.7 138,056 68,912 69,144 50.12006–07.................. 728,114 275,187 452,927 62.2 1,524,092 649,570 874,522 57.4 610,597 242,189 368,408 60.3 144,690 71,308 73,382 50.72007–08.................. 750,164 282,521 467,643 62.3 1,563,069 667,928 895,141 57.3 630,666 250,169 380,497 60.3 149,378 73,453 75,925 50.82008–09.................. 787,243 298,066 489,177 62.1 1,601,399 685,422 915,977 57.2 662,082 263,515 398,567 60.2 154,564 75,674 78,890 51.02009–10.................. 848,856 322,747 526,109 62.0 1,649,919 706,660 943,259 57.2 693,313 275,317 417,996 60.3 158,590 76,610 81,980 51.7
2010–11.................. 943,506 361,408 582,098 61.7 1,716,053 734,159 981,894 57.2 730,922 291,680 439,242 60.1 163,827 79,672 84,155 51.42011–12.................. 1,021,718 393,479 628,239 61.5 1,792,163 765,772 1,026,391 57.3 755,967 302,484 453,483 60.0 170,217 82,670 87,547 51.42012–13.................. 1,007,427 389,195 618,232 61.4 1,840,381 787,408 1,052,973 57.2 751,718 301,552 450,166 59.9 175,026 85,080 89,946 51.42013–14.................. 1,005,155 391,474 613,681 61.1 1,870,150 801,905 1,068,245 57.1 754,582 302,846 451,736 59.9 177,587 85,585 92,002 51.82014–15.................. 1,013,971 396,613 617,358 61.3 1,894,934 812,669 1,082,265 57.1 758,708 306,590 452,118 59.6 178,547 84,921 93,626 51.9
2015–163 ................ 999,000 394,000 605,000 60.6 1,892,000 812,000 1,081,000 57.1 769,000 312,000 457,000 59.4 180,000 85,000 95,000 52.82016–173 ................ 1,011,000 400,000 611,000 60.4 1,895,000 812,000 1,083,000 57.2 773,000 319,000 454,000 58.7 181,000 86,000 95,000 52.72017–183 ................ 1,032,000 399,000 632,000 61.3 1,900,000 811,000 1,090,000 57.3 790,000 325,000 465,000 58.8 183,000 86,000 97,000 52.92018–193 ................ 1,083,000 415,000 668,000 61.7 1,887,000 810,000 1,077,000 57.1 802,000 328,000 474,000 59.1 184,000 87,000 97,000 52.52019–203 ................ 1,110,000 420,000 690,000 62.2 1,913,000 812,000 1,101,000 57.6 818,000 333,000 485,000 59.3 186,000 88,000 98,000 52.8
2020–213 ................ 1,136,000 426,000 710,000 62.5 1,939,000 821,000 1,118,000 57.6 837,000 340,000 497,000 59.4 188,000 88,000 100,000 53.22021–223 ................ 1,164,000 433,000 731,000 62.8 1,966,000 831,000 1,135,000 57.7 857,000 347,000 509,000 59.4 190,000 88,000 102,000 53.52022–233 ................ 1,191,000 439,000 752,000 63.2 1,995,000 842,000 1,152,000 57.8 874,000 354,000 520,000 59.5 193,000 89,000 104,000 53.72023–243 ................ 1,217,000 445,000 772,000 63.4 2,022,000 853,000 1,169,000 57.8 890,000 359,000 531,000 59.7 196,000 90,000 106,000 53.92024–253 ................ 1,242,000 451,000 791,000 63.7 2,041,000 860,000 1,181,000 57.9 903,000 363,000 540,000 59.8 198,000 91,000 107,000 54.0
2025–263 ................ 1,266,000 456,000 810,000 64.0 2,062,000 868,000 1,195,000 57.9 913,000 364,000 548,000 60.1 200,000 92,000 108,000 54.22026–273 ................ 1,289,000 462,000 827,000 64.2 2,081,000 875,000 1,207,000 58.0 922,000 365,000 557,000 60.4 201,000 92,000 109,000 54.4
—Not available. 1Includes Ph.D., Ed.D., and comparable degrees at the doctoral level. Includes most degreesformerly classified as first-professional, such as M.D., D.D.S., and law degrees.2Includes some degrees classified as master’s or doctor’s degrees in later years. 3Projected. NOTE: Data through 1994–95 are for institutions of higher education, while later data are fordegree-granting institutions. Degree-granting institutions grant associate’s or higher degrees
and participate in Title IV federal financial aid programs. Some data have been revised frompreviously published figures. Detail may not sum to totals because of rounding. SOURCE: U.S. Department of Education, National Center for Education Statistics, EarnedDegrees Conferred, 1869–70 through 1964–65; Higher Education General Information Survey(HEGIS), “Degrees and Other Formal Awards Conferred” surveys, 1965–66 through 1985–86;Integrated Postsecondary Education Data System (IPEDS), “Completions Survey” (IPEDS-C:87–99); IPEDS Fall 2000 through Fall 2015, Completions component; and Degrees Con-ferred Projection Model, 1980–81 through 2026–27. (This table was prepared March 2017.)

Projections of Education Statistics to 2026 69
Technical Appendixes

This page intentionally left blank.
Projections of Education Statistics to 2026 71
Appendix AIntroduction to Projection Methodology
A.0. INTRODUCTION TO PROJECTION METHODOLOGYContent of appendix ASince its inception in 1964, the Projections of Education Statistics series has been providing projections of key education statistics to policymakers, educators, researchers, the press, and the general public. This edition of Projections of Education Statistics is the 45th in the series.
Appendix A contains this introduction, which provides a general overview of the projection methodology, as well as six additional sections that discuss the specific methodology for the different statistics projected:
» A.0. Introduction to Projection Methodology;
» A.1. Elementary and Secondary Enrollment;
» A.2. Elementary and Secondary Teachers;
» A.3. High School Graduates;
» A.4. Expenditures for Public Elementary and Secondary Education;
» A.5. Enrollment in Degree-Granting Postsecondary Institutions; and
» A.6. Postsecondary Degrees Conferred.
This introduction
» outlines the two major techniques used to make the projections;
» summarizes key demographic and economic assumptions underlying the projections;
» examines the accuracy of the projections; and
» introduces the subsequent sections of appendix A.
Projection techniquesTwo main projection techniques were used to develop the projections presented in this publication:
» Exponential smoothing was the technique used in the projections of elementary and secondary enrollments and high school graduates. This technique also played a role in the projections of teachers at the elementary and secondary level, as well as enrollments and degrees conferred at the postsecondary level.
» Multiple linear regression was the primary technique used in the projections of teachers and expenditures at the elementary and secondary level, as well as enrollments and degrees conferred at the postsecondary level.
Exponential smoothing Two different types of exponential smoothing, single exponential smoothing and double exponential smoothing, were used in producing the projections presented in this publication.

72 Appendix A. Introduction to Projection Methodology
Single exponential smoothing was used when the historical data had a basically horizontal pattern. Single exponential smoothing produces a single forecast for all years in the forecast period. In developing projections of elementary and secondary enrollments, for example, the rate at which students progress from one particular grade to the next (e.g., from grade 2 to grade 3) was projected using single exponential smoothing. Thus, this percentage was assumed to be constant over the forecast period.
In general, exponential smoothing places more weight on recent observations than on earlier ones. The weights for observations decrease exponentially as one moves further into the past. As a result, the older data have less influence on the projections. The rate at which the weights of older observations decrease is determined by the smoothing constant.
When using single exponential smoothing for a time series, Pt, a smoothed series, P, is computed recursively by evaluating
Pt = Pt-1 ∝ Pt+(1 ― ∝)
where 0< ∝ ≤1 is the smoothing constant.
By repeated substitution, we can rewrite the equation as
Pt = Pt-s ∝ ∑(1 ― ∝)s t-1
s=0
where time, s, goes from the first period in the time series, 0, to time period t-1.
The forecasts are constant for all years in the forecast period. The constant equals
PT+k = PT
where T is the last year of actual data and k is the kth year in the forecast period where k > 0.
These equations illustrate that the projection is a weighted average based on exponentially decreasing weights. For higher smoothing constants, weights for earlier observations decrease more rapidly than for lower smoothing constants.
For each of the approximately 1,200 single exponential smoothing equations in this edition of Projections of Education Statistics, a smoothing constant was individually chosen to minimize the sum of squared forecast errors for that equation. The smoothing constants used to produce the projections in this report ranged from 0.001 to 0.999.
Double exponential smoothing is an extension of single exponential smoothing that allows the forecasting of data with trends. It produces different forecasts for different years in the forecast period. Double exponential smoothing with two smoothing constants was used to forecast the number of doctor’s degrees awarded to men and women.
The smoothing forecast using double exponential smoothing is found using the three equations:
Pt+k = at + btk
at = ∝ Pt + (1 ― ∝) (at ―1 + bt ―1)
bt = β (at ― at ―1) + (1 ― β) bt ―1
where at denotes an estimate of the level of the series at time t, bt denotes an estimate of the level of the series at time t, and 0 < ∝, β < 1 are the smoothing constants.
Forecasts from double smoothing are computed as
PT+k = aT + bTk
where T is the last year of actual data and k is the kth year in the forecast period where k > 0. The last expression shows that forecasts from double smoothing lie on a linear trend with intercept aT and slope bT. Single exponential smoothing can be viewed as a special case of double exponential smoothing where the impact that time has on the forecasts has been eliminated (i.e., requiring the slope term bt to equal 0.0).

Projections of Education Statistics to 2026 73
The smoothing constants for each of the two double exponential smoothing equations used for this report were selected using a search algorithm that finds the pair of smoothing constants that together minimize the sum of forecast errors for their equation.
Beginning with the Projections of Education Statistics to 2020, each smoothing constant was chosen separately. In earlier editions, all the smoothing constants had been set to 0.4. Also beginning with that edition, two smoothing constants, rather than one, were used for double exponential smoothing.
Multiple linear regressionMultiple linear regression was used in cases where a strong relationship exists between the variable being projected (the dependent variable) and independent variables. This technique can be used only when accurate data and reliable projections of the independent variables are available. Key independent variables for this publication include demographic and economic factors. For example, current expenditures for public elementary and secondary education are related to economic factors such as disposable income and education revenues from state sources. The sources of the demographic and economic projections used for this publication are discussed below, under “Assumptions.”
The equations in this appendix should be viewed as forecasting rather than structural equations. That is, the equations are intended only to project values for the dependent variables, not to reflect all elements of underlying social, political, and economic structures. Lack of available data precluded the building of large-scale structural models. The particular equations shown were selected on the basis of their statistical properties, such as coefficients of determination (R²s), the t-statistics of the coefficients, the Durbin-Watson statistic, the Breusch-Godfrey Serial Correlation LM test statistic, and residual plots.
The functional form primarily used is the multiplicative model. When used with two independent variables, this model takes the form:
Y = a ∙ X1 ∙ X2 b1 b2
This equation can easily be transformed into the linear form by taking the natural log (ln) of both sides of the equation:
ln(Y) = ln(a) + b1lnX1 + b2lnX2
One property of this model is that the coefficient of an independent variable shows how responsive in percentage terms the dependent variable is to a one percent change in that independent variable (also called the elasticity). For example, a 1 percent change in X1 in the above equation would lead to a b1 percent change in Y.
Assumptions All projections are based on underlying assumptions, and these assumptions determine projection results to a large extent. It is important that users of projections understand the assumptions to determine the acceptability of projected time series for their purposes. All the projections in this publication are to some extent dependent on demographic and/or economic assumptions.
Demographic assumptionsMany of the projections in this publication are demographically based on the 2014 National Population Projections (December 2014) produced by the U.S. Census Bureau and the IHS U.S. Regional Economic Service, Population Projections, Novenber 2016 produced by the economic consulting firm IHS Global Inc.
The two sets of population projections are produced using cohort-component models. In order for the national-level population projections by age, sex, and race/ethnicity to be consistent with the most recent historical estimates released by the Census Bureau, the projections were ratio-adjusted by applying the ratio of the last historical estimate to the corresponding projections year to the projections for each age, sex, and race/ethnicity combination. This allows for a consistent set of historical estimates and projections. For more information on the methodology used for Census Bureau population projections, see appendix C, Data Sources.
The enrollment projections in this publication depend on population projections for the various age groups that attend school. The future fertility rate assumption (along with corresponding projections of female populations) determines projections of the number of births, a key factor for population projections. The fertility rate assumption plays a major role in determining population projections for the age groups enrolled in nursery school, kindergarten, and elementary grades. The effects of the fertility rate assumption are more pronounced toward the end of the forecast period, while immigration assumptions affect all years. For enrollments in secondary grades and college, the fertility rate assumption is of no consequence, since all the population cohorts for these enrollment ranges have already been born.

74 Appendix A. Introduction to Projection Methodology
Economic assumptionsVarious economic variables are used in the forecasting models for numbers of elementary and secondary teachers, public elementary and secondary school expenditures, and postsecondary enrollment.
Projections of the economic variables were from the trend scenario of the “U.S. Quarterly Macroeconomic Model November 2016 Short-Term Baseline Projections” developed by the IHS Global Inc. This set of projections was IHS Global Inc.’s most recent set at the time the education projections in this report were produced. The trend scenario depicts a mean of possible paths that the economy could take over the forecast period, barring major shocks. The economy, in this scenario, evolves smoothly, without major fluctuations.
More information about specific assumptionsFor details about the primary assumptions used in this edition of Projections of Education Statistics, see table A-1 on page 75.
Accuracy of the projections Projections of time series usually differ from the final reported data due to errors from many sources. This is because of the inherent nature of the statistical universe from which the basic data are obtained and the properties of projection methodologies, which depend on the validity of many assumptions.
The mean absolute percentage error (MAPE) is one way to express the forecast accuracy of past projections. This measure expresses the average absolute value of errors over past projections in percentage terms. For example, an analysis of projection errors over the past 33 editions of Projections of Education Statistics indicates that the MAPEs for public school enrollment in grades preK–12 for lead times of 1, 2, 5, and 10 years were 0.3, 0.5, 1.2, and 2.4 percent, respectively. For the 1-year-out projection, this means that one would expect the projection to be within 0.3 percent of the actual value, on average.
For a list of MAPEs for selected national statistics in this publication, see table A-2 on page 76. Sections A.1 through A.6 each contain at least one text table (tables A through J) that presents the MAPEs for the key national statistics of that section. Each text table appears directly after the discussion of accuracy of that section’s national projections. For a list of MAPEs by state and region for public elementary and secondary enrollment, see tables A-7 through A-9 on pages 85–87 and for a list of MAPEs by state and region for the number of high school graduates in public schools, see table A-10 on page 93.
Tables A-3 and A-4 present an example of how the MAPEs were constructed using actual values for total enrollment in degree-granting postsecondary institutions projections for schools years 2012–13 through 2015–16 and enrollment projections from the last four editions of Projections of Education Statistics. The top two panels of table A-3 shows the actual values for school years 2012–13 through 2015–16 and enrollment projections for each year from Projections of Education Statistics to 2022 with the number of projections generally decreasing by one for each subsequent edition. The bottom panel of table A-3 shows the percentage differences between the actual values and the projected values. For example, the projected value for 2012–13 presented in Projections of Education Statistics to 2022 was 1.6 percent higher than the actual value for that year.
The top panel of table A-4 shows the absolute value of the percent differences from table A-3 arranged by lead time rather than year. For example, in the Projections of Education Statistics to 2022, the last year of actual data reported was 2012–13 and thus the lead time for the projection of 2012–13 data was 1 year. Thus, the 1.6 appearing in the 2012–13 column of Table A-3 for Projections of Education Statistics to 2022 appears in the column for lead times of 1 year in Table A-4, indicating that projection of the one-year-out forecast from Projections of Education Statistics to 2022 differed by 1.6 percent in absolute terms from its actual value. The MAPEs for each lead time shown in the bottom panel of table A-4 were calculated by computing the average of the absolute values of the percentage differences for that lead time. For example, actual values are available to calculate the absolute values of the percentage differences for a lead time of 2 years for the first three editions of the Projections of Education Statistics listed in table A-4. These absolute values are 4.1, 4.0, and 1.3. The MAPE for a lead time of 2 years was then calculated by taking the average of these numbers, or 3.1. This matches the MAPE that appears in the bottom panel for a lead time of 2 years. (Calculations for table A-3 are based on unrounded numbers.) These MAPEs are different from the MAPEs for public elementary and secondary enrollment projections elsewhere in this report because the MAPEs in the example were calculated using only the last four editions of Projections of Education Statistics.
The number of years used in the analyses of the projection errors differ both because projections of additional education statistics have been added to the report over time and because, in some cases, there have been substantial changes in the methodology used to produce the projections such that the MAPEs for the earlier projections are no longer relevant. MAPEs are presented for a statistic only after it has been produced using substantially the same methodology in five previous editions of Projections of Education Statistics and there are at least 5 years of historical data for use in calculating the MAPEs.

Projections of Education Statistics to 2026 75
Table A-1. Summary of forecast assumptions to 2026
Variable Assumption
1 2
Demographic assumptionsPopulation .......................................................................................................................................... Projections are consistent with the Census Bureau estimates1
18- to 24-year-old population ............................................................................................................. Census Bureau projection: average annual growth rate of -0.1%25- to 29-year-old population ............................................................................................................. Census Bureau projection: average annual growth rate of 0.3%30- to 34-year-old population ............................................................................................................. Census Bureau projection: average annual growth rate of 1.0%35- to 44-year-old population ............................................................................................................. Census Bureau projection: average annual growth rate of 1.3%
Economic assumptionsDisposable income per capita in constant dollars ............................................................................. Annual percent changes range between 0.9% and 2.0% with an annual growth rate of 1.6%Education revenue receipts from state sources per capita in constant dollars .................................. Annual percent changes range between 0.2% and 2.2% with an annual growth rate of 1.1%Inflation rate ....................................................................................................................................... Inflation rate ranges between 1.9% and 2.6%
Unemployment rate (males) ...........................................................................................................Ages 18 and 19 ................................................................................................................................. Remains between 14.5% and 15.1%Ages 20 to 24 .................................................................................................................................... Remains between 9.0% and 9.5%Age 25 and over ................................................................................................................................ Remains between 3.7% and 3.8%
Unemployment rate (females) ........................................................................................................Ages 18 and 19 ................................................................................................................................. Remains between 13.2% and 13.8%Ages 20 to 24 .................................................................................................................................... Remains between 7.5% and 7.8%Age 25 and over ................................................................................................................................ Remains between 3.8% and 4.1%
1As the Census Bureau projections were not updated to reflect the most recent 2016 CensusBureau population estimates, the Census Bureau age-specific population projections for eachyear were adjusted by multiplying the ratio of the total Census Bureau estimate for 2016 to thetotal Census Bureau projection for 2016.
SOURCE: U.S. Department of Commerce, Census Bureau, Population Estimates, retrieved September 21, 2016 from https://www2.census.gov/programs-surveys/popest/datasets/2010-2014/national/asrh/; and Population Projections, retrieved August 4, 2015, fromhttps://www.census.gov/programs-surveys/popproj.html; and IHS Global Inc., “U.S. Quar-terly Macroeconomic Model, November 2016 Short-Term Baseline Projections.” (Thistable was prepared March 2017.)

76 Appendix A. Introduction to Projection Methodology
Table A-2. Mean absolute percentage errors (MAPEs), by lead time for selected statistics in all elementary and secondary schools and degree-granting postsecondary institutions: MAPEs constructed using projections from Projections of Education Statistics to 1984–85 through Projections of Education Statistics to 2025
Statistic
Lead time (years)
1 2 3 4 5 6 7 8 9 10
1 2 3 4 5 6 7 8 9 10 11
Public elementary and secondary schoolsPrekindergarten–12 enrollment1 ...................................... 0.3 0.5 0.8 1.0 1.2 1.4 1.7 2.0 2.2 2.4
Prekindergarten–8 enrollment1 .................................... 0.3 0.6 0.9 1.2 1.4 1.7 2.1 2.5 2.8 3.09–12 enrollment1 ......................................................... 0.4 0.7 1.0 1.1 1.2 1.4 1.6 1.9 2.1 2.4White2 .......................................................................... 0.4 1.0 1.9 3.6 4.9 5.7 5.4 — — —Black2 .......................................................................... 0.6 1.5 2.4 3.3 4.2 4.3 2.6 — — —Hispanic2 ..................................................................... 0.9 1.3 1.7 3.2 4.0 4.5 1.0 — — —Asian/Pacific Islander2 ................................................. 0.8 2.2 3.7 5.8 8.6 9.4 8.2 — — —American Indian/Alaska Native2 .................................. 1.4 3.1 5.7 12.5 16.0 19.3 20.2 — — —
Elementary and secondary teachers3 ............................. 0.7 1.4 1.8 2.5 3.1 3.9 4.6 5.3 5.7 6.1High school graduates4 ................................................... 1.0 1.1 1.8 2.2 2.5 2.9 3.5 4.2 4.8 5.1
White2 .......................................................................... 1.0 0.5 0.8 1.3 2.5 3.5 — — — —Black2 .......................................................................... 2.3 3.0 3.5 5.8 7.1 9.3 — — — —Hispanic2 ..................................................................... 3.6 4.5 6.6 13.2 16.9 16.2 — — — —Asian/Pacific Islander2 ................................................. 1.5 2.6 2.8 1.6 2.3 0.5 — — — —American Indian/Alaska Native2 .................................. 1.9 1.8 3.7 6.9 8.8 7.8 — — — —
Total current expenditures5 ............................................. 1.7 2.5 2.7 2.6 2.8 3.8 5.0 6.0 6.2 6.2Current expenditures per pupil in fall enrollment5 ........... 1.7 2.4 2.6 2.6 2.9 3.7 4.9 5.9 6.7 6.9
Private elementary and secondary schools6
Prekindergarten–12 enrollment ....................................... 2.8 5.5 3.6 8.4 7.3 11.5 10.8 14.6 16.3 18.6Prekindergarten–8 enrollment ..................................... 3.1 5.8 3.8 9.6 8.3 14.0 13.7 17.9 20.7 22.29–12 enrollment ........................................................... 2.9 4.2 3.7 4.5 4.1 3.7 3.4 7.3 5.4 7.2
High school graduates ..................................................... 1.8 1.5 1.6 3.7 4.9 4.2 2.8 4.7 4.5 4.9
Degree-granting postsecondary institutionsTotal enrollment7 ............................................................. 1.5 2.6 4.0 5.1 5.9 5.9 6.6 7.5 9.0 10.3
Males7 .......................................................................... 1.5 2.7 4.0 5.3 6.3 6.7 7.8 8.9 10.3 11.8Females7 ..................................................................... 1.7 2.7 4.3 5.1 5.6 5.3 5.8 6.7 8.6 10.34-year institutions7 ....................................................... 1.6 2.6 3.9 5.2 6.4 7.3 8.4 9.8 11.6 12.92-year institutions7 ....................................................... 2.9 4.1 5.7 6.0 5.9 4.4 5.0 6.3 8.5 9.4White8 .......................................................................... 2.2 4.2 6.2 7.4 7.6 6.4 6.1 5.7 7.4 9.1Black8 .......................................................................... 3.5 7.9 11.7 14.9 14.9 13.4 9.8 6.3 3.8 1.7Hispanic8 ..................................................................... 3.8 6.3 8.7 11.6 14.6 16.5 18.8 20.2 20.4 19.7Asian/Pacific Islander8 ................................................. 3.3 5.6 6.4 8.0 8.7 9.4 9.6 9.4 9.9 11.8American Indian/Alaska Native8 .................................. 5.4 7.7 12.0 15.7 19.1 24.8 31.3 40.6 44.1 49.2
Total first-time freshman enrollment9 .............................. 3.0 5.3 7.2 8.4 8.2 7.2 6.2 5.7 — —Males9 .......................................................................... 2.9 5.0 6.6 7.4 7.2 6.0 3.1 1.2 — —Females9 ..................................................................... 3.3 5.6 7.8 9.2 9.4 9.7 8.9 9.6 — —
Associate’s degrees9 ....................................................... 2.8 5.5 8.1 11.5 12.9 13.9 14.6 15.1 — —Bachelor’s degrees9 ........................................................ 0.6 0.6 1.1 2.4 3.6 5.1 5.8 6.2 — —Master’s degrees10 .......................................................... 0.9 3.4 5.3 6.6 5.8 — — — — —Doctor’s degrees10 .......................................................... 0.2 0.1 0.1 1.3 0.8 — — — — —
— Not available.1MAPEs for public prekindergarten–12 enrollments were calculated using the last 33 edi-tions of Projections of Education Statistics, from Projections of Education Statistics to1984–1985 through Projections of Education Statistics to 2025. 2MAPEs for public prekindergarten–12 enrollments and high school graduates by race/ethnic-ity were calculated using the last 7 editions of Projections of Education Statistics, from Projec-tions of Education Statistics to 2019 through Projections of Education Statistics to 2025.3Data for teachers expressed in full-time equivalents. MAPEs for teachers were calculatedfrom the past 27 editions of Projections of Education Statistics, from Projections of Educa-tion Statistics to 1997–98 through Projections of Education Statistics to 2025, excludingProjections of Education Statistics to 2012 which did not include projections of teachers.4MAPEs for public high school graduates were calculated from the past 26 editions of Pro-jections of Education Statistics, from Projections of Education Statistics to 2000 throughProjections of Education Statistics to 2025. 5In constant dollars based on the Consumer Price Index for all urban consumers, Bureau ofLabor Statistics, U.S. Department of Labor. MAPEs for current expenditures were calcu-lated using projections from the last 26 editions of Projections of Education Statistics, fromProjections of Education Statistics to 1997–98 through Projections of Education Statisticsto 2025, excluding Projections of Education Statistics to 2012 which did not include projec-tions of current expenditures. 6MAPEs for private prekindergarten–12 enrollments and high school graduates were calcu-lated from the past 15 editions of Projections of Education Statistics, from Projections ofEducation Statistics 2011 through Projections of Education Statistics to 2025.
7MAPEs for total degree-granting postsecondary institution enrollment and degree-grantingpostsecondary institution enrollment by sex and level of institution were calculated usingthe last 19 editions of Projections of Education Statistics, from Projections of EducationStatistics to 2007 through Projections of Education Statistics to 2025.8MAPEs for degree-granting postsecondary institution enrollment by race/ethnicity werecalculated using the last 11 editions of Projections of Education Statistics, from Projectionsof Education Statistics to 2015 through Projections of Education Statistics to 2025.9MAPEs for degree-granting postsecondary institution first-time freshmen enrollment bysex, associate’s degrees, and bachelor’s degrees were calculated using the last eight edi-tions of Projections of Education Statistics, from Projections of Education Statistics to 2018through Projections of Education Statistics to 2025.10MAPEs for master’s degrees, and doctor’s degrees were calculated using the last fiveeditions of Projections of Education Statistics, from Projections of Education Statistics to2021 through Projections of Education Statistics to 2025.NOTE: Mean absolute percentage error is the average value over past projections of theabsolute values of errors expressed in percentage terms. No MAPEs are presented for cer-tain degrees conferred as the current models used for producing these projections haveonly been used for four other editions of Projections of Education Statistics. Calculationswere made using unrounded numbers. Some data have been revised from previously pub-lished figures.SOURCE: U.S. Department of Education, National Center for Education Statistics, Projec-tions of Education Statistics, various issues. (This table was prepared February 2017.)
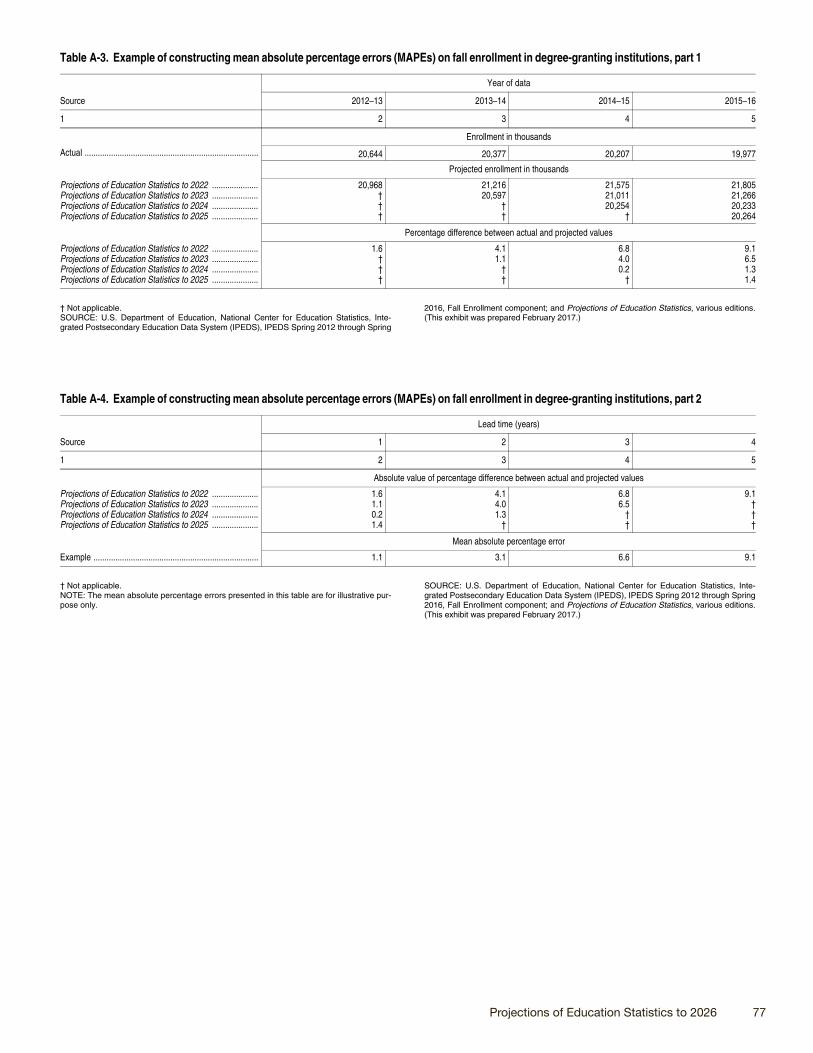
Projections of Education Statistics to 2026 77
Table A-3. Example of constructing mean absolute percentage errors (MAPEs) on fall enrollment in degree-granting institutions, part 1
Source
Year of data
2012–13 2013–14 2014–15 2015–16
1 2 3 4 5
Enrollment in thousands
Actual ............................................................................... 20,644 20,377 20,207 19,977
Projected enrollment in thousands
Projections of Education Statistics to 2022 ..................... 20,968 21,216 21,575 21,805Projections of Education Statistics to 2023 ..................... † 20,597 21,011 21,266Projections of Education Statistics to 2024 ..................... † † 20,254 20,233Projections of Education Statistics to 2025 ..................... † † † 20,264
Percentage difference between actual and projected values
Projections of Education Statistics to 2022 ..................... 1.6 4.1 6.8 9.1Projections of Education Statistics to 2023 ..................... † 1.1 4.0 6.5Projections of Education Statistics to 2024 ..................... † † 0.2 1.3Projections of Education Statistics to 2025 ..................... † † † 1.4
† Not applicable.SOURCE: U.S. Department of Education, National Center for Education Statistics, Inte-grated Postsecondary Education Data System (IPEDS), IPEDS Spring 2012 through Spring
2016, Fall Enrollment component; and Projections of Education Statistics, various editions.(This exhibit was prepared February 2017.)
Table A-4. Example of constructing mean absolute percentage errors (MAPEs) on fall enrollment in degree-granting institutions, part 2
Source
Lead time (years)
1 2 3 4
1 2 3 4 5
Absolute value of percentage difference between actual and projected values
Projections of Education Statistics to 2022 ..................... 1.6 4.1 6.8 9.1Projections of Education Statistics to 2023 ..................... 1.1 4.0 6.5 †Projections of Education Statistics to 2024 ..................... 0.2 1.3 † †Projections of Education Statistics to 2025 ..................... 1.4 † † †
Mean absolute percentage error
Example ........................................................................... 1.1 3.1 6.6 9.1
† Not applicable.NOTE: The mean absolute percentage errors presented in this table are for illustrative pur-pose only.
SOURCE: U.S. Department of Education, National Center for Education Statistics, Inte-grated Postsecondary Education Data System (IPEDS), IPEDS Spring 2012 through Spring2016, Fall Enrollment component; and Projections of Education Statistics, various editions.(This exhibit was prepared February 2017.)

78 Appendix A. Introduction to Projection Methodology
A.1. ELEMENTARY AND SECONDARY ENROLLMENTProjections in this editionThis edition of Projections of Education Statistics presents projected trends in elementary and secondary enrollment from 2015 to 2026. These projections were made using three models:
» The National Elementary and Secondary Enrollment Projection Model was used to project total, public, and private school enrollments for the nation by grade level and for ungraded elementary and ungraded secondary programs.
» The State Public Elementary and Secondary Enrollment Projection Model was used to project total public school enrollments by grade level for individual states and regions.
» The National Public Elementary and Secondary Enrollment by Race/Ethnicity Projection Model was used to project public school enrollments for the nation by race/ethnicity and grade level.
All three elementary and secondary enrollment models used the following same methods.
Overview of approachTwo methods were used in all the elementary and secondary enrollment models:
» The grade progression rate method was used to project enrollments in grades 2 through 12. In this method, a rate of progression from each grade (1 through 11) to the next grade (2 through 12) was projected using single exponential smoothing. (For example, the rate of progression from grade 2 to grade 3 is the current year’s grade 3 enrollment expressed as a percentage of the previous year’s grade 2 enrollment.) To calculate enrollment for each year in the forecast period, the progression rate for each grade was applied to the previous year’s enrollment in the previous grade.
» The enrollment rate method was used to project prekindergarten, kindergarten, and first-grade enrollments as well as elementary special and ungraded and secondary special and ungraded enrollments. For each of these enrollment categories, the enrollment rate for the last year of actual data was used as the projected enrollment rate. To calculate enrollment for each year in the forecast period, the enrollment rate for each category was applied to the projected population in the appropriate age group.
Assumptions underlying these methodsThe grade progression and enrollment rate methods assume that past trends in factors affecting public and private elementary and secondary school enrollments will continue over the forecast period. This assumption implies that all factors influencing enrollments will display future patterns consistent with past patterns. This method implicitly includes the net effect of such factors as migration, dropouts, deaths, nonpromotion, and transfers between public and private schools.
Procedures and equations used in all three elementary and secondary enrollment projection modelsThe notation and equations that follow describe the basic procedures used to project elementary and secondary enrollments in each of the three elementary and secondary enrollment projection models.
Let:i = Subscript denoting agej = Subscript denoting gradet = Subscript denoting timeT = Subscript of the first year in the forecast periodNt = Enrollment at the prekindergarten (nursery) levelKt = Enrollment at the kindergarten levelGj,t = Enrollment in grade jEt = Enrollment in elementary special and ungraded programsSt = Enrollment in secondary special and ungraded programsPi,t = Population age i

Projections of Education Statistics to 2026 79
Rj,t = Progression rate for grade j
RNt = Enrollment rate for prekindergarten (nursery school)
RKt = Enrollment rate for kindergarten
RG1,t = Enrollment rate for grade 1
REt = Enrollment rate for elementary special and ungraded programs
RSt = Enrollment rate for secondary special and ungraded programs.
Step 1. Calculate historical grade progression rates for each of grades 2 through 12. The first step in projecting the enrollments for grades 2 through 12 using the grade progression method was to calculate, for each grade, a progression rate for each year of actual data used to produce the projections except for the first year. The progression rate for grade j in year t equals
Rj,t = Gj,t/Gj―1,t―1
Step 2. Produce a projected progression rate for each of grades 2 through 12. Projections for each grade’s progression rate were then produced for the forecast period using single exponential smoothing. A separate smoothing constant, chosen to minimize the sum of squared forecast errors, was used to calculate the projected progression rate for each grade. Single exponential smoothing produces a single forecast for all years in the forecast period. Therefore, for each grade j, the projected progression rate, Rj, is the same for each year in the forecast period.
Step 3. Calculate enrollment projections for each of grades 2 through 12. For the first year in the forecast period, T, enrollment projections, Gj,t, for grades 2 through 12, were produced using the projected progression rates and the enrollments of grades 1 through 11 from the last year of actual data, T–1. Specifically,
This same procedure was then used to produce the projections for the following year, T+1, except that enrollment projections
Gj,T = Rj ∙ Gj―1,T―1
for year T were used rather than actual numbers:
Gj,T+1 = Rj ∙ Gj,T
The enrollment projections for grades 2 through 11 for year T were those just produced using the grade progression method. The projection for grade 1 for year T was produced using the enrollment rate method, as outlined in steps 4 and 5 below.
The same procedure was used for the remaining years in the projections period.
Step 4. For the last year of actual data, calculate enrollment rates for prekindergarten, kindergarten, grade 1, elementary special and ungraded, and secondary special and ungraded. The first step in projecting prekindergarten, kindergarten, first-grade, elementary special and ungraded, and secondary special and ungraded enrollments using the enrollment rate method was to calculate enrollment rates for each enrollment category for the last year of actual data, T–1, where:
RNT―1 = NT―1/P5,T―1
RKT―1 = KT―1/P5,T―1
RG1,T―1 = G1,T―1/P6,T―1
RET―1 = ET―1/Σi=5Pi,T―113
RST―1 = ST―1/Σi=14Pi,T―1
These enrollment rates were then used as the projected enrollment rates for each year in the forecast period (RN, RK, RG1, RE, and RS ).
17

80 Appendix A. Introduction to Projection Methodology
Step 5. Using the rates for the last year of actual data as the projected enrollment rates, calculate enrollment projections for prekindergarten through grade 1 and the ungraded categories. For each year in the forecast period, the enrollment rates were then multiplied by the appropriate population projections from the U.S. Census Bureau ( Pi,t) to calculate enrollment projections for prekindergarten (nursery school) ( Nt), kindergarten ( Kt), first grade ( G1,t ), elementary ungraded ( Et), and secondary ungraded ( St)
Nt = RN ∙ P5,t
Kt = RK ∙ P5,t
G1,t = RG1 ∙ P5,t
(Σ Pi,t) Et = RE ∙ 13 i=5
(Σ Pi,t) St = RS ∙ 17
i=14
Step 6. Calculate total elementary and secondary enrollments by summing the projections for each grade and the ungraded categories. To obtain projections of total enrollment, projections of enrollments for the individual grades (prekindergarten through 12), elementary ungraded, and secondary ungraded were summed.
National Elementary and Secondary Enrollment Projection ModelThis model was used to project national total, public, and private school enrollments by grade level and for ungraded elementary and ungraded secondary programs. National enrollment projections for public and private schools were developed separately, then added together to yield total elementary and secondary enrollment projections for the nation. To develop these projections, enrollment data from NCES were used, along with population estimates and projections from the U.S. Census Bureau. Below is information about the specific data used to develop the public school projections and the private school projections, as well as information about the grade progression rates and enrollment rates specific to public schools and private schools.
For details on procedures used to develop the projections, see “Procedures and equations used in all three elementary and secondary enrollment projection models,” earlier in this section of appendix A.
Data used to develop national elementary and secondary enrollment projectionsPublic school enrollment data. Public school enrollment data from the NCES Statistics of Public Elementary and Secondary School Systems for 1972 to 1980 and the NCES Common Core of Data (CCD) for 1981 to 2014 were used to develop the national public school enrollment projections.
Private school enrollment data. Private school enrollment data from the NCES Private School Universe Survey (PSS) for 1989–90, 1991–92, 1993–94, 1995–96, 1997–98, 1999–2000, 2001–02, 2003–04, 2005–06, 2007–08, 2009–10, 2011–12, and 2013–14 were used to develop the national private school enrollment projections. Since the PSS is collected in the fall of odd-numbered years, data for even-numbered years without a PSS collection were estimated by interpolating grade-by-grade progression data from PSS.
Population estimates and projections used for public school enrollment projections. Population estimates for 1972 to 2015 and population projections for 2016 to 2026 from the U.S. Census Bureau were also used to develop the public school enrollment projections. (See table B-1 on page 129 and table B-2 on page 130.) The set of population projections used in this year’s Projections of Education Statistics are the Census Bureau’s 2014 National Population Projections by age and sex (December 2014), adjusted to line up with the most recent historical estimates. This was done through the use of ratio adjustments in which, for each combination of state, age, and sex, the population projections from 2016 to 2026 were multiplied by the ratio of the population estimate for 2015 to the population projection for 2015.
Population estimates and projections used for private school enrollment projections. Population estimates for 1989 to 2015 and population projections for 2016 to 2026 from the U.S. Census Bureau were used to develop the private school enrollment projections. The population projections were ratio-adjusted to line up with the most recent historical estimates.
Grade progression and enrollment rates for national elementary and secondary enrollment projectionsPublic school grade progression and enrollment rates. Table A-5 on page 84 shows the public school grade progression rates for 2014 and projections for 2015 through 2026. Table A-6 on page 84 shows the public school enrollment rates for 2014 and projections for 2015 through 2026.
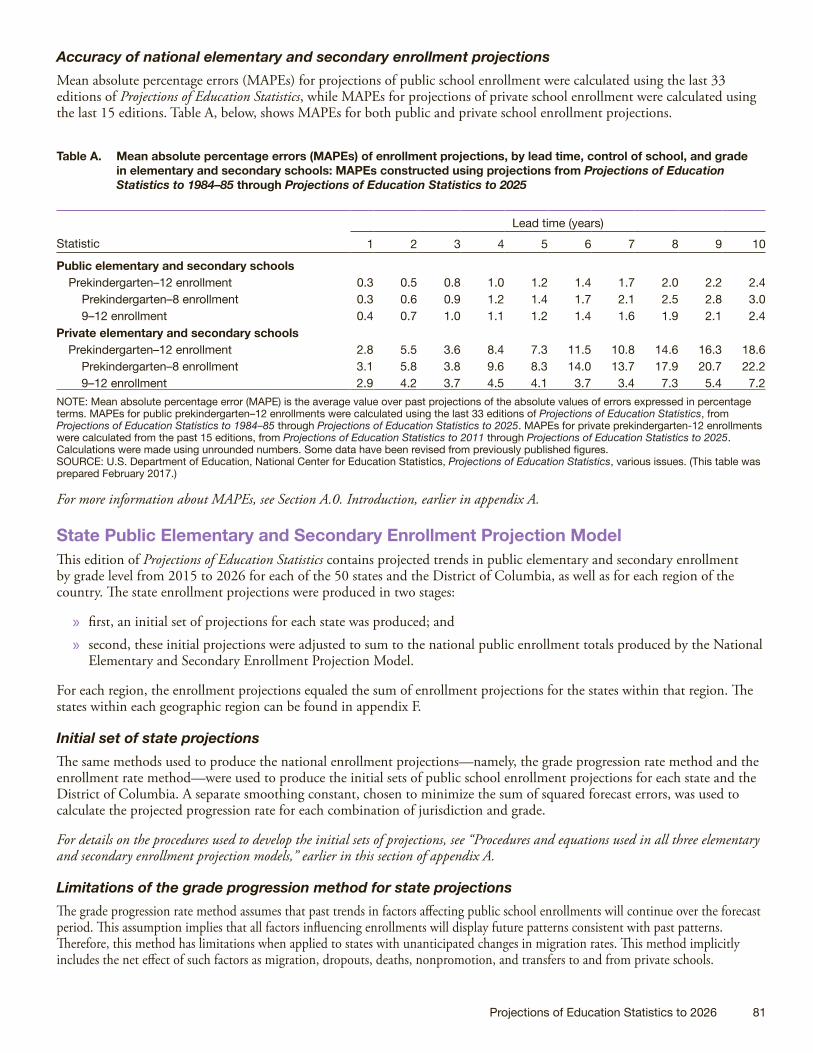
Projections of Education Statistics to 2026 81
Accuracy of national elementary and secondary enrollment projectionsMean absolute percentage errors (MAPEs) for projections of public school enrollment were calculated using the last 33 editions of Projections of Education Statistics, while MAPEs for projections of private school enrollment were calculated using the last 15 editions. Table A, below, shows MAPEs for both public and private school enrollment projections.
Table A. Mean absolute percentage errors (MAPEs) of enrollment projections, by lead time, control of school, and grade in elementary and secondary schools: MAPEs constructed using projections from Projections of Education Statistics to 1984–85 through Projections of Education Statistics to 2025
StatisticLead time (years)
1 2 3 4 5 6 7 8 9 10
Public elementary and secondary schoolsPrekindergarten–12 enrollment 0.3 0.5 0.8 1.0 1.2 1.4 1.7 2.0 2.2 2.4 Prekindergarten–8 enrollment 0.3 0.6 0.9 1.2 1.4 1.7 2.1 2.5 2.8 3.0 9–12 enrollment 0.4 0.7 1.0 1.1 1.2 1.4 1.6 1.9 2.1 2.4
Private elementary and secondary schools Prekindergarten–12 enrollment 2.8 5.5 3.6 8.4 7.3 11.5 10.8 14.6 16.3 18.6 Prekindergarten–8 enrollment 3.1 5.8 3.8 9.6 8.3 14.0 13.7 17.9 20.7 22.2 9–12 enrollment 2.9 4.2 3.7 4.5 4.1 3.7 3.4 7.3 5.4 7.2
NOTE: Mean absolute percentage error (MAPE) is the average value over past projections of the absolute values of errors expressed in percentage terms. MAPEs for public prekindergarten–12 enrollments were calculated using the last 33 editions of Projections of Education Statistics, from Projections of Education Statistics to 1984–85 through Projections of Education Statistics to 2025. MAPEs for private prekindergarten-12 enrollments were calculated from the past 15 editions, from Projections of Education Statistics to 2011 through Projections of Education Statistics to 2025. Calculations were made using unrounded numbers. Some data have been revised from previously published figures.SOURCE: U.S. Department of Education, National Center for Education Statistics, Projections of Education Statistics, various issues. (This table was prepared February 2017.)
For more information about MAPEs, see Section A.0. Introduction, earlier in appendix A.
State Public Elementary and Secondary Enrollment Projection ModelThis edition of Projections of Education Statistics contains projected trends in public elementary and secondary enrollment by grade level from 2015 to 2026 for each of the 50 states and the District of Columbia, as well as for each region of the country. The state enrollment projections were produced in two stages:
» first, an initial set of projections for each state was produced; and
» second, these initial projections were adjusted to sum to the national public enrollment totals produced by the National Elementary and Secondary Enrollment Projection Model.
For each region, the enrollment projections equaled the sum of enrollment projections for the states within that region. The states within each geographic region can be found in appendix F.
Initial set of state projectionsThe same methods used to produce the national enrollment projections—namely, the grade progression rate method and the enrollment rate method—were used to produce the initial sets of public school enrollment projections for each state and the District of Columbia. A separate smoothing constant, chosen to minimize the sum of squared forecast errors, was used to calculate the projected progression rate for each combination of jurisdiction and grade.
For details on the procedures used to develop the initial sets of projections, see “Procedures and equations used in all three elementary and secondary enrollment projection models,” earlier in this section of appendix A.
Limitations of the grade progression method for state projectionsThe grade progression rate method assumes that past trends in factors affecting public school enrollments will continue over the forecast period. This assumption implies that all factors influencing enrollments will display future patterns consistent with past patterns. Therefore, this method has limitations when applied to states with unanticipated changes in migration rates. This method implicitly includes the net effect of such factors as migration, dropouts, deaths, nonpromotion, and transfers to and from private schools.

82 Appendix A. Introduction to Projection Methodology
Adjustments to the state projectionsThe initial projections of state public school enrollments were adjusted to sum to the national projections of public school prekindergarten (preK)–12, preK–8, and 9–12 enrollments shown in table 1 on page 37. This was done through the use of ratio adjustments in which all the states’ initial enrollment projections for each grade level were multiplied by the ratio of the national enrollment projection for that grade level to the sum of the state enrollment projections for that grade level.
Data used to develop state elementary and secondary enrollment projectionsPublic school enrollment data. Public school enrollment data from the NCES Statistics of Public Elementary and Secondary School Systems for 1980 and from the NCES Common Core of Data (CCD) for 1981 to 2014 were used to develop these projections.
Population estimates and projections. Population estimates for 1980 to 2015 from the U.S. Census Bureau and population projections for 2015 to 2026 from IHS Global Inc. were used to develop the state-level enrollment projections. This is the second edition of Projections of Education Statistics to use population projections from IHS Global Inc. rather than from the Census Bureau. The change was made because it had been many years since the Census Bureau had produced population projections at the state level. Unlike the old state-level Census population projections, the IHS Global Inc. state-level population projections were by age groups rather than individual ages. For each year, age-specific population projections for each state were produced for each age from 5 through 17 by applying that age’s share of national projection for its age-group to the state-level projections for its age group.
Accuracy of state elementary and secondary enrollment projectionsMean absolute percentage errors (MAPEs) for projections of public school enrollment by state were calculated using the last 21 editions of Projections of Education Statistics. Tables A-7 through A-9 on pages 85–87 show MAPEs for preK–12, preK–8, and 9–12 enrollment in public elementary and secondary schools by state.
National Public Elementary and Secondary Enrollment by Race/Ethnicity Projection Model This edition of Projections of Education Statistics contains projected trends in national public elementary and secondary enrollment by race/ethnicity from 2015 to 2026.
This is the fourth edition to include enrollment projections for students of Two or more races. As 2010 is the first year in which all 50 states and the District of Columbia reported enrollment data for students of Two or more races, enrollment projections for this category were produced using a different method than that used for the other five racial/ethnic groups.
Prior to 2008, there was a single category for students of Asian and/or Native Hawaiian or Other Pacific Islander origin. In 2008 and 2009, states could choose to place these students in the single category, Asian and/or Native Hawaiian or Other Pacific Islander, or in one of three categories, (1) Asian, (2) Hawaiian or Other Pacific Islander, and (3) Two or more races (for students of both Asian and Hawaiian or Other Pacific Islander origin). Beginning in 2010, the option of using the single category was eliminated and states were required to place students in one of those three categories. For students of Asian and/or Native Hawaiian or Other Pacific Islander origin, projections were calculated for a single category, Asian/Pacific Islander. For 2008 and 2009, the count of the Asian/Pacific Islander students included the total of the Asian and/or Native Hawaiian or Other Pacific Islander students for states reporting one category and the counts for Asian students and Native Hawaiian or Other Pacific Islander students for states reporting three categories. Beginning in 2010, the count of the Asian/Pacific Islander students was the sum of the counts Asian students and Native Hawaiian or Other Pacific Islander students.
The enrollment projections by race/ethnicity were produced in two stages:
» first, an initial set of projections by race/ethnicity was produced; and
» second, these initial projections were adjusted to sum to the national totals.
Initial set of projections by race/ethnicityThe same methods used to produce the national enrollment projections—namely, the grade progression rate method and the enrollment rate method—were used to produce initial sets of projections for each of the following five racial/ethnic groups: White, Black, Hispanic, Asian/Pacific Islander, and American Indian/Alaska Native. A separate smoothing constant, chosen to minimize the sum of squared forecast errors, was used to calculate the projected progression rate for each combination of race/ethnicity and grade.

Projections of Education Statistics to 2026 83
For details on the procedures used to develop the initial sets of projections, see “Procedures and equations used in all three elementary and secondary enrollment models,” earlier in this section of appendix A.
National enrollment projections for students of Two or more races by grade level were produced by taking the 2014 grade-level enrollment numbers for students of Two or more races and applying the growth rates from 2015 to 2026 of the U.S. Census Bureau’s age specific population projections for persons of Two or more races.
Adjustments to the projections by race/ethnicityThe initial projections of enrollments by race/ethnicity were adjusted to sum to the national projections of public school preK–12, preK–8, and 9–12 enrollments shown in table 1 on page 37. This was done through the use of ratio adjustments in which all the initial enrollment projections by race/ethnicity for each grade level were multiplied by the ratio of the national enrollment projection for that grade level to the sum of the initial enrollment projections by race/ethnicity for that grade level.
Data and imputations used to develop enrollment projections by race/ethnicityPublic school enrollment data. Public school enrollment data by grade level and race/ethnicity from the NCES Common Core of Data (CCD) for 1994 to 2014 were used to develop these projections. While projections by race/ethnicity were produced at the national level only, the national data used to develop these projections were constructed from state-level data on enrollment by grade level and race/ethnicity. In those instances where states did not report their enrollment data by grade level and race/ethnicity, the state-level data had to be examined and some imputations made in order to produce the national public school enrollment by grade level and race/ethnicity data. For example, in 1994, North Dakota did not report grade-level enrollment data by race/ethnicity. It did, however, report these numbers for 1995. So, to impute these numbers for 1994, North Dakota’s 1994 grade-level enrollment data were estimated by the state’s 1995 racial/ethnic distribution at each grade level.
Population estimates and projections. Population estimates for 2000 to 2015 and population projections for 2016 to 2026 from the U.S. Census Bureau were used to develop the enrollment projections by race/ethnicity. The set of population projections used in this year’s Projections of Education Statistics are the Census Bureau’s 2014 National Population Projections by age, sex, and race/ethnicity (December 2014), ratio-adjusted to line up with the most recent historical estimates.
Accuracy of enrollment projections by race/ethnicityMean absolute percentage errors (MAPEs) for projections of public school enrollment by race/ethnicity were calculated using the last seven editions of Projections of Education Statistics. Table B, below, shows MAPEs for public school enrollment by race/ethnicity projections.
Table B. Mean absolute percentage errors (MAPEs) of enrollment projections, by lead time and race/ethnicity: MAPEs constructed using projections from Projections of Education Statistics to 1984–85 through Projections of Education Statistics to 2025
StatisticLead time (years)
1 2 3 4 5 6 7 8 9 10
Total enrollment 0.3 0.5 0.8 1.0 1.2 1.4 1.7 2.0 2.2 2.4White 0.4 1.0 1.9 3.6 4.9 5.7 5.4 — — —Black 0.6 1.5 2.4 3.3 4.2 4.3 2.6 — — —Hispanic 0.9 1.3 1.7 3.2 4.0 4.5 1.0 — — —Asian/Pacific Islander 0.8 2.2 3.7 5.8 8.6 9.4 8.2 — — —American Indian/Alaska Native 1.4 3.1 5.7 12.5 16.0 19.3 20.2 — — —
— Not available.NOTE: Mean absolute percentage error (MAPE) is the average value over past projections of the absolute values of errors expressed in percentage terms. MAPEs for public prekindergarten–12 enrollments were calculated using the last 33 editions of Projections of Education Statistics, from Projections of Education Statistics to 1984–85 through Projections of Education Statistics to 2025. MAPEs for public prekindergarten–12 enrollments by race/ethnicity were calculated using the last seven editions of Projections of Education Statistics, from Projections of Education Statistics to 2019 through Projections of Education Statistics to 2025. Calculations were made using unrounded numbers.SOURCE: U.S. Department of Education, National Center for Education Statistics, Projections of Education Statistics, various issues. (This table was prepared February 2017.)
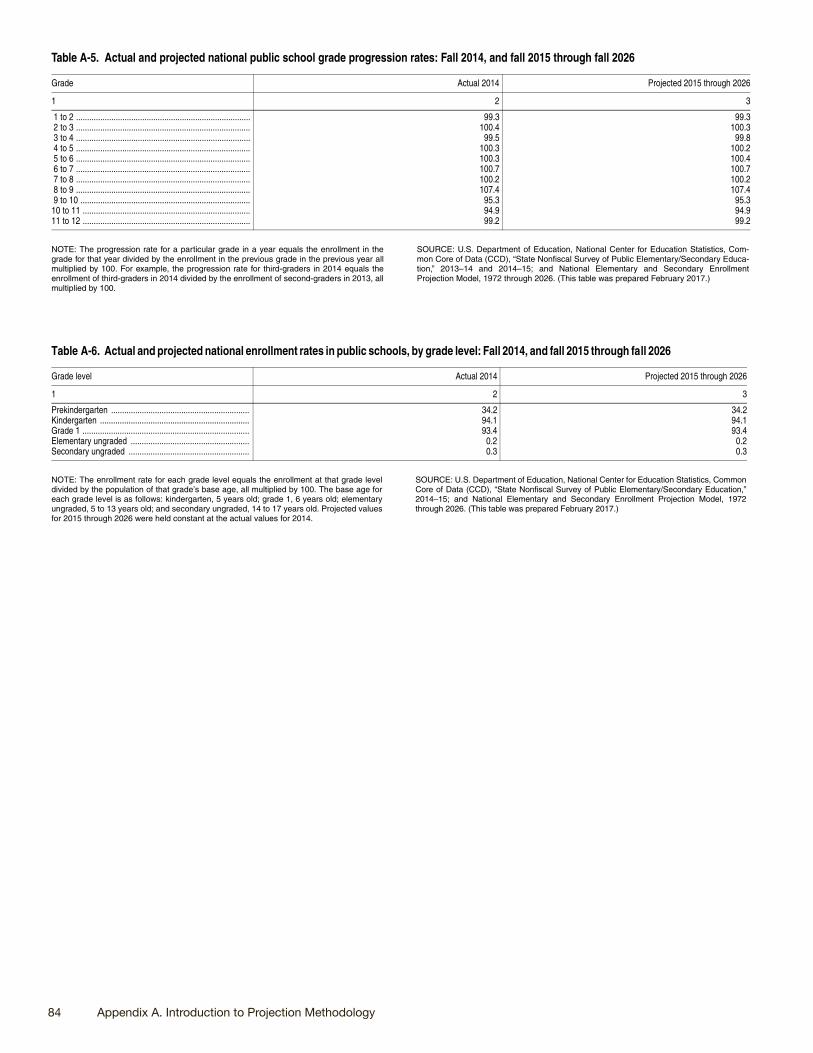
84 Appendix A. Introduction to Projection Methodology
Table A-5. Actual and projected national public school grade progression rates: Fall 2014, and fall 2015 through fall 2026
Grade Actual 2014 Projected 2015 through 2026
1 2 3
1 to 2 ............................................................................... 99.3 99.3 2 to 3 ............................................................................... 100.4 100.3 3 to 4 ............................................................................... 99.5 99.8 4 to 5 ............................................................................... 100.3 100.2 5 to 6 ............................................................................... 100.3 100.4 6 to 7 ............................................................................... 100.7 100.7 7 to 8 ............................................................................... 100.2 100.2 8 to 9 ............................................................................... 107.4 107.4 9 to 10 ............................................................................. 95.3 95.310 to 11 ............................................................................ 94.9 94.911 to 12 ............................................................................ 99.2 99.2
NOTE: The progression rate for a particular grade in a year equals the enrollment in thegrade for that year divided by the enrollment in the previous grade in the previous year allmultiplied by 100. For example, the progression rate for third-graders in 2014 equals theenrollment of third-graders in 2014 divided by the enrollment of second-graders in 2013, allmultiplied by 100.
SOURCE: U.S. Department of Education, National Center for Education Statistics, Com-mon Core of Data (CCD), “State Nonfiscal Survey of Public Elementary/Secondary Educa-tion,” 2013–14 and 2014–15; and National Elementary and Secondary EnrollmentProjection Model, 1972 through 2026. (This table was prepared February 2017.)
Table A-6. Actual and projected national enrollment rates in public schools, by grade level: Fall 2014, and fall 2015 through fall 2026
Grade level Actual 2014 Projected 2015 through 2026
1 2 3
Prekindergarten ............................................................... 34.2 34.2Kindergarten .................................................................... 94.1 94.1Grade 1 ............................................................................ 93.4 93.4Elementary ungraded ...................................................... 0.2 0.2Secondary ungraded ....................................................... 0.3 0.3
NOTE: The enrollment rate for each grade level equals the enrollment at that grade leveldivided by the population of that grade’s base age, all multiplied by 100. The base age foreach grade level is as follows: kindergarten, 5 years old; grade 1, 6 years old; elementaryungraded, 5 to 13 years old; and secondary ungraded, 14 to 17 years old. Projected valuesfor 2015 through 2026 were held constant at the actual values for 2014.
SOURCE: U.S. Department of Education, National Center for Education Statistics, CommonCore of Data (CCD), “State Nonfiscal Survey of Public Elementary/Secondary Education,”2014–15; and National Elementary and Secondary Enrollment Projection Model, 1972through 2026. (This table was prepared February 2017.)

Projections of Education Statistics to 2026 85
Table A-7. Mean absolute percentage errors (MAPEs) for projected prekindergarten–12 enrollment in public elementary and secondary schools, by lead time, region, and state: MAPEs constructed using projections from Projections of Education Statistics to 1984–85 through Projections of Education Statistics to 2025
Region and state
Lead time (years)
1 2 3 4 5 6 7 8 9 10
1 2 3 4 5 6 7 8 9 10 11
United States ................................. 0.3 0.5 0.8 1.0 1.2 1.4 1.7 2.0 2.2 2.4Region
Northeast ................................................. 0.5 0.6 0.8 1.0 0.9 1.1 1.2 0.9 0.9 1.2Midwest .................................................... 0.2 0.4 0.5 0.6 0.8 1.0 1.2 1.4 1.5 1.6South ....................................................... 0.4 0.8 1.2 1.7 2.0 2.4 2.9 3.5 4.0 4.4West ......................................................... 0.5 0.8 1.1 1.5 1.9 2.1 2.4 2.5 2.4 2.1
StateAlabama ................................................... 0.6 0.7 1.0 1.4 2.0 2.5 3.2 4.1 4.8 5.3Alaska ...................................................... 0.9 1.7 2.4 2.9 3.1 3.9 4.5 6.0 7.7 9.3Arizona ..................................................... 2.0 3.0 4.4 6.2 8.0 9.3 10.3 11.1 11.9 11.3Arkansas .................................................. 0.5 1.0 1.5 2.1 2.8 3.5 4.2 4.6 4.9 5.3California .................................................. 0.5 0.9 1.3 2.0 2.3 2.7 3.2 3.6 3.9 4.3
Colorado .................................................. 0.5 0.8 1.1 1.6 2.1 2.7 3.5 4.1 5.0 6.3Connecticut .............................................. 0.5 0.7 0.9 1.3 1.8 2.2 2.8 3.4 4.2 5.1Delaware .................................................. 0.7 1.3 1.6 2.2 2.9 3.6 4.6 5.3 6.3 7.3District of Columbia .................................. 4.6 4.9 6.5 7.5 6.5 6.7 6.0 5.3 6.6 6.7Florida ...................................................... 0.8 1.6 2.2 3.3 4.3 5.3 6.2 7.4 8.1 8.1
Georgia .................................................... 0.6 1.2 1.7 2.5 3.1 3.8 4.7 5.4 5.9 6.3Hawaii ...................................................... 1.6 2.6 3.4 4.8 6.5 7.8 9.3 10.8 12.6 14.5Idaho ........................................................ 0.9 1.4 2.1 2.8 3.4 4.0 4.3 4.3 3.9 4.2Illinois ....................................................... 0.5 0.7 0.9 1.1 1.3 1.6 1.8 2.3 2.5 2.7Indiana ..................................................... 0.3 0.7 0.8 1.1 1.5 1.9 2.3 2.5 2.6 2.9
Iowa ......................................................... 0.6 0.9 1.2 1.5 1.8 2.0 2.2 2.4 2.9 3.4Kansas ..................................................... 0.7 1.0 1.4 1.6 1.9 2.2 2.5 2.7 2.8 2.9Kentucky .................................................. 1.5 1.3 1.9 2.3 2.1 2.8 2.9 3.2 3.9 4.4Louisiana ................................................. 1.7 2.7 3.5 4.7 5.6 6.4 7.0 6.9 7.6 7.1Maine ....................................................... 0.8 1.2 1.4 1.7 2.0 2.0 1.7 1.9 2.5 2.8
Maryland .................................................. 0.5 0.8 1.1 1.6 2.1 2.4 2.5 2.2 2.0 2.3Massachusetts ......................................... 0.4 0.5 0.7 0.9 1.1 1.4 1.5 1.5 1.6 1.9Michigan .................................................. 0.6 1.4 1.8 2.4 3.0 3.6 4.2 5.0 5.7 5.9Minnesota ................................................ 0.4 0.5 0.7 0.9 1.1 1.3 1.5 1.6 1.7 2.0Mississippi ............................................... 0.4 0.9 1.2 1.5 1.7 1.9 2.2 2.5 2.9 3.3
Missouri ................................................... 0.4 0.5 0.5 0.7 0.9 0.9 1.1 1.3 1.3 1.6Montana ................................................... 0.7 1.3 1.9 2.8 3.8 4.7 5.9 7.2 8.7 10.3Nebraska ................................................. 0.5 0.8 1.0 1.4 1.8 2.2 2.7 2.9 3.1 3.1Nevada ..................................................... 1.0 1.7 2.7 4.4 6.2 7.8 9.8 11.3 12.7 14.0New Hampshire ....................................... 0.6 0.8 0.9 1.3 1.3 1.9 2.7 3.4 3.7 4.4
New Jersey .............................................. 0.8 1.2 1.7 1.8 2.1 2.6 3.2 3.8 4.3 4.8New Mexico ............................................. 1.2 1.9 2.8 3.9 4.9 6.0 7.3 8.4 9.3 10.2New York .................................................. 0.8 1.1 1.5 1.9 2.2 2.7 2.9 2.7 2.6 2.7North Carolina ......................................... 0.8 1.4 2.1 3.1 3.8 4.5 5.2 5.5 6.2 7.0North Dakota ............................................ 0.8 1.5 2.4 3.3 4.3 5.9 7.2 8.3 9.1 9.9
Ohio ......................................................... 0.4 0.5 0.8 1.1 1.5 1.8 1.9 2.3 2.3 2.2Oklahoma ................................................ 0.8 1.3 1.8 2.5 3.1 3.7 4.3 5.0 5.9 6.9Oregon ..................................................... 0.8 1.3 1.7 1.7 1.9 2.2 2.8 3.1 3.6 3.9Pennsylvania ............................................ 0.8 1.2 1.4 1.5 1.4 1.6 1.8 2.0 1.8 2.4Rhode Island ............................................ 1.0 1.5 2.2 2.9 3.4 3.5 3.8 3.6 3.6 4.0
South Carolina ......................................... 0.7 1.1 1.5 2.1 2.6 3.1 3.7 4.4 4.8 5.4South Dakota ........................................... 1.2 2.0 3.1 4.3 5.4 6.3 7.2 7.8 8.0 8.7Tennessee ................................................ 0.9 1.2 1.6 2.0 2.3 2.6 3.2 3.8 3.7 3.7Texas ........................................................ 0.7 1.2 1.7 2.4 3.0 3.7 4.6 5.6 6.4 7.1Utah ......................................................... 1.4 1.7 2.0 3.2 3.7 4.5 5.5 5.6 6.6 7.2
Vermont ................................................... 1.1 2.0 2.5 3.2 3.3 3.9 4.3 5.0 5.0 6.0Virginia ..................................................... 0.4 0.6 0.8 1.2 1.6 1.8 2.3 2.8 3.3 3.7Washington .............................................. 0.4 0.7 1.0 1.4 1.7 2.0 2.2 2.6 2.8 3.3West Virginia ............................................ 0.5 0.7 1.0 1.4 1.9 2.4 3.1 3.7 4.5 5.0Wisconsin ................................................ 0.5 0.8 1.1 1.5 1.6 1.6 1.9 2.0 2.0 2.1Wyoming .................................................. 0.7 1.2 2.1 3.4 4.8 6.0 7.3 9.0 10.9 12.5
NOTE: Mean absolute percentage error (MAPE) is the average value over past projections ofthe absolute values of errors expressed in percentage terms. National MAPEs for public pre-kindergarten–12 enrollments were calculated using the last 33 editions of Projections of Edu-cation Statistics, from Projections of Education Statistics to 1984–85 through Projections ofEducation Statistics to 2025. State MAPEs were calculated using the last 21 editions of Pro-
jections of Education Statistics, from Projections of Education Statistics to 2005 through Pro-jections of Education Statistics to 2025. Calculations were made using unrounded numbers.Some data have been revised from previously published figures.SOURCE: U.S. Department of Education, National Center for Education Statistics, Projec-tions of Education Statistics, various issues. (This table was prepared February 2017.)

86 Appendix A. Introduction to Projection Methodology
Table A-8. Mean absolute percentage errors (MAPEs) for projected prekindergarten–8 enrollment in public elementary and secondary schools, by lead time, region, and state: MAPEs constructed using projections from Projections of Education Statistics to 1984–85 through Projections of Education Statistics to 2025
Region and state
Lead time (years)
1 2 3 4 5 6 7 8 9 10
1 2 3 4 5 6 7 8 9 10 11
United States ................................. 0.3 0.6 0.9 1.2 1.4 1.7 2.1 2.5 2.8 3.0Region
Northeast ................................................. 0.4 0.7 0.8 0.9 0.9 1.0 1.2 1.0 0.8 1.1Midwest .................................................... 0.2 0.4 0.5 0.7 0.8 1.0 1.1 1.2 1.4 1.5South ....................................................... 0.5 1.0 1.5 2.0 2.5 2.9 3.6 4.3 4.7 5.1West ......................................................... 0.5 1.0 1.4 1.9 2.2 2.5 2.8 3.0 3.0 2.8
StateAlabama ................................................... 0.6 1.0 1.4 1.9 2.5 3.1 3.8 4.6 5.1 5.2Alaska ...................................................... 1.1 1.9 2.9 3.6 4.3 5.5 6.9 9.2 11.5 13.3Arizona ..................................................... 1.9 2.9 4.5 6.1 7.6 9.4 10.2 11.0 11.2 10.8Arkansas .................................................. 0.7 1.2 1.9 2.6 3.5 4.3 5.1 5.4 5.8 6.2California .................................................. 0.7 1.3 1.8 2.6 3.1 3.7 4.3 4.8 5.3 5.9
Colorado .................................................. 0.6 1.0 1.3 1.8 2.5 3.2 4.1 5.0 6.1 7.3Connecticut .............................................. 0.6 0.8 1.1 1.6 2.2 2.5 3.1 3.7 4.5 5.2Delaware .................................................. 0.9 1.4 1.8 2.6 3.2 4.0 5.2 6.0 7.0 8.3District of Columbia .................................. 4.2 5.0 6.0 6.8 5.6 6.0 6.3 5.0 6.8 6.4Florida ...................................................... 0.9 1.8 2.7 4.0 5.3 6.3 7.6 8.8 9.3 9.1
Georgia .................................................... 0.8 1.5 2.2 3.1 3.9 4.5 5.6 6.4 6.8 7.1Hawaii ...................................................... 1.8 3.0 3.9 5.5 7.8 9.5 11.6 13.9 16.3 18.3Idaho ........................................................ 1.1 1.8 2.8 3.6 4.3 4.8 5.0 4.9 4.6 4.7Illinois ....................................................... 0.6 0.9 1.1 1.4 1.6 2.0 2.2 2.8 2.9 3.0Indiana ..................................................... 0.5 0.8 0.9 1.2 1.5 1.8 2.2 2.3 2.4 2.8
Iowa ......................................................... 0.7 1.1 1.5 2.1 2.7 3.1 3.5 3.8 4.3 4.6Kansas ..................................................... 0.8 1.1 1.4 1.7 2.2 2.7 3.2 3.5 3.8 3.8Kentucky .................................................. 1.6 1.7 2.5 3.0 3.0 3.0 3.3 3.7 4.2 5.1Louisiana ................................................. 1.6 2.5 3.0 3.9 4.6 5.2 5.9 5.8 6.6 6.8Maine ....................................................... 0.6 0.9 1.3 1.7 2.1 2.6 3.0 4.1 5.2 6.2
Maryland .................................................. 0.5 0.8 1.3 1.8 2.4 2.9 3.2 3.2 3.3 3.8Massachusetts ......................................... 0.3 0.6 0.9 1.1 1.3 1.7 1.8 1.7 1.7 2.1Michigan .................................................. 0.6 1.3 1.7 2.5 3.0 3.6 4.3 5.4 6.1 6.2Minnesota ................................................ 0.4 0.5 0.8 1.1 1.2 1.4 1.5 1.3 1.4 1.6Mississippi ............................................... 0.6 1.1 1.5 2.0 2.4 2.7 2.9 3.4 3.7 3.8
Missouri ................................................... 0.5 0.7 0.9 1.1 1.3 1.4 1.5 1.4 1.3 1.4Montana ................................................... 0.9 1.6 2.6 3.8 5.2 6.7 8.4 10.4 12.4 13.9Nebraska ................................................. 0.6 0.9 1.2 1.6 2.0 2.6 3.1 3.4 3.6 3.7Nevada ..................................................... 1.1 2.4 4.0 6.2 8.5 10.5 12.9 14.8 16.3 17.4New Hampshire ....................................... 0.6 0.9 1.2 1.8 2.4 3.2 4.2 5.2 5.8 6.7
New Jersey .............................................. 1.0 1.4 1.7 1.8 1.9 2.3 2.9 3.4 3.7 4.0New Mexico ............................................. 1.0 1.8 2.5 3.4 4.5 6.0 7.4 8.9 9.7 10.1New York .................................................. 0.6 0.9 1.2 1.8 2.3 2.5 2.8 2.7 2.6 2.7North Carolina ......................................... 1.0 1.8 2.7 3.9 4.7 5.5 6.2 6.9 7.7 8.5North Dakota ............................................ 1.1 2.1 3.2 4.3 5.5 7.4 9.0 10.4 11.2 11.8
Ohio ......................................................... 0.4 0.5 0.6 0.8 1.0 1.3 1.4 1.6 1.8 1.9Oklahoma ................................................ 1.1 1.7 2.4 3.2 3.9 4.7 5.4 6.2 7.1 8.2Oregon ..................................................... 1.0 1.5 1.6 1.5 2.0 2.4 2.6 3.0 3.7 4.0Pennsylvania ............................................ 0.5 0.9 1.2 1.3 1.2 1.3 1.6 1.7 1.8 2.1Rhode Island ............................................ 1.1 1.7 2.2 3.1 3.6 3.9 4.5 4.4 4.6 5.4
South Carolina ......................................... 0.9 1.3 1.7 2.4 2.8 3.4 3.9 4.5 5.0 5.8South Dakota ........................................... 1.3 2.1 3.1 4.8 6.2 7.7 8.7 9.9 10.4 10.6Tennessee ................................................ 0.8 1.2 1.8 2.2 2.4 2.5 2.7 3.4 3.4 3.5Texas ........................................................ 0.8 1.5 2.2 3.1 3.8 4.4 5.4 6.4 7.1 7.8Utah ......................................................... 1.3 1.7 2.1 3.1 3.7 4.6 5.5 6.2 7.3 7.7
Vermont ................................................... 1.6 2.5 3.0 3.8 4.3 5.2 6.0 7.4 7.4 8.4Virginia ..................................................... 0.5 0.7 0.8 1.2 1.6 2.1 2.6 3.2 3.7 4.0Washington .............................................. 0.5 0.7 1.0 1.5 1.8 2.2 2.3 2.7 2.8 3.1West Virginia ............................................ 0.6 0.7 1.0 1.4 1.9 2.4 3.1 3.8 4.6 5.1Wisconsin ................................................ 0.6 0.8 1.0 1.5 1.7 1.9 2.1 2.1 2.0 2.1Wyoming .................................................. 0.9 1.4 2.6 4.3 6.1 7.7 9.5 11.8 13.9 15.3
NOTE: Mean absolute percentage error (MAPE) is the average value over past projectionsof the absolute values of errors expressed in percentage terms. National MAPEs for publicprekindergarten–8 enrollments were calculated using the last 33 editions of Projections ofEducation Statistics, from Projections of Education Statistics to 1984–85 through Projec-tions of Education Statistics to 2025. State MAPEs were calculated using the last 21 edi-
tions of Projections of Education Statistics, from Projections of Education Statistics to 2005through Projections of Education Statistics to 2025. Calculations were made usingunrounded numbers. Some data have been revised from previously published figures.SOURCE: U.S. Department of Education, National Center for Education Statistics, Projec-tions of Education Statistics, various issues. (This table was prepared February 2017.)

Projections of Education Statistics to 2026 87
Table A-9. Mean absolute percentage errors (MAPEs) for projected grades 9–12 enrollment in public schools, by lead time, region, and state: MAPEs constructed using projections from Projections of Education Statistics to 1984–85 through Projections of Education Statistics to 2025
Region and state
Lead time (years)
1 2 3 4 5 6 7 8 9 10
1 2 3 4 5 6 7 8 9 10 11
United States ................................. 0.4 0.7 1.0 1.1 1.2 1.4 1.6 1.9 2.1 2.4Region
Northeast ................................................. 0.9 1.2 1.3 1.4 1.5 1.6 1.5 1.5 1.5 1.8Midwest .................................................... 0.4 0.7 0.9 1.0 1.1 1.2 1.5 1.8 1.8 1.9South ....................................................... 0.4 0.8 1.3 1.6 1.8 2.0 2.1 2.4 2.8 3.6West ......................................................... 0.5 0.8 1.1 1.3 1.5 1.5 1.8 2.0 1.9 1.3
StateAlabama ................................................... 0.8 1.3 1.8 2.4 2.8 3.6 4.3 5.2 6.1 6.9Alaska ...................................................... 1.0 2.0 2.8 3.2 3.4 3.4 3.6 3.7 3.5 3.4Arizona ..................................................... 3.6 5.6 7.5 8.6 9.0 9.3 10.4 11.3 13.6 13.0Arkansas .................................................. 0.4 0.9 1.2 1.4 1.7 2.0 2.3 2.9 3.2 3.5California .................................................. 0.4 0.9 1.3 1.8 2.1 2.3 2.5 2.7 2.4 2.2
Colorado .................................................. 0.6 1.1 1.7 2.2 2.5 2.9 3.1 2.9 3.3 4.0Connecticut .............................................. 0.7 1.0 1.1 1.4 1.9 2.5 3.2 4.1 5.1 6.3Delaware .................................................. 1.2 1.7 2.0 2.4 2.7 3.1 3.7 3.8 4.9 6.2District of Columbia .................................. 6.2 7.4 10.5 13.5 15.6 16.4 14.1 14.3 15.2 16.1Florida ...................................................... 0.7 1.2 1.6 2.2 2.4 3.4 3.9 4.9 5.7 5.8
Georgia .................................................... 0.5 0.9 1.3 1.6 1.9 2.5 3.0 3.6 4.3 5.0Hawaii ...................................................... 1.5 2.2 3.0 3.8 4.2 4.8 5.3 5.9 5.7 6.8Idaho ........................................................ 1.0 1.2 1.7 2.1 2.8 3.0 3.9 4.3 3.9 3.9Illinois ....................................................... 0.7 0.9 1.2 1.4 1.6 2.1 2.4 2.9 2.9 3.2Indiana ..................................................... 0.4 0.8 1.3 1.8 2.2 2.6 2.9 3.2 3.6 4.0
Iowa ......................................................... 0.7 0.8 1.1 1.1 1.5 1.7 2.1 2.4 2.5 2.8Kansas ..................................................... 1.0 1.6 2.0 2.4 2.3 1.9 1.6 1.6 1.6 1.1Kentucky .................................................. 1.5 1.8 2.0 2.1 2.0 3.1 3.9 3.8 4.6 4.8Louisiana ................................................. 2.6 3.7 5.0 6.9 8.5 9.8 10.9 10.9 11.7 10.4Maine ....................................................... 1.4 2.6 3.3 4.5 5.2 6.0 7.1 8.3 9.0 8.3
Maryland .................................................. 0.5 0.8 1.2 1.7 1.9 2.2 2.3 2.3 2.0 1.8Massachusetts ......................................... 0.5 0.9 1.4 1.9 2.5 3.1 3.4 3.4 3.6 3.6Michigan .................................................. 1.3 2.1 2.8 3.3 3.8 4.3 5.4 6.5 7.9 8.9Minnesota ................................................ 0.5 0.8 1.0 1.3 1.5 1.8 2.0 2.3 2.7 3.2Mississippi ............................................... 0.6 1.2 1.9 2.4 2.8 3.2 3.7 4.3 4.7 4.7
Missouri ................................................... 0.3 0.7 0.9 1.4 1.5 1.5 1.5 1.8 2.0 2.1Montana ................................................... 0.5 0.9 1.2 1.7 2.2 2.7 3.2 3.6 3.1 3.2Nebraska ................................................. 0.4 0.8 1.1 1.4 1.7 2.0 2.3 2.6 2.9 3.0Nevada ..................................................... 1.2 2.1 2.7 3.0 3.6 4.6 5.8 7.9 9.3 9.3New Hampshire ....................................... 0.6 1.0 1.4 1.8 1.9 2.0 2.5 3.3 4.0 4.5
New Jersey .............................................. 0.7 1.5 2.2 2.2 2.6 3.5 4.4 5.3 6.2 7.0New Mexico ............................................. 2.2 3.7 5.0 6.5 7.9 8.3 9.1 9.9 10.3 11.8New York .................................................. 1.4 2.2 2.4 2.7 2.7 3.3 3.3 3.5 3.7 3.4North Carolina ......................................... 1.0 1.3 1.5 1.7 2.3 2.7 3.1 3.0 3.6 5.0North Dakota ............................................ 0.7 1.2 1.7 2.3 3.2 4.2 5.2 6.5 7.6 8.2
Ohio ......................................................... 1.0 1.5 2.0 2.5 2.9 3.4 3.8 3.8 3.5 3.0Oklahoma ................................................ 0.4 0.8 1.2 1.7 2.1 2.4 2.8 3.3 4.1 4.9Oregon ..................................................... 1.0 1.6 2.2 2.7 2.8 3.2 3.8 4.5 4.9 5.0Pennsylvania ............................................ 1.6 2.0 2.1 2.4 2.5 2.7 2.6 2.7 1.9 3.2Rhode Island ............................................ 0.8 1.5 2.3 3.4 4.2 4.8 4.7 4.5 4.1 4.5
South Carolina ......................................... 0.7 1.3 1.9 2.4 3.0 3.6 4.1 4.6 4.7 5.4South Dakota ........................................... 1.5 2.7 4.1 5.7 7.1 7.6 8.4 9.7 10.1 10.3Tennessee ................................................ 1.8 2.0 2.6 3.6 4.4 5.0 5.6 6.1 5.8 6.0Texas ........................................................ 0.5 1.0 1.5 2.0 2.4 2.7 3.2 4.0 5.0 6.1Utah ......................................................... 1.7 2.1 2.1 3.8 4.0 4.9 6.3 5.4 6.2 7.1
Vermont ................................................... 1.0 2.3 2.8 3.4 3.8 3.9 4.0 4.4 4.4 4.0Virginia ..................................................... 0.5 0.9 1.4 2.1 2.6 2.9 3.0 3.0 3.1 3.3Washington .............................................. 0.6 0.9 1.2 1.6 2.1 2.4 3.0 3.5 4.1 4.6West Virginia ............................................ 0.6 0.8 1.1 1.5 2.1 2.8 3.6 4.2 4.7 4.9Wisconsin ................................................ 0.7 1.1 1.3 1.6 1.8 2.0 2.3 2.7 2.5 2.4Wyoming .................................................. 0.7 1.1 1.8 2.9 4.0 5.1 6.4 7.5 8.7 9.0
NOTE: Mean absolute percentage error (MAPE) is the average value over past projectionsof the absolute values of errors expressed in percentage terms. National MAPEs for public9–12 enrollments were calculated using the last 33 editions of Projections of EducationStatistics, from Projections of Education Statistics to 1984–85 through Projections of Edu-cation Statistics to 2025. State MAPEs were calculated using the last 21 editions of Projec-
tions of Education Statistics, from Projections of Education Statistics to 2005 throughProjections of Education Statistics to 2025. Calculations were made using unrounded num-bers. Some data have been revised from previously published figures.SOURCE: U.S. Department of Education, National Center for Education Statistics, Projec-tions of Education Statistics, various issues. (This table was prepared February 2017.)

88 Appendix A. Introduction to Projection Methodology
A.2. ELEMENTARY AND SECONDARY TEACHERSProjections in this editionThis edition of Projections of Education Statistics presents projected trends in elementary and secondary teachers, pupil/teacher ratios, and new teacher hires from 2015 to 2026. These projections were made using two models:
» The Elementary and Secondary Teacher Projection Model was used to project the number of public school teachers, the number of private school teachers, and the total number of teachers for the nation. It was also used to project pupil/teacher ratios for public schools, private schools, and all elementary and secondary schools.
» The New Teacher Hires Projection Model was used to project the number of new teacher hires in public schools, private schools, and all schools.
Overview of approach Approach for numbers of teachers and pupil/teacher ratiosPublic schools. Multiple linear regression was used to produce initial projections of public school pupil/teacher ratios separately for elementary and secondary schools. The initial projections of elementary pupil/teacher ratios and secondary pupil/teacher ratios were applied to enrollment projections to project the numbers of elementary teachers and secondary teachers, which were summed to get the total number of public school teachers. Final projections of the overall public school pupil/teacher ratios were produced by dividing total projected public school enrollment by the total projected number of teachers.
Assumptions underlying this methodThis method assumes that past relationships between the public school pupil/teacher ratio (the dependent variable) and the independent variables used in the regression analysis will continue throughout the forecast period. For more information about the independent variables, see “Elementary and Secondary Teacher Projection Model,” later in this section of appendix A.
Private schools. Private school pupil/teacher ratios were projected by applying each year’s projected annual percentage change in the overall public school pupil/teacher ratio to the previous year’s private school pupil/teacher ratio. The projected private school pupil/teacher ratios were then applied to projected enrollments at private schools to produce projected numbers of private school teachers.
Assumptions underlying this methodThis method assumes that the future pattern in the trend of private school pupil/teacher ratios will be the same as that for public school pupil/teacher ratios. The reader is cautioned that a number of factors could alter the assumption of consistent patterns of change in ratios over the forecast period.
Approach for new teacher hiresThe following numbers were projected separately for public schools and for private schools:
» The number of teachers needed to fill openings when there is an increase in the size of the teaching workforce from one year to the next and the decrease in the number of replacement teachers needed if there is a decrease in the size of the teaching workforce from one year to the next. This number was estimated based on continuation rates of teachers by their age.
» The number of teachers needed to fill openings due to an increase in the size of the teaching workforce from one year to the next. This number was estimated by subtracting the projected number of teachers in one year from the projected number of teachers in the next year.
These two numbers were summed to yield the total number of “new teacher hires” for each control of school—that is, teachers who will be hired in a given year, but who did not teach in that control the previous year. A teacher who moves from one control to the other control (i.e., from a public to private school or from a private to a public school) is considered a new teacher hire, but a teacher who moves from one school to another school in the same control is not considered a new teacher hire.
Elementary and Secondary Teacher Projection ModelProjections for public schools were produced first. Projections for private schools were produced based partially on input from the public school projections. Finally, the public and private school projections were combined into total elementary and secondary school projections (not shown in the steps below).

Projections of Education Statistics to 2026 89
Steps used to project numbers of teachers and pupil/teacher ratiosPublic school teachers. The following steps were used for the public school projections:
Step 1. Produce projections of pupil/teacher ratios for public elementary schools and public secondary schools separately. Two separate equations were used—one for elementary schools and one for secondary schools. The equations for elementary and secondary schools included an AR(1) term for correcting for autocorrelation and the following independent variables:
» Independent variables for public elementary school pupil/teacher ratios—(1) average teacher wage relative to the overall economy-level wage, and (2) level of education revenue from state sources in constant dollars per public elementary student.
» Independent variables for public secondary school pupil/teacher ratios—(1) level of education revenue from state sources in constant dollars per public secondary student, and (2) the number of students enrolled in public secondary schools relative to the secondary school–age population.
To estimate the models, they were first transformed into nonlinear models and then the coefficients were estimated simultaneously by applying a Marquardt nonlinear least squares algorithm to the transformed equation.
For details on the equations, model statistics, and data used to project public school pupil/teacher ratios, see “Data and equations used for projections of teachers and pupil/teacher ratios,” below.
Step 2. Produce projections of the number of teachers for public elementary schools and public secondary schools separately. The projections of the public elementary pupil/teacher ratio and public secondary pupil/teacher ratio were applied to projections of enrollments in elementary schools and secondary schools, respectively, to produce projections of public elementary teachers and public secondary teachers.
Step 3. Produce projections of the total number of teachers for public elementary and secondary schools combined. The projections of public elementary teachers and public secondary teachers were added together to produce the projections of the total number of public elementary and secondary teachers.
Step 4. Produce projections of the pupil/teacher ratio for public elementary and secondary schools combined. The projections of total enrollment in public elementary and secondary schools were divided by the projections of the total number of public elementary and secondary teachers to produce projections of the overall pupil/teacher ratio in public elementary and secondary schools.
Private school teachers. The following steps were used for the private school projections:
Step 1. Produce projections of the private school pupil/teacher ratio. First, the estimate of the private school pupil/teacher ratio for 2014 was calculated by multiplying the private school pupil/teacher ratio estimate 2013 (the last year of actual data) by the percentage change from 2013 to 2014 in the public school pupil/teacher ratio. The same method was used to calculate the projections of the private school pupil/teacher ratio for 2015 through 2026. That is, each year’s projected annual percentage change in the public school pupil/teacher ratio was applied to the previous year’s private school pupil/teacher ratio.
Step 2. Produce projections of the number of private school teachers. The projected pupil/teacher ratios were applied to projected private school enrollments to produce projections of private school teachers from 2014 through 2026.
For information about the private school teacher and enrollment data used for the private school projections, see “Data and equations used for projections of teachers and pupil/teacher ratios,” below.
Data and equations used for projections of teachers and pupil/teacher ratiosPublic school data used in these projections were by organizational level (i.e., school level), not by grade level. Thus, secondary school enrollment is not the same as enrollment in grades 9 through 12 because many jurisdictions count some grade 7 and 8 enrollment as secondary. For example, some jurisdictions may have 6-year high schools with grades 7 through 12.
Data used to estimate the equation for public elementary school pupil/teacher ratios. The following data were used to estimate the equation:
» To compute the historical elementary school pupil/teacher ratios—Data on 1972–73 to 1980–81 enrollments in public elementary schools came from the NCES Statistics of Public Elementary and Secondary Day Schools and data on 1981–82 to 2014–15 enrollment came from the NCES Common Core of Data (CCD). The proportion of public school teachers who taught in elementary schools was taken from the National Education Association and then applied to the total number of public school teachers from the CCD to produce the number of teachers in elementary schools.

90 Appendix A. Introduction to Projection Methodology
» For 1973–74 and 1975–76, the education revenue from state sources data came from Statistics of State School Systems, published by NCES. For 1972–73, 1974–75, and 1976–77, the education revenue from state sources data came from Revenues and Expenditures for Public Elementary and Secondary Education, also published by NCES. For 1977–78 through 2013–14, these data came from the NCES Common Core of Data (CCD).
Estimated equation and model statistics for public elementary school pupil/teacher ratios. For the estimated equation and model statistics, see table A-10 on page 93. In the public elementary pupil/teacher ratio equation, the independent variables affect the dependent variable in the expected ways:
» As the average teacher wage relative to the overall economy-level wage increases, the pupil/teacher ratio increases; and
» As the level of education revenue from state sources in constant dollars per public elementary student increases, the pupil/teacher ratio decreases.
Data used to project public elementary school pupil/teacher ratios. The estimated equation was run using projected values for teacher salaries and education revenues from state sources from 2014–15 through 2026–27. For more information, see Section A.0. Introduction to Projection Methodology, earlier in this appendix and Section A.4 Expenditures for Public Elementary and Secondary Education later in this appendix.
Data used to estimate the equation for public secondary school pupil/teacher ratios. The following data were used to estimate the equation:
» To compute the historical secondary school pupil/teacher ratios—Data on 1972–73 to 1980–81 enrollments in public elementary schools came from the NCES Statistics of Public Elementary and Secondary Day Schools and data on 1981–82 to 2014–15 enrollment came from the NCES Common Core of Data (CCD). The proportion of public school teachers who taught in secondary schools was taken from the National Education Association and then applied to the total number of public school teachers from the CCD to produce the number of teachers in secondary schools.
» For 1973–74 and 1975–76, the education revenue from state sources data came from Statistics of State School Systems, published by NCES. For 1972–73, 1974–75, and 1976–77, the education revenue from state sources data came from Revenues and Expenditures for Public Elementary and Secondary Education, also published by NCES. For 1977–78 through 2013–14, these data came from the NCES Common Core of Data (CCD).
» To compute the historical secondary school enrollment rate—Data on the secondary school-age population from 1972–73 to 2014–15 came from the U.S. Census Bureau. Data on enrollments in public secondary schools during the same period came from the CCD, as noted above.
Estimated equation and model statistics for public secondary school pupil/teacher ratios. For the estimated equation and model statistics, see table A-10 on page 93. In the public secondary pupil/teacher ratio equation, the independent variables affect the dependent variable in the expected way:
» As enrollment rates (number of enrolled students relative to the school-age population) increase, the pupil/teacher ratio increases; and
» As the level of education revenue from state sources in constant dollars per public secondary student increases, the pupil/teacher ratio decreases.
Data used to project public secondary school pupil/teacher ratios. The estimated equation was run using projections for education revenues, public secondary enrollments, and secondary school–age populations from 2014–15 through 2026–27. Secondary enrollment projections were derived from the enrollment projections described in Section A.1. Elementary and Secondary Enrollment. Population projections were from the Census Bureau’s 2014 National Population Projections by age and sex (December 2014), ratio-adjusted to line up with the most recent historical estimates.
Private school teacher and enrollment data. Private school data for 1989–90, 1991–92, 1993–94, 1995–96, 1997–98, 1999–2000, 2001–02, 2003–04, 2005–06, 2007–08, 2009–10, 2011–12, and 2013–14 came from the biennial NCES Private School Universe Survey (PSS). Since the PSS is collected in the fall of odd-numbered years, data for years without a PSS collection were estimated using data from the PSS.
Private school enrollment projections. Private school enrollments from 2015 to 2026 came from the projections described in Section A.1. Elementary and Secondary Enrollment, earlier in this appendix.
Accuracy of projections of numbers of teachers Mean absolute percentage errors (MAPEs) for projections of public school teachers were calculated using the last 27 editions of Projections of Education Statistics that included projections of teachers. Table C, below, shows MAPEs for projections of the numbers of public school teachers. There was a change in the methodology for projecting private school teachers beginning with Projections of Education Statistics to 2017, and therefore there are too few years of data to present the MAPEs for private school teachers.

Projections of Education Statistics to 2026 91
Table C. Mean absolute percentage errors (MAPEs) of projections of number of public elementary and secondary school teachers, by lead time: MAPEs constructed using projections from Projections of Education Statistics to 1997–98 through Projections of Education Statistics to 2025
StatisticLead time (years)
1 2 3 4 5 6 7 8 9 10
Public elementary and secondary teachers 0.7 1.4 1.8 2.5 3.1 3.9 4.6 5.3 5.7 6.1NOTE: MAPEs for teachers were calculated from the past 27 editions of Projections of Education Statistics, from Projections of Education Statistics to 1997–98 through Projections of Education Statistics to 2025, excluding Projections of Education Statistics to 2012, which did not include projections of teachers. Calculations were made using unrounded numbers. Some data have been revised from previously published figures. Number of teachers reported in full-time equivalents.SOURCE: U.S. Department of Education, National Center for Education Statistics, Projections of Education Statistics, various issues. (This table was prepared February 2017.)
For more information about MAPEs, see Section A.0. Introduction to Projection Methodology, earlier in this appendix.
New Teacher Hires Projection ModelThe New Teacher Hires Projection Model was estimated separately for public and private school teachers. The model produces projections of the number of teachers who were not teaching in the previous year, but who will be hired in a given year.
About new teacher hiresA teacher is considered to be a new teacher hire for a control of school (public or private) for a given year if the teacher teaches in that control that year but had not taught in that control in the previous year. Included among new teachers hires are: (1) teachers who are new to the profession; (2) teachers who had taught previously but had not been teaching the previous year; and (3) teachers who had been teaching in one control the previous year but have moved to the other control. Concerning the last category, if a teacher moves from one public school to a different public school, that teacher would not be counted as a new teacher hire for the purposes of this model. On the other hand, if a teacher moves from a public school to a private school, that teacher would be counted as a private school new teacher hire, since the teacher did not teach in a private school in the previous year.
The New Teacher Hires Projection Model measures the demand for teacher hires. Due to difficulties in defining and measuring the pool of potential teachers, no attempt was made to measure the supply of new teacher candidates.
Steps used to project numbers of new teacher hiresThe steps outlined below provide a general summary of how the New Teacher Hires Projection Model was used to produce projections of the need for new teacher hires.
For more information about the New Teacher Hires Projection Model, see Hussar (1999).
First, the series of steps outlined below was used to produce projections of public school new teacher hires. Then, the same steps were used to produce projections of private school new hires. Finally, the public and private new teacher hires were combined to produce projections of total new teacher hires.
Step 1. Estimate the age distribution of full-time-equivalent (FTE) teachers in 2011. For this estimate, the age distribution of the headcount of school teachers (including both full-time and part-time teachers) in 2011 was applied to the national number of FTE teachers in the same year.
Step 2. Project the number of new FTE teacher hires needed to replace those who left teaching between 2011 and 2012.
» Age-specific continuation rates for 2012 (due to data availability, 2008 continuation rates were used for private school new teacher hires) were applied to the FTE count of teachers by age for 2011, resulting in estimates of the number of FTE teachers who remained in teaching in 2012 by individual age.
» The FTE teachers who remained in teaching by individual age were summed across all ages to produce a projection of the total number of FTE teachers who remained teaching in 2012.
» The total projection of remaining FTE teachers in 2012 was subtracted from the total FTE teacher count for 2011 to produce the projected number of FTE teachers who left teaching.
Step 3. Project the number of new FTE teacher hires needed due to the overall increase in the teacher workforce between 2011 and 2012. The total number of FTE teachers in 2011 was subtracted from the total projected number of FTE teachers in 2012 to project the overall increase in the teaching workforce between 2011 and 2012.
Step 4. Project the total number of new FTE teacher hires needed in 2012. The number of FTE teachers who left teaching from step 2 was added to the projected net change in the number of FTE teachers from step 3 to project the total number of new FTE teacher hires needed in 2012.

92 Appendix A. Introduction to Projection Methodology
Step 5. Project the FTE count of teachers by age for 2012. In this step
» The age distribution for the headcount of newly hired teachers in 2011 was applied to the projected total number of new FTE teacher hires in 2012, resulting in the projected number of new FTE teacher hires by age.
» For each individual age, the projected number of new FTE teacher hires was added to the projected number of remaining FTE teachers (from step 2, first bullet) to produce the projected FTE count of teachers by age for 2012.
Step 6. Repeat steps 2 to 5 for each year from 2013 through 2026.
» In step 2
• For public school teachers ages 22 through 66 and private school teachers ages 21 through 65, projections of age-specific continuation rates were used. A separate smoothing constant, chosen to minimize the sum of squared forecast errors, was used to calculate the projected progression rate for each age. (For a general description of the exponential smoothing technique, see Section A.0. Introduction to Projection Methodology, earlier in this appendix.)
• For all other ages, the age-specific continuation rates for 2012 for public school teachers and 2008 for private school teachers (the last year of actual data) were used.
» In step 3, projections of the numbers of FTE teachers were used for all years in which there were no actual teacher numbers. The projections of FTE teachers are described under “Elementary and Secondary Teacher Projection Model,” earlier in this section of appendix A.
Assumptions underlying this methodA number of assumptions are made in order to make these projections. They include that (1) the age distribution of FTE teachers in 2011 was similar to that of full-time and part-time teachers in that year (step 1); (2) the age-specific continuation rates for FTE teachers for each year from 2012 through 2026 are similar to either the projections produced using single exponential smoothing or the values for 2012, depending on the age of the teachers (step 2); (3) the age distribution for newly hired FTE teachers from 2012 through 2026 is similar to that of newly hired full-time and part-time teachers in 2011 (step 3); (4) the actual numbers of FTE teachers for each year from 2013 through 2026 are similar to projections of FTE teachers shown in table 8 on page 50; and (5) no economic or political changes further affect the size of the teaching force.
Data used for projections of new teacher hiresData on numbers of public school teachers. The number of FTE teachers for 2012 and 2014 came from the NCES Common Core of Data (CCD).
Data on numbers of private school teachers. Private school data on the numbers of FTE teachers in 2003–04, 2005–06, 2007–08, 2009–10, 2011–12, and 2013–14 came from the biennial NCES Private School Universe Survey (PSS). Since the PSS is collected in the fall of odd-numbered years, data for years without a PSS collection were estimated using data from the PSS.
Data on the age distribution of public and private school teachers. Data on the age distribution of full-time and part-time public and private school teachers came from the 2011–12 NCES Schools and Staffing Survey (SASS). These data and their standard errors are shown in table A-11 on page 93.
Data on the age distribution of public and private new teacher hires. Data on the age distribution of newly hired full-time and part-time public and private school teachers came from the 2011–12 NCES Schools and Staffing Survey (SASS). These data and their standard errors are shown in table A-12 on page 93.
Data on and projections of age-specific continuation rates of public and private school teachers. The 2008 continuation rates came from the 2008–09 NCES Teacher Follow-Up Survey (TFS) and the 2012 continuation rates came from the 2012–13 TFS. Data from the 1994–95, 2000–01, and 2004-05 TFS were also used in the projection of age-specific continuation rates. The actual data, their standard errors, and the projections are shown in table A-13 on page 94.
Projections of the numbers of public and private elementary and secondary school teachers. These projections are described under “Elementary and Secondary Teacher Projection Model,” earlier in this section of appendix A.
Accuracy of projections of new teacher hiresNo MAPEs are presented for new teacher hires as there has only been two additional years of historical data for this statistic since it was first included in Projections of Education Statistics to 2018.

Projections of Education Statistics to 2026 93
Table A-10. Estimated equations and model statistics for public elementary and secondary teachers based on data from 1972 through 2014
Dependent variable Equation1 R2
Breusch-GodfreySerial CorrelationLM test statistic2 Time period
1 2 3 4 5
Elementary .................................................. ln (RELENRTCH) = 3.81 + 0.07 ln (RSALARY) - 0.23 ln (RSGRNTELENR) 0.99 .27 (0.872) 1972 to(48.434) (6.732) (-12.799) 2014
Secondary ................................................... ln (RSCENRTCH) = 4.17 - 0.22 ln (RSGRNTSCENR) + 0.72 ln (RSCENRPU) + .63 AR (1) 0.98 2.22 (0.330) 1973 to(34.819) (-12.383) (5.453) (4.706) 2014
1AR(1) indicates that the model was estimated using least squares with the AR(1) processfor correcting for first-order autocorrelation. To estimate the model, it was first transformedinto a nonlinear model and then the coefficients were estimated simultaneously by applying aMarquardt nonlinear least squares algorithm to the transformed equation. For a general dis-cussion of the problem of autocorrelation, and the method used to forecast in the presenceof autocorrelation, see Judge, G., Hill, W., Griffiths, R., Lutkepohl, H., and Lee, T. (1985). TheTheory and Practice of Econometrics. New York: John Wiley and Sons, pp. 315–318. Num-bers in parentheses are t-statistics.2The number in parentheses is the probability of the Chi-Square associated with theBreusch-Godfrey Serial Correlation LM Test. A p value greater that 0.05 implies that we donot reject the null hypothesis of no autocorrelation at the 5 percent significance level for atwo-tailed test and 10 percent significance level for a one-tailed test, i.e., there is no auto-correlation present. For an explanation of the Breusch-Godfrey Serial Correlation LM teststatistic, see Greene, W. (2000). Econometric Analysis. New Jersey: Prentice-Hall.NOTE: R2 indicates the coefficient of determination.
RELENRTCH = Ratio of public elementary school enrollment to classroom teachers (i.e.,pupil/teacher ratio). RSCENRTCH = Ratio of public secondary school enrollment to classroom teachers (i.e.,pupil/teacher ratio). RSALARY = Average annual teacher salary relative to the overall economy wage in 2000dollars. RSGRNTELENR = Ratio of education revenue receipts from state sources per capita topublic elementary school enrollment in 2000 dollars. RSGRNTSCENR = Ratio of education revenue receipts from state sources per capita topublic secondary school enrollment in 2000 dollars. RSCENRPU = The ratio of enrollment in public secondary schools to the 11- to 18-year-oldpopulation. SOURCE: U.S. Department of Education, National Center for Education Statistics, Elemen-tary and Secondary Teacher Projection Model, 1972 through 2026. (This table was pre-pared February 2017.)
Table A-11. Percentage distribution of full-time and part-time school teachers, by age, control of school, and teaching status: School year 2011–12
Control of school and teaching status Percent of total
Age distribution
TotalLess than25 years 25–29 years 30–39 years 40–49 years 50–59 years 60–64 years 65 years or more
1 2 3 4 5 6 7 8 9 10
Public actual .............................................. 100.0 (†) 100.0 2.8 (0.24) 12.5 (0.58) 28.9 (0.79) 25.1 (0.75) 23.1 (0.72) 6.1 (0.45) 1.4 (0.20)Full-time ....................................................... 93.1 (0.46) 100.0 2.9 (0.25) 12.8 (0.60) 29.3 (0.85) 24.9 (0.81) 22.8 (0.76) 6.0 (0.48) 1.3 (0.21)Part-time ...................................................... 6.9 (0.46) 100.0 1.9 (0.59) 8.7 (2.04) 23.4 (2.92) 27.5 (3.22) 27.0 (2.58) 8.7 (1.80) 2.9 (0.99)
Private actual ............................................. 100.0 (†) 100.0 4.6 (1.35) 12.2 (1.26) 24.0 (1.58) 23.8 (1.57) 21.3 (1.57) 9.6 (0.97) 4.6 (0.93)Full-time ....................................................... 79.4 (2.04) 100.0 4.7 (1.30) 12.5 (1.25) 25.6 (1.82) 23.8 (1.75) 21.1 (1.66) 9.0 (1.07) 3.3 (0.94)Part-time ...................................................... 20.6 (2.04) 100.0 4.0 (1.90) 10.9 (3.14) 18.2 (4.31) 23.5 (3.39) 22.2 (3.15) 11.8 (3.09) 9.4 (2.60)
† Not applicable.NOTE: Detail may not sum to totals because of rounding. Standard errors appear in paren-theses. The 2011–12 data are the most recent data available.
SOURCE: U.S. Department of Education, National Center for Education Statistics, Schoolsand Staffing Survey (SASS), “Public School Teacher Questionnaire,” 2011–12 and “PrivateSchool Teacher Questionnaire,” 2011–12; and unpublished tabulations. (This table wasprepared February 2014.)
Table A-12. Percentage distribution of full-time and part-time newly hired teachers, by age and control of school: Selected school years, 1987–88 through 2011–12
Control of school and school year
Age distribution
Total Less than 25 years 25–29 years 30–39 years 40–49 years 50–59 years 60–64 years 65 years or more
1 2 3 4 5 6 7 8 9
Public1987–88 ....................................................... 100.0 17.7 (0.79) 23.7 (1.19) 33.0 (1.43) 21.2 (0.80) 4.0 (0.51) 0.3 ! (0.11) ‡ (†)1990–91 ....................................................... 100.0 17.5 (1.06) 24.0 (1.35) 30.6 (1.33) 21.4 (1.28) 5.6 (0.65) 0.6 (0.18) ‡ (†)1993–94 ....................................................... 100.0 16.2 (0.91) 28.7 (1.15) 24.9 (1.04) 24.6 (1.16) 5.0 (0.63) 0.5 (0.13) 0.2 ! (0.09)1999–2000 ................................................... 100.0 23.6 (1.28) 22.5 (0.97) 22.2 (1.10) 19.2 (0.90) 11.1 (0.88) 0.9 (0.23) 0.6 ! (0.26)2003–04 ....................................................... 100.0 24.4 (1.21) 19.0 (1.23) 24.6 (1.10) 16.5 (1.18) 13.3 (0.93) 1.5 (0.29) 0.7 ! (0.29)2007–08 ....................................................... 100.0 23.8 (1.75) 24.3 (1.79) 20.4 (1.56) 15.1 (0.94) 13.6 (1.22) 2.3 (0.39) 0.5 ! (0.22)2011–12 ....................................................... 100.0 21.9 (2.46) 23.0 (2.93) 24.1 (2.79) 15.9 (2.79) 10.9 (2.58) 3.5 ! (1.35) ‡ (†)
Private1987–88 ....................................................... 100.0 17.0 (1.27) 22.8 (1.68) 32.5 (2.17) 17.9 (1.61) 5.3 (1.09) ‡ (†) 1.8 ! (0.77)1990–91 ....................................................... 100.0 15.8 (1.47) 26.3 (1.83) 29.1 (1.86) 21.1 (1.67) 5.6 (0.88) 1.1 ! (0.40) 1.0 ! (0.42)1993–94 ....................................................... 100.0 19.3 (1.13) 24.4 (1.19) 24.9 (1.49) 22.6 (1.18) 7.3 (0.85) 0.9 (0.20) 0.6 ! (0.23)1999–2000 ................................................... 100.0 18.5 (0.89) 17.2 (0.87) 24.1 (1.24) 22.1 (1.19) 14.0 (1.01) 2.6 (0.39) 1.5 (0.38)2003–04 ....................................................... 100.0 17.1 (1.59) 16.0 (2.13) 23.0 (2.19) 22.8 (3.32) 15.3 (1.77) 3.6 (0.83) 2.1 (0.58)2007–08 ....................................................... 100.0 14.3 (1.26) 18.2 (1.36) 23.2 (1.97) 23.6 (1.92) 14.4 (1.49) 4.2 (0.84) 2.1 ! (0.69)2011–12 ....................................................... 100.0 14.9 ! (5.78) 20.7 (4.29) 27.5 (4.62) 17.4 (4.74) 10.8 (2.51) 5.3 ! (2.32) ‡ (†)
† Not applicable.! Interpret with caution. The coefficient of variation (CV) for this estimate is between 30 per-cent or greater.‡ Reporting standards not met. The coeffiecient of variation (CV) for this estimate is 50 per-cent or greater.
NOTE: Detail may not sum to totals because of rounding. Standard errors appear in paren-theses. The 2011–12 data are the most recent data available.SOURCE: U.S. Department of Education, National Center for Education Statistics, Schoolsand Staffing Survey (SASS), “Public School Teacher Questionnaire,” 1987–88 through2011–12 and “Private School Teacher Questionnaire,” 1987–88 through 2011–12; andunpublished tabulations. (This table was prepared February 2014.)

94 Appendix A. Introduction to Projection Methodology
Table A-13. Actual and projected continuation rates of full-time and part-time school teachers, by age and control of school: Selected school years, 1993–94 to 1994–95 through 2026–27 to 2027–28
Control of school and school year Total
Continuation rates, by age
Less than25 years 25–29 years 30–39 years 40–49 years 50–59 years 60–64 years 65 years or more
1 2 3 4 5 6 7 8 9
Public actual1993–94 to 1994–95 .................................... 93.4 (0.36) 96.2 (1.09) 90.0 (1.22) 93.3 (1.03) 96.1 (0.54) 93.7 (0.77) 69.5 (4.79) 65.9 (8.81)1999–2000 to 2000–01 ................................ 92.4 (0.38) 95.8 (0.98) 89.3 (7.38) 93.2 (2.76) 94.5 (0.61) 92.9 (4.58) 76.8 ! (29.18) (‡) (†)2003–04 to 2004–05 .................................... 91.4 (0.55) 94.9 (1.79) 90.1 (1.71) 92.6 (0.93) 94.5 (0.78) 90.8 (0.81) 77.2 (3.00) 70.3 (9.40)2007–08 to 2008–09 .................................... 91.8 (0.45) 92.2 (1.95) 89.0 (2.33) 92.4 (1.29) 95.1 (1.06) 92.3 (1.23) 82.8 (3.97) 88.9 (4.26)2011–12 to 2012–13 .................................... 92.1 (0.65) 83.1 (9.79) 92.3 (1.39) 94.2 (1.14) 96.7 (0.53) 90.2 (1.38) 81.9 (3.11) 70.2 (12.44)
Public projected2012–13 to 2013–14 .................................... 92.3 (†) 90.1 (†) 91.8 (†) 94.0 (†) 96.7 (†) 90.3 (†) 81.4 (†) 69.6 (†)2013–14 to 2014–15 .................................... 92.3 (†) 89.9 (†) 91.8 (†) 93.9 (†) 96.8 (†) 90.2 (†) 81.7 (†) 69.8 (†)2014–15 to 2015–16 .................................... 92.2 (†) 90.0 (†) 91.8 (†) 93.9 (†) 96.8 (†) 90.2 (†) 81.5 (†) 68.6 (†)2015–16 to 2016–17 .................................... 92.3 (†) 89.9 (†) 91.8 (†) 93.8 (†) 96.7 (†) 90.3 (†) 81.8 (†) 69.5 (†)2016–17 to 2017–18 .................................... 92.3 (†) 89.9 (†) 91.8 (†) 93.8 (†) 96.7 (†) 90.3 (†) 81.6 (†) 70.4 (†)2017–18 to 2018–19 .................................... 92.3 (†) 89.9 (†) 91.8 (†) 93.9 (†) 96.7 (†) 90.3 (†) 81.5 (†) 70.4 (†)2018–19 to 2019–20 .................................... 92.4 (†) 89.9 (†) 91.8 (†) 93.9 (†) 96.6 (†) 90.4 (†) 81.6 (†) 70.9 (†)2019–20 to 2020–21 .................................... 92.4 (†) 90.0 (†) 91.8 (†) 94.0 (†) 96.6 (†) 90.4 (†) 81.6 (†) 70.9 (†)2020–21 to 2021–22 .................................... 92.5 (†) 89.9 (†) 91.8 (†) 94.0 (†) 96.6 (†) 90.4 (†) 81.6 (†) 71.5 (†)2021–22 to 2022–23 .................................... 92.5 (†) 89.9 (†) 91.8 (†) 94.0 (†) 96.6 (†) 90.5 (†) 81.5 (†) 71.2 (†)2022–23 to 2023–24 .................................... 92.5 (†) 89.9 (†) 91.8 (†) 94.0 (†) 96.6 (†) 90.5 (†) 81.6 (†) 71.0 (†)2023–24 to 2024–25 .................................... 92.5 (†) 89.9 (†) 91.8 (†) 94.0 (†) 96.6 (†) 90.5 (†) 81.5 (†) 71.0 (†)2024–25 to 2025–26 .................................... 92.5 (†) 89.9 (†) 91.8 (†) 93.9 (†) 96.6 (†) 90.5 (†) 81.5 (†) 70.6 (†)2025–26 to 2026–27 .................................... 92.5 (†) 89.9 (†) 91.8 (†) 93.9 (†) 96.6 (†) 90.5 (†) 81.6 (†) 70.9 (†)2026–27 to 2027–28 .................................... 92.5 (†) 89.9 (†) 91.8 (†) 93.9 (†) 96.7 (†) 90.4 (†) 81.6 (†) 70.1 (†)
Private actual1993–94 to 1994–95 .................................... 88.1 (0.74) 80.0 (4.42) 86.9 (1.64) 85.1 (1.70) 91.3 (1.14) 91.8 (1.52) 86.9 (2.74) 58.1 (8.67)1999–2000 to 2000–01 ................................ 83.0 (0.72) 61.7 (4.90) 72.2 (2.76) 80.2 (1.57) 86.1 (1.47) 92.3 (1.00) 78.8 (4.79) 75.2 (5.17)2003–04 to 2004–05 .................................... 83.3 (2.06) 75.4 (5.97) 71.7 (3.62) 82.2 (2.30) 86.8 (2.28) 89.2 (9.17) 80.1 (4.15) 79.5 (6.07)2007–08 to 2008–09 .................................... 82.2 (1.69) 77.7 (8.33) 71.7 (6.44) 79.1 (3.43) 86.1 (2.92) 86.8 (2.17) 85.2 (4.21) 77.3 (8.23)
Private projected2012–13 to 2013–14 .................................... 81.5 (†) 69.1 (†) 73.2 (†) 80.2 (†) 86.0 (†) 88.1 (†) 80.0 (†) 75.9 (†)2013–14 to 2014–15 .................................... 81.2 (†) 68.7 (†) 73.2 (†) 80.2 (†) 86.1 (†) 87.6 (†) 79.9 (†) 75.4 (†)2014–15 to 2015–16 .................................... 81.5 (†) 70.2 (†) 73.4 (†) 80.2 (†) 86.0 (†) 87.5 (†) 79.5 (†) 77.9 (†)2015–16 to 2016–17 .................................... 81.6 (†) 69.3 (†) 73.3 (†) 80.1 (†) 86.2 (†) 87.9 (†) 80.0 (†) 76.7 (†)2016–17 to 2017–18 .................................... 81.4 (†) 69.1 (†) 73.3 (†) 80.1 (†) 85.8 (†) 87.7 (†) 80.3 (†) 75.9 (†)2017–18 to 2018–19 .................................... 81.4 (†) 69.2 (†) 73.4 (†) 80.1 (†) 85.9 (†) 87.6 (†) 79.6 (†) 77.1 (†)2018–19 to 2019–20 .................................... 81.4 (†) 69.2 (†) 73.3 (†) 80.1 (†) 86.0 (†) 87.7 (†) 79.4 (†) 77.3 (†)2019–20 to 2020–21 .................................... 81.4 (†) 69.2 (†) 73.3 (†) 80.2 (†) 86.0 (†) 87.8 (†) 79.8 (†) 76.3 (†)2020–21 to 2021–22 .................................... 81.4 (†) 69.2 (†) 73.2 (†) 80.2 (†) 85.9 (†) 87.7 (†) 79.8 (†) 76.8 (†)2021–22 to 2022–23 .................................... 81.3 (†) 69.2 (†) 73.2 (†) 80.2 (†) 86.0 (†) 87.6 (†) 79.8 (†) 76.0 (†)2022–23 to 2023–24 .................................... 81.3 (†) 69.2 (†) 73.2 (†) 80.2 (†) 85.9 (†) 87.7 (†) 80.1 (†) 75.3 (†)2023–24 to 2024–25 .................................... 81.3 (†) 69.2 (†) 73.2 (†) 80.2 (†) 85.9 (†) 87.7 (†) 80.2 (†) 75.9 (†)2024–25 to 2025–26 .................................... 81.3 (†) 69.2 (†) 73.2 (†) 80.2 (†) 86.0 (†) 87.7 (†) 79.6 (†) 76.0 (†)2025–26 to 2026–27 .................................... 81.3 (†) 69.2 (†) 73.2 (†) 80.2 (†) 85.9 (†) 87.8 (†) 79.6 (†) 75.8 (†)2026–27 to 2027–28 .................................... 81.3 (†) 69.2 (†) 73.2 (†) 80.2 (†) 85.9 (†) 87.7 (†) 80.0 (†) 75.8 (†)
† Not applicable.! Interpret with caution. The coefficient of variation (CV) for this estimate is between 30 per-cent or greater.‡ Reporting standards not met. The coefficient of variation (CV) for this estimate is 50 per-cent or greater.NOTE: The continuation rate for teachers for each control of school (public schools and pri-vate schools) is the percentage of teachers in that control who continued teaching in the
same control from one year to the next. Standard errors appear in parentheses. The 2012–13data are the most recent data available for public school teachers and the 2008–09 data arethe most recent data available for private school teachers.SOURCE: U.S. Department of Education, National Center for Education Statistics, TeacherFollow up Survey (TFS), “Public School Teacher Questionnaire,” 1994–95 through 2008–09 and “Private School Teacher Questionnaire,” 1994–95 through 2012–13; and unpub-lished tabulations. (This table was prepared February 2017.)

Projections of Education Statistics to 2026 95
A.3. HIGH SCHOOL GRADUATES
Projections in this editionThis edition of Projections of Education Statistics presents projected trends in the number of high school graduates from 2014–15 to 2026–27. These projections were made using three models:
» The National High School Graduates Projection Model was used to project the number of public high school graduates, the number of private high school graduates, and the total number of high school graduates for the nation.
» The State Public High School Graduates Projection Model was used to project the number of public high school graduates for individual states and regions.
» The National Public High School Graduates by Race/Ethnicity Projection Model was used to project the number of public high school graduates for the nation by race/ethnicity.
Overview of approachAll the high school graduates models first calculated the number of high school graduates as a percentage of grade 12 enrollment based on historical data. Single exponential smoothing was used to project this percentage. The projected percentage was then applied to projections of grade 12 enrollment.
Assumptions underlying this approachThe percentage of 12th-graders who graduate was assumed to remain constant at levels consistent with the most recent rates. This methodology assumes that past trends in factors affecting graduation rates, such as dropouts, migration, and public or private transfers, will continue over the forecast period. No specific assumptions were made regarding the dropout rate, retention rate, or the rate at which alternative credentials are awarded. The combined effect of these proportions is reflected implicitly in the graduate proportion. In addition to student behaviors, the projected number of graduates could be affected by changes in graduation requirements, but this is not considered in the projections in this report.
Procedures used in all three high school graduates projection modelsThe following steps were used to project the numbers of high school graduates:
Step 1. For each year in the historic period, express the number of high school graduates as a percentage of grade 12 enrollment. This value represents the approximate percentage of 12th graders who graduate. For information about the specific historical data and analysis periods used for the National High School Graduates Model, the State Public High School Graduates Model, and the National Public High School Graduates by Race/Ethnicity Model, see the description of the appropriate model, later in this section of appendix A.
Step 2. Project the percentage of 12th-graders who graduate from step 1. This percentage was projected using single exponential smoothing with a smoothing constant chosen to minimize the sum of squared forecast errors. Because single exponential smoothing produces a single forecast for all years in the forecast period, the same projected percentage of grade 12 enrollment was used for each year in the forecast period.
Step 3. Calculate projections of the numbers of high school graduates. For each year in the forecast period, the projected percentage from step 2 was applied to projections of grade 12 enrollment to yield projections of high school graduates.
National High School Graduates Projection ModelThis model was used to project the number of public high school graduates, the number of private high school graduates, and the total number of high school graduates for the nation. Public and private high school graduates were projected separately. The public and private projections were then summed to yield projections of the total number of high school graduates for the nation.
For details of the procedures used to develop the projections, see “Procedures used in all three high school graduates projection models,” above.

96 Appendix A. Introduction to Projection Methodology
Data used in the National High School Graduates Projection ModelPublic school data on graduates and grade 12 enrollment. Data on public school 12th-grade enrollments and high school graduates from the NCES Statistics of Public Elementary and Secondary School Systems for 1972–73 to 1980–81 and the NCES Common Core of Data (CCD) for 1981–82 through 2005–06 were used to develop national projections of public high school. Also, for 2006–07 through 2013–14, data on public school 12th-grade enrollments from the CCD and data on high school graduate from the “State Dropout and Completion Data File” were used.
Private school data on graduates and grade 12 enrollment. Data on private school 12th-grade enrollments for 1989–90 through 2013–14 and high school graduates for 1988–89 through 2012–13 were used to develop national projections of private high school graduates. The data were from the biennial NCES Private School Universe Survey (PSS) from 1989–90 to 2013–14 with data for 12th grade enrollment the same as the year of the survey and the data for high school graduates for the preceding year (i.e., the 2013–14 PSS presents high school graduates for 2012–13). Since the PSS is collected in the fall of odd-numbered years, data for missing years were estimated using data from the PSS. For 12th grade enrollment, estimates for missing years were linear interpolations of the prior year’s and succeeding year’s actual values. For high school graduates, estimates for the missing years were the interpolations of the high school graduates to estimated 12th grade enrollment percentages for the prior and succeeding years multiplied by the estimated enrollments for the current year.
Public and private school enrollment projections for grade 12. Projections of grade 12 enrollment in public schools and in private schools were used to develop projections of public high school graduates and private high school graduates, respectively. The grade 12 enrollment projections were made using the grade progression method. For more information, see Section A.1. Elementary and Secondary Enrollment, earlier in this appendix.
Accuracy of national high school graduates projectionsMean absolute percentage errors (MAPEs) for projections of graduates from public high schools were calculated using the last 26 editions of Projections of Education Statistics, while MAPEs for projections of graduates from private high schools were calculated using the last 15 editions. Table D, below, shows MAPEs for both public and private school graduation projections.
Table D. Mean absolute percentage errors (MAPEs) of projections of high school graduates, by lead time and control of school: MAPEs constructed using projections from Projections of Education Statistics to 2000 through Projections of Education Statistics to 2025
StatisticLead time (years)
1 2 3 4 5 6 7 8 9 10
Public high school graduates 1.0 1.1 1.8 2.2 2.5 2.9 3.5 4.2 4.8 5.1Private high school graduates 1.8 1.5 1.6 3.7 4.9 4.2 2.8 4.7 4.5 4.9NOTE: MAPEs for public high school graduates were calculated from the past 26 editions of Projections of Education Statistics, from Projections of Education Statistics to 2000 through Projections of Education Statistics to 2025. MAPEs for private high school graduates were calculated from the past 15 editions of Projections of Education Statistics, from Projections of Education Statistic to 2011 through Projections of Education Statistics to 2025. Calculations were made using unrounded numbers. Some data have been revised from previously published figures.SOURCE: U.S. Department of Education, National Center for Education Statistics, Projections of Education Statistics, various issues. (This table was prepared February 2017.)
For more information about MAPEs, see Section A.0. Introduction to Projection Methodology, earlier in appendix A.
State Public High School Graduates Projection ModelThis edition of Projections of Education Statistics contains projections of public high school graduates from 2014–15 to 2026–27 for each of the 50 states and the District of Columbia, as well as for each region of the country. The state projections of high school graduates were produced in two stages:
» first, an initial set of projections for each state was produced; and
» second, these initial projections were adjusted to sum to the national public school totals produced by the National High School Graduates Projection Model.
For each region, the high school graduate projections equaled the sum of high school graduate projections for the states within that region.

Projections of Education Statistics to 2026 97
Initial set of state projectionsThe same steps used to produce the national projections of high school graduates were used to produce an initial set of projections for each state and the District of Columbia. A separate smoothing constant, chosen to minimize the sum of squared forecast errors, was used to calculate the projected percentage of 12th grade enrollment for each jurisdiction.
For details on the steps used to develop the initial sets of projections, see “Procedures used in all three high school graduate projection models,” earlier in this section of appendix A.
Adjustments to the state projectionsThe initial projections of state public high school graduates were adjusted to sum to the national projections of public high school graduates shown in table 9 on page 51. This was done through the use of ratio adjustments in which all the states’ high school graduate projections were multiplied by the ratio of the national public high school graduate projection to the sum of the state public high school graduate projections.
Data used in the State Public High School Graduates Projection ModelPublic school data on graduates and grade 12 enrollment at the state level. State-level data on public school high school graduates from the NCES Statistics of Public Elementary and Secondary School Systems for 1972–73 to 1980–81, the NCES Common Core of Data (CCD) for 1981–82 through 2004–05, and the “State Dropout and Completion Data File” for 2005–06 through 2013–14 were used to develop state-level projections of public high school graduates. State-level data on public school 12th-grade enrollments from the NCES Statistics of Public Elementary and Secondary School Systems for 1972–73 to 1980–81 and the NCES Common Core of Data (CCD) for 1981–82 through 2014–15 were also used.
Public school projections for grade 12 enrollment at the state level. State-level projections of grade 12 enrollment in public schools were used to develop the state-level projections of public high school graduates. The grade 12 enrollment projections were made using the grade progression method. For more information, see Section A.1. Elementary and Secondary Enrollment, earlier in this appendix.
Accuracy of state public high school graduate projectionsMean absolute percentage errors (MAPEs) for projections of the number of public high school graduates by state were calculated using the last 21 editions of Projections of Education Statistics. Table A-14 on page 99 shows MAPEs for the number of high school graduates by state.
National Public High School Graduates by Race/Ethnicity Projection ModelThe projections of public high school graduates by race/ethnicity were produced in two stages:
» first, an initial set of projections for each racial/ethnic group was produced; and
» second, these initial projections were adjusted to sum to the national public school totals produced by the National High School Graduates Projection Model.
Initial set of projections by race/ethnicityThe same steps used to produce the national projections of high school graduates were used to produce an initial set of projections for each of the following five racial/ethnic groups: White, Black, Hispanic, Asian/Pacific Islander, and American Indian/Alaska Native. For example, the number of White public high school graduates was projected as a percentage of White grade 12 enrollment in public schools. A separate smoothing constant, chosen to minimize the sum of squared forecast errors, was used to calculate the projected percentage of 12th-grade enrollment for each racial/ethnic group. This is the third edition of Projections of Education Statistics to include projections for high school graduates of Two or more races. To produce an initial set of projections for this racial/ethnic group, the 2013–14 ratio of 12th-grade enrollment to high school graduates of the group were multiplied by the 12th-grade enrollment projections of the group from the data file used to produce table 6.
Adjustments to the projections by race/ethnicityThe projections of public high school graduates by race/ethnicity were adjusted to sum to the national projections of public high school graduates shown in table 9 on page 51. This was done through the use of ratio adjustments in which all high school graduate projections by race/ethnicity were multiplied by the ratio of the national high school graduate projection to the sum of the high school projections by race/ethnicity.

98 Appendix A. Introduction to Projection Methodology
Data and imputations used in the Public High School Graduates by Race/Ethnicity Projection ModelPublic school data on graduates and grade 12 enrollment by race/ethnicity. Data on public school high school graduates by race/ethnicity from the NCES Common Core of Data (CCD) for 1994–95 through 2004–05, and the “State Dropout and Completion Data File” for 2005–06 through 2013–14 were used to develop projections of public high school graduates by race/ethnicity. Data on public school 12th-grade enrollments by race/ethnicity from the NCES Statistics of Public Elementary and Secondary School Systems for 1972–73 to 1980–81 and the NCES Common Core of Data (CCD) for 1981–82 through 2014–15 were also used. In those instances where states did not report their high school graduate data by race/ethnicity, the state-level data had to be examined and some imputations made. For example, in 1994, Arizona did not report high school graduate data by race/ethnicity. It did, however, report grade 12 enrollment numbers by race/ethnicity for that year. So, to impute the high school graduate numbers by race/ethnicity for that year, Arizona’s total number of high school graduates for 1994 was multiplied by the state’s 1994 racial/ethnic distribution for grade 12 enrollment.
Public enrollment projections for grade 12 by race/ethnicity. Projections of grade 12 enrollment in public schools by race/ethnicity were used to develop the projections of public high school graduates by race/ethnicity. The grade 12 enrollment projections were made using the grade progression method. For more information, see Section A.1. Elementary and Secondary Enrollment, earlier in this appendix.
Accuracy of enrollment projections by race/ethnicityMean absolute percentage errors (MAPEs) for projections of the number of public high school graduates by race/ethnicity were calculated using the last seven editions of Projections of Education Statistic. Table E, below, shows MAPEs for public high school graduates by race/ethnicity projections.
Table E. Mean absolute percentage errors (MAPEs) of projections of public high school graduates, by lead time and race/ethnicity: MAPEs constructed using projections from Projections of Education Statistics to 2000 through Projections of Education Statistics to 2025
StatisticLead time (years)
1 2 3 4 5 6 7 8 9 10
Total high school graduates 1.0 1.1 1.8 2.2 2.5 2.9 3.5 4.2 4.8 5.1White 1.0 0.5 0.8 1.3 2.5 3.5 — — — —Black 2.3 3.0 3.5 5.8 7.1 9.3 — — — —Hispanic 3.6 4.5 6.6 13.2 16.9 16.2 — — — —Asian/Pacific Islander 1.5 2.6 2.8 1.6 2.3 0.5 — — — —American Indian/Alaska Native 1.9 1.8 3.7 6.9 8.8 7.8 — — — —
— Not available.NOTE: MAPEs for public high school graduates were calculated from the past 26 editions of Projections of Education Statistics, from Projections of Education Statistics to 2000 through Projections of Education Statistics to 2025. MAPEs for public high school graduates by race/ethnicity were calculated using the last 7 editions of Projections of Education Statistics, from Projections of Education Statistics to 2019 through Projections of Education Statistics to 2025. Calculations were made using unrounded numbers. Some data have been revised from previously published figures.SOURCE: U.S. Department of Education, National Center for Education Statistics, Projections of Education Statistics, various issues. (This table was prepared February 2017.)

Projections of Education Statistics to 2026 99
Table A-14. Mean absolute percentage errors (MAPEs) for the projected number of high school graduates in public schools, by lead time, region, and state: MAPEs constructed using projections from Projections of Education Statistics to 2000 through Projections of Education Statistics to 2025
Region and state
Lead time (years)
1 2 3 4 5 6 7 8 9 10
1 2 3 4 5 6 7 8 9 10 11
United States ................................. 1.0 1.1 1.8 2.2 2.5 2.9 3.5 4.2 4.8 5.1Region
Northeast ................................................. 1.1 1.6 1.7 2.3 3.0 3.6 3.7 4.4 5.2 5.6Midwest .................................................... 1.1 0.9 1.5 1.8 2.4 2.8 2.8 3.0 3.3 3.3South ....................................................... 1.1 1.5 2.5 3.1 3.7 4.5 5.0 6.0 6.9 7.9West ......................................................... 1.7 2.0 2.6 3.7 3.5 3.5 3.0 2.7 3.4 3.4
StateAlabama ................................................... 3.1 3.1 2.8 5.1 6.1 7.3 8.2 8.5 9.5 10.3Alaska ...................................................... 2.5 2.1 3.0 4.6 5.2 6.6 7.5 7.8 7.8 7.6Arizona ..................................................... 7.6 8.0 10.0 12.6 11.4 11.6 13.8 11.6 10.5 12.5Arkansas .................................................. 1.3 1.6 2.0 2.5 2.9 2.4 2.3 2.8 3.1 3.9California .................................................. 2.4 2.5 3.3 4.6 5.0 5.2 5.2 4.4 5.1 5.0
Colorado .................................................. 1.6 2.2 2.6 2.2 2.8 2.9 3.1 3.9 4.6 4.7Connecticut .............................................. 2.6 2.3 2.5 3.3 3.6 4.0 4.6 4.4 5.6 5.0Delaware .................................................. 1.9 2.5 3.2 4.6 3.9 4.9 5.0 6.0 6.7 7.6District of Columbia .................................. 6.7 7.4 11.6 14.0 14.1 14.8 15.9 17.2 17.9 20.5Florida ...................................................... 1.9 3.9 5.2 4.6 5.1 5.0 6.0 6.6 8.1 7.2
Georgia .................................................... 1.9 2.7 3.5 5.5 7.4 8.4 9.1 9.4 10.2 10.1Hawaii ...................................................... 3.3 3.8 4.4 5.4 8.2 8.9 10.9 11.8 13.4 14.5Idaho ........................................................ 1.0 1.3 1.4 1.9 2.2 2.7 3.0 3.8 4.9 5.4Illinois ....................................................... 2.5 2.1 2.9 3.6 3.8 3.7 5.4 4.4 5.1 6.5Indiana ..................................................... 1.4 1.8 1.8 2.3 2.7 3.2 3.9 4.3 4.7 5.0
Iowa ......................................................... 1.4 1.2 1.9 2.0 2.7 2.7 2.5 2.5 2.5 2.7Kansas ..................................................... 1.2 1.6 2.4 3.0 4.3 5.4 6.0 6.5 7.0 7.0Kentucky .................................................. 2.2 3.3 3.4 4.7 5.4 6.4 7.4 7.9 7.9 9.9Louisiana ................................................. 1.8 2.7 4.5 6.2 7.3 6.6 6.3 6.4 3.8 5.3Maine ....................................................... 2.5 3.8 3.7 4.8 5.6 6.7 8.6 9.3 11.0 11.7
Maryland .................................................. 1.2 1.2 1.8 1.7 2.4 2.8 3.3 3.3 3.5 4.6Massachusetts ......................................... 1.0 1.4 2.4 3.1 3.6 4.0 4.4 4.2 4.2 4.3Michigan .................................................. 2.9 3.8 4.5 5.6 5.5 5.5 7.1 8.0 8.7 9.5Minnesota ................................................ 2.1 1.2 1.5 1.8 2.2 2.4 2.9 3.6 4.0 4.7Mississippi ............................................... 1.4 1.6 2.2 2.5 3.5 4.3 4.4 5.1 5.5 5.7
Missouri ................................................... 0.9 1.4 2.3 2.8 3.5 4.4 4.9 5.4 6.4 6.7Montana ................................................... 0.8 0.9 1.4 1.6 2.5 3.5 4.4 5.9 7.1 8.3Nebraska ................................................. 2.0 2.5 2.6 2.7 3.1 3.2 2.7 2.7 2.6 3.1Nevada .................................................... 4.7 7.1 8.8 9.8 8.8 9.3 8.6 9.5 11.1 12.8New Hampshire ....................................... 1.1 2.0 2.3 3.0 3.8 4.8 5.5 6.6 7.2 7.4
New Jersey .............................................. 2.0 3.5 4.2 4.1 4.3 5.4 6.4 7.3 8.0 8.8New Mexico ............................................. 3.1 2.7 4.3 4.5 6.6 6.9 7.3 8.1 9.7 10.0New York ................................................. 1.8 2.9 3.3 5.0 6.1 7.4 8.2 9.2 9.8 10.5North Carolina .......................................... 1.9 2.4 3.6 4.1 4.9 5.6 5.9 6.8 7.8 10.2North Dakota ............................................ 1.2 1.7 2.1 2.8 3.4 3.6 4.0 4.5 5.3 7.1
Ohio ......................................................... 2.6 2.5 3.9 3.8 3.7 3.7 3.3 3.9 4.4 5.7Oklahoma ................................................ 1.2 1.4 1.7 1.6 2.2 2.9 3.3 3.5 3.7 4.4Oregon ..................................................... 1.8 2.1 2.6 4.0 4.3 5.0 5.7 6.8 7.2 6.9Pennsylvania ........................................... 1.6 2.6 3.2 3.3 3.3 3.0 2.8 3.3 3.9 4.1Rhode Island ............................................ 1.3 1.2 2.1 1.9 2.5 3.0 4.2 5.1 5.4 5.1
South Carolina ......................................... 1.7 3.2 3.1 5.3 6.7 8.2 8.6 9.0 9.0 9.5South Dakota ........................................... 2.2 2.9 3.2 5.0 7.7 8.4 9.7 10.9 12.5 13.8Tennessee ............................................... 4.2 6.1 7.9 11.1 13.5 15.5 15.8 16.4 16.2 15.4Texas ....................................................... 2.4 3.5 4.7 6.0 6.5 7.4 8.3 9.7 11.3 13.0Utah ......................................................... 4.6 5.6 5.3 6.2 6.1 4.9 4.8 4.9 4.3 2.3
Vermont ................................................... 1.9 2.2 3.2 4.7 6.6 6.9 7.5 8.3 9.5 9.8Virginia ..................................................... 1.4 2.1 2.7 4.0 4.8 4.8 4.3 3.6 3.9 4.4Washington .............................................. 1.8 1.9 2.7 2.6 3.0 3.8 4.1 4.2 5.5 5.4West Virginia ............................................ 0.6 1.0 1.8 1.9 2.4 3.5 3.8 5.0 5.4 6.0Wisconsin ................................................ 1.2 1.4 2.4 2.7 3.1 3.9 4.3 5.1 5.8 5.3Wyoming .................................................. 1.5 1.9 2.4 3.1 4.5 5.8 7.6 8.9 10.4 11.3
NOTE: Mean absolute percentage error (MAPE) is the average value over past projectionsof the absolute values of errors expressed in percentage terms. National MAPEs for publichigh school graduates were calculated using the last 26 editions of Projections of Educa-tion Statistics, from Projections of Education Statistics to 2000 through Projections of Edu-cation Statistics to 2025. State MAPEs were calculated using the last 21 editions of
Projections of Education Statistics, from Projections of Education Statistics to 2005 throughProjections of Education Statistics to 2025. Calculations were made using unrounded num-bers. Some data have been revised from previously published figures.SOURCE: U.S. Department of Education, National Center for Education Statistics, Projec-tions of Education Statistics, various issues. (This table was prepared February 2017.)

100 Appendix A. Introduction to Projection Methodology
A.4. EXPENDITURES FOR PUBLIC ELEMENTARY AND SECONDARY EDUCATION
Projections in this editionThis edition of Projections of Education Statistics presents projections of total current expenditures for public elementary and secondary education, current expenditures per pupil in fall enrollment, and current expenditures per pupil in average daily attendance for 2014–15 through 2026–27.
As the source of the elementary and secondary private school data, the NCES Private School Universe Survey, does not collect data for current expenditures, there are no projections for private school current expenditures.
Overview of approach Theoretical and empirical backgroundThe Public Elementary and Secondary Education Current Expenditure Projection Model used in this report is based on the theoretical and empirical literature on the demand for local public services such as education.1 Specifically, it is based on a type of model that has been called a median voter model. In brief, a median voter model posits that spending for each public good in the community (in this case, spending for education) reflects the preferences of the “median voter” in the community. This individual is identified as the voter in the community with the median income and median property value. The amount of spending in the community reflects the price of education facing the voter with the median income, as well as his income and tastes. There are competing models in which the level of spending reflects the choices of others in the community, such as government officials.
In a median voter model, the demand for education expenditures is typically linked to four different types of independent variables: (1) measures of the income of the median voter; (2) measures of intergovernmental aid for education going indirectly to the median voter; (3) measures of the price to the median voter of providing one more dollar of education expenditures per pupil; and (4) any other variables that may affect one’s tastes for education. The Public Elementary and Secondary Education Current Expenditure Projection Model contains independent variables of the first two types. It uses multiple linear regression analysis to define the relationships between these independent variables and current expenditures (the dependent variable).
Elementary and Secondary Education Current Expenditure Projection ModelProjections for current expenditures per pupil in fall enrollment were produced first. These projections were then used in calculating total expenditures and expenditures per pupil in average daily attendance.
Steps used to project current expenditures for public elementary and secondary educationStep 1. Produce projections of education revenue from state sources. The equation for education revenue included an AR(1) term for correcting for autocorrelation and the following independent variables:
» disposable income per capita in constant dollars; and
» the ratio of fall enrollment to the population.
To estimate the model, it was first transformed into a nonlinear model and then the coefficients were estimated simultaneously by applying a Marquardt nonlinear least squares algorithm to the transformed equation.
Step 2. Produce projections of current expenditures per pupil in fall enrollment. The equation for current expenditures per pupil for fall enrollment included an AR(1) term for correcting for autocorrelation and the following independent variables:
» disposable income per capita in constant dollars; and
» education revenue from state sources per capita in constant dollars. This variable was projected in step 1.
1 For a discussion of the theory together with a review of some of the older literature, see Inman (1979). More recent empirical work includes Gamkhar and Oates (1996) and Mitias and Turnbull (2001).

Projections of Education Statistics to 2026 101
To estimate the models, they were first transformed into nonlinear models and then the coefficients were estimated simultaneously by applying a Marquardt nonlinear least squares algorithm to the transformed equation.
For details on the equations used in steps 1 and 2, the data used to estimate these equations, and their results, see “Data and equations used for projections of current expenditures for public elementary and secondary education,” below.
Step 3. Produce projections of total current expenditures. Projections of total current expenditures were made by multiplying the projections for current expenditures per pupil in fall enrollment by projections for fall enrollment.
Step 4. Produce projections of current expenditures per pupil in average daily attendance. The projections for total current expenditures were divided by projections for average daily attendance to produce projections of current expenditures per pupil in average daily attendance.
All the projections were developed in 1982–84 dollars and then placed in 2015–16 dollars using the projections of the Consumer Price Index. Current-dollar projections were produced by multiplying the constant-dollar projections by projections for the Consumer Price Index. The Consumer Price Index and the other economic variables used in calculating the projections presented in this report were placed in school year terms rather than calendar year terms.
Data and equations used for projections of current expenditures for public elementary and secondary educationData used to estimate the equations for revenue from state sources and current expenditures per pupil. The following data for the period from 1973–74 to 2013–14 were used to estimate the equations:
» Current expenditures and revenues from state sources—For 1973–74 and 1975–76, the current expenditures data came from Statistics of State School Systems, published by NCES. For 1974–75 and 1976–77, the current expenditures data came from Revenues and Expenditures for Public Elementary and Secondary Education, also published by NCES. For 1977–78 through 2013–14, these data came from the NCES Common Core of Data (CCD) and unpublished data. For most years, the sources for the past values of revenue from state sources were identical to the sources for current expenditures.
» Disposable personal income per capita—Disposable personal income data from the Bureau of Economic Analysis were divided by population data from the U.S. Census Bureau.
» The ratio of fall enrollment to population data—Fall enrollment data from the CCD were divided by population data from the U.S. Census Bureau. (See table B-5 on page 133.)
Estimated equations and model statistics for revenue from state sources and current expenditures per pupil. For the results of the equations, see table A-15 on page 103. In each equation, the independent variables affect the dependent variable in the expected way. In the revenues from state sources equation:
» All other things being equal, as disposable income per capita increases so does local governments’ education revenue from state sources per capita; and
» As enrollment increases relative to the population, so does the local governments’ education revenue from state sources per capita.
» In the current expenditures per pupil equation: All other things being equal, as disposable income per capita increases, so does current expenditures per pupil; and
» As local governments’ education revenue from state sources per capita increases, so does current expenditures per pupil.Projections for economic variables. Projections for economic variables, including disposable income and the Consumer Price Index, were from the “U.S. Quarterly Macroeconomic Model: November 2016 Short-Term Baseline Projections” from the economic consulting firm, IHS Global Inc. (see supplemental table B-5). This set of projections was IHS Global Inc.’s most recent set at the time the education projections in this report were produced. The values of all the variables from IHS Global Inc. were placed in school-year terms. The school-year numbers were calculated by taking the average of the last two quarters of one year and the first two quarters of the next year.
Projections for fall enrollment. The projections for fall enrollment are those presented in section 1 of this publication. The methodology for these projections is presented in Section A.1. Elementary and Secondary Enrollment, earlier in this appendix.
Projections for population. Population estimates for 1973 to 2015 and population projections for 2016 to 2026 from the U.S. Census Bureau were used to develop the public school current expenditure projections. The set of population projections used in this year’s Projections of Education Statistics are the Census Bureau’s 2014 National Population Projections (December 2014).
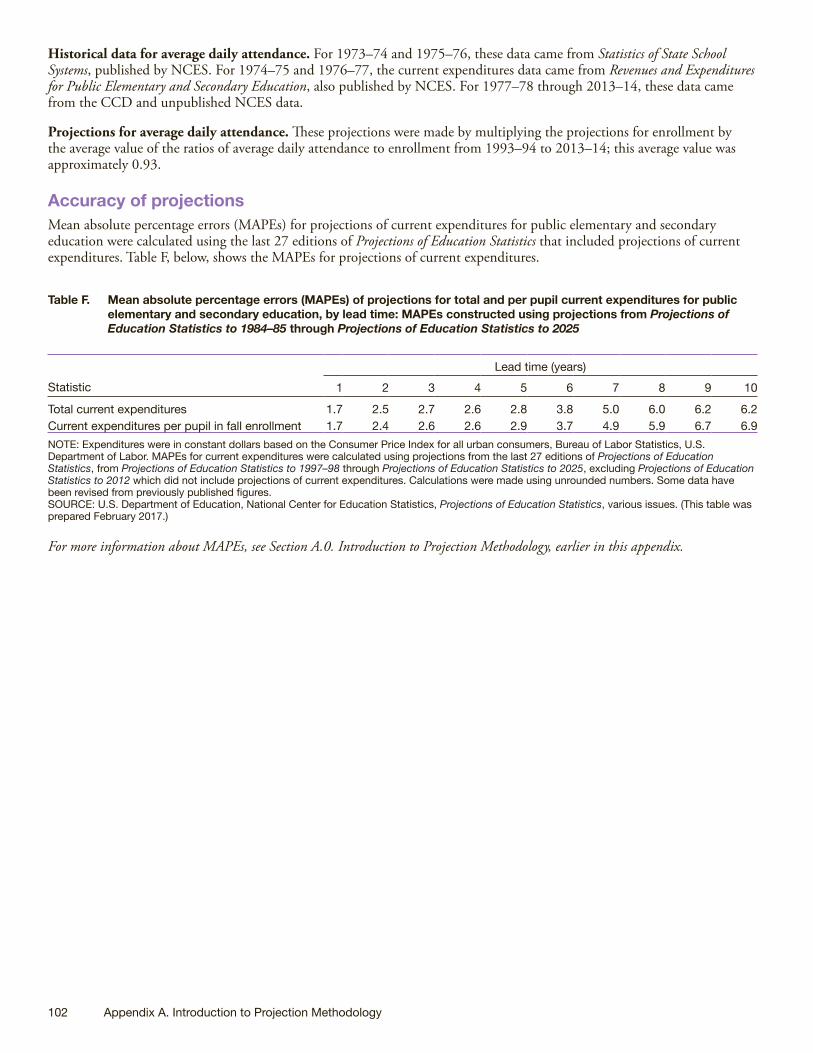
102 Appendix A. Introduction to Projection Methodology
Historical data for average daily attendance. For 1973–74 and 1975–76, these data came from Statistics of State School Systems, published by NCES. For 1974–75 and 1976–77, the current expenditures data came from Revenues and Expenditures for Public Elementary and Secondary Education, also published by NCES. For 1977–78 through 2013–14, these data came from the CCD and unpublished NCES data.
Projections for average daily attendance. These projections were made by multiplying the projections for enrollment by the average value of the ratios of average daily attendance to enrollment from 1993–94 to 2013–14; this average value was approximately 0.93.
Accuracy of projectionsMean absolute percentage errors (MAPEs) for projections of current expenditures for public elementary and secondary education were calculated using the last 27 editions of Projections of Education Statistics that included projections of current expenditures. Table F, below, shows the MAPEs for projections of current expenditures.
Table F. Mean absolute percentage errors (MAPEs) of projections for total and per pupil current expenditures for public elementary and secondary education, by lead time: MAPEs constructed using projections from Projections of Education Statistics to 1984–85 through Projections of Education Statistics to 2025
StatisticLead time (years)
1 2 3 4 5 6 7 8 9 10
Total current expenditures 1.7 2.5 2.7 2.6 2.8 3.8 5.0 6.0 6.2 6.2Current expenditures per pupil in fall enrollment 1.7 2.4 2.6 2.6 2.9 3.7 4.9 5.9 6.7 6.9NOTE: Expenditures were in constant dollars based on the Consumer Price Index for all urban consumers, Bureau of Labor Statistics, U.S. Department of Labor. MAPEs for current expenditures were calculated using projections from the last 27 editions of Projections of Education Statistics, from Projections of Education Statistics to 1997–98 through Projections of Education Statistics to 2025, excluding Projections of Education Statistics to 2012 which did not include projections of current expenditures. Calculations were made using unrounded numbers. Some data have been revised from previously published figures.SOURCE: U.S. Department of Education, National Center for Education Statistics, Projections of Education Statistics, various issues. (This table was prepared February 2017.)
For more information about MAPEs, see Section A.0. Introduction to Projection Methodology, earlier in this appendix.

Projections of Education Statistics to 2026 103
Table A-15. Estimated equations and model statistics for current expenditures per pupil in fall enrollment for public elementary and secondary schools, and education revenue from state sources per capita based on data from 1973–74 to 2013–14
Dependent variable Equation1 R2
Breusch-GodfreySerial CorrelationLM test statistic2 Time period
1 2 3 4 5
Current expenditures per pupil ................................. ln(CUREXP) = 2.18 + 0.49ln(PCI) + 0.19ln(SGRANT) + 0.94AR(1) 0.996 5.74 (0.057) 1973–74 to(1.889) (2.474) (2.301) (26.579) 2013–14
Education revenue from state sources per capita .. ln(SGRNT) = 7.73 + 0.95ln(PCI) + 1.34ln(ENRPOP) + 0.82AR(1) 0.984 1.57 (0.457) 1973–74 to(1.981) (7.025) (3.069) (12.283) 2013–14
1AR(1) indicates that the model was estimated using least squares with the AR(1) processfor correcting for first-order autocorrelation. To estimate the model, it was first transformedinto a nonlinear model and then the coefficients were estimated simultaneously by applyinga Marquardt nonlinear least squares algorithm to the transformed equation. For a generaldiscussion of the problem of autocorrelation, and the method used to forecast in the pres-ence of autocorrelation, see Judge, G., Hill, W., Griffiths, R., Lutkepohl, H., and Lee, T.(1985). The Theory and Practice of Econometrics. New York: John Wiley and Sons, pp.315–318. Numbers in parentheses are t-statistics.2The number in parentheses is the probability of the Chi-Square associated with theBreusch-Godfrey Serial Correlation LM Test. A p value greater that 0.05 implies that wedo not reject the null hypothesis of no autocorrelation at the 5 percent significance levelfor a two-tailed test and 10 percent significance level for a one-tailed test (i.e., there is no
autocorrelation present). For an explanation of the Breusch-Godfrey Serial Correlation LMtest statistic, see Greene, W. (2000). Econometric Analysis. New Jersey: Prentice-Hall.NOTE: R2 indicates the coefficient of determination.CUREXP = Current expenditures of public elementary and secondary schools per pupil infall enrollment in constant 1982–84 dollars. SGRANT = Local governments’ education revenue from state sources, per capita, in con-stant 1982–84 dollars. PCI = Disposable income per capita in constant 2000 chained dollars.ENRPOP = Ratio of fall enrollment to the population.SOURCE: U.S. Department of Education, National Center for Education Statistics, PublicElementary and Secondary Education Current Expenditure Projection Model, 1973–74through 2026–27. (This table was prepared February 2017.)

104 Appendix A. Introduction to Projection Methodology
A.5. ENROLLMENT IN DEGREE-GRANTING POSTSECONDARY INSTITUTIONSProjections in this editionThis edition of Projections of Education Statistics presents projections of enrollment in degree-granting postsecondary institutions for fall 2016 through fall 2026. Three different models were used to produce these enrollment projections:
» The Enrollment in Degree-Granting Institutions Projection Model produced projections of enrollments by attendance status, level of student, level of institution, control of institution, sex, and age. It also produced projections of full-time-equivalent enrollments by level of student, level of institution, and control of institution.
» The Enrollment in Degree-Granting Institutions by Race/Ethnicity Projection Model produced projections of enrollments by race/ethnicity.
» The First-Time Freshmen Projection Model produced projections of enrollments of first-time freshmen by sex.
Overview of approach Basic features of the three degree-granting enrollment projection modelsThe Enrollment in Degree-Granting Institutions Projection Model is the primary model for projecting enrollment in degree-granting postsecondary institutions. For this model, enrollment rates by attendance status and sex are projected for various age categories using either the pooled seemingly unrelated regression method or the pooled seemingly unrelated regression method with a first-order autocorrelation correction. These rates are applied to projections of populations of the same sex and age to produce projections of enrollment by attendance status, sex, and age. To project enrollments by level of student, level of institution, and control of institution, rates for these characteristics are projected using single exponential smoothing and applied to enrollment projections previously produced by the model.
The Enrollment in Degree-Granting Institutions by Race/Ethnicity Projection Model takes an approach similar to that of the Enrollment in Degree-Granting Institutions Projection Model. Enrollment rates by attendance status, sex, and race/ethnicity are projected for the age categories using either the pooled seemingly unrelated regression method or the pooled seemingly unrelated regression method with a first-order autocorrelation correction. The resulting rates are iteratively corrected to ensure consistency with those projected by the Enrollment in Degree-Granting Institutions Projection Model. The adjusted rates are then applied to projections of populations of the same sex, age, and race/ethnicity.
The First-Time Freshmen Enrollment in Degree-Granting Institutions Projection Model uses single exponential smoothing to project the ratio of freshmen enrollment to undergraduate enrollment separately for males and for females. It then applies the projected ratios to the projections of undergraduate enrollment by sex that were produced by the Enrollment in Degree-Granting Institutions Projection Model.
The Enrollment in Degree-Granting Institutions Projection ModelThe Enrollment in Degree-Granting Institutions Projection Model produces projections of enrollment counts by six levels of detail, as well as projections of full-time-equivalent enrollments by level of student, level of institution, and control of institution.
Steps used in the Enrollment in Degree-Granting Institutions Projection ModelStep 1. Adjust age-specific enrollment counts from the U.S. Census Bureau to make them agree with the more highly aggregated NCES enrollment counts that do not include age. The Enrollment in Degree-Granting Institutions Projection Model projects enrollments by six levels of detail: attendance status, level of student, level of institution, control of institution, sex, and age. While NCES does produce enrollment counts by the first five levels of detail, it does not produce data by the sixth level of detail, age, every year. However, the U.S. Census Bureau does produce annual age-specific enrollment counts.
In step 1, the age distributions from the Census Bureau counts for 2000 to 2016 were applied to the NCES counts to produce a set of enrollment data that breaks enrollments down by age while being consistent with NCES counts. Specifically, the most detailed level of Census Bureau data (by attendance status, level of student, level of institution, control of institution, sex, and age) was iteratively changed using proportions based on the more highly aggregated NCES enrollment numbers to ensure that all sums across this most detailed level of Census enrollment data equaled the more highly aggregated NCES enrollment totals that did not include age.

Projections of Education Statistics to 2026 105
Step 2. Calculate enrollment rates by attendance status, sex, and age category. The enrollment data were broken up into 14 age categories, with separate age categories for individual ages 14 through 24 as well as for the age groups 25 to 29, 30 to 34, and 35 and over. For each of the 14 age categories, 4 enrollment rates were calculated—part-time male, full-time male, part-time female, and full-time female—resulting in a total of 56 enrollment rates. Each of the 56 enrollment rates was calculated by dividing the enrollment count for that combination of attendance status, sex, and age category by the total population for the corresponding combination of sex and age category. For each combination of attendance and sex, the enrollment rate for the oldest age category was calculated by dividing the enrollment count for those 35 and over by the total population for those 35 to 44.
Step 3. Produce projections of enrollment rates by attendance status, sex, and age category. Enrollment rates for most of the age groups were projected using multiple linear regression. However, because enrollment in degree-granting postsecondary institutions is negligible for ages 14, 15, and 16, these ages were not included in the multiple linear regression models. Instead, projections for individual ages 14, 15, and 16 were produced by double exponential smoothing.
The following 11 age categories were modeled: individual ages 17 through 24 and age groups 25 to 29, 30 to 34, and 35 and over. For each of these age categories, enrollment rates by attendance status and sex were produced using four pooled time-series models—one for each combination of attendance status and sex. Each model was pooled across age categories. Each equation contained two independent variables, which were measures of
» disposable income; and
» the unemployment rate.
Either the pooled seemingly unrelated regression method or the pooled seemingly unrelated regression method with a first-order autocorrelation correction was used to estimate each equation.
For more details on the equations used in step 3, the data used to estimate these equations, and their results, see tables A-16 through A-18 on pages 111–113.
Step 4. Produce projections of enrollments by attendance status, sex, and age category. For each combination of attendance status, sex, and age category, enrollment projections were produced by multiplying the projected enrollment rate for that combination by projections of the total population with the corresponding combination of sex and age category.
Step 5. Add two additional levels of detail—level of student and level of institution—to the projected enrollments by attendance status, sex, and age category. For this step, the 14 age categories used in the previous steps were collapsed into the following 8 categories: ages 14 to 16, 17, 18 and 19, 20 and 21, 22 to 24, 25 to 29, 30 to 34, and 35 and over. Step 5 can be broken into three parts:
First, the historic data were used to calculate the percentage distribution of enrollment by level of student and level of institution for each combination of attendance status, sex, and age category. Because it was assumed that there was no enrollment in 2-year institutions at the postbaccalaureate level, three combinations of student level and institution type were used: undergraduates at 4-year institutions, undergraduates at 2-year institutions, and postbaccalaureate students at 4-year institutions.
Second, for each combination of attendance status, sex, and age category, the percentage distribution by level of student and level of institution was projected using single exponential smoothing. A separate smoothing constant, chosen to minimize the sum of squared forecast errors, was used in each case. The percentages were then adjusted so the sum of the categories by attendance status, level of student, level of institution, sex, and age category would equal 100 percent.
For the projected percentage distributions from step 5 and the actual 2015 distributions, see tables A-19 and A-20 on pages 114 and 115.
Third, the projected distributions by level of student and type of institution were applied to the projected enrollments by attendance status, sex, and age category from step 4 to obtain the enrollment projections by attendance status, level of student, level of institution, sex, and age category.
Step 6. Add the sixth level of detail—control of institutions—to the projected enrollments in degree-granting postsecondary institutions. In this step, the data on enrollment by age category were not used. Control of institutions was added in the following manner:
First, the historic data were used to calculate the percentage of enrollment in public institutions for each combination of attendance status, level of student, level of institution, and sex.
Second, the percentages of enrollment in public institutions were projected using single exponential smoothing. A separate smoothing constant, chosen to minimize the sum of squared forecast errors, was used for each percentage.

106 Appendix A. Introduction to Projection Methodology
For the projected percentages from step 6 and the actual 2015 percentages, see table A-21 on page 116.
Third, the projected percentages were applied to the projected enrollments in each corresponding enrollment combination to obtain projections for public institutions by attendance status, level of student, level of institution, and sex.
Fourth, the projected enrollments for public institutions were subtracted from the total to produce the projected enrollments for private institutions.
Step 7. Produce projections of full-time-equivalent enrollment by level of student, level of institution, and control of institution. Full-time-equivalent enrollment represents total full-time and part-time enrollment as if it were enrollment on a full-time basis. It equals the sum of full-time enrollment plus the full-time-equivalent of part-time enrollment. Full-time-equivalent enrollment projections were produced in the following manner:
First, for each combination of level of student, level of institution, and control of institution, the historic data were used to calculate the full-time-equivalent of part-time enrollment as a percentage of part-time enrollment.
Second, for each combination of level of student, level of institution, and control of institution, the full-time equivalent of part-time enrollment as a percentage of part-time enrollment was projected using single exponential smoothing. A separate smoothing constant, chosen to minimize the sum of squared forecast errors, was used for each percentage.
Third, for each combination of level of student, level of institution, and control of institution, the projected percentages were applied to the projections of part-time enrollment to project the full-time equivalent of the part-time enrollment.
Fourth, the projections of full-time equivalents of part-time enrollment were added to projections of full-time enrollment to obtain projections of full-time-equivalent enrollment.
Data and equation results for the Enrollment in Degree-Granting Institutions Projection ModelEnrollment data for degree-granting postsecondary institutions. Enrollment data for 2000 to 2016 by attendance status, level of student, level of institution, control of institution, and sex came from the NCES Integrated Postsecondary Education Data System (IPEDS). These are universe counts. The U.S. Census Bureau was the source for enrollment estimates for 1981 to 2015 by the characteristics listed above, as well as age of student.
Population data and projections. Population counts for 2000 to 2016 came from the U.S. Census Bureau. Population projections for 2017 to 2026 are the Census Bureau’s 2014 National Population Projections of the population by sex and age (December 2014), ratio-adjusted to line up with the most recent historical estimates. For more information, see Section A.0. Introduction to Projection Methodology, earlier in this appendix.
Projections for economic variables. The economic variables used in developing these projections were from the “U.S. Quarterly Macroeconomic Model: 4th Quarter 2015 Short-Term Baseline Projections” from the economic consulting firm, IHS Global Inc. This set of projections was IHS Global Inc.’s most recent set at the time the education projections in this report were produced.
Data and results for the equations. The following details for the equations are shown on pages 111–116:
» Table A-16 shows enrollment rates by sex, attendance status, and age for fall 2015 and projected enrollment rates for fall 2021 and fall 2026.
» Table A-17 shows the estimated equations and model statistics used to project enrollments for men by attendance status, and table A-18 shows the estimated equations and model statistics used to project enrollment rates for women by attendance status. The particular equations shown were selected on the basis of their statistical properties, such as coefficients of determination (R2s), the t-statistics of the coefficients, the Durbin-Watson statistic, the Breusch-Godfrey Serial Correlation LM test statistic, and residual plots.
» Table A-19 shows actual and projected percentage distributions of full-time students, and table A-20 shows actual and projected percentage distributions of part-time students.
» Table A-21 shows actual and projected data for enrollment in public degree-granting institutions as a percentage of total enrollment by sex, attendance status, student level, and level of institution.

Projections of Education Statistics to 2026 107
Accuracy of projections for the Enrollment in Degree-Granting Institutions Projection ModelMean absolute percentage errors (MAPEs) for enrollment in degree-granting institutions were calculated using the last 19 editions of Projections of Education Statistics. Table G, below, shows MAPEs for key projections of the Enrollment in Degree-Granting Institutions Model.
Table G. Mean absolute percentage errors (MAPEs) of projected enrollment in degree-granting postsecondary institutions, by lead time, sex, and level of institution: MAPEs constructed using projections from Projections of Education Statistics to 2007 through Projections of Education Statistics to 2025
StatisticLead time (years)
1 2 3 4 5 6 7 8 9 10
Total enrollment 1.5 2.6 4.0 5.1 5.9 5.9 6.6 7.5 9.0 10.3Males 1.5 2.7 4.0 5.3 6.3 6.7 7.8 8.9 10.3 11.8Females 1.7 2.7 4.3 5.1 5.6 5.3 5.8 6.7 8.6 10.34-year institutions 1.6 2.6 3.9 5.2 6.4 7.3 8.4 9.8 11.6 12.92-year institutions 2.9 4.1 5.7 6.0 5.9 4.4 5.0 6.3 8.5 9.4
NOTE: MAPEs for degree-granting postsecondary institution enrollments were calculated using the last 19 editions of Projections of Education Statistics, from Projections of Education Statistics to 2007 through Projections of Education Statistics to 2025. Some data have been revised from previously published figures.SOURCE: U.S. Department of Education, National Center for Education Statistics, Projections of Education Statistics, various issues. (This table was prepared February 2017.)
For more information about MAPEs, see Section A.0. Introduction to Projection Methodology, earlier in this appendix.
The Enrollment in Degree-Granting Institutions by Race/Ethnicity Projection ModelThe Enrollment in Degree-Granting Institutions by Race/Ethnicity Projection Model projects enrollments in degree-granting institutions by attendance status, sex, age, and race/ethnicity. The following groups are projected in this model:
» White;
» Black;
» Hispanic;
» Asian/Pacific Islander;
» American Indian/Alaska Native; and
» nonresident alien.
See the glossary for definitions of the five racial/ethnic categories and the nonresident alien category. (The race/ethnicity of nonresident aliens is unknown, but they are considered a separate group for purposes of this analysis.)
Steps used in the Degree-Granting Institutions by Race/Ethnicity Projection ModelStep 1. Adjust U.S. Census Bureau enrollment counts by attendance status, sex, age, and race/ethnicity to make them sum to NCES enrollment counts by attendance status, sex, and race/ethnicity. For 1981 to 2015, the most detailed levels of Census Bureau enrollment data (by enrollment status, sex, age, and race/ethnicity) were iteratively changed using proportions that were based on the more highly aggregated NCES enrollment numbers to ensure that the sums across these most detailed levels of enrollment data equaled the more highly aggregated NCES enrollment numbers that did not include age.
Step 2. Calculate enrollment rates by attendance status, sex, age category, and race/ethnicity. The enrollment data were broken up into 14 age categories, with separate age categories for individual ages 14 through 24 as well as for the age groups 25 to 29, 30 to 34, and 35 and over. For each of the 14 age categories, enrollment rates were calculated for each combination of attendance status, sex, and the six racial/ethnic groups, resulting in a total of 336 enrollment rates. Each of the 336 enrollment rates was calculated by dividing the enrollment count for that combination of attendance status, sex, age category, and race/ethnicity by the total population for the corresponding combination of sex, age category, and race/ethnicity. For each combination of attendance status, sex and racial/ethnic group, the enrollment rate for the oldest age category was calculated by dividing the enrollment count for those 35 and over by the total population for those 35 to 44.
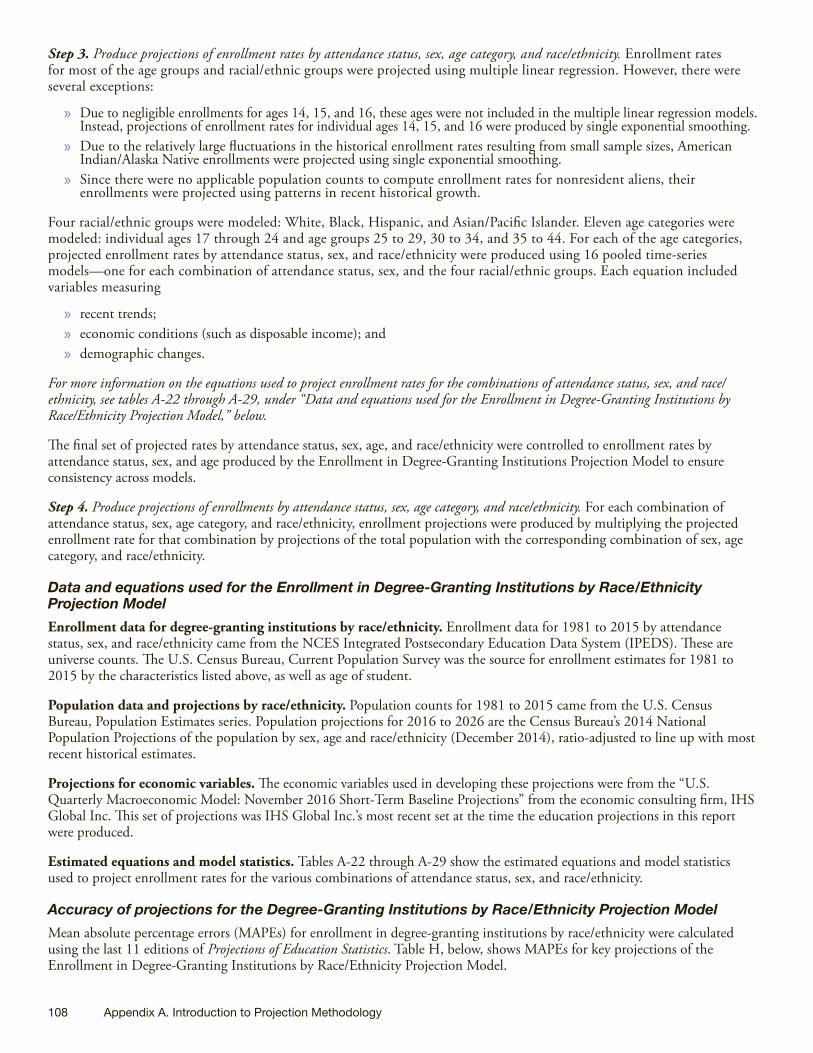
108 Appendix A. Introduction to Projection Methodology
Step 3. Produce projections of enrollment rates by attendance status, sex, age category, and race/ethnicity. Enrollment rates for most of the age groups and racial/ethnic groups were projected using multiple linear regression. However, there were several exceptions:
» Due to negligible enrollments for ages 14, 15, and 16, these ages were not included in the multiple linear regression models. Instead, projections of enrollment rates for individual ages 14, 15, and 16 were produced by single exponential smoothing.
» Due to the relatively large fluctuations in the historical enrollment rates resulting from small sample sizes, American Indian/Alaska Native enrollments were projected using single exponential smoothing.
» Since there were no applicable population counts to compute enrollment rates for nonresident aliens, their enrollments were projected using patterns in recent historical growth.
Four racial/ethnic groups were modeled: White, Black, Hispanic, and Asian/Pacific Islander. Eleven age categories were modeled: individual ages 17 through 24 and age groups 25 to 29, 30 to 34, and 35 to 44. For each of the age categories, projected enrollment rates by attendance status, sex, and race/ethnicity were produced using 16 pooled time-series models—one for each combination of attendance status, sex, and the four racial/ethnic groups. Each equation included variables measuring
» recent trends; » economic conditions (such as disposable income); and » demographic changes.
For more information on the equations used to project enrollment rates for the combinations of attendance status, sex, and race/ethnicity, see tables A-22 through A-29, under “Data and equations used for the Enrollment in Degree-Granting Institutions by Race/Ethnicity Projection Model,” below.
The final set of projected rates by attendance status, sex, age, and race/ethnicity were controlled to enrollment rates by attendance status, sex, and age produced by the Enrollment in Degree-Granting Institutions Projection Model to ensure consistency across models.
Step 4. Produce projections of enrollments by attendance status, sex, age category, and race/ethnicity. For each combination of attendance status, sex, age category, and race/ethnicity, enrollment projections were produced by multiplying the projected enrollment rate for that combination by projections of the total population with the corresponding combination of sex, age category, and race/ethnicity.
Data and equations used for the Enrollment in Degree-Granting Institutions by Race/Ethnicity Projection ModelEnrollment data for degree-granting institutions by race/ethnicity. Enrollment data for 1981 to 2015 by attendance status, sex, and race/ethnicity came from the NCES Integrated Postsecondary Education Data System (IPEDS). These are universe counts. The U.S. Census Bureau, Current Population Survey was the source for enrollment estimates for 1981 to 2015 by the characteristics listed above, as well as age of student.
Population data and projections by race/ethnicity. Population counts for 1981 to 2015 came from the U.S. Census Bureau, Population Estimates series. Population projections for 2016 to 2026 are the Census Bureau’s 2014 National Population Projections of the population by sex, age and race/ethnicity (December 2014), ratio-adjusted to line up with most recent historical estimates.
Projections for economic variables. The economic variables used in developing these projections were from the “U.S. Quarterly Macroeconomic Model: November 2016 Short-Term Baseline Projections” from the economic consulting firm, IHS Global Inc. This set of projections was IHS Global Inc.’s most recent set at the time the education projections in this report were produced.
Estimated equations and model statistics. Tables A-22 through A-29 show the estimated equations and model statistics used to project enrollment rates for the various combinations of attendance status, sex, and race/ethnicity.
Accuracy of projections for the Degree-Granting Institutions by Race/Ethnicity Projection ModelMean absolute percentage errors (MAPEs) for enrollment in degree-granting institutions by race/ethnicity were calculated using the last 11 editions of Projections of Education Statistics. Table H, below, shows MAPEs for key projections of the Enrollment in Degree-Granting Institutions by Race/Ethnicity Projection Model.
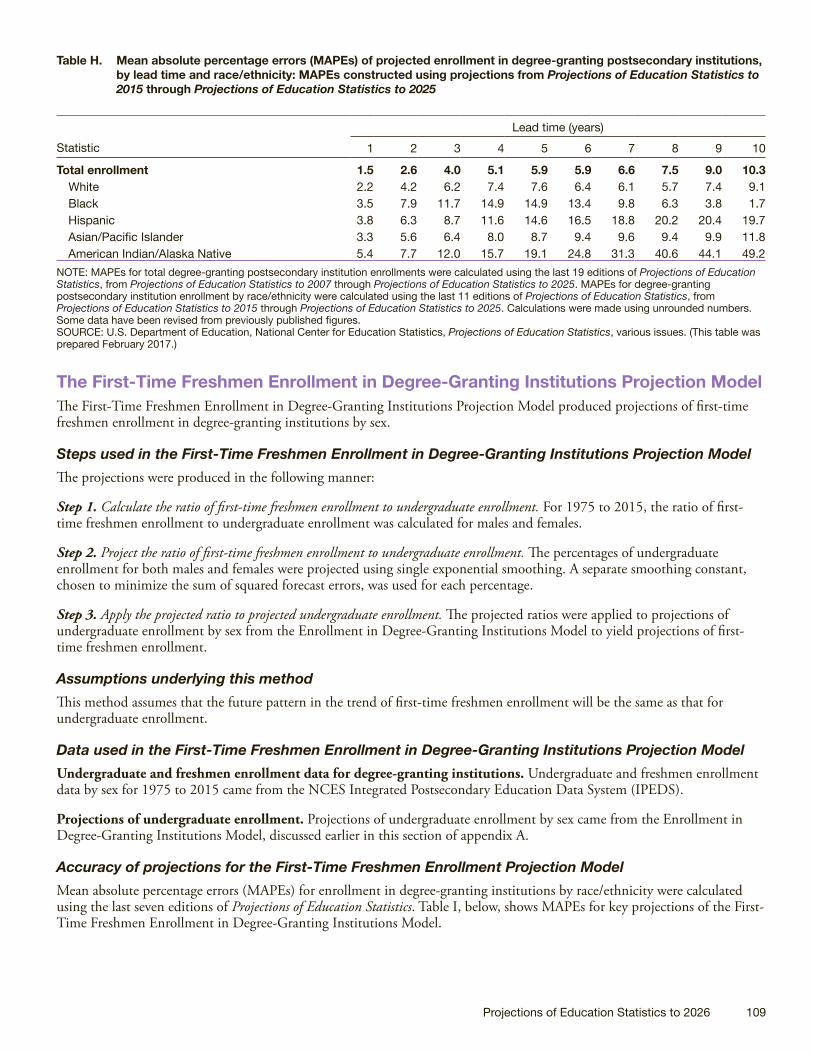
Projections of Education Statistics to 2026 109
Table H. Mean absolute percentage errors (MAPEs) of projected enrollment in degree-granting postsecondary institutions, by lead time and race/ethnicity: MAPEs constructed using projections from Projections of Education Statistics to 2015 through Projections of Education Statistics to 2025
StatisticLead time (years)
1 2 3 4 5 6 7 8 9 10
Total enrollment 1.5 2.6 4.0 5.1 5.9 5.9 6.6 7.5 9.0 10.3White 2.2 4.2 6.2 7.4 7.6 6.4 6.1 5.7 7.4 9.1Black 3.5 7.9 11.7 14.9 14.9 13.4 9.8 6.3 3.8 1.7Hispanic 3.8 6.3 8.7 11.6 14.6 16.5 18.8 20.2 20.4 19.7Asian/Pacific Islander 3.3 5.6 6.4 8.0 8.7 9.4 9.6 9.4 9.9 11.8American Indian/Alaska Native 5.4 7.7 12.0 15.7 19.1 24.8 31.3 40.6 44.1 49.2
NOTE: MAPEs for total degree-granting postsecondary institution enrollments were calculated using the last 19 editions of Projections of Education Statistics, from Projections of Education Statistics to 2007 through Projections of Education Statistics to 2025. MAPEs for degree-granting postsecondary institution enrollment by race/ethnicity were calculated using the last 11 editions of Projections of Education Statistics, from Projections of Education Statistics to 2015 through Projections of Education Statistics to 2025. Calculations were made using unrounded numbers. Some data have been revised from previously published figures.SOURCE: U.S. Department of Education, National Center for Education Statistics, Projections of Education Statistics, various issues. (This table was prepared February 2017.)
The First-Time Freshmen Enrollment in Degree-Granting Institutions Projection ModelThe First-Time Freshmen Enrollment in Degree-Granting Institutions Projection Model produced projections of first-time freshmen enrollment in degree-granting institutions by sex.
Steps used in the First-Time Freshmen Enrollment in Degree-Granting Institutions Projection ModelThe projections were produced in the following manner:
Step 1. Calculate the ratio of first-time freshmen enrollment to undergraduate enrollment. For 1975 to 2015, the ratio of first-time freshmen enrollment to undergraduate enrollment was calculated for males and females.
Step 2. Project the ratio of first-time freshmen enrollment to undergraduate enrollment. The percentages of undergraduate enrollment for both males and females were projected using single exponential smoothing. A separate smoothing constant, chosen to minimize the sum of squared forecast errors, was used for each percentage.
Step 3. Apply the projected ratio to projected undergraduate enrollment. The projected ratios were applied to projections of undergraduate enrollment by sex from the Enrollment in Degree-Granting Institutions Model to yield projections of first-time freshmen enrollment.
Assumptions underlying this methodThis method assumes that the future pattern in the trend of first-time freshmen enrollment will be the same as that for undergraduate enrollment.
Data used in the First-Time Freshmen Enrollment in Degree-Granting Institutions Projection ModelUndergraduate and freshmen enrollment data for degree-granting institutions. Undergraduate and freshmen enrollment data by sex for 1975 to 2015 came from the NCES Integrated Postsecondary Education Data System (IPEDS).
Projections of undergraduate enrollment. Projections of undergraduate enrollment by sex came from the Enrollment in Degree-Granting Institutions Model, discussed earlier in this section of appendix A.
Accuracy of projections for the First-Time Freshmen Enrollment Projection ModelMean absolute percentage errors (MAPEs) for enrollment in degree-granting institutions by race/ethnicity were calculated using the last seven editions of Projections of Education Statistics. Table I, below, shows MAPEs for key projections of the First-Time Freshmen Enrollment in Degree-Granting Institutions Model.

110 Appendix A. Introduction to Projection Methodology
Table I. Mean absolute percentage errors (MAPEs) of projected first-time freshmen enrollment in degree-granting postsecondary institutions, by lead time and sex: MAPEs constructed using projections from Projections of Education Statistics to 2018 through Projections of Education Statistics to 2025
StatisticLead time (years)
1 2 3 4 5 6 7 8 9 10
Total first-time freshmen enrollment 3.0 5.3 7.2 8.4 8.2 7.2 6.2 5.7 — —Males 2.9 5.0 6.6 7.4 7.2 6.0 3.1 1.2 — —Females 3.3 5.6 7.8 9.2 9.4 9.7 8.9 9.6 — —
— Not available. NOTE: MAPEs for first-time freshmen enrollment in degree-granting postsecondary institutions were calculated using the last 8 editions of Projections of Education Statistics, from Projections of Education Statistics to 2018 through Projections of Education Statistics to 2025. Calculations were made using unrounded numbers. Some data have been revised from previously published figures.SOURCE: U.S. Department of Education, National Center for Education Statistics, Projections of Education Statistics, various issues. (This table was prepared February 2017.)

Projections of Education Statistics to 2026 111
Table A-16. Actual and projected enrollment rates of all students at degree-granting postsecondary institutions, by sex, attendance status, and age: Fall 2015, fall 2021, and fall 2026
Sex, attendance status, and age Actual 2015
Projected
2021 2026
1 2 3 4
MalesFull-time
16 years old ............................................. 0.6 0.7 0.717 years old ............................................. 2.7 2.7 2.518 years old ............................................. 30.0 32.3 33.319 years old ............................................. 35.5 38.1 39.320 years old ............................................. 39.4 42.7 44.621 years old ............................................. 32.3 33.9 34.222 years old ............................................. 24.1 26.1 27.023 years old ............................................. 14.9 16.7 17.824 years old ............................................. 10.8 11.8 12.225 to 29 years old .................................... 5.8 6.1 6.230 to 34 years old .................................... 2.2 2.3 2.335 to 44 years old .................................... 1.7 1.7 1.6
Part-time16 years old ............................................. # 0.1 0.117 years old ............................................. 0.9 0.9 1.018 years old ............................................. 6.9 7.3 7.619 years old ............................................. 11.3 11.7 12.120 years old ............................................. 10.3 10.5 10.721 years old ............................................. 11.1 11.7 12.222 years old ............................................. 7.1 7.6 7.923 years old ............................................. 8.8 9.3 9.824 years old ............................................. 7.3 7.8 8.225 to 29 years old .................................... 5.7 6.1 6.330 to 34 years old .................................... 3.5 3.5 3.535 to 44 years old .................................... 3.3 3.3 3.3
FemalesFull-time
16 years old ............................................. 0.5 0.6 0.617 years old ............................................. 3.6 4.3 4.718 years old ............................................. 36.1 40.2 42.419 years old ............................................. 48.2 50.3 50.620 years old ............................................. 49.2 53.0 54.821 years old ............................................. 38.8 41.1 41.522 years old ............................................. 23.4 26.4 28.023 years old ............................................. 22.1 24.9 26.424 years old ............................................. 12.3 14.1 15.225 to 29 years old .................................... 6.8 7.5 7.630 to 34 years old .................................... 3.4 3.6 3.635 to 44 years old .................................... 2.8 3.0 2.9
Part-time16 years old ............................................. # 0.1 0.117 years old ............................................. 0.3 0.4 0.418 years old ............................................. 8.0 8.5 8.919 years old ............................................. 12.8 13.6 14.520 years old ............................................. 13.4 13.7 14.121 years old ............................................. 12.6 13.6 14.622 years old ............................................. 9.2 10.0 10.723 years old ............................................. 10.7 11.7 12.524 years old ............................................. 7.3 8.2 8.825 to 29 years old .................................... 8.4 9.1 9.730 to 34 years old .................................... 5.1 5.4 5.535 to 44 years old .................................... 7.0 7.4 7.6
#Rounds to zero.SOURCE: U.S. Department of Education, National Center for Education Statistics, Inte-grated Postsecondary Education Data System, Spring 2015; Enrollment in Degree-Granting
Institutions Projection Model, 1980 through 2026; and U.S. Department of Commerce, Cen-sus Bureau, Current Population Reports, “Social and Economic Characteristics of Students,”2015. (This table was prepared February 2017.)

112 Appendix A. Introduction to Projection Methodology
Table A-17. Estimated equations and model statistics for full-time and part-time enrollment rates of males at degree-granting postsecondary institutions based on data from 2000 to 2015
Independent variable Coefficient Standard error t-statistic R2 D.W. statistic
1 2 3 4 5 6
Full-timeIntercept term for 17-year-olds ................................ -9.99 0.222 -45.06 1.00 2.01*Intercept term for 18-year-olds ................................ -7.08 0.217 -32.58Intercept term for 19-year-olds ................................ -6.66 0.217 -30.73Intercept term for 20-year-olds ................................ -6.61 0.218 -30.29Intercept term for 21-year-olds ................................ -6.75 0.218 -30.91Intercept term for 22-year-olds ................................ -7.23 0.219 -33.07Intercept term for 23-year-olds ................................ -7.72 0.218 -35.34Intercept term for 24-year-olds ................................ -7.96 0.219 -36.35Intercept term for 25- to 29-year-olds ..................... -8.61 0.220 -39.10Intercept term for 30- to 34-year-olds ..................... -9.54 0.221 -43.11Intercept term for 35- to 44-year-olds ..................... -10.03 0.222 -45.19Log of three-period weighted average of per capita
disposable income in 2000 dollars, using the present period and the previous two periods .... 1.08 0.034 31.61
Log age-specific unemployment rate for men ......... 0.30 0.008 35.60
Part-timeIntercept term for 17-year-olds ................................ -11.23 0.556 -20.18 0.95 2.07*Intercept term for 18-year-olds ................................ -8.87 0.554 -16.02Intercept term for 19-year-olds ................................ -8.37 0.555 -15.09Intercept term for 20-year-olds ................................ -8.25 0.553 -14.92Intercept term for 21-year-olds ................................ -8.38 0.556 -15.08Intercept term for 22-year-olds ................................ -8.62 0.556 -15.51Intercept term for 23-year-olds ................................ -8.62 0.554 -15.57Intercept term for 24-year-olds ................................ -8.78 0.554 -15.84Intercept term for 25- to 29-year-olds ..................... -9.19 0.552 -16.64Intercept term for 30- to 34-year-olds ..................... -9.69 0.552 -17.54Intercept term for 35- to 44-year-olds ..................... -9.61 0.552 -17.41Log of three-period weighted average of per capita
disposable income in 2000 dollars, using the present period and the previous two periods .... 0.65 0.061 10.62
Log unemployment rate .......................................... 0.20 0.022 9.05
* p < .05. NOTE: R2 = Coefficient of determination. D.W. statistic = Durbin-Watson statistic, a test forautocorrelation among regression residuals. For more details see Johnston, J., and Dinardo, J.(1996). Econometric Methods, New York: McGraw-Hill. The regression method used to esti-mate the full-time and part-time equations was the pooled seemingly unrelated regressionmethod. The time period used to estimate both equations is from 2000 to 2015 and the num-
ber of observations is 176. For additional information, see Intriligator, M.D. (1978). Economet-ric Models, Techniques, & Applications. New Jersey: Prentice-Hall, Inc., pp. 165–173.SOURCE: U.S. Department of Education, National Center for Education Statistics, Enrollmentin Degree-Granting Institutions Projection Model, 2000 through 2026. (This table was pre-pared April 2017.)
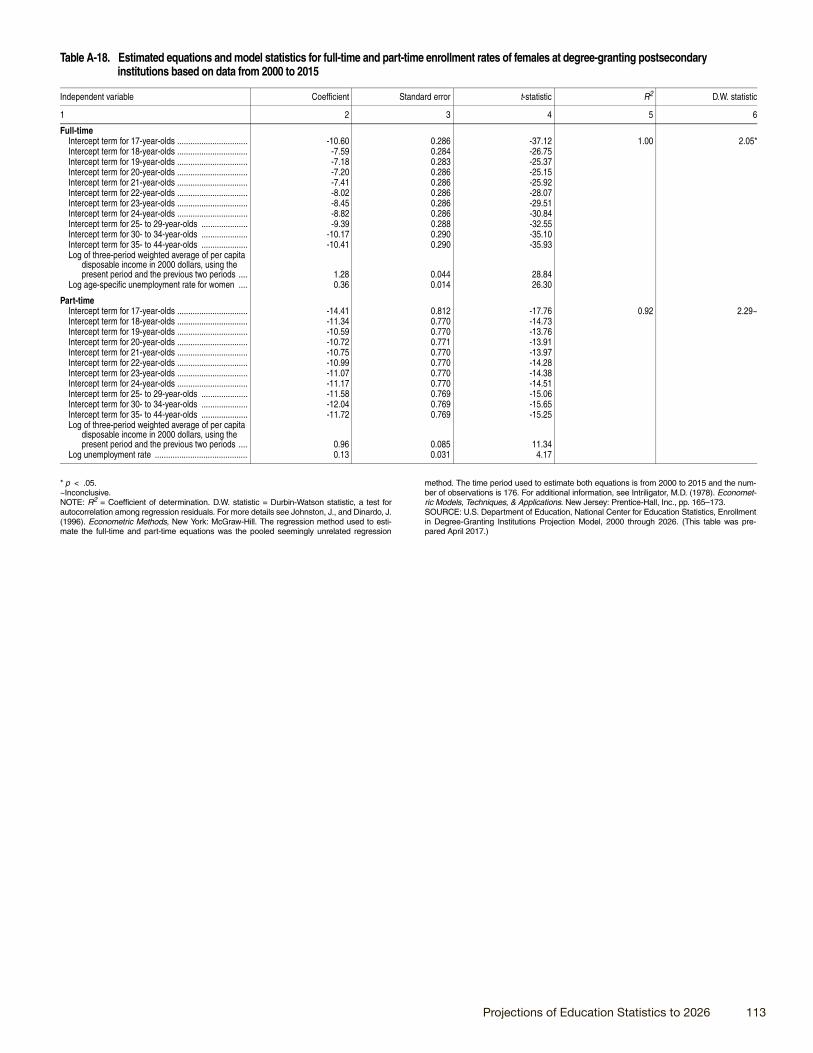
Projections of Education Statistics to 2026 113
Table A-18. Estimated equations and model statistics for full-time and part-time enrollment rates of females at degree-granting postsecondary institutions based on data from 2000 to 2015
Independent variable Coefficient Standard error t-statistic R2 D.W. statistic
1 2 3 4 5 6
Full-timeIntercept term for 17-year-olds ................................ -10.60 0.286 -37.12 1.00 2.05*Intercept term for 18-year-olds ................................ -7.59 0.284 -26.75Intercept term for 19-year-olds ................................ -7.18 0.283 -25.37Intercept term for 20-year-olds ................................ -7.20 0.286 -25.15Intercept term for 21-year-olds ................................ -7.41 0.286 -25.92Intercept term for 22-year-olds ................................ -8.02 0.286 -28.07Intercept term for 23-year-olds ................................ -8.45 0.286 -29.51Intercept term for 24-year-olds ................................ -8.82 0.286 -30.84Intercept term for 25- to 29-year-olds ..................... -9.39 0.288 -32.55Intercept term for 30- to 34-year-olds ..................... -10.17 0.290 -35.10Intercept term for 35- to 44-year-olds ..................... -10.41 0.290 -35.93Log of three-period weighted average of per capita
disposable income in 2000 dollars, using the present period and the previous two periods .... 1.28 0.044 28.84
Log age-specific unemployment rate for women .... 0.36 0.014 26.30
Part-timeIntercept term for 17-year-olds ................................ -14.41 0.812 -17.76 0.92 2.29~Intercept term for 18-year-olds ................................ -11.34 0.770 -14.73Intercept term for 19-year-olds ................................ -10.59 0.770 -13.76Intercept term for 20-year-olds ................................ -10.72 0.771 -13.91Intercept term for 21-year-olds ................................ -10.75 0.770 -13.97Intercept term for 22-year-olds ................................ -10.99 0.770 -14.28Intercept term for 23-year-olds ................................ -11.07 0.770 -14.38Intercept term for 24-year-olds ................................ -11.17 0.770 -14.51Intercept term for 25- to 29-year-olds ..................... -11.58 0.769 -15.06Intercept term for 30- to 34-year-olds ..................... -12.04 0.769 -15.65Intercept term for 35- to 44-year-olds ..................... -11.72 0.769 -15.25Log of three-period weighted average of per capita
disposable income in 2000 dollars, using the present period and the previous two periods .... 0.96 0.085 11.34
Log unemployment rate .......................................... 0.13 0.031 4.17
* p < .05. ~Inconclusive.NOTE: R2 = Coefficient of determination. D.W. statistic = Durbin-Watson statistic, a test forautocorrelation among regression residuals. For more details see Johnston, J., and Dinardo, J.(1996). Econometric Methods, New York: McGraw-Hill. The regression method used to esti-mate the full-time and part-time equations was the pooled seemingly unrelated regression
method. The time period used to estimate both equations is from 2000 to 2015 and the num-ber of observations is 176. For additional information, see Intriligator, M.D. (1978). Economet-ric Models, Techniques, & Applications. New Jersey: Prentice-Hall, Inc., pp. 165–173.SOURCE: U.S. Department of Education, National Center for Education Statistics, Enrollmentin Degree-Granting Institutions Projection Model, 2000 through 2026. (This table was pre-pared April 2017.)
114 Appendix A. Introduction to Projection Methodology
Table A-19. Actual and projected percentages of full-time students at degree-granting postsecondary institutions, by sex, age group, student level, and level of institution: Fall 2015, and fall 2016 through fall 2026
Age group, student level, and level of institution
Males Females
Actual 2015 Projected 2016 through 2026 Actual 2015 Projected 2016 through 2026
1 2 3 4 5
18 and 19 years oldUndergraduate, 4-year institutions .......................... 68.7 67.3 75.1 72.0Undergraduate, 2-year institutions .......................... 30.9 32.3 24.9 28.0Postbaccalaureate, 4-year institutions .................... 0.3 0.4 # 0.1
20 and 21 years oldUndergraduate, 4-year institutions .......................... 79.8 77.1 78.8 79.5Undergraduate, 2-year institutions .......................... 17.9 20.2 19.1 18.3Postbaccalaureate, 4-year institutions .................... 2.3 2.7 2.1 2.2
22 to 24 years old Undergraduate, 4-year institutions .......................... 67.6 65.0 62.2 60.1Undergraduate, 2-year institutions .......................... 12.5 15.7 14.2 17.6Postbaccalaureate, 4-year institutions .................... 20.0 19.3 23.6 22.3
25 to 29 years oldUndergraduate, 4-year institutions .......................... 41.7 43.3 42.6 42.7Undergraduate, 2-year institutions .......................... 17.8 18.3 19.4 21.3Postbaccalaureate, 4-year institutions .................... 40.5 38.4 38.0 36.0
30 to 34 years old Undergraduate, 4-year institutions .......................... 50.0 48.1 45.1 43.0Undergraduate, 2-year institutions .......................... 14.1 15.3 21.6 25.9Postbaccalaureate, 4-year institutions .................... 35.9 36.6 33.3 31.1
35 years and overUndergraduate, 4-year institutions .......................... 45.0 41.7 48.0 42.7Undergraduate, 2-year institutions .......................... 23.5 24.7 22.4 29.3Postbaccalaureate, 4-year institutions .................... 31.5 33.6 29.6 28.0
#Rounds to zero.NOTE: Detail may not sum to totals because of rounding. Some data have been revisedfrom previously published figures.
SOURCE: U.S. Department of Education, National Center for Education Statistics, Integrated Postsecondary Education Data System, Spring 2015; Enrollment in Degree-Granting Institu-tions Projection Model, 1980 through 2026; and U.S. Department of Commerce, CensusBureau, Current Population Reports, “Social and Economic Characteristics of Students,”2015. (This table was prepared February 2017.)

Projections of Education Statistics to 2026 115
Table A-20. Actual and projected percentages of part-time students at degree-granting postsecondary institutions, by sex, age group, student level, and level of institution: Fall 2015, and fall 2016 through fall 2026
Age, student level, and level of institution
Males Females
Actual 2015 Projected 2016 through 2026 Actual 2015 Projected 2016 through 2026
1 2 3 4 5
18 and 19 years oldUndergraduate, 4-year institutions .......................... 23.9 20.3 15.8 19.6Undergraduate, 2-year institutions .......................... 76.1 79.7 84.2 80.3Postbaccalaureate, 4-year institutions .................... # # # 0.1
20 and 21 years oldUndergraduate, 4-year institutions .......................... 21.5 26.2 31.4 28.1Undergraduate, 2-year institutions .......................... 75.9 71.7 66.0 70.7Postbaccalaureate, 4-year institutions .................... 2.7 2.1 2.6 1.3
22 to 24 years old Undergraduate, 4-year institutions .......................... 40.3 37.0 44.3 40.5Undergraduate, 2-year institutions .......................... 51.6 55.3 41.0 47.3Postbaccalaureate, 4-year institutions .................... 8.1 7.7 14.6 12.2
25 to 29 years oldUndergraduate, 4-year institutions .......................... 39.8 33.4 35.0 30.4Undergraduate, 2-year institutions .......................... 46.8 47.6 41.1 48.7Postbaccalaureate, 4-year institutions .................... 13.4 19.1 23.9 20.8
30 to 34 years old Undergraduate, 4-year institutions .......................... 35.4 33.5 35.5 31.0Undergraduate, 2-year institutions .......................... 37.3 41.6 46.0 46.3Postbaccalaureate, 4-year institutions .................... 27.4 24.9 18.5 22.7
35 years and overUndergraduate, 4-year institutions .......................... 29.9 30.9 27.7 29.5Undergraduate, 2-year institutions .......................... 37.0 40.9 47.6 45.5Postbaccalaureate, 4-year institutions .................... 33.1 28.2 24.7 24.9
#Rounds to zero.NOTE: Detail may not sum to totals because of rounding. Some data have been revisedfrom previously published figures.
SOURCE: U.S. Department of Education, National Center for Education Statistics, Integrated Postsecondary Education Data System, Spring 2015; Enrollment in Degree-Granting Institu-tions Projection Model, 1980 through 2026; and U.S. Department of Commerce, CensusBureau, Current Population Reports, “Social and Economic Characteristics of Students,”2015. (This table was prepared February 2017.)

116 Appendix A. Introduction to Projection Methodology
Table A-21. Actual and projected enrollment in public degree-granting postsecondary institutions as a percentage of total postsecondary enrollment, by sex, attendance status, student level, and level of institution: Fall 2015, and fall 2016 through fall 2026
Attendance status, student level, and level of institution
Males Females
Actual 2015 Projected 2016 through 2026 Actual 2015 Projected 2016 through 2026
Full-time, undergraduate, 4-year institutions ............... 67.2 67.2 63.7 63.6Part-time, undergraduate, 4-year institutions .............. 70.0 70.0 65.3 65.3Full-time, undergraduate, 2-year institutions ............... 92.9 92.9 88.5 88.5Part-time, undergraduate, 2-year institutions .............. 99.5 99.4 98.8 98.7Full-time, postbaccalaureate, 4-year institutions ........ 49.6 49.6 45.8 45.8Part-time, postbaccalaureate, 4-year institutions ........ 51.9 51.9 48.1 48.1
SOURCE: U.S. Department of Education, National Center for Education Statistics, Inte-grated Postsecondary Education Data System, Spring 2016; and Enrollment in Degree-
Granting Institutions Projection Model, 1980 through 2026. (This table was prepared Feb-ruary 2017.)
Table A-22. Estimated equations and model statistics for full-time and part-time enrollment rates of White males at degree-granting postsecondary institutions based on data from 1980 to 2015
Independent variable Coefficient Standard error t-statistic R2 D.W. statistic
1 2 3 4 5 6
Full-timeIntercept term for 17-year-olds ................................ -9.22 0.279 -32.98 0.99 1.58*Intercept term for 18-year-olds ................................ -6.24 0.270 -23.09Intercept term for 19-year-olds ................................ -5.96 0.268 -22.26Intercept term for 20-year-olds ................................ -6.13 0.268 -22.86Intercept term for 21-year-olds ................................ -6.26 0.268 -23.34Intercept term for 22-year-olds ................................ -6.76 0.268 -25.20Intercept term for 23-year-olds ................................ -7.32 0.268 -27.28Intercept term for 24-year-olds ................................ -7.70 0.270 -28.54Intercept term for 25- to 29-year-olds ..................... -8.55 0.268 -31.84Intercept term for 30- to 34-year-olds ..................... -9.58 0.270 -35.47Intercept term for 35- to 44-year-olds ..................... -10.19 0.271 -37.60Log of White per capita disposable income
in current dollars ............................................... 0.29 0.014 20.89
Part-timeIntercept term for 17-year-olds ................................ -5.10 0.506 -10.09 0.86 1.81*Intercept term for 18-year-olds ................................ -1.54 0.120 -12.78Intercept term for 19-year-olds ................................ -1.07 0.126 -8.45Intercept term for 20-year-olds ................................ -1.01 0.117 -8.59Intercept term for 21-year-olds ................................ -1.04 0.118 -8.84Intercept term for 22-year-olds ................................ -1.26 0.118 -10.71Intercept term for 23-year-olds ................................ -1.30 0.115 -11.38Intercept term for 24-year-olds ................................ -1.34 0.113 -11.91Intercept term for 25- to 29-year-olds ..................... -1.66 0.111 -14.96Intercept term for 30- to 34-year-olds ..................... -2.12 0.113 -18.81Intercept term for 35- to 44-year-olds ..................... -2.15 0.110 -19.60Log of real total private compensation
employment cost index ..................................... 1.48 0.146 10.11
* p < .05.NOTE: R2 = Coefficient of determination. D.W. statistic = Durbin-Watson statistic, a test forautocorrelation among regression residuals. For more details see Johnston, J., and Dinardo,J. (1996). Econometric Methods. New York: McGraw-Hill. The regression method used toestimate the full-time and part-time equations was the pooled seemingly unrelated regressionmethod. The time period used to estimate the equations is from 1980 to 2015. The number of
observations is 396. For additional information, see Intriligator, M.D. (1978). EconometricModels, Techniques, & Applications. New Jersey: Prentice-Hall, Inc., pp. 165–173. Race cat-egories exclude persons of Hispanic ethnicity.SOURCE: U.S. Department of Education, National Center for Education Statistics, Enroll-ment in Degree-Granting Institutions by Race/Ethnicity Projection Model, 1980 through 2026.(This table was prepared February 2017.)

Projections of Education Statistics to 2026 117
Table A-23. Estimated equations and model statistics for full-time and part-time enrollment rates of White females at degree-granting postsecondary institutions based on data from 1980 to 2015
Independent variable Coefficient Standard error t-statistic R2 D.W. statistic
1 2 3 4 5 6
Full-timeIntercept term for 17-year-olds ................................ -12.93 0.442 -29.23 0.99 1.75*Intercept term for 18-year-olds ................................ -9.98 0.435 -22.96Intercept term for 19-year-olds ................................ -9.80 0.433 -22.61Intercept term for 20-year-olds ................................ -10.02 0.434 -23.12Intercept term for 21-year-olds ................................ -10.26 0.434 -23.65Intercept term for 22-year-olds ................................ -10.99 0.434 -25.34Intercept term for 23-year-olds ................................ -11.53 0.435 -26.53Intercept term for 24-year-olds ................................ -11.92 0.435 -27.43Intercept term for 25- to 29-year-olds ..................... -12.72 0.434 -29.31Intercept term for 30- to 34-year-olds ..................... -13.46 0.434 -31.03Intercept term for 35- to 44-year-olds ..................... -13.65 0.434 -31.46Log of White per capita disposable income
in current dollars ............................................... 0.50 0.022 22.51
Part-timeIntercept term for 17-year-olds ................................ -10.15 0.393 -25.81 0.70 1.86*Intercept term for 18-year-olds ................................ -6.58 0.318 -20.72Intercept term for 19-year-olds ................................ -6.08 0.319 -19.06Intercept term for 20-year-olds ................................ -6.17 0.319 -19.34Intercept term for 21-year-olds ................................ -6.23 0.318 -19.57Intercept term for 22-year-olds ................................ -6.44 0.317 -20.35Intercept term for 23-year-olds ................................ -6.50 0.318 -20.48Intercept term for 24-year-olds ................................ -6.54 0.316 -20.70Intercept term for 25- to 29-year-olds ..................... -6.85 0.315 -21.75Intercept term for 30- to 34-year-olds ..................... -7.24 0.317 -22.86Intercept term for 35- to 44-year-olds ..................... -6.90 0.315 -21.90Log of real total private compensation
employment cost index ..................................... 0.22 0.016 13.82
* p < .05.NOTE: R2 = Coefficient of determination. D.W. statistic = Durbin-Watson statistic, a test forautocorrelation among regression residuals. For more details see Johnston, J., and Dinardo,J. (1996). Econometric Methods. New York: McGraw-Hill. The regression method used toestimate the full-time and part-time equations was the pooled seemingly unrelated regressionmethod. The time period used to estimate the equations is from 1980 to 2015. The number of
observations is 396. For additional information, see Intriligator, M.D. (1978). EconometricModels, Techniques, & Applications. New Jersey: Prentice-Hall, Inc., pp. 165–173. Race cat-egories exclude persons of Hispanic ethnicity.SOURCE: U.S. Department of Education, National Center for Education Statistics, Enroll-ment in Degree-Granting Institutions by Race/Ethnicity Projection Model, 1980 through 2026.(This table was prepared February 2017.)

118 Appendix A. Introduction to Projection Methodology
Table A-24. Estimated equations and model statistics for full-time and part-time enrollment rates of Black males at degree-granting postsecondary institutions based on data from 1980 to 2015
Independent variable Coefficient Standard error t-statistic R2 D.W. statistic
1 2 3 4 5 6
Full-timeIntercept term for 17-year-olds ................................ -11.25 0.639 -17.61 0.94 1.83*Intercept term for 18-year-olds ................................ -9.00 0.633 -14.22Intercept term for 19-year-olds ................................ -8.71 0.633 -13.77Intercept term for 20-year-olds ................................ -8.77 0.633 -13.86Intercept term for 21-year-olds ................................ -9.02 0.634 -14.22Intercept term for 22-year-olds ................................ -9.22 0.634 -14.54Intercept term for 23-year-olds ................................ -9.69 0.636 -15.23Intercept term for 24-year-olds ................................ -9.95 0.634 -15.69Intercept term for 25- to 29-year-olds ..................... -10.73 0.634 -16.91Intercept term for 30- to 34-year-olds ..................... -11.55 0.637 -18.12Intercept term for 35- to 44-year-olds ..................... -11.84 0.636 -18.61Log of Black per capita disposable income
in current dollars ............................................... 0.40 0.034 11.75
Part-timeIntercept term for 17-year-olds ................................ -12.92 0.721 -17.93 0.51 1.96*Intercept term for 18-year-olds ................................ -11.40 0.558 -20.43Intercept term for 19-year-olds ................................ -10.65 0.550 -19.35Intercept term for 20-year-olds ................................ -10.59 0.551 -19.23Intercept term for 21-year-olds ................................ -10.52 0.545 -19.31Intercept term for 22-year-olds ................................ -10.62 0.552 -19.26Intercept term for 23-year-olds ................................ -10.74 0.555 -19.37Intercept term for 24-year-olds ................................ -10.85 0.556 -19.52Intercept term for 25- to 29-year-olds ..................... -10.96 0.543 -20.18Intercept term for 30- to 34-year-olds ..................... -11.22 0.542 -20.71Intercept term for 35- to 44-year-olds ..................... -11.24 0.540 -20.82Log of Black per capita disposable income
in current dollars ............................................... 0.42 0.029 14.38
* p < .05.NOTE: R2 = Coefficient of determination. D.W. statistic = Durbin-Watson statistic, a test forautocorrelation among regression residuals. For more details see Johnston, J., and Dinardo,J. (1996). Econometric Methods. New York: McGraw-Hill. The regression method used toestimate the full-time and part-time equations was the pooled seemingly unrelated regressionmethod. The time period used to estimate the equations is from 1980 to 2015. The number of
observations is 396. For additional information, see Intriligator, M.D. (1978). EconometricModels, Techniques, & Applications. New Jersey: Prentice-Hall, Inc., pp. 165–173. Race cat-egories exclude persons of Hispanic ethnicity.SOURCE: U.S. Department of Education, National Center for Education Statistics, Enroll-ment in Degree-Granting Institutions by Race/Ethnicity Projection Model, 1980 through 2026.(This table was prepared February 2017.)

Projections of Education Statistics to 2026 119
Table A-25. Estimated equations and model statistics for full-time and part-time enrollment rates of Black females at degree-granting postsecondary institutions based on data from 1980 to 2015
Independent variable Coefficient Standard error t-statistic R2 D.W. statistic
1 2 3 4 5 6
Full-timeIntercept term for 17-year-olds ................................ -14.44 0.627 -23.04 0.96 1.80*Intercept term for 18-year-olds ................................ -12.17 0.620 -19.64Intercept term for 19-year-olds ................................ -11.91 0.619 -19.25Intercept term for 20-year-olds ................................ -12.15 0.619 -19.61Intercept term for 21-year-olds ................................ -12.33 0.619 -19.93Intercept term for 22-year-olds ................................ -12.76 0.619 -20.62Intercept term for 23-year-olds ................................ -13.04 0.620 -21.04Intercept term for 24-year-olds ................................ -13.41 0.621 -21.60Intercept term for 25- to 29-year-olds ..................... -14.13 0.621 -22.77Intercept term for 30- to 34-year-olds ..................... -14.61 0.620 -23.56Intercept term for 35- to 44-year-olds ..................... -14.94 0.621 -24.05Log of Black per capita disposable income
in current dollars ............................................... 0.60 0.033 18.19
Part-timeIntercept term for 17-year-olds ................................ -13.92 0.846 -16.46 0.46 1.85*Intercept term for 18-year-olds ................................ -11.88 0.828 -14.34Intercept term for 19-year-olds ................................ -11.37 0.827 -13.75Intercept term for 20-year-olds ................................ -11.33 0.826 -13.71Intercept term for 21-year-olds ................................ -11.27 0.825 -13.67Intercept term for 22-year-olds ................................ -11.29 0.824 -13.69Intercept term for 23-year-olds ................................ -11.36 0.824 -13.78Intercept term for 24-year-olds ................................ -11.48 0.825 -13.91Intercept term for 25- to 29-year-olds ..................... -11.62 0.821 -14.15Intercept term for 30- to 34-year-olds ..................... -11.79 0.821 -14.35Intercept term for 35- to 44-year-olds ..................... -11.59 0.821 -14.12Log of Black per capita disposable income
in current dollars ............................................... 0.48 0.044 10.93
* p < .05.NOTE: R2 = Coefficient of determination. D.W. statistic = Durbin-Watson statistic, a test forautocorrelation among regression residuals. For more details see Johnston, J., and Dinardo,J. (1996). Econometric Methods. New York: McGraw-Hill. The regression method used toestimate the full-time and part-time equations was the pooled seemingly unrelated regressionmethod. The time period used to estimate the equations is from 1980 to 2015. The number of
observations is 396. For additional information, see Intriligator, M.D. (1978). EconometricModels, Techniques, & Applications. New Jersey: Prentice-Hall, Inc., pp. 165–173. Race cat-egories exclude persons of Hispanic ethnicity.SOURCE: U.S. Department of Education, National Center for Education Statistics, Enroll-ment in Degree-Granting Institutions by Race/Ethnicity Projection Model, 1980 through2026. (This table was prepared February 2017.)

120 Appendix A. Introduction to Projection Methodology
Table A-26. Estimated equations and model statistics for full-time and part-time enrollment rates of Hispanic males at degree-granting postsecondary institutions based on data from 1980 to 2015
Independent variable Coefficient Standard error t-statistic R2 D.W. statistic
1 2 3 4 5 6
Full-timeIntercept term for 17-year-olds ................................ -12.73 0.755 -16.87 0.92 1.89*Intercept term for 18-year-olds ................................ -10.61 0.749 -14.16Intercept term for 19-year-olds ................................ -10.39 0.749 -13.86Intercept term for 20-year-olds ................................ -10.56 0.750 -14.09Intercept term for 21-year-olds ................................ -10.79 0.751 -14.37Intercept term for 22-year-olds ................................ -11.24 0.751 -14.98Intercept term for 23-year-olds ................................ -11.54 0.751 -15.37Intercept term for 24-year-olds ................................ -11.74 0.750 -15.64Intercept term for 25- to 29-year-olds ..................... -12.55 0.751 -16.71Intercept term for 30- to 34-year-olds ..................... -13.40 0.751 -17.84Intercept term for 35- to 44-year-olds ..................... -13.88 0.753 -18.44Log of Hispanic per capita disposable income
in current dollars ............................................... 0.48 0.041 11.70
Part-timeIntercept term for 17-year-olds ................................ -12.68 0.740 -17.12 0.59 1.75*Intercept term for 18-year-olds ................................ -10.52 0.571 -18.43Intercept term for 19-year-olds ................................ -10.17 0.573 -17.75Intercept term for 20-year-olds ................................ -10.04 0.571 -17.59Intercept term for 21-year-olds ................................ -10.08 0.571 -17.66Intercept term for 22-year-olds ................................ -10.48 0.570 -18.40Intercept term for 23-year-olds ................................ -10.44 0.575 -18.18Intercept term for 24-year-olds ................................ -10.68 0.570 -18.72Intercept term for 25- to 29-year-olds ..................... -10.94 0.564 -19.41Intercept term for 30- to 34-year-olds ..................... -11.48 0.567 -20.26Intercept term for 35- to 44-year-olds ..................... -11.45 0.563 -20.34Log of Hispanic per capita disposable income
in current dollars ............................................... 0.41 0.031 13.48
* p < .05.NOTE: R2 = Coefficient of determination. D.W. statistic = Durbin-Watson statistic, a test forautocorrelation among regression residuals. For more details see Johnston, J., and Dinardo, J.(1996). Econometric Methods. New York: McGraw-Hill. The regression method used to esti-mate the full-time and part-time equations was the pooled seemingly unrelated regressionmethod. The time period used to estimate the equations is from 1980 to 2015. The number of
observations is 396. For additional information, see Intriligator, M.D. (1978). Econometric Mod-els, Techniques, & Applications. New Jersey: Prentice-Hall, Inc., pp. 165–173.SOURCE: U.S. Department of Education, National Center for Education Statistics, Enrollmentin Degree-Granting Institutions by Race/Ethnicity Projection Model, 1980 through 2026. (Thistable was prepared February 2017.)

Projections of Education Statistics to 2026 121
Table A-27. Estimated equations and model statistics for full-time and part-time enrollment rates of Hispanic females at degree-granting postsecondary institutions based on data from 1980 to 2015
Independent variable Coefficient Standard error t-statistic R2 D.W. statistic
1 2 3 4 5 6
Full-timeIntercept term for 17-year-olds ................................ -17.91 0.685 -26.15 0.92 1.90*Intercept term for 18-year-olds ................................ -15.39 0.674 -22.83Intercept term for 19-year-olds ................................ -15.25 0.673 -22.65Intercept term for 20-year-olds ................................ -15.55 0.674 -23.07Intercept term for 21-year-olds ................................ -15.67 0.674 -23.23Intercept term for 22-year-olds ................................ -16.28 0.675 -24.12Intercept term for 23-year-olds ................................ -16.56 0.675 -24.51Intercept term for 24-year-olds ................................ -17.03 0.677 -25.14Intercept term for 25- to 29-year-olds ..................... -17.69 0.673 -26.28Intercept term for 30- to 34-year-olds ..................... -18.37 0.675 -27.21Intercept term for 35- to 44-year-olds ..................... -18.74 0.676 -27.71Log of Hispanic per capita disposable income
in current dollars ............................................... 0.77 0.037 21.03
Part-timeIntercept term for 17-year-olds ................................ -14.85 0.654 -22.70 0.60 2.00*Intercept term for 18-year-olds ................................ -12.76 0.635 -20.09Intercept term for 19-year-olds ................................ -12.37 0.636 -19.46Intercept term for 20-year-olds ................................ -12.62 0.637 -19.79Intercept term for 21-year-olds ................................ -12.46 0.637 -19.58Intercept term for 22-year-olds ................................ -12.79 0.637 -20.07Intercept term for 23-year-olds ................................ -12.71 0.634 -20.06Intercept term for 24-year-olds ................................ -12.96 0.636 -20.40Intercept term for 25- to 29-year-olds ..................... -13.29 0.630 -21.10Intercept term for 30- to 34-year-olds ..................... -13.69 0.630 -21.72Intercept term for 35- to 44-year-olds ..................... -13.58 0.630 -21.56Log of Hispanic per capita disposable income
in current dollars ............................................... 0.56 0.034 16.42
* p < .05.NOTE: R2 = Coefficient of determination. D.W. statistic = Durbin-Watson statistic, a test forautocorrelation among regression residuals. For more details see Johnston, J., and Dinardo,J. (1996). Econometric Methods. New York: McGraw-Hill. The regression method used toestimate the full-time and part-time equations was the pooled seemingly unrelated regressionmethod. The time period used to estimate the equations is from 1980 to 2015. The number of
observations is 396. For additional information, see Intriligator, M.D. (1978). EconometricModels, Techniques, & Applications. New Jersey: Prentice-Hall, Inc., pp. 165–173.SOURCE: U.S. Department of Education, National Center for Education Statistics, Enroll-ment in Degree-Granting Institutions by Race/Ethnicity Projection Model, 1980 through2026. (This table was prepared February 2017.)

122 Appendix A. Introduction to Projection Methodology
Table A-28. Estimated equations and model statistics for full-time and part-time enrollment rates of Asian/Pacific Islander males at degree-granting postsecondary institutions based on data from 1989 to 2015
Independent variable Coefficient Standard error t-statistic R2 D.W. statistic
1 2 3 4 5 6
Full-timeIntercept term for 17-year-olds ................................ -3.75 0.577 -14.87 0.94 1.95*Intercept term for 18-year-olds ................................ -1.04 0.566 -10.11Intercept term for 19-year-olds ................................ -0.79 0.568 -9.69Intercept term for 20-year-olds ................................ -0.83 0.575 -9.94Intercept term for 21-year-olds ................................ -0.81 0.575 -9.87Intercept term for 22-year-olds ................................ -1.18 0.576 -10.48Intercept term for 23-year-olds ................................ -1.47 0.577 -10.88Intercept term for 24-year-olds ................................ -1.76 0.577 -11.46Intercept term for 25- to 29-year-olds ..................... -2.52 0.587 -13.19Intercept term for 30- to 34-year-olds ..................... -3.56 0.589 -14.98Intercept term for 35- to 44-year-olds ..................... -4.38 0.588 -16.47Log of Asian/Pacific Islander per capita disposable
income in current dollars ................................... 0.05 0.028 1.77Log unemployment rate for Asian/Pacific Islanders .. 0.17 0.041 4.21
Part-timeIntercept term for 17-year-olds ................................ -1.68 0.904 -1.86 0.64 1.96*Intercept term for 18-year-olds ................................ -0.04 0.670 -0.06Intercept term for 19-year-olds ................................ 0.73 0.659 1.11Intercept term for 20-year-olds ................................ 0.54 0.670 0.80Intercept term for 21-year-olds ................................ 0.53 0.667 0.79Intercept term for 22-year-olds ................................ 0.56 0.675 0.83Intercept term for 23-year-olds ................................ 0.35 0.661 0.53Intercept term for 24-year-olds ................................ 0.25 0.658 0.39Intercept term for 25- to 29-year-olds ..................... -0.17 0.650 -0.27Intercept term for 30- to 34-year-olds ..................... -0.84 0.654 -1.29Intercept term for 35- to 44-year-olds ..................... -1.09 0.649 -1.68Log of Asian/Pacific Islander level of educational
attainment per household ................................. 0.14 0.041 3.44
* p < .05.NOTE: R2 = Coefficient of determination. D.W. statistic = Durbin-Watson statistic, a test forautocorrelation among regression residuals. For more details see Johnston, J., and Dinardo,J. (1996). Econometric Methods. New York: McGraw-Hill. The regression method used toestimate the full-time and part-time equations was the pooled seemingly unrelated regres-sion method. The time period used to estimate the is from 1989 to 2015. The number of
observations equal to 297. For additional information, see Intriligator, M.D. (1978). Econo-metric Models, Techniques, & Applications. New Jersey: Prentice-Hall, Inc., pp. 165–173.Race categories exclude persons of Hispanic ethnicity.SOURCE: U.S. Department of Education, National Center for Education Statistics, Enroll-ment in Degree-Granting Institutions by Race/Ethnicity Projection Model, 1989 through2026. (This table was prepared February 2017.)
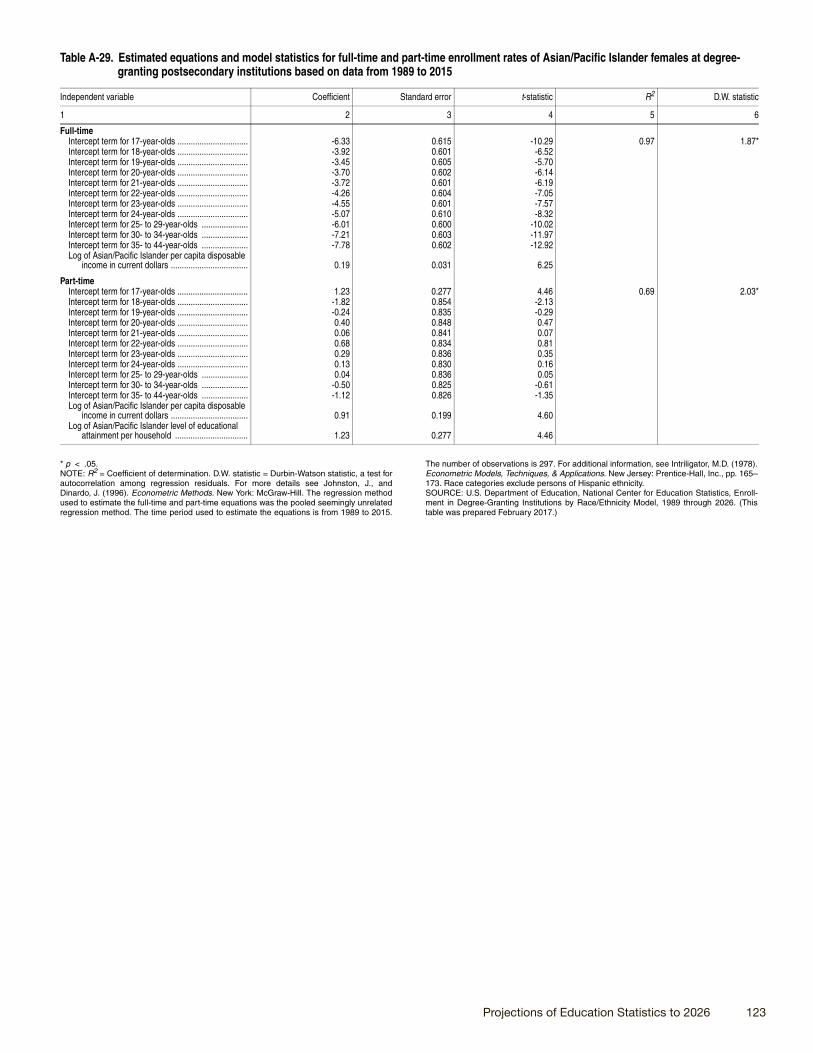
Projections of Education Statistics to 2026 123
Table A-29. Estimated equations and model statistics for full-time and part-time enrollment rates of Asian/Pacific Islander females at degree-granting postsecondary institutions based on data from 1989 to 2015
Independent variable Coefficient Standard error t-statistic R2 D.W. statistic
1 2 3 4 5 6
Full-timeIntercept term for 17-year-olds ................................ -6.33 0.615 -10.29 0.97 1.87*Intercept term for 18-year-olds ................................ -3.92 0.601 -6.52Intercept term for 19-year-olds ................................ -3.45 0.605 -5.70Intercept term for 20-year-olds ................................ -3.70 0.602 -6.14Intercept term for 21-year-olds ................................ -3.72 0.601 -6.19Intercept term for 22-year-olds ................................ -4.26 0.604 -7.05Intercept term for 23-year-olds ................................ -4.55 0.601 -7.57Intercept term for 24-year-olds ................................ -5.07 0.610 -8.32Intercept term for 25- to 29-year-olds ..................... -6.01 0.600 -10.02Intercept term for 30- to 34-year-olds ..................... -7.21 0.603 -11.97Intercept term for 35- to 44-year-olds ..................... -7.78 0.602 -12.92Log of Asian/Pacific Islander per capita disposable
income in current dollars ................................... 0.19 0.031 6.25
Part-timeIntercept term for 17-year-olds ................................ 1.23 0.277 4.46 0.69 2.03*Intercept term for 18-year-olds ................................ -1.82 0.854 -2.13Intercept term for 19-year-olds ................................ -0.24 0.835 -0.29Intercept term for 20-year-olds ................................ 0.40 0.848 0.47Intercept term for 21-year-olds ................................ 0.06 0.841 0.07Intercept term for 22-year-olds ................................ 0.68 0.834 0.81Intercept term for 23-year-olds ................................ 0.29 0.836 0.35Intercept term for 24-year-olds ................................ 0.13 0.830 0.16Intercept term for 25- to 29-year-olds ..................... 0.04 0.836 0.05Intercept term for 30- to 34-year-olds ..................... -0.50 0.825 -0.61Intercept term for 35- to 44-year-olds ..................... -1.12 0.826 -1.35Log of Asian/Pacific Islander per capita disposable
income in current dollars ................................... 0.91 0.199 4.60Log of Asian/Pacific Islander level of educational
attainment per household ................................. 1.23 0.277 4.46
* p < .05.NOTE: R2 = Coefficient of determination. D.W. statistic = Durbin-Watson statistic, a test forautocorrelation among regression residuals. For more details see Johnston, J., andDinardo, J. (1996). Econometric Methods. New York: McGraw-Hill. The regression methodused to estimate the full-time and part-time equations was the pooled seemingly unrelatedregression method. The time period used to estimate the equations is from 1989 to 2015.
The number of observations is 297. For additional information, see Intriligator, M.D. (1978).Econometric Models, Techniques, & Applications. New Jersey: Prentice-Hall, Inc., pp. 165–173. Race categories exclude persons of Hispanic ethnicity.SOURCE: U.S. Department of Education, National Center for Education Statistics, Enroll-ment in Degree-Granting Institutions by Race/Ethnicity Model, 1989 through 2026. (Thistable was prepared February 2017.)

124 Appendix A. Introduction to Projection Methodology
A.6. POSTSECONDARY DEGREES CONFERREDProjections in this editionThis edition of Projections of Education Statistics presents projections of postsecondary degrees conferred by level of degree and sex of recipient for 2015–16 through 2026–27.
Overview of approach Basic approachProjections of associate’s, bachelor’s, master’s, and doctor’s degrees for males and females were produced using forecasting equations that relate degrees conferred to full-time enrollment in degree-granting institutions by sex, student level (undergraduate or postbaccalaureate), and institution level (2-year or 4-year).
Degrees Conferred Projection ModelProcedures used to project degreesFor all degree levels, projections of degrees conferred were made separately for males and for females. The projections for males and females were then summed to get projections of the total number of degrees.
Multiple linear regression was used to project associate’s, bachelor’s, master’s, and doctor’s degrees based on enrollment variables for males and females. The enrollment variables used for the different levels of degrees are briefly described below.
For details and results of the regression analyses used to project associate’s, bachelor’s, master’s, and doctor’s degrees, see table A-30, under “Data and equations used to project degrees,” later in this section.
Associate’s degrees. Projections were based on full-time undergraduate enrollment in 2-year institutions by sex. Males’ projections of associate’s degrees were based on current full-time enrollment and full-time enrollment lagged 2 years. Females’ projections of associate’s degrees were based on current full-time enrollment and full-time enrollment lagged 1 and 2 years.
Bachelor’s degrees. Projections were based on full-time undergraduate enrollment in 4-year institutions by sex. For males and for females, bachelor’s degree projections were based on current full-time enrollment and full-time enrollment lagged 2 years.
Master’s degrees. Projections were based on full-time postbaccalaureate enrollment by sex. Males’ projections of master’s degrees were based on current full-time enrollment and full-time enrollment lagged 1 year. Females’ projections of master’s degrees were based on current full-time enrollment.
Doctor’s degrees. Projections were based on full-time postbaccalaureate enrollment by sex. For males and for females, doctor’s degree projections were based on current full-time postbaccalaureate enrollment and full-time postbaccalaureate enrollment lagged 1 and 2 years.
Data and equations used to project degreesEnrollment data and projections for degree-granting institutions. Historical enrollment data by sex, level of student, and level of institution came from the NCES Integrated Postsecondary Education Data System (IPEDS). For the time period used for each level of degree, see table A-30 on page 126. The enrollment projections used are those produced for this edition of Projections of Education Statistics. For more information about the enrollment projections, see Section A.5. Enrollment in Degree-granting postsecondary Institutions, earlier in this appendix.
Data on degrees awarded at all levels. Historical data by level of degree and sex of recipient came from the NCES Integrated Postsecondary Education Data System (IPEDS). Associate’s and bachelor’s degrees were projected using data from 1970–71 to 2014–15 and master’s and doctor’s degrees were projected using data from 1980–81 to 2014–15.
Estimated equations and model statistics. For details on the equations used to project associate’s, bachelor’s, master’s, and doctor’s degrees, see table A-30 on page 126. The equations shown were selected on the basis of their statistical properties, such as coefficients of determination (R2s), the t-statistics of the coefficients, the Durbin-Watson statistic, the Breusch-Godfrey Serial Correlation LM test statistic, and residual plots.

Projections of Education Statistics to 2026 125
Accuracy of projectionsMean absolute percentage errors (MAPEs) for associate’s and bachelor’s degrees conferred by degree-granting institutions were calculated using the last eight editions of Projections of Education Statistics and MAPEs for master’s and doctor’s degrees conferred by degree-granting institutions were calculated using the last five editions of Projections of Education Statistics.
Table J. Mean absolute percentage errors (MAPEs) of projected associate’s and bachelor’s degrees conferred by degree-granting postsecondary institutions, by lead time: MAPEs constructed using projections from Projections of Education Statistics to 2018 through Projections of Education Statistics to 2025
StatisticLead time (years)
1 2 3 4 5 6 7 8 9 10
Associate's degrees 2.8 5.5 8.1 11.5 12.9 13.9 14.6 15.1 — —Bachelor's degrees 0.6 0.6 1.1 2.4 3.6 5.1 5.8 6.2 — —Master's degrees 0.9 3.4 5.3 6.6 5.8 — — — — —Doctor's degrees 0.2 0.1 0.1 1.3 0.8 — — — — —— Not available.NOTE: MAPEs for associate’s and bachelor’s degrees conferred were calculated using the last eight editions of Projections of Education Statistics, from Projections of Education Statistics to 2018 through Projections of Education Statistics to 2025. and MAPEs for master’s degrees and doctor’s degrees were calculated using the last 5 editions of Projections of Education Statistics, from Projections of Education Statistics to 2021 through Projections of Education Statistics to 2025.SOURCE: U.S. Department of Education, National Center for Education Statistics, Projections of Education Statistics, various issues. (This table was prepared February 2017.)
For more information about MAPEs, see Section A.0. Introduction, earlier in this appendix.

126 Appendix A. Introduction to Projection Methodology
Table A-30. Estimated equations and model statistics for degrees conferred, by degree type and sex based on data from 1970–71 to 2014–15
Dependent variable Equation1 R2
Breusch-GodfreySerial CorrelationLM test statistic2 Time period
1 2 3 4 5
Associate’s degrees, males ........................................ DASSOCM = 3821.3 + 74.4DUGFT2M + 86.6DUGFT2ML2 0.45 6.30 (0.043) 1970–71 to(3.06) (3.82) (4.42) 2014–15
Associate’s degrees, females ..................................... DLOGASSOCW = # + 0.8DLOGUGFT2WS3 + .6MA(1) 0.79 5.16 (0.076) 1970–71 to† (7.74) (4.98) 2014–15
Bachelor’s degrees, males ......................................... DBACHM = 870.8 + 55.0DUGFT4M + 150.5DUGFT4ML2 0.73 1.56 (0.458) 1970–71 to-0.74 (2.95) (8.42) 2014–15
Bachelor’s degrees, females ...................................... DBACHW = 5115.8 + 31.4DUGFT4W + 141.0DUGFT4WL2 0.61 3.87 (0.144) 1970–71 to(2.85) (1.58) (6.75) 2014–15
Master’s degrees, males ............................................ PCHMASTM = # + 0.6PCHPBFTM + 0.5PCHPBFTML1 0.67 0.99 (0.609) 1980–81 to† (4.55) (3.41) 2014–15
Master’s degrees, females ......................................... PCHMASTW = # + 0.5PCHPBFTW + 0.5AR(1) 0.60 3.23 (0.199) 1980–81 to† (3.12) (3.99) 2014–15
Doctor’s degrees, males ............................................. DDOCM = -378.8 + 60.6DPBFTML1 + 48.4DPBFTML2 0.54 1.59 (0.451) 1980–81 to(-1.71) (3.08) (2.46) 2014–15
Doctor’s degrees, females .......................................... DDOCW = 777.4 + 18.3DPBFTWL1 + 41.5DPBFTWL2 0.43 0.22 (0.896) 1980–81 to(2.80) (1.62) (3.64) 2014–15
† Not applicable.# Rounds to zero.1AR(1) indicates that the model was estimated to account for first-order autocorrelation. To estimatethe model, it was first transformed into a nonlinear model and then the coefficients were estimatedsimultaneously by applying a Marquardt nonlinear least squares algorithm to the transformed equa-tion. MA(1) indicates that the model was estimated to incorporate moving average of the residualinto model fit. For a general discussion of the problem of autocorrelation, and the method used toforecast in the presence of autocorrelation, see Judge, G., Hill, W., Griffiths, R., Lutkepohl, H., andLee, T. (1985). The Theory and Practice of Econometrics. New York: John Wiley and Sons, pp.315–318. Numbers in parentheses are t-statistics.2The number in parentheses is the probability of the Chi-Square associated with the Breusch-Godfrey Serial Correlation LM Test. A p value greater that 0.05 implies that we do not reject thenull hypothesis of no autocorrelation at the 5 percent significance level for a two-tailed test or 10percent significance level for a one-tailed test (i.e., there is no autocorrelation present). For anexplanation of the Breusch-Godfrey Serial Correlation LM test statistic, see Greene, W. (2000).Econometric Analysis. New Jersey: Prentice-Hall.NOTE: R2 is the coefficient of determination.DASSOCM = First difference of associate’s degrees awarded to males.DLOGASSOCW = First difference of the log of associate’s degrees awarded to females.DBACHM = First difference of bachelor’s degrees awarded to males.DBACHW = First difference of bachelor’s degrees awarded to females.PCHMASTM = Percentage change in master’s degrees awarded to males.PCHMASTW = Percentage change in master’s degrees awarded to females.
DDOCM = First difference of doctor’s degrees awarded to males.DDOCW = First difference of doctor’s degrees awarded to females.DUGFT2M = First difference of full-time male undergraduate enrollment in 2-year institutions.DUGFT2ML2 = First difference of full-time male undergraduate enrollment in 2-year institutions,lagged two periods.DLOGUGFT2WS3 = First difference of the sum of the full-time female undergraduate enrollment in2-year institutions over the present year and the previous 2 years.DUGFT4M = First difference of full-time male undergraduate enrollment in 4-year institutions.DUGFT4ML2 = First difference of full-time male undergraduate enrollment in 4-year institutions,lagged two periods.DUGFT4W = First difference of full-time female undergraduate enrollment in 4-year institutions.DUGFT4WL2 = First difference of full-time female undergraduate enrollment in 4-year institutions,lagged two periods.PCHPBFTM = Percentage change in full-time male postbaccalaureate enrollment.PCHPBFTML1 = Percentage change in full-time male postbaccalaureate enrollment lagged 1 year.PCHPBFTW = Percentage change in full-time female postbaccalaureate enrollment.DPBFTML1 = First difference of full-time male postbaccalaureate enrollment lagged 1 year.DPBFTML2 = First difference of full-time male postbaccalaureate enrollment lagged 2 years.DPBFTWL1 = First difference of full-time female postbaccalaureate enrollment lagged 1 year.DPBFTWL2 = First difference of full-time female postbaccalaureate enrollment lagged 2 years.SOURCE: U.S. Department of Education, National Center for Education Statistics, Degrees Con-ferred Projection Model, 1970–71 through 2026–27. (This table was prepared February 2017.)

Projections of Education Statistics to 2026 127
Appendix BSupplementary Tables

This page intentionally left blank.

Projections of Education Statistics to 2026 129
Table B-1. Actual and projected prekindergarten- and kindergarten-age populations, by age: 2001 through 2026[In thousands]
Year (July 1) 3- to 5-year-olds 3-year-olds 4-year-olds 5-year-olds
1 2 3 4 5
Actual2001 ............................................................................ 11,540 3,803 3,827 3,9102002 ............................................................................ 11,454 3,804 3,813 3,8372003 ............................................................................ 11,501 3,861 3,817 3,8242004 ............................................................................ 11,714 4,008 3,877 3,8302005 ............................................................................ 11,866 3,943 4,030 3,893
2006 ............................................................................ 11,987 3,966 3,971 4,0512007 ............................................................................ 11,996 4,004 3,998 3,9932008 ............................................................................ 12,058 3,992 4,041 4,0242009 ............................................................................ 12,129 4,026 4,033 4,0702010 ............................................................................ 12,254 4,112 4,078 4,065
2011 ............................................................................ 12,312 4,102 4,122 4,0882012 ............................................................................ 12,228 3,983 4,113 4,1322013 ............................................................................ 12,111 3,993 3,994 4,1242014 ............................................................................ 12,020 4,007 4,006 4,0072015 ............................................................................ 12,012 3,974 4,020 4,018
Projected2016 ............................................................................ 12,001 3,981 3,987 4,0322017 ............................................................................ 12,016 4,012 3,989 4,0162018 ............................................................................ 12,079 4,041 4,020 4,0182019 ............................................................................ 12,168 4,070 4,049 4,0492020 ............................................................................ 12,255 4,098 4,078 4,079
2021 ............................................................................ 12,339 4,125 4,107 4,1082022 ............................................................................ 12,419 4,149 4,133 4,1362023 ............................................................................ 12,493 4,171 4,158 4,1632024 ............................................................................ 12,557 4,189 4,180 4,1882025 ............................................................................ 12,610 4,203 4,198 4,2102026 ............................................................................ 12,653 4,214 4,212 4,228
NOTE: Some data have been revised from previously published figures. Detail may not sumto totals because of rounding. As the Census Bureau projections were not updated to reflectthe most recent Census Bureau population estimates, the Census Bureau age-specific popu-lation projections for each year were adjusted by multiplying the ratio of the total CensusBureau estimate for 2015 to the total Census Bureau projection for 2015.
SOURCE: U.S. Department of Commerce, Census Bureau, Population Estimates, retrieved Sep-tember 21, 2016 from https://www2.census.gov/programs-surveys/popest/datasets/2010-2015/;and Population Projections, retrieved August 4, 2015, from https://www.census.gov/programs-surveys/popproj.html. (This table was prepared March 2017.)

130 Appendix B. Supplementary Tables
Table B-2. Actual and projected school-age populations, by selected ages: 2001 through 2026[In thousands]
Year (July 1) 5-year-olds 6-year-olds 5- to 13-year-olds 14- to 17-year-olds
1 2 3 4 5
Actual2001 ............................................................................ 3,910 3,973 37,093 16,2802002 ............................................................................ 3,837 3,913 37,001 16,5062003 ............................................................................ 3,824 3,838 36,814 16,6942004 ............................................................................ 3,830 3,822 36,458 17,0542005 ............................................................................ 3,893 3,828 36,248 17,358
2006 ............................................................................ 4,051 3,891 36,269 17,5492007 ............................................................................ 3,993 4,046 36,296 17,5972008 ............................................................................ 4,024 3,988 36,438 17,3952009 ............................................................................ 4,070 4,018 36,657 17,2322010 ............................................................................ 4,065 4,073 36,867 17,066
2011 ............................................................................ 4,088 4,075 36,918 16,8732012 ............................................................................ 4,132 4,098 37,008 16,7222013 ............................................................................ 4,124 4,143 37,083 16,6562014 ............................................................................ 4,007 4,136 36,973 16,7542015 ............................................................................ 4,018 4,019 36,924 16,814
Projected2016 ............................................................................ 4,032 4,030 36,976 16,7792017 ............................................................................ 4,016 4,044 36,968 16,7502018 ............................................................................ 4,018 4,027 36,921 16,6812019 ............................................................................ 4,049 4,030 36,902 16,6652020 ............................................................................ 4,079 4,061 36,890 16,762
2021 ............................................................................ 4,108 4,090 36,862 16,8782022 ............................................................................ 4,136 4,120 36,874 16,9422023 ............................................................................ 4,163 4,148 37,030 16,8852024 ............................................................................ 4,188 4,175 37,202 16,8162025 ............................................................................ 4,210 4,201 37,382 16,7152026 ............................................................................ 4,228 4,223 37,598 16,607
NOTE: Some data have been revised from previously published figures. Detail may not sumto totals because of rounding. As the Census Bureau projections were not updated to reflectthe most recent Census Bureau population estimates, the Census Bureau age-specific popu-lation projections for each year were adjusted by multiplying the ratio of the total CensusBureau estimate for 2015 to the total Census Bureau projection for 2015.
SOURCE: U.S. Department of Commerce, Census Bureau, Population Estimates, retrieved Sep-tember 21, 2016 from https://www2.census.gov/programs-surveys/popest/datasets/2010-2015/;and Population Projections, retrieved August 4, 2015, from https://www.census.gov/programs-surveys/popproj.html. (This table was prepared March 2017.)

Projections of Education Statistics to 2026 131
Table B-3. Actual and projected college-age populations, by selected ages: 2001 through 2026[In thousands]
Year (July 1) 18-year-olds 18- to 24-year-olds 25- to 29-year-olds 30- to 34-year-olds 35- to 44-year-olds
1 2 3 4 5 6
Actual2001 ............................................................................ 4,106 28,081 18,866 20,689 45,1012002 ............................................................................ 4,087 28,598 18,752 20,705 44,7062003 ............................................................................ 4,206 29,121 18,872 20,545 44,2512004 ............................................................................ 4,218 29,474 19,193 20,220 43,8812005 ............................................................................ 4,228 29,609 19,629 19,787 43,594
2006 ............................................................................ 4,303 29,758 20,200 19,343 43,3252007 ............................................................................ 4,397 29,973 20,640 19,231 42,8792008 ............................................................................ 4,590 30,355 21,003 19,365 42,2752009 ............................................................................ 4,537 30,687 21,184 19,708 41,5732010 ............................................................................ 4,493 30,918 21,249 20,132 41,066
2011 ............................................................................ 4,404 31,242 21,397 20,592 40,7502012 ............................................................................ 4,361 31,510 21,485 20,983 40,6402013 ............................................................................ 4,296 31,631 21,675 21,349 40,6002014 ............................................................................ 4,229 31,581 22,068 21,592 40,5872015 ............................................................................ 4,219 31,303 22,519 21,715 40,634
Projected2016 ............................................................................ 4,227 30,994 23,019 21,900 40,6682017 ............................................................................ 4,243 30,790 23,491 22,055 41,0212018 ............................................................................ 4,326 30,751 23,776 22,298 41,5692019 ............................................................................ 4,276 30,693 23,894 22,724 42,1282020 ............................................................................ 4,187 30,601 23,741 23,206 42,722
2021 ............................................................................ 4,217 30,604 23,484 23,739 43,4192022 ............................................................................ 4,260 30,657 23,266 24,216 44,0052023 ............................................................................ 4,264 30,705 23,140 24,507 44,6492024 ............................................................................ 4,288 30,762 23,062 24,633 45,3422025 ............................................................................ 4,334 30,782 23,121 24,490 45,9782026 ............................................................................ 4,326 30,842 23,193 24,242 46,728
NOTE: Some data have been revised from previously published figures. Detail may not sumto totals because of rounding. As the Census Bureau projections were not updated to reflectthe most recent Census Bureau population estimates, the Census Bureau age-specific popu-lation projections for each year were adjusted by multiplying the ratio of the total CensusBureau estimate for 2015 to the total Census Bureau projection for 2015.
SOURCE: U.S. Department of Commerce, Census Bureau, Population Estimates, retrieved Sep-tember 21, 2016 from https://www2.census.gov/programs-surveys/popest/datasets/2010-2015/;and Population Projections, retrieved August 4, 2015, from https://www.census.gov/programs-surveys/popproj.html. (This table was prepared March 2017.)

132 Appendix B. Supplementary Tables
Table B-4. Actual and projected fall enrollment in public elementary and secondary schools, change in fall enrollment from previous year, resident population, and fall enrollment as a ratio of the population: School years 2001–02 through 2026–27
School year Fall enrollment (in thousands)Change in fall enrollment from
previous year (in thousands)Resident population
(in millions)Fall enrollment as
a ratio of the population
1 2 3 4 5
Actual2001–02 ...................................................................... 47,672 468 285.2 0.1672002–03 ...................................................................... 48,183 511 287.9 0.1672003–04 ...................................................................... 48,540 357 290.6 0.1672004–05 ...................................................................... 48,795 255 293.2 0.1662005–06 ...................................................................... 49,113 318 295.9 0.166
2006–07 ...................................................................... 49,316 203 298.8 0.1652007–08 ...................................................................... 49,293 -23 301.7 0.1632008–09 ...................................................................... 49,266 -27 304.5 0.1622009–10 ...................................................................... 49,361 95 307.2 0.1612010–11 ...................................................................... 49,484 123 309.8 0.160
2011–12 ...................................................................... 49,522 37 312.1 0.1592012–13 ...................................................................... 49,771 249 314.4 0.1582013–14 ...................................................................... 50,045 273 316.7 0.1582014–15 ...................................................................... 50,313 268 319.2 0.158
Projected2015–16 ...................................................................... 50,485 172 321.7 0.1572016–17 ...................................................................... 50,625 140 324.1 0.1562017–18 ...................................................................... 50,710 85 326.8 0.1552018–19 ...................................................................... 50,759 50 329.4 0.1542019–20 ...................................................................... 50,843 84 332.0 0.153
2020–21 ...................................................................... 50,996 153 334.6 0.1522021–22 ...................................................................... 51,152 156 337.2 0.1522022–23 ...................................................................... 51,301 149 339.8 0.1512023–24 ...................................................................... 51,455 154 342.4 0.1502024–25 ...................................................................... 51,562 107 345.0 0.149
2025–26 ...................................................................... 51,632 71 347.5 0.1492026–27 ...................................................................... 51,738 106 350.0 0.148
NOTE: Resident population includes civilian population and armed forces personnel resid-ing with the United States: it excludes armed forces personnel overseas. Calculations weremade using unrounded numbers. Some data have been revised from previously publishedfigures. Detail may not sum to totals because of rounding. As the Census Bureau projec-tions were not updated to reflect the most recent Census Bureau population estimates, theCensus Bureau age-specific population projections for each year were adjusted by multiply-ing the ratio of the total Census Bureau estimate for 2015 to the total Census Bureau projec-tion for 2015.
SOURCE: U.S. Department of Commerce, Census Bureau, Population Estimates, retrieved Sep-tember 21, 2016 from https://www2.census.gov/programs-surveys/popest/datasets/2010-2015/;and Population Projections, retrieved August 4, 2015, from https://www.census.gov/programs-surveys/popproj.html. U.S. Department of Education, National Center for Education Statistics,Common Core of Data (CCD), “State Nonfiscal Survey of Public Elementary/Secondary Educa-tion,” 1996–97 through 2014–15; and National Elementary and Secondary Enrollment ProjectionModel, 1972 through 2026. (This table was prepared March 2017.)

Projections of Education Statistics to 2026 133
Table B-5. Actual and projected macroeconomic measures of the economy: School years 2001–02 through 2026–27
School yearDisposable income per capitain constant 2015–16 dollars1
Education revenue receipts from state sourcesper capita in constant 2015–16 dollars2 Consumer Price Index3
1 2 3 4
Actual2001–02 ...................................................................... $35,960 $969 0.7482002–03 ...................................................................... 36,338 974 0.7642003–04 ...................................................................... 37,425 958 0.7812004–05 ...................................................................... 37,979 969 0.8042005–06 ...................................................................... 38,667 980 0.835
2006–07 ...................................................................... 39,497 1,030 0.8562007–08 ...................................................................... 39,913 1,055 0.8882008–09 ...................................................................... 39,608 1,008 0.9012009–10 ...................................................................... 39,171 926 0.9102010–11 ...................................................................... 39,861 928 0.928
2011–12 ...................................................................... 40,456 903 0.9552012–13 ...................................................................... 40,691 895 0.9712013–14 ...................................................................... 40,625 923 0.9862014–154 .................................................................... 41,891 897 0.9932015–164 .................................................................... 42,821 917 1.000
Projected2016–17 ...................................................................... 43,456 929 1.0192017–18 ...................................................................... 44,228 941 1.0452018–19 ...................................................................... 45,133 954 1.0702019–20 ...................................................................... 45,940 965 1.0962020–21 ...................................................................... 46,681 975 1.123
2021–22 ...................................................................... 47,470 987 1.1512022–23 ...................................................................... 48,251 998 1.1802023–24 ...................................................................... 49,045 1,008 1.2092024–25 ...................................................................... 49,829 1,017 1.2392025–26 ...................................................................... 50,604 1,025 1.2702026–27 ...................................................................... 51,041 1,027 1.293
1Based on the price deflator for personal consumption expenditures, Bureau of Labor Sta-tistics, U.S. Department of Labor.2Based on the Consumer Price Index for all urban consumers, Bureau of Labor Statistics,U.S. Department of Labor.3Consumer Price Index adjusted to a school-year basis (July through June).4Education revenue receipts from state sources per capita is a projection.
NOTE: Calculations were made using unrounded numbers. Some data have been revised from previously published figures.SOURCE: U.S. Department of Education, National Center for Education Statistics, CommonCore of Data (CCD), “National Public Education Financial Survey,” 1999–2000 through2013–14; Revenue Receipts From State Sources Projections Model, 1971–72 through2026–27; and IHS Global Inc., “U.S. Quarterly Macroeconomic Model, November 2016Short-Term Baseline Projections.” (This table was prepared March 2017.)

This page intentionally left blank.

Projections of Education Statistics to 2026 135
Appendix C Data Sources
SOURCES AND COMPARABILITY OF DATAThe information in this report was obtained from many sources, including federal and state agencies, private research organizations, and professional associations. The data were collected by many methods, including surveys of a universe (such as all colleges) or of a sample, and compilations of administrative records. Care should be used when comparing data from different sources. Differences in procedures, such as timing, phrasing of questions, and interviewer training, mean that the results from the different sources are not strictly comparable. More extensive documentation of one survey’s procedures than of another’s does not imply more problems with the data, only that more information is available on the survey.
ACCURACY OF DATAThe accuracy of any statistic is determined by the joint effects of “sampling” and “nonsampling” errors. Estimates based on a sample will differ from the figures that would have been obtained if a complete census had been taken using the same survey instruments, instructions, and procedures. Besides sampling errors, both of the survey types, universe and sample, are subject to errors of design, reporting, and processing, and errors due to nonresponse. To the extent possible, these nonsampling errors are kept to a minimum by methods built into the survey procedures. In general, however, the effects of nonsampling errors are more difficult to gauge than those produced by sampling variability.
SAMPLING ERRORSThe standard error is the primary measure of the sampling variability of an estimate. Standard errors can be used to produce confidence intervals. For example, from table A-11, an estimated 93.1 percent of public school teachers reported that they worked full time in 2011–12. This figure has an estimated standard error of 0.46 percent. Therefore, the estimated 95 percent confidence interval for this statistic is approximately 92.15 to 93.98 percent (93.1 ± 1.96 [0.46]). That is, if the processes of selecting a sample, collecting the data, and constructing the confidence interval were repeated, it would be expected that in 95 out of 100 samples from the same population, the confidence interval would contain the true full-time working rate.
Analysis of standard errors can help assess how valid a comparison between two estimates might be. The standard error of a difference between two independent sample estimates is equal to the square root of the sum of the squared standard errors of the estimates. The standard error (se) of the difference between independent sample estimates a and b is
sea-b = (sea2 + seb
2)1/2
Note that some of the standard errors in the original documents are approximations. That is, to derive estimates of standard errors that would be applicable to a wide variety of items and could be prepared at a moderate cost, a number of approximations were required. As a result, most of the standard errors presented provide a general order of magnitude rather than the exact standard error for any specific item.
NONSAMPLING ERRORSBoth universe and sample surveys are subject to nonsampling errors. Nonsampling errors are of two kinds—random and nonrandom. Random nonsampling errors may arise when respondents or interviewers interpret questions differently, when respondents must estimate values, or when coders, keyers, and other processors handle answers differently. Nonrandom nonsampling errors result from total nonresponse (no usable data obtained for a sampled unit), partial or item nonresponse (only a portion of a response may be usable), inability or unwillingness on the part of respondents to provide information, difficulty interpreting questions, mistakes in recording or keying data, errors of collection or processing, and overcoverage or undercoverage of the target universe. Random nonresponse errors usually, but not always, result in an understatement
136 Appendix C. Data Sources
of sampling errors and thus an overstatement of the precision of survey estimates. Because estimating the magnitude of nonsampling errors would require special experiments or access to independent data, these magnitudes are seldom available.
To compensate for suspected nonrandom errors, adjustments of the sample estimates are often made. For example, adjustments are frequently made for nonresponse, both total and partial. Imputations are usually made separately within various groups of sample members that have similar survey characteristics. Imputation for item nonresponse is usually made by substituting for a missing item the response to that item of a respondent having characteristics similar to those of the respondent.
Although the magnitude of nonsampling errors in the data used in Projections of Education Statistics is frequently unknown, idiosyncrasies that have been identified are noted on the appropriate tables.
FEDERAL AGENCY SOURCES
National Center for Education Statistics (NCES)Common Core of DataThe Common Core of Data (CCD) is NCES’s primary database on public elementary and secondary education in the United States. It is a comprehensive, annual, national statistical database of all public elementary and secondary schools and school districts containing data designed to be comparable across all states. This database can be used to select samples for other NCES surveys and provide basic information and descriptive statistics on public elementary and secondary schools and schooling in general.
The CCD collects statistical information annually from approximately 100,000 public elementary and secondary schools and approximately 18,000 public school districts (including supervisory unions and regional education service agencies) in the 50 states, the District of Columbia, Department of Defense (DoD) dependents schools, the Bureau of Indian Education (BIE), Puerto Rico, American Samoa, Guam, the Northern Mariana Islands, and the U.S. Virgin Islands. Three categories of information are collected in the CCD survey: general descriptive information on schools and school districts; data on students and staff; and fiscal data. The general school and district descriptive information includes name, address, phone number, and type of locale; the data on students and staff include selected demographic characteristics; and the fiscal data pertain to revenues and current expenditures.
The EDFacts data collection system is the primary collection tool for the CCD. NCES works collaboratively with the Department of Education’s Performance Information Management Service to develop the CCD collection procedures and data definitions. Coordinators from state education agencies (SEAs) submit the CCD data at different levels (school, agency, and state) to the EDFacts collection system. Prior to submitting CCD files to EDFacts, SEAs must collect and compile information from their respective local education agencies (LEAs) through established administrative records systems within their state or jurisdiction.
Once SEAs have completed their submissions, the CCD survey staff analyzes and verifies the data for quality assurance. Even though the CCD is a universe collection and thus not subject to sampling errors, nonsampling errors can occur. The two potential sources of nonsampling errors are nonresponse and inaccurate reporting. NCES attempts to minimize nonsampling errors through the use of annual training of SEA coordinators, extensive quality reviews, and survey editing procedures. In addition, each year, SEAs are given the opportunity to revise their state-level aggregates from the previous survey cycle.
The CCD survey consists of five components: The Public Elementary/Secondary School Universe Survey, the Local Education Agency (School District) Universe Survey, the State Nonfiscal Survey of Public Elementary/Secondary Education, the National Public Education Financial Survey (NPEFS), and the School District Finance Survey (F-33). The following sections describe the CCD surveys that were used in preparing this report.
State Nonfiscal Survey of Public Elementary/Secondary EducationThe State Nonfiscal Survey of Public Elementary/Secondary Education for the 2014–15 school year provides state-level, aggregate information about students and staff in public elementary and secondary education. It includes data from the 50 states, the District of Columbia, Puerto Rico, the U.S. Virgin Islands, the Northern Mariana Islands, Guam, and American Samoa. The DoD dependents schools (overseas and domestic) and the BIE are also included in the survey universe. This survey covers public school student membership by grade, race/ethnicity, and state or jurisdiction and covers number of staff in public schools by category and state or jurisdiction. Beginning with the 2006–07 school year, the number of diploma

Projections of Education Statistics to 2026 137
recipients and other high school completers are no longer included in the State Nonfiscal Survey of Public Elementary/Secondary Education file. These data are now collected through the Local Education Agency (School District) Universe Survey and published in the public-use Common Core of Data State Dropout and Completion Data File.
National Public Education Financial Survey The purpose of the National Public Education Financial Survey (NPEFS) is to provide district, state, and federal policymakers, researchers, and other interested users with descriptive information about revenues and expenditures for public elementary and secondary education. The data collected are useful to (1) chief officers of state education agencies; (2) policymakers in the executive and legislative branches of federal and state governments; (3) education policy and public policy researchers; and (4) the public, journalists, and others.
Data for NPEFS are collected from state education agencies (SEAs) in the 50 states, the District of Columbia, Puerto Rico, American Samoa, Guam, the Northern Mariana Islands, and the U.S. Virgin Islands. The data file is organized by state or jurisdiction and contains revenue data by funding source; expenditure data by function (the activity being supported by the expenditure) and object (the category of expenditure); average daily attendance data; and total student membership data from the CCD State Nonfiscal Survey of Public Elementary/Secondary Education.
Further information on the nonfiscal CCD data may be obtained from
Patrick KeatonAdministrative Data DivisionElementary and Secondary Branch National Center for Education Statistics550 12th Street SWWashington, DC [email protected]://nces.ed.gov/ccd
Further information on the fiscal CCD data may be obtained from
Stephen CornmanAdministrative Data DivisionElementary and Secondary Branch National Center for Education Statistics550 12th Street SWWashington, DC [email protected]://nces.ed.gov/ccd
Integrated Postsecondary Education Data SystemThe Integrated Postsecondary Education Data System (IPEDS) surveys approximately 7,500 postsecondary institutions, including universities and colleges, as well as institutions offering technical and vocational education beyond the high school level. IPEDS, an annual universe collection that began in 1986, replaced the Higher Education General Information Survey (HEGIS).
IPEDS consists of interrelated survey components that provide information on postsecondary institutions, student enrollment, programs offered, degrees and certificates conferred, and both the human and financial resources involved in the provision of institutionally based postsecondary education. Prior to 2000, the IPEDS survey had the following subject-matter components: Graduation Rates; Fall Enrollment; Institutional Characteristics; Completions; Salaries, Tenure, and Fringe Benefits of Full-Time Faculty; Fall Staff; Finance; and Academic Libraries (in 2000, the Academic Libraries component became a survey separate from IPEDS). Since 2000, IPEDS survey components occurring in a particular collection year have been organized into three seasonal collection periods: fall, winter, and spring. The Institutional Characteristics and Completions components first took place during the fall 2000 collection; the Employees by Assigned Position (EAP), Salaries, and Fall Staff components first took place during the winter 2001–02 collection; and the Enrollment, Student Financial Aid, Finance, and Graduation Rates components first took place during the spring 2001 collection. In the winter 2005–06 data collection, the EAP, Fall Staff, and Salaries components were merged into the Human Resources component. During the 2007–08 collection year, the Enrollment component was broken into two separate components: 12-Month Enrollment (taking place in the fall collection) and Fall Enrollment (taking place in the spring collection). In the 2011–12 IPEDS data collection year, the Student Financial Aid component was moved to the winter data collection to aid in the timing of the net price of attendance calculations displayed on the College Navigator

138 Appendix C. Data Sources
(http://nces.ed.gov/collegenavigator). In the 2012–13 IPEDS data collection year, the Human Resources component was moved from the winter data collection to the spring data collection, and in the 2013–14 data collection year, the Graduation Rates and Graduation Rates 200% components were moved from the spring data collection to the winter data collection.
Beginning in 2008–09, the first-professional degree category was combined with the doctor’s degree category. However, some degrees formerly identified as first-professional that take more than two full-time-equivalent academic years to complete, such as those in Theology (M.Div, M.H.L./Rav), are included in the Master’s degree category. Doctor’s degrees were broken out into three distinct categories: research/scholarship, professional practice, and other doctor’s degrees.
IPEDS race/ethnicity data collection also changed in 2008–09. The “Asian” race category is now separate from a “Native Hawaiian or Other Pacific Islander” category, and a new category of “Two or more races” is added.
The degree-granting institutions portion of IPEDS is a census of colleges that award associate’s or higher degrees and are eligible to participate in Title IV financial aid programs. Prior to 1993, data from technical and vocational institutions were collected through a sample survey. Beginning in 1993, all data are gathered in a census of all postsecondary institutions. Beginning in 1997, the survey was restricted to institutions participating in Title IV programs.
The classification of institutions offering college and university education changed as of 1996. Prior to 1996, institutions that had courses leading to an associate’s or higher degree or that had courses accepted for credit toward those degrees were considered higher education institutions. Higher education institutions were accredited by an agency or association that was recognized by the U.S. Department of Education or were recognized directly by the Secretary of Education. The newer standard includes institutions that award associate’s or higher degrees and that are eligible to participate in Title IV federal financial aid programs. Tables that contain any data according to this standard are titled “degree-granting” institutions. Time-series tables may contain data from both series, and they are noted accordingly. The impact of this change on data collected in 1996 was not large. Also, degrees awarded at the bachelor’s level or higher were not heavily affected. The largest impact was on private 2-year college enrollment. In contrast, most of the data on public 4-year colleges were affected to a minimal extent. The impact on enrollment in public 2-year colleges was noticeable in certain states, such as Arizona, Arkansas, Georgia, Louisiana, and Washington, but was relatively small at the national level. Overall, total enrollment for all institutions was about one-half of 1 percent higher in 1996 for degree-granting institutions than for higher education institutions.
Prior to the establishment of IPEDS in 1986, HEGIS acquired and maintained statistical data on the characteristics and operations of institutions of higher education. Implemented in 1966, HEGIS was an annual universe survey of institutions accredited at the college level by an agency recognized by the Secretary of the U.S. Department of Education. These institutions were listed in NCES’s Education Directory, Colleges and Universities.
HEGIS surveys collected information on institutional characteristics, faculty salaries, finances, enrollment, and degrees. Since these surveys, like IPEDS, were distributed to all higher education institutions, the data presented are not subject to sampling error. However, they are subject to nonsampling error, the sources of which varied with the survey instrument.
The NCES Taskforce for IPEDS Redesign recognized that there were issues related to the consistency of data definitions as well as the accuracy, reliability, and validity of other quality measures within and across surveys. The IPEDS redesign in 2000 provided institution-specific web-based data forms. While the new system shortened data processing time and provided better data consistency, it did not address the accuracy of the data provided by institutions.
Beginning in 2003–04 with the Prior Year Data Revision System, prior-year data have been available to institutions entering current data. This allows institutions to make changes to their prior-year entries either by adjusting the data or by providing missing data. These revisions allow the evaluation of the data’s accuracy by looking at the changes made.
NCES conducted a study (NCES 2005-175) of the 2002–03 data that were revised in 2003–04 to determine the accuracy of the imputations, track the institutions that submitted revised data, and analyze the revised data they submitted. When institutions made changes to their data, it was assumed that the revised data were the “true” data. The data were analyzed for the number and type of institutions making changes, the type of changes, the magnitude of the changes, and the impact on published data.
Because NCES imputes for missing data, imputation procedures were also addressed by the Redesign Taskforce. For the 2003–04 assessment, differences between revised values and values that were imputed in the original files were compared (i.e., revised value minus imputed value). These differences were then used to provide an assessment of the effectiveness of imputation procedures. The size of the differences also provides an indication of the accuracy of imputation procedures. To assess the overall impact of
Projections of Education Statistics to 2026 139
changes on aggregate IPEDS estimates, published tables for each component were reconstructed using the revised 2002–03 data. These reconstructed tables were then compared to the published tables to determine the magnitude of aggregate bias and the direction of this bias.
Since fall 2000 and spring 2001, IPEDS data collections have been web-based. Data have been provided by “keyholders,” institutional representatives appointed by campus chief executives, who are responsible for ensuring that survey data submitted by the institution are correct and complete. Because Title IV institutions are the primary focus of IPEDS and because these institutions are required to respond to IPEDS, response rates for Title IV institutions have been high (data on specific components are cited below). More details on the accuracy and reliability of IPEDS data can be found in the Integrated Postsecondary Education Data System Data Quality Study (NCES 2005-175).
Further information on IPEDS may be obtained from
Richard ReevesAdministrative Data DivisionPostsecondary Branch National Center for Education Statistics550 12th Street SWWashington, DC [email protected]://nces.ed.gov/ipeds
Fall (12-Month Enrollment) The 12-month period during which data are collected is July 1 through June 30. Data are collected by race/ethnicity, gender, and level of study (undergraduate or postbaccalaureate) and include unduplicated headcounts and instructional activity (contact or credit hours). These data are also used to calculate a full-time-equivalent (FTE) enrollment based on instructional activity. FTE enrollment is useful for gauging the size of the educational enterprise at the institution. Prior to the 2007–08 IPEDS data collection, the data collected in the 12-Month Enrollment component were part of the Fall Enrollment component, which is conducted during the spring data collection period. However, to improve the timeliness of the data, a separate 12-Month Enrollment survey component was developed in 2007. These data are now collected in the fall for the previous academic year. The response rate for the 12-Month Enrollment component of the fall 2015 data collection was nearly 100 percent. Data from only 1 of 7,169 Title IV institutions that were expected to respond to this component contained item nonresponse, and these missing items were imputed.
Further information on the IPEDS 12-Month Enrollment component may be obtained from
Bao LeAdministrative Data DivisionPostsecondary BranchNational Center for Education Statistics550 12th Street SWWashington, DC [email protected]://nces.ed.gov/ipeds
Fall (Completions) This survey was part of the HEGIS series throughout its existence. However, the degree classification taxonomy was revised in 1970–71, 1982–83, 1991–92, 2002–03, and 2009–10. Collection of degree data has been maintained through IPEDS.
Degrees-conferred trend tables arranged by the 2009–10 classification are included in the Projections of Education Statistics to provide consistent data from 1970–71 through the most recent year. Data on associate’s degrees, by field of study, cannot be made comparable with figures from years prior to 1982–83. The nonresponse rate does not appear to be a significant source of nonsampling error for this survey. The response rate over the years has been high; for the fall 2015 Completions component, it rounded to 100 percent. Because of the high response rate, there was no need to conduct a nonresponse bias analysis. Imputation methods for the fall 2015 Completions component are discussed in the 2015–16 Integrated Postsecondary Education Data System (IPEDS) Methodology Report (NCES 2016-111).
140 Appendix C. Data Sources
The Integrated Postsecondary Education Data System Data Quality Study (NCES 2005-175) indicated that most Title IV institutions supplying revised data on completions in 2003–04 were able to supply missing data for the prior year. The small differences between imputed data for the prior year and the revised actual data supplied by the institution indicated that the imputed values produced by NCES were acceptable.
Further information on the IPEDS Completions component may be obtained from
Imani StutelyAdministrative Data DivisionPostsecondary BranchNational Center for Education Statistics550 12th Street SWWashington, DC 20202 [email protected]://nces.ed.gov/ipeds
Spring (Fall Enrollment)This survey has been part of the HEGIS and IPEDS series since 1966. Response rates have been relatively high, generally exceeding 85 percent. Beginning in 2000, with web-based data collection, higher response rates were attained. In the spring 2016 data collection, the Fall Enrollment component covered fall 2015. Of the 7,146 institutions that were expected to respond, 7,134 responded, for a response rate that rounded to 100 percent. Data collection procedures for the Fall Enrollment component of the spring 2016 data collection are presented in Enrollment and Employees in Postsecondary Institutions, Fall 2015; and Financial Statistics and Academic Libraries, Fiscal Year 2015: First Look (Provisional Data) (NCES 2017-024).
Beginning with the fall 1986 survey and the introduction of IPEDS (see above), the survey was redesigned. The survey allows (in alternating years) for the collection of age and residence data. Beginning in 2000, the survey collected instructional activity and unduplicated headcount data, which are needed to compute a standardized, full-time-equivalent (FTE) enrollment statistic for the entire academic year. As of 2007–08, the timeliness of the instructional activity data has been improved by collecting these data in the fall as part of the 12-Month Enrollment component instead of in the spring as part of the Fall Enrollment component.
The Integrated Postsecondary Education Data System Data Quality Study (NCES 2005-175) showed that public institutions made the majority of changes to enrollment data during the 2004 revision period. The majority of changes were made to unduplicated headcount data, with the net differences between the original data and the revised data at about 1 percent. Part-time students in general and enrollment in private not-for-profit institutions were often underestimated. The fewest changes by institutions were to Classification of Instructional Programs (CIP) code data. (The CIP is a taxonomic coding scheme that contains titles and descriptions of primarily postsecondary instructional programs.)
Further information on the IPEDS Fall Enrollment component may be obtained from
Bao LeAdministrative Data DivisionPostsecondary BranchNational Center for Education Statistics550 12th Street SWWashington, DC [email protected]://nces.ed.gov/ipeds
Private School Universe SurveyThe purposes of the Private School Universe Survey (PSS) data collection activities are (1) to build an accurate and complete list of private schools to serve as a sampling frame for NCES sample surveys of private schools and (2) to report data on the total number of private schools, teachers, and students in the survey universe. Begun in 1989, the PSS has been conducted every 2 years, and data for the 1989–90, 1991–92, 1993–94, 1995–96, 1997–98, 1999–2000, 2001–02, 2003–04, 2005–06, 2007–08, 2009–10, 2011–12, and 2013–14 school years have been released. A First Look report on the 2013–14 PSS data, Characteristics of Private Schools in the United States: Results From the 2013–14 Private School Universe Survey (NCES 2016-243) was published in November 2016.

Projections of Education Statistics to 2026 141
The PSS produces data similar to that of the Common Core of Data for public schools, and can be used for public-private comparisons. The data are useful for a variety of policy- and research-relevant issues, such as the growth of religiously affiliated schools, the number of private high school graduates, the length of the school year for various private schools, and the number of private school students and teachers.
The target population for this universe survey is all private schools in the United States that meet the PSS criteria of a private school (i.e., the private school is an institution that provides instruction for any of grades K through 12, has one or more teachers to give instruction, is not administered by a public agency, and is not operated in a private home).
The survey universe is composed of schools identified from a variety of sources. The main source is a list frame initially developed for the 1989–90 PSS. The list is updated regularly by matching it with lists provided by nationwide private school associations, state departments of education, and other national guides and sources that list private schools. The other source is an area frame search in approximately 124 geographic areas, conducted by the U.S. Census Bureau.
Of the 40,302 schools included in the 2009–10 sample, 10,229 were found ineligible for the survey. Those not responding numbered 1,856, and those responding numbered 28,217. The unweighted response rate for the 2009–10 PSS survey was 93.8 percent.
Of the 39,325 schools included in the 2011–12 sample, 10,030 cases were considered as out-of-scope (not eligible for the PSS). A total of 26,983 private schools completed a PSS interview (15.8 percent completed online), while 2,312 schools refused to participate, resulting in an unweighted response rate of 92.1 percent.
Of the 40,298 schools included in the 2013–14 PSS, 10,659 cases were considered as out-of-scope (not eligible for the PSS). A total of 24,566 private schools completed a PSS interview (34.1 percent completed online), while 5,073 schools refused to participate resulting in an unweighted response rate of 82.9 percent.
Further information on the PSS may be obtained from
Steve BroughmanSample Surveys DivisionCross-Sectional Surveys BranchNational Center for Education Statistics550 12th Street SWWashington, DC [email protected]://nces.ed.gov/surveys/pss
Schools and Staffing SurveyThe Schools and Staffing Survey (SASS) is a set of related questionnaires that collect descriptive data on the context of public and private elementary and secondary education. Data reported by districts, schools, principals, and teachers provide a variety of statistics on the condition of education in the United States that may be used by policymakers and the general public. The SASS system covers a wide range of topics, including teacher demand, teacher and principal characteristics, teachers’ and principals’ perceptions of school climate and problems in their schools, teacher and principal compensation, district hiring and retention practices, general conditions in schools, and basic characteristics of the student population.
SASS data are collected through a mail questionnaire with telephone and in-person field follow-up. SASS has been conducted by the Census Bureau for NCES since the first administration of the survey, which was conducted during the 1987–88 school year. Subsequent SASS administrations were conducted in 1990–91, 1993–94, 1999–2000, 2003–04, 2007–08, and 2011–12.
SASS is designed to produce national, regional, and state estimates for public elementary and secondary schools, school districts, principals, teachers, and school library media centers and national and regional estimates for public charter schools, as well as principals, teachers, and school library media centers within these schools. For private schools, the sample supports national, regional, and affiliation estimates for schools, principals, and teachers.
From its inception, SASS has had four core components: school questionnaires, teacher questionnaires, principal questionnaires, and school district (prior to 1999–2000, “teacher demand and shortage”) questionnaires. A fifth component, school library media center questionnaires, was introduced in the 1993–94 administration and has been included in every subsequent administration of SASS. School library data were also collected in the 1990–91 administration of the survey through the school and principal questionnaires.

142 Appendix C. Data Sources
School questionnaires used in SASS include the Public and Private School Questionnaires; teacher questionnaires include the Public and Private School Teacher Questionnaires; principal questionnaires include the Public and Private School Principal (or School Administrator) Questionnaires; and school district questionnaires include the School District (or Teacher Demand and Shortage) Questionnaires.
Although the four core questionnaires and the school library media questionnaires have remained relatively stable over the various administrations of SASS, the survey has changed to accommodate emerging issues in elementary and secondary education. Some questionnaire items have been added, some have been deleted, and some have been reworded.
During the 1990–91 SASS cycle, NCES worked with the Office of Indian Education to add an Indian School Questionnaire to SASS, and it remained a part of SASS through 2007–08. The Indian School Questionnaire explores the same school-level issues that the Public and Private School Questionnaires explore, allowing comparisons among the three types of schools. The 1990–91, 1993–94, 1999–2000, 2003–04, and 2007–08 administrations of SASS obtained data on Bureau of Indian Education (BIE) schools (schools funded or operated by the BIE), but the 2011–12 administration did not obtain BIE data. SASS estimates for all survey years presented in this report exclude BIE schools, and as a result, estimates in this report may differ from those in previously published reports.
The SASS teacher surveys collect information on the characteristics of teachers, such as their age, race/ethnicity, years of teaching experience, average number of hours per week spent on teaching activities, base salary, average class size, and highest degree earned. These teacher-reported data may be combined with related information on their school’s characteristics, such as school type (e.g., public traditional, public charter, Catholic, private other religious, and private nonsectarian), community type, and school enrollment size. The teacher questionnaires also ask for information on teacher opinions regarding the school and teaching environment. In 1993–94, about 53,000 public school teachers and 10,400 private school teachers were sampled. In 1999–2000, about 56,300 public school teachers, 4,400 public charter school teachers, and 10,800 private school teachers were sampled. In 2003–04, about 52,500 public school teachers and 10,000 private school teachers were sampled. In 2007–08, about 48,400 public school teachers and 8,200 private school teachers were sampled. In 2011–12, about 51,100 public school teachers and 7,100 private school teachers were sampled. Weighted overall response rates in 2011–12 were 61.8 percent for public school teachers and 50.1 percent for private school teachers.
The SASS 2011–12 sample of schools was confined to the 50 states and the District of Columbia and excludes the other jurisdictions, the Department of Defense overseas schools, the BIE schools, and schools that do not offer teacher-provided classroom instruction in grades 1–12 or the ungraded equivalent. The SASS 2011–12 sample included 10,250 traditional public schools, 750 public charter schools, and 3,000 private schools.
The public school sample for the 2011–12 SASS was based on an adjusted public school universe file from the 2009–10 Common Core of Data, a database of all the nation’s public school districts and public schools. The private school sample for the 2011–12 SASS was selected from the 2009–10 Private School Universe Survey (PSS), as updated for the 2011–12 PSS. This update collected membership lists from private school associations and religious denominations, as well as private school lists from state education departments. The 2011–12 SASS private school frame was further augmented by the inclusion of additional schools that were identified through the 2009–10 PSS area frame data collection.
The NCES data product 2011–12 Schools and Staffing Survey (SASS) Restricted-Use Data Files (NCES 2014-356) is available. (Information on how to obtain a restricted-use data license is located at http://nces.ed.gov/pubsearch/licenses.asp.) This DVD contains eight files (Public School District, Public School Principal, Public School, Public School Teacher, Public School Library Media Center, Private School Principal, Private School, and Private School Teacher) in multiple formats. It also contains a six-volume User’s Manual, which includes a codebook for each file.
Further information on SASS may be obtained from
Amy Ho Sample Surveys Division Cross-Sectional Surveys Branch National Center for Education Statistics550 12th Street SWWashington, DC [email protected]://nces.ed.gov/surveys/sass

Projections of Education Statistics to 2026 143
Teacher Follow-Up Survey The Teacher Follow-up Survey (TFS) is a follow-up survey of selected elementary and secondary school teachers who participate in the NCES Schools and Staffing Survey (SASS). Its purpose is to determine how many teachers remain at the same school, move to another school, or leave the profession in the year following a SASS administration. It is administered to elementary and secondary teachers in the 50 states and the District of Columbia. The TFS uses two questionnaires, one for teachers who left teaching since the previous SASS administration and another for those who are still teaching either in the same school as last year or in a different school. The objective of the TFS is to focus on the characteristics of each group in order to answer questions about teacher mobility and attrition.
The 2008–09 TFS is different from any previous TFS administration in that it also serves as the second wave of a longitudinal study of first-year teachers. Because of this, the 2008–09 TFS consists of four questionnaires. Two are for respondents who were first-year public school teachers in the 2007–08 SASS and two are for the remainder of the sample.
The 2012–13 TFS sample was made up of teachers who had taken the 2011–12 SASS survey. The 2012–13 TFS sample contained about 5,800 public school teachers and 1,200 private school teachers. The weighted overall response rate using the initial basic weight for private school teachers was notably low (39.7 percent), resulting in a decision to exclude private school teachers from the 2012–13 TFS data files. The weighted overall response rate for public school teachers was 49.9 percent (50.3 percent for current and 45.6 percent for former teachers). Further information about the 2012–13 TFS, including the analysis of unit nonresponse bias, is available in the First Look report Teacher Attrition and Mobility: Results From the 2012–13 Teacher Follow-up Survey (NCES 2014-077).
Further information on the TFS may be obtained from
Isaiah O’RearSample Surveys Division Cross-Sectional Surveys Branch National Center for Education Statistics550 12th Street SWWashington, DC [email protected]://nces.ed.gov/surveys/sass
Bureau of Economic AnalysisNational Income and Product AccountsThe National Income and Product Accounts (NIPAs), produced by the Bureau of Economic Analysis, are a set of economic accounts that provide information on the value and composition of output produced in the United States during a given period. NIPAs present measures of economic activity in the United States, including production, income distribution, and personal savings. NIPAs also include data on employee compensation and wages. These estimations were first calculated in the early 1930s to help the government design economic policies to combat the Great Depression. Most of the NIPA series are published quarterly, with annual reviews of estimates from the three most recent years conducted in the summer.
Revisions to the NIPAs have been made over the years to create a more comprehensive economic picture of the United States. For example, in 1976, consumption of fixed capital (CFC) estimates shifted to a current-cost basis. In 1991, NIPAs began to use gross domestic product (GDP) instead of gross national product (GNP) as the primary measure of U.S. production. (At that time, virtually all other countries were already using GDP as their primary measure of production.) In the 2003 comprehensive revision, a more complete and accurate measure of insurance services was adopted. The incorporation of a new classification system for personal consumption expenditures (PCE) was among the changes contained in the 2009 comprehensive revision. The comprehensive revision of 2013 included the treatment of research and development expenditures by business, government, and nonprofit institutions serving households as fixed investment. As was the case in previous years, the most recent revisions, made in 2015, were the result of the incorporation of newly available and revised source data and the adoption of improved estimating methods.
NIPAs are slowly being integrated with other federal account systems, such as the federal account system of the Bureau of Labor Statistics.

144 Appendix C. Data Sources
Further information on NIPAs may be obtained from
U.S. Department of CommerceBureau of Economic Analysiswww.bea.gov
Bureau of Labor StatisticsConsumer Price Indexes The Consumer Price Index (CPI) represents changes in prices of all goods and services purchased for consumption by urban households. Indexes are available for two population groups: a CPI for All Urban Consumers (CPI-U) and a CPI for Urban Wage Earners and Clerical Workers (CPI-W). Unless otherwise specified, data are adjusted for inflation using the CPI-U. These values are generally adjusted to a school-year basis by averaging the July through June figures. Price indexes are available for the United States, the four Census regions, size of city, cross-classifications of regions and size classes, and 26 local areas. The major uses of the CPI include as an economic indicator, as a deflator of other economic series, and as a means of adjusting income.
Also available is the Consumer Price Index research series using current methods (CPI-U-RS), which presents an estimate of the CPI-U from 1978 to the present that incorporates most of the improvements that the Bureau of Labor Statistics has made over that time span into the entire series. The historical price index series of the CPI-U does not reflect these changes, though these changes do make the present and future CPI more accurate. The limitations of the CPI-U-RS include considerable uncertainty surrounding the magnitude of the adjustments and the several improvements in the CPI that have not been incorporated into the CPI-U-RS for various reasons. Nonetheless, the CPI-U-RS can serve as a valuable proxy for researchers needing a historical estimate of inflation using current methods. This series has not been used in this report.
Further information on consumer price indexes may be obtained from Bureau of Labor Statistics
U.S. Department of Labor2 Massachusetts Avenue NEWashington, DC 20212http://www.bls.gov/cpi
Employment and Unemployment SurveysStatistics on the employment and unemployment status of the population and related data are compiled by the Bureau of Labor Statistics (BLS) using data from the Current Population Survey (CPS) (see below) and other surveys. The CPS, a monthly household survey conducted by the U.S. Census Bureau for the Bureau of Labor Statistics, provides a comprehensive body of information on the employment and unemployment experience of the nation’s population, classified by age, sex, race, and various other characteristics.
Further information on unemployment surveys may be obtained from
Bureau of Labor StatisticsU.S. Department of Labor2 Massachusetts Avenue NEWashington, DC [email protected]://www.bls.gov/bls/employment.htm
Census BureauCurrent Population Survey The Current Population Survey (CPS) is a monthly survey of about 60,000 households conducted by the U.S. Census Bureau for the Bureau of Labor Statistics. The CPS is the primary source of information of labor force statistics for the U.S. noninstitutionalized population (e.g., it excludes military personnel and their families living on bases and inmates of correctional institutions). In addition, supplemental questionnaires are used to provide further information about the U.S. population. Specifically, in October, detailed questions regarding school enrollment and school characteristics are asked. In March, detailed questions regarding income are asked.

Projections of Education Statistics to 2026 145
The current sample design, introduced in July 2001, includes about 72,000 households. Each month about 58,900 of the 72,000 households are eligible for interview, and of those, 7 to 10 percent are not interviewed because of temporary absence or unavailability. Information is obtained each month from those in the household who are 15 years of age and older, and demographic data are collected for children 0–14 years of age. In addition, supplemental questions regarding school enrollment are asked about eligible household members ages 3 and older in the October survey. Prior to July 2001, data were collected in the CPS from about 50,000 dwelling units. The samples are initially selected based on the decennial census files and are periodically updated to reflect new housing construction.
A major redesign of the CPS was implemented in January 1994 to improve the quality of the data collected. Survey questions were revised, new questions were added, and computer-assisted interviewing methods were used for the survey data collection. Further information about the redesign is available in Current Population Survey, October 1995: (School Enrollment Supplement) Technical Documentation at http://www.census.gov/prod/techdoc/cps/cpsoct95.pdf.
Caution should be used when comparing data from 1994 through 2001 with data from 1993 and earlier. Data from 1994 through 2001 reflect 1990 census-based population controls, while data from 1993 and earlier reflect 1980 or earlier census-based population controls. Changes in population controls generally have relatively little impact on summary measures such as means, medians, and percentage distributions. They can have a significant impact on population counts. For example, use of the 1990 census-based population controls resulted in about a 1 percent increase in the civilian noninstitutional population and in the number of families and households. Thus, estimates of levels for data collected in 1994 and later years will differ from those for earlier years by more than what could be attributed to actual changes in the population. These differences could be disproportionately greater for certain subpopulation groups than for the total population.
Beginning in 2003, race/ethnicity questions expanded to include information on people of two or more races. Native Hawaiian/Pacific Islander data are collected separately from Asian data. The questions have also been worded to make it clear that self-reported data on race/ethnicity should reflect the race/ethnicity with which the responder identifies, rather than what may be written in official documentation.
The estimation procedure employed for monthly CPS data involves inflating weighted sample results to independent estimates of characteristics of the civilian noninstitutional population in the United States by age, sex, and race. These independent estimates are based on statistics from decennial censuses; statistics on births, deaths, immigration, and emigration; and statistics on the population in the armed services. Generalized standard error tables are provided in the Current Population Reports; methods for deriving standard errors can be found within the CPS technical documentation at http://www.census.gov/programs-surveys/cps/technical-documentation/complete.html. The CPS data are subject to both nonsampling and sampling errors.
Prior to 2009, standard errors were estimated using the generalized variance function. The generalized variance function is a simple model that expresses the variance as a function of the expected value of a survey estimate. Beginning with March 2009 CPS data, standard errors were estimated using replicate weight methodology. Those interested in using CPS household-level supplement replicate weights to calculate variances may refer to Estimating Current Population Survey (CPS) Household-Level Supplement Variances Using Replicate Weights at http://thedataweb.rm.census.gov/pub/cps/supps/HH-level_Use_of_the_Public_Use_Replicate_Weight_File.doc.
Further information on CPS may be obtained from
Education and Social Stratification BranchPopulation DivisionCensus BureauU.S. Department of Commerce4600 Silver Hill RoadWashington, DC 20233http://www.census.gov/cps
DropoutsEach October, the Current Population Survey (CPS) includes supplemental questions on the enrollment status of the population ages 3 years and over as part of the monthly basic survey on labor force participation. In addition to gathering the information on school enrollment, with the limitations on accuracy as noted below under “School Enrollment,” the survey data permit calculations of dropout rates. Both status and event dropout rates are tabulated from the October CPS. Event rates describe the proportion of students who leave school each year without completing a high school program. Status rates provide cumulative data on dropouts among all young adults within a specified age range. Status rates are higher than event rates because they include all dropouts ages 16 through 24, regardless of when they last attended school.

146 Appendix C. Data Sources
In addition to other survey limitations, dropout rates may be affected by survey coverage and exclusion of the institutionalized population. The incarcerated population has grown more rapidly and has a higher dropout rate than the general population. Dropout rates for the total population might be higher than those for the noninstitutionalized population if the prison and jail populations were included in the dropout rate calculations. On the other hand, if military personnel, who tend to be high school graduates, were included, it might offset some or all of the impact from the theoretical inclusion of the jail and prison populations.
Another area of concern with tabulations involving young people in household surveys is the relatively low coverage ratio compared to older age groups. CPS undercoverage results from missed housing units and missed people within sample households. Overall CPS undercoverage for October 2015 is estimated to be about 11 percent. CPS coverage varies with age, sex, and race. Generally, coverage is larger for females than for males and larger for non-Blacks than for Blacks. This differential coverage is a general problem for most household-based surveys. Further information on CPS methodology may be found in the technical documentation at http://www.census.gov/cps.
Further information on the calculation of dropouts and dropout rates may be obtained from Trends in High School Dropout and Completion Rates in the United States: 2013 (NCES 2016-117) at http://nces.ed.gov/pubs2016/2016117rev.pdf or by contacting
Joel McFarlandAnnual Reports and Information Staff National Center for Education Statistics550 12th Street SWWashington, DC [email protected]
School Enrollment Each October, the Current Population Survey (CPS) includes supplemental questions on the enrollment status of the population ages 3 years and over. Prior to 2001, the October supplement consisted of approximately 47,000 interviewed households. Beginning with the October 2001 supplement, the sample was expanded by 9,000 to a total of approximately 56,000 interviewed households. The main sources of nonsampling variability in the responses to the supplement are those inherent in the survey instrument. The question of current enrollment may not be answered accurately for various reasons. Some respondents may not know current grade information for every student in the household, a problem especially prevalent for households with members in college or in nursery school. Confusion over college credits or hours taken by a student may make it difficult to determine the year in which the student is enrolled. Problems may occur with the definition of nursery school (a group or class organized to provide educational experiences for children) where respondents’ interpretations of “educational experiences” vary.
For the October 2015 basic CPS, the household-level nonresponse rate was 12.9 percent. The person-level nonresponse rate for the school enrollment supplement was an additional 8.9 percent. Since the basic CPS nonresponse rate is a household-level rate and the school enrollment supplement nonresponse rate is a person-level rate, these rates cannot be combined to derive an overall nonresponse rate. Nonresponding households may have fewer persons than interviewed ones, so combining these rates may lead to an overestimate of the true overall nonresponse rate for persons for the school enrollment supplement.
Further information on CPS methodology may be obtained from http://www.census.gov/cps.
Further information on the CPS School Enrollment Supplement may be obtained from
Education and Social Stratification BranchCensus BureauU.S. Department of Commerce4600 Silver Hill RoadWashington, DC 20233http://www.census.gov/topics/education/school-enrollment.html

Projections of Education Statistics to 2026 147
Decennial Census, Population Estimates, and Population ProjectionsThe Decennial Census is a universe survey mandated by the U.S. Constitution. It is a questionnaire sent to every household in the country, and it is composed of seven questions about the household and its members (name, sex, age, relationship, Hispanic origin, race, and whether the housing unit is owned or rented). The Census Bureau also produces annual estimates of the resident population by demographic characteristics (age, sex, race, and Hispanic origin) for the nation, states, and counties, as well as national and state projections for the resident population. The reference date for population estimates is July 1 of the given year. With each new issue of July 1 estimates, the Census Bureau revises estimates for each year back to the last census. Previously published estimates are superseded and archived.
Further information on the Decennial Census may be obtained from http://www.census.gov.
National Population Projections The 2014 National Population Projections, the first based on the 2010 Census, provide projections of resident population and projections of the United States resident population by age, sex, race, and Hispanic origin from 2014 through 2060. The following is a general description of the methods used to produce the 2014 National Population Projections.
The projections were produced using a cohort component method beginning with an estimated base population for July 1, 2013. First, components of population change (mortality, fertility, and net international migration) were projected. Next, for each passing year, the population is advanced one year of age and the new age categories are updated using the projected survival rates and levels of net international migration for that year. A new birth cohort is then added to form the population under one year of age by applying projected age specific fertility rates to the average female population aged 10 to 54 years and updating the new cohort for the effects of mortality and net international migration.
The assumptions for the components of change were based on time series analysis. Initially, demographic models were used to summarize historical trends. Further information on the methodologies used to produce the 2014 National Population Projections may be obtained from https://www.census.gov/programs-surveys/popproj.html.
State Population Projections These state population projections were prepared using a cohort-component method by which each component of population change—births, deaths, state-to-state migration flows, international in-migration, and international out-migration—was projected separately for each birth cohort by sex, race, and Hispanic origin. The basic framework was the same as in past Census Bureau projections.
Detailed components necessary to create the projections were obtained from vital statistics, administrative records, census data, and national projections. The cohort-component method is based on the traditional demographic accounting system:
P1 = P0 + B ― D + DIM ― DOM + IIM ― IOM
where:
P1 = population at the end of the periodP0 = population at the beginning of the periodB = births during the periodD = deaths during the periodDIM = domestic in-migration during the periodDOM = domestic out-migration during the periodIIM = international in-migration during the periodIOM = international out-migration during the period
To generate population projections with this model, the Census Bureau created separate datasets for each of these components. In general, the assumptions concerning the future levels of fertility, mortality, and international migration are consistent with the assumptions developed for the national population projections of the Census Bureau.

148 Appendix C. Data Sources
Once the data for each component were developed the cohort-component method was applied to produce the projections. For each projection year, the base population for each state was disaggregated into eight race and Hispanic categories (non-Hispanic White; non-Hispanic Black; non-Hispanic American Indian, Eskimo, and Aleut; non-Hispanic Asian and Pacific Islander; Hispanic White; Hispanic Black; Hispanic American Indian, Eskimo, and Aleut; and Hispanic Asian and Pacific Islander), by sex, and single year of age (ages 0 to 85+). The next step was to survive each age-sex-race-ethnic group forward 1 year using the pertinent survival rate. The internal redistribution of the population was accomplished by applying the appropriate state-to-state migration rates to the survived population in each state. The projected out-migrants were subtracted from the state of origin and added to the state of destination (as in-migrants). Next, the appropriate number of immigrants from abroad was added to each group. The population under age 1 was created by applying the appropriate age-race-ethnic specific birth rates to females of childbearing age (ages 15 to 49). The number of births by sex and race/ethnicity were survived forward and exposed to the appropriate migration rate to yield the population under age 1. The final results of the projection process were proportionally adjusted to be consistent with the national population projections by single years of age, sex, race, and Hispanic origin. The entire process was then repeated for each year of the projection.
More information on Census Bureau projections may be obtained from
Population Division Census Bureau U.S. Department of Commerce Washington, DC 20233 http://www.census.gov
OTHER SOURCESIHS Global Inc.IHS Global Inc. provides an information system that includes databases of economic and financial information; simulation and planning models; regular publications and special studies; data retrieval and management systems; and access to experts on economic, financial, industrial, and market activities. One service is the IHS Global Inc. Model of the U.S. Economy, which contains annual projections of U.S. economic and financial conditions, including forecasts for the federal government, incomes, population, prices and wages, and state and local governments, over a long-term (10- to 25-year) forecast period.
Additional information is available from
IHS Global Inc. 15 Inverness Way East Englewood, CO 80112 http://www.ihsglobalinsight.com
Projections of Education Statistics to 2026 149
Appendix DReferences
Broughman, S.P., and Swaim, N.L. (2016). Characteristics of Private Schools in the United States: Results From the 2013–14 Private School Universe Survey (NCES 2016-243). U.S. Department of Education. Washington, DC: National Center for Education Statistics.
Gamkhar, S., and Oates, W. (1996). Asymmetries in the Response to Increases and Decreases in Intergovernmental Grants: Some Empirical Findings. National Tax Journal, 49(4): 501–512.
Ginder, S.A., Kelly-Reid, J.E., and Mann, F.B. (2016a). 2015–16 Integrated Postsecondary Education Data System (IPEDS) Methodology Report (NCES 2016-111). U.S. Department of Education. Washington, DC: National Center for Education Statistics.
Ginder, S.A., Kelly-Reid, J.E., and Mann, F.B. (2016b). Enrollment and Employees in Postsecondary Institutions, Fall 2015; and Financial Statistics and Academic Libraries, Fiscal Year 2015: First Look (Provisional Data) (NCES 2017-024). U.S. Department of Education. Washington, DC: National Center for Education Statistics.
Goldring, R., Taie, S., and Riddles, M. (2014). Teacher Attrition and Mobility: Results From the 2012–13 Teacher Follow-up Survey (NCES 2014-077). U.S. Department of Education. Washington, DC: National Center for Education Statistics.
Greene, W. (2000). Econometric Analysis. 4th Edition. New Jersey: Prentice-Hall.
Hussar, W.J. (1999). Predicting the Need for Newly Hired Teachers in the United States to 2008–09 (NCES 99-026). U.S. Department of Education. Washington, DC: National Center for Education Statistics.
Inman, R.P. (1979). The Fiscal Performance of Local Governments: An Interpretive Review. In P. Mieszkowski and M. Straszheim (Eds.), Current Issues in Urban Economics, (pp. 270–321). Baltimore: Johns Hopkins Press.
IHS Global Inc., “IHS U.S. Regional Economic Service, Population Projections, December 2015.”
IHS Global Inc., “U.S. Quarterly Macroeconomic Model, November 2016 Short-Term Baseline Projections.”
Intriligator, M.D. (1978). Econometric Models, Techniques, & Applications. New Jersey: Prentice-Hall, Inc.
Jackson, K.W., Jang, D., Sukasih, A., and Peeckson, S. (2005). Integrated Postsecondary Education Data System Data Quality Study (NCES 2005-175). U.S. Department of Education. Washington, DC: National Center for Education Statistics.
Johnston, J., and Dinardo, J. (1996). Econometric Methods. New York: McGraw-Hill.
Judge, G., Hill, W., Griffiths, R., Lutkepohl, H., and Lee, T. (1985). The Theory and Practice of Econometrics. New York: John Wiley and Sons.
McFarland, J., Stark, P., and Cui, J. (2016). Trends in High School Dropout and Completion Rates in the United States: 2013 (NCES 2016-117). U.S. Department of Education. Washington, DC: National Center for Education Statistics.
Mitias, P., and Turnbull, G. (2001). Grant Illusion, Tax Illusion, and Local Government Spending. Public Finance Review, 29(5): 347–368.
U.S. Department of Commerce, Census Bureau, 2014 National Population Projections, retrieved August 4, 2015, from https://www.census.gov/programs-surveys/popproj.html.
U.S. Department of Commerce, Census Bureau, Current Population Reports, “Social and Economic Characteristics of Students,” 2015.U.S. Department of Commerce, Census Bureau, Current Population Survey (CPS), October, selected years, 1970 through 2014. U.S. Department of Commerce, Census Bureau, Population Estimates, retrieved September 21, 2016, from https://www2.census.gov/programs-surveys/popest/datasets/2010-2015/.

This page intentionally left blank.

Projections of Education Statistics to 2026 151
Appendix EList of Abbreviations
ADA Average daily attendance
CCD Common Core of Data
CPI Consumer Price Index
CPS Current Population Survey
CV Coefficient of Variation
D.W. statistic Durbin-Watson statistic
FTE Full-time-equivalent
HEGIS Higher Education General Information Survey
IPEDS Integrated Postsecondary Education Data System
IPEDS-C Integrated Postsecondary Education Data System, Completions Survey
IPEDS-EF Integrated Postsecondary Education Data System, Fall Enrollment Survey
MAPE Mean absolute percentage error
NCES National Center for Education Statistics
PreK Prekindergarten
PreK–8 Prekindergarten through grade 8
PreK–12 Prekindergarten through grade 12
PSS Private School Survey
SASS Schools and Staffing Survey

This page intentionally left blank.

Projections of Education Statistics to 2026 153
Appendix FGlossary
AAlternative school A public elementary/secondary school that serves students whose needs cannot be met in a regular, special education, or vocational school; may provide nontraditional education; and may serve as an adjunct to a regular school. Although alternative schools fall outside the categories of regular, special education, and vocational education, they may provide similar services or curriculum. Some examples of alternative schools are schools for potential dropouts; residential treatment centers for substance abuse (if they provide elementary or secondary education); schools for chronic truants; and schools for students with behavioral problems.
Associate’s degree A degree granted for the successful completion of a sub-baccalaureate program of studies, usually requiring at least 2 years (or equivalent) of full-time college-level study. This includes degrees granted in a cooperative or work-study program.
Autocorrelation Correlation of the error terms from different observations of the same variable. Also called Serial correlation.
Average daily attendance (ADA) The aggregate attendance of a school during a reporting period (normally a school year) divided by the number of days school is in session during this period. Only days on which the pupils are under the guidance and direction of teachers should be considered days in session.
Average daily membership (ADM) The aggregate membership of a school during a reporting period (normally a school year) divided by the number of days school is in session during this period. Only days on which the pupils are under the guidance and direction of teachers should be considered as days in session. The average daily membership for groups of schools having varying lengths of terms is the average of the average daily memberships obtained for the individual schools. Membership includes all pupils who are enrolled, even if they do not actually attend.
BBachelor’s degree A degree granted for the successful completion of a baccalaureate program of studies, usually requiring at least 4 years (or equivalent) of full-time college-level study. This includes degrees granted in a cooperative or work-study program.
Breusch-Godfrey serial correlation LM test A statistic testing the independence of errors in least-squares regression against alternatives of first-order and higher degrees of serial correlation. The test belongs to a class of asymptotic tests known as the Lagrange multiplier (LM) tests.
CCapital outlay Funds for the acquisition of land and buildings; building construction, remodeling, and additions; the initial installation or extension of service systems and other built-in equipment; and site improvement. The category also encompasses architectural and engineering services including the development of blueprints.
Certificate A formal award certifying the satisfactory completion of a postsecondary education program. Certificates can be awarded at any level of postsecondary education and include awards below the associate’s degree level.
Classroom teacher A staff member assigned the professional activities of instructing pupils in self-contained classes or courses, or in classroom situations; usually expressed in full-time equivalents.
Coefficient of variation (CV) Represents the ratio of the standard error to the estimate. For example, a CV of 30 percent indicates that the standard error of the estimate is equal to 30 percent of the estimate’s value. The CV is used to compare the amount of variation relative to the magnitude of the estimate. A CV of 30 percent or greater indicates that an estimate should be interpreted with caution. For a discussion of standard errors, see Appendix A: Guide to Sources.
Cohort A group of individuals that have a statistical factor in common, for example, year of birth.
Cohort-component method A method for estimating and projecting a population that is distinguished by its ability to preserve knowledge of an age distribution of a population (which may be of a single sex, race, and Hispanic origin) over time.
College A postsecondary school that offers general or liberal arts education, usually leading to an associate’s, bachelor’s, master’s, or doctor’s degree. Junior colleges and community colleges are included under this terminology.
Constant dollars Dollar amounts that have been adjusted by means of price and cost indexes to eliminate inflationary factors and allow direct comparison across years.

154 Appendix F. Glossary
Consumer Price Index (CPI) This price index measures the average change in the cost of a fixed market basket of goods and services purchased by consumers. Indexes vary for specific areas or regions, periods of time, major groups of consumer expenditures, and population groups. The CPI reflects spending patterns for two population groups: (1) all urban consumers and urban wage earners and (2) clerical workers. CPIs are calculated for both the calendar year and the school year using the U.S. All Items CPI for All Urban Consumers (CPI-U). The calendar year CPI is the same as the annual CPI-U. The school year CPI is calculated by adding the monthly CPI-U figures, beginning with July of the first year and ending with June of the following year, and then dividing that figure by 12.
Control of institutions A classification of institutions of elementary/secondary or postsecondary education by whether the institution is operated by publicly elected or appointed officials and derives its primary support from public funds (public control) or is operated by privately elected or appointed officials and derives its major source of funds from private sources (private control).
Current dollars Dollar amounts that have not been adjusted to compensate for inflation.
Current expenditures (elementary/secondary) The expenditures for operating local public schools, excluding capital outlay and interest on school debt. These expenditures include such items as salaries for school personnel, benefits, student transportation, school books and materials, and energy costs. Beginning in 1980–81, expenditures for state administration are excluded.
Instruction expenditures Includes expenditures for activities related to the interaction between teacher and students. Includes salaries and benefits for teachers and instructional aides, textbooks, supplies, and purchased services such as instruction via television. Also included are tuition expenditures to other local education agencies.
Administration expenditures Includes expenditures for school administration (i.e., the office of the principal, full-time department chairpersons, and graduation expenses), general administration (the superintendent and board of education and their immediate staff), and other support services expenditures.
Transportation Includes expenditures for vehicle operation, monitoring, and vehicle servicing and maintenance.
Food services Includes all expenditures associated with providing food to students and staff in a school or school district. The services include preparing and serving regular and incidental meals or snacks in connection with school activities, as well as the delivery of food to schools.
Enterprise operations Includes expenditures for activities that are financed, at least in part, by user charges, similar to a private business. These include operations funded by sales of products or services, together with amounts for direct program support made by state education agencies for local school districts.
Current expenditures per pupil in average daily attendance Current expenditures for the regular school term divided by the average daily attendance of full-time pupils (or full-time equivalency of pupils) during the term. See also Current expenditures and Average daily attendance.
DDegree An award conferred by a college, university, or other postsecondary education institution as official recognition for the successful completion of a program of studies. Refers specifically to associate’s or higher degrees conferred by degree-granting institutions. See also Associate’s degree, Bachelor’s degree, Master’s degree, and Doctor’s degree.
Degree/certificate-seeking student A student enrolled in courses for credit and recognized by the institution as seeking a degree, certificate, or other formal award. High school students also enrolled in postsecondary courses for credit are not considered degree/certificate-seeking. See also Degree and Certificate.
Degree-granting institutions Postsecondary institutions that are eligible for Title IV federal financial aid programs and grant an associate’s or higher degree. For an institution to be eligible to participate in Title IV financial aid programs it must offer a program of at least 300 clock hours in length, have accreditation recognized by the U.S. Department of Education, have been in business for at least 2 years, and have signed a participation agreement with the Department.
Degrees of freedom The number of free or linearly independent sample observations used in the calculation of a statistic. In a time series regression with t time periods and k independent variables including a constant term, there would be t minus k degrees of freedom.
Department of Defense (DoD) dependents schools Schools that are operated by the Department of Defense Education Activity (a civilian agency of the U.S. Department of Defense) and provide comprehensive prekindergarten through 12th-grade educational programs on military installations both within the United States and overseas.
Dependent variable A mathematical variable whose value is determined by that of one or more other variables in a function. In regression analysis, when a random variable, y, is expressed as a function of variables x1, x2, ... xk, plus a stochastic term, then y is known as the “dependent variable.”

Projections of Education Statistics to 2026 155
Disposable personal income Current income received by people less their contributions for social insurance, personal tax, and nontax payments. It is the income available to people for spending and saving. Nontax payments include passport fees, fines and penalties, donations, and tuitions and fees paid to schools and hospitals operated mainly by the government. See also Personal income.
Doctor’s degree The highest award a student can earn for graduate study. Includes such degrees as the Doctor of Education (Ed.D.); the Doctor of Juridical Science (S.J.D.); the Doctor of Public Health (Dr.P.H.); and the Doctor of Philosophy (Ph.D.) in any field, such as agronomy, food technology, education, engineering, public administration, ophthalmology, or radiology. The doctor’s degree classification encompasses three main subcategories—research/scholarship degrees, professional practice degrees, and other degrees—which are described below.
Doctor’s degree—research/scholarship A Ph.D. or other doctor’s degree that requires advanced work beyond the master’s level, including the preparation and defense of a dissertation based on original research, or the planning and execution of an original project demonstrating substantial artistic or scholarly achievement. Examples of this type of degree may include the following and others, as designated by the awarding institution: the Ed.D. (in education), D.M.A. (in musical arts), D.B.A. (in business administration), D.Sc. (in science), D.A. (in arts), or D.M. (in medicine).
Doctor’s degree—professional practice A doctor’s degree that is conferred upon completion of a program providing the knowledge and skills for the recognition, credential, or license required for professional practice. The degree is awarded after a period of study such that the total time to the degree, including both preprofessional and professional preparation, equals at least 6 full-time-equivalent academic years. Some doctor’s degrees of this type were formerly classified as first-professional degrees. Examples of this type of degree may include the following and others, as designated by the awarding institution: the D.C. or D.C.M. (in chiropractic); D.D.S. or D.M.D. (in dentistry); L.L.B. or J.D. (in law); M.D. (in medicine); O.D. (in optometry); D.O. (in osteopathic medicine); Pharm.D. (in pharmacy); D.P.M., Pod.D., or D.P. (in podiatry); or D.V.M. (in veterinary medicine).
Doctor’s degree—other A doctor’s degree that does not meet the definition of either a doctor’s degree—research/scholarship or a doctor’s degree—professional practice.
Double exponential smoothing A method that takes a single smoothed average component of demand and smoothes it a second time to allow for estimation of a trend effect.
Dropout The term is used to describe both the event of leaving school before completing high school and the status of an individual who is not in school and who is not a high school completer. High school completers include both
graduates of school programs as well as those completing high school through equivalency programs such as the General Educational Development (GED) program. Transferring from a public school to a private school, for example, is not regarded as a dropout event. A person who drops out of school may later return and graduate but is called a “dropout” at the time he or she leaves school. Measures to describe these behaviors include the event dropout rate (or the closely related school persistence rate), the status dropout rate, and the high school completion rate.
Durbin-Watson statistic A statistic testing the independence of errors in least squares regression against the alternative of first-order serial correlation. The statistic is a simple linear transformation of the first-order serial correlation of residuals and, although its distribution is unknown, it is tested by bounding statistics that follow R. L. Anderson’s distribution.
EEconometrics The quantitative examination of economic trends and relationships using statistical techniques, and the development, examination, and refinement of those techniques.
Elementary school A school classified as elementary by state and local practice and composed of any span of grades not above grade 8.
Elementary/secondary school Includes only schools that are part of state and local school systems, and also most nonprofit private elementary/secondary schools, both religiously affiliated and nonsectarian. Includes regular, alternative, vocational, and special education schools. U.S. totals exclude federal schools for American Indians, and federal schools on military posts and other federal installations.
Enrollment The total number of students registered in a given school unit at a given time, generally in the fall of a year.
Estimate A numerical value obtained from a statistical sample and assigned to a population parameter. The particular value yielded by an estimator in a given set of circumstances or the rule by which such particular values are calculated.
Estimating equation An equation involving observed quantities and an unknown that serves to estimate the latter.
Estimation Estimation is concerned with inference about the numerical value of unknown population values from incomplete data, such as a sample. If a single figure is calculated for each unknown parameter, the process is called point estimation. If an interval is calculated within which the parameter is likely, in some sense, to lie, the process is called interval estimation.

156 Appendix F. Glossary
Expenditures, Total For elementary/secondary schools, these include all charges for current outlays plus capital outlays and interest on school debt. For degree-granting institutions, these include current outlays plus capital outlays. For government, these include charges net of recoveries and other correcting transactions other than for retirement of debt, investment in securities, extension of credit, or as agency transactions. Government expenditures include only external transactions, such as the provision of perquisites or other payments in kind. Aggregates for groups of governments exclude intergovernmental transactions among the governments.
Expenditures per pupil Charges incurred for a particular period of time divided by a student unit of measure, such as average daily attendance or fall enrollment.
Exponential smoothing A method used in time series analysis to smooth or to predict a series. There are various forms, but all are based on the supposition that more remote history has less importance than more recent history.
FFinancial aid Grants, loans, assistantships, scholarships, fellowships, tuition waivers, tuition discounts, veteran’s benefits, employer aid (tuition reimbursement), and other monies (other than from relatives or friends) provided to students to help them meet expenses. Except where designated, includes Title IV subsidized and unsubsidized loans made directly to students.
First-order serial correlation When errors in one time period are correlated directly with errors in the ensuing time period.
First-professional degree NCES no longer uses this classification. Most degrees formerly classified as first-professional (such as M.D., D.D.S., Pharm.D., D.V.M., and J.D.) are now classified as doctor’s degrees—professional practice. However, master’s of divinity degrees are now classified as master’s degrees.
First-time student (undergraduate) A student who has no prior postsecondary experience (except as noted below) attending any institution for the first time at the undergraduate level. Includes students enrolled in the fall term who attended college for the first time in the prior summer term, and students who entered with advanced standing (college credits earned before graduation from high school).
Fiscal year A period of 12 months for which accounting records are compiled. Institutions and states may designate their own accounting period, though most states use a July 1 through June 30 accounting year. The yearly accounting period for the federal government begins on October 1 and ends on the following September 30. The fiscal year is designated by the calendar year in which it ends; e.g., fiscal year 2006 begins on October 1, 2005, and ends on September 30, 2006. (From fiscal year 1844 to fiscal year 1976, the federal fiscal year began on July 1 and ended on the following June 30.)
Forecast An estimate of the future based on rational study and analysis of available pertinent data, as opposed to subjective prediction.
Forecasting Assessing the magnitude that a quantity will assume at some future point in time, as distinct from “estimation,” which attempts to assess the magnitude of an already existent quantity.
For-profit institution A private institution in which the individual(s) or agency in control receives compensation other than wages, rent, or other expenses for the assumption of risk.
FTE teacher See Instructional staff.
Full-time enrollment The number of students enrolled in postsecondary education courses with total credit load equal to at least 75 percent of the normal full-time course load. At the undergraduate level, full-time enrollment typically includes students who have a credit load of 12 or more semester or quarter credits. At the postbaccalaureate level, full-time enrollment includes students who typically have a credit load of 9 or more semester or quarter credits, as well as other students who are considered full time by their institutions.
Full-time-equivalent (FTE) enrollment For postsecondary institutions, enrollment of full-time students, plus the full-time equivalent of part-time students. The full-time equivalent of the part-time students is estimated using different factors depending on the type and control of institution and level of student.
Function A mathematical correspondence that assigns exactly one element of one set to each element of the same or another set. A variable that depends on and varies with another.
Functional form A mathematical statement of the relationship among the variables in a model.
GGeographic region One of the four regions of the United States used by the U.S. Census Bureau, as follows:
NortheastConnecticut (CT)Maine (ME)Massachusetts (MA)New Hampshire (NH)New Jersey (NJ)New York (NY)Pennsylvania (PA)Rhode Island (RI)Vermont (VT)
Midwest Illinois (IL) Indiana (IN) Iowa (IA) Kansas (KS) Michigan (MI) Minnesota (MN) Missouri (MO) Nebraska (NE) North Dakota (ND) Ohio (OH) South Dakota (SD) Wisconsin (WI)

Projections of Education Statistics to 2026 157
SouthAlabama (AL)Arkansas (AR) Delaware (DE)District of Columbia (DC) Florida (FL) Georgia (GA) Kentucky (KY) Louisiana (LA)Maryland (MD)Mississippi (MS) North Carolina (NC) Oklahoma (OK)South Carolina (SC) Tennessee (TN)Texas (TX)Virginia (VA)West Virginia (WV)
West Alaska (AK) Arizona (AZ) California (CA) Colorado (CO) Hawaii (HI) Idaho (ID) Montana (MT) Nevada (NV) New Mexico (NM) Oregon (OR) Utah (UT) Washington (WA) Wyoming (WY)
Graduate An individual who has received formal recognition for the successful completion of a prescribed program of studies.
Graduate enrollment The number of students who are working towards a master’s or doctor’s degree and students who are in postbaccalaureate classes but not in degree programs.
HHigh school A secondary school offering the final years of high school work necessary for graduation, usually includes grades 10, 11, 12 (in a 6-3-3 plan) or grades 9, 10, 11, and 12 (in a 6-2-4 plan).
High school completer An individual who has been awarded a high school diploma or an equivalent credential, including a General Educational Development (GED) certificate.
High school diploma A formal document regulated by the state certifying the successful completion of a prescribed secondary school program of studies. In some states or communities, high school diplomas are differentiated by type, such as an academic diploma, a general diploma, or a vocational diploma.
High school equivalency certificate A formal document certifying that an individual has met the state requirements for high school graduation equivalency by obtaining satisfactory scores on an approved examination and meeting other performance requirements (if any) set by a state education agency or other appropriate body. One particular version of this certificate is the General Educational Development (GED) test. The GED test is a comprehensive test used primarily to appraise the educational development of students who have not completed their formal high school education and who may earn a high school equivalency certificate by achieving satisfactory scores. GEDs are awarded by the states or other agencies, and the test is developed and distributed by the GED Testing Service (a joint venture of the American Council on Education and Pearson).
Higher education Study beyond secondary school at an institution that offers programs terminating in an associate’s, bachelor’s, or higher degree.
I Income tax Taxes levied on net income, that is, on gross income less certain deductions permitted by law. These taxes can be levied on individuals or on corporations or unincorporated businesses where the income is taxed distinctly from individual income.
Independent variable In regression analysis, a random variable, y, is expressed as a function of variables x1, x2, ... xk, plus a stochastic term; the x’s are known as “independent variables.’’
Inflation A rise in the general level of prices of goods and services in an economy over a period of time, which generally corresponds to a decline in the real value of money or a loss of purchasing power. See also Constant dollars and Purchasing Power Parity indexes.
Instruction (elementary and secondary) Instruction encompasses all activities dealing directly with the interaction between teachers and students. Teaching may be provided for students in a school classroom, in another location such as a home or hospital, and in other learning situations such as those involving co-curricular activities. Instruction may be provided through some other approved medium, such as the Internet, television, radio, telephone, and correspondence.
Instructional staff Full-time-equivalent number of positions, not the number of different individuals occupying the positions during the school year. In local schools, includes all public elementary and secondary (junior and senior high) day-school positions that are in the nature of teaching or in the improvement of the teaching-learning situation; includes consultants or supervisors of instruction, principals, teachers, guidance personnel, librarians, psychological personnel, and other instructional staff, and excludes administrative staff, attendance personnel, clerical personnel, and junior college staff.
Interest on debt Includes expenditures for long-term debt service interest payments (i.e., those longer than 1 year).
Interpolation See Linear interpolation.
LLag An event occurring at time t + k (k > 0) is said to lag behind an event occurring at time t, the extent of the lag being k. An event occurring k time periods before another may be regarded as having a negative lag.
Lead time When forecasting a statistic, the number of time periods since the last time period of actual data for that statistic used in producing the forecast.

158 Appendix F. Glossary
Level of school A classification of elementary/secondary schools by instructional level. Includes elementary schools, secondary schools, and combined elementary and secondary schools. See also Elementary school, Secondary school, and Combined elementary and secondary school.
Linear interpolation A method that allows the prediction of an unknown value if any two particular values on the same scale are known and the rate of change is assumed constant.
Local education agency (LEA) See School district.
MMaster’s degree A degree awarded for successful completion of a program generally requiring 1 or 2 years of full-time college-level study beyond the bachelor’s degree. One type of master’s degree, including the Master of Arts degree, or M.A., and the Master of Science degree, or M.S., is awarded in the liberal arts and sciences for advanced scholarship in a subject field or discipline and demonstrated ability to perform scholarly research. A second type of master’s degree is awarded for the completion of a professionally oriented program, for example, an M.Ed. in education, an M.B.A. in business administration, an M.F.A. in fine arts, an M.M. in music, an M.S.W. in social work, and an M.P.A. in public administration. Some master’s degrees—such as divinity degrees (M.Div. or M.H.L./Rav), which were formerly classified as “first-professional”—may require more than 2 years of full-time study beyond the bachelor’s degree.
Mean absolute percentage error (MAPE) The average value of the absolute value of errors expressed in percentage terms.
Migration Geographic mobility involving a change of usual residence between clearly defined geographic units, that is, between counties, states, or regions.
Model A system of postulates, data, and inferences presented as a mathematical description of a phenomenon, such as an actual system or process. The actual phenomenon is represented by the model in order to explain, predict, and control it.
NNon-degree-granting institutions Postsecondary institutions that participate in Title IV federal financial aid programs but do not offer accredited 4-year or 2-year degree programs. Includes some institutions transitioning to higher level program offerings, though still classified at a lower level.
Nonresident alien A person who is not a citizen of the United States and who is in this country on a temporary basis and does not have the right to remain indefinitely.
Nursery school An instructional program for groups of children during the year or years preceding kindergarten, which provides educational experiences under the direction of teachers. See also Prekindergarten and Preschool.
OOrdinary least squares (OLS) The estimator that minimizes the sum of squared residuals.
PParameter A quantity that describes a statistical population.
Part-time enrollment The number of students enrolled in postsecondary education courses with a total credit load less than 75 percent of the normal full-time credit load. At the undergraduate level, part-time enrollment typically includes students who have a credit load of less than 12 semester or quarter credits. At the postbaccalaureate level, part-time enrollment typically includes students who have a credit load of less than 9 semester or quarter credits.
Personal income Current income received by people from all sources, minus their personal contributions for social insurance. Classified as “people” are individuals (including owners of unincorporated firms), nonprofit institutions serving individuals, private trust funds, and private noninsured welfare funds. Personal income includes transfers (payments not resulting from current production) from government and business such as social security benefits and military pensions, but excludes transfers among people.
Postbaccalaureate enrollment The number of students working towards advanced degrees and of students enrolled in graduate-level classes but not enrolled in degree programs. See also Graduate enrollment.
Postsecondary education The provision of formal instructional programs with a curriculum designed primarily for students who have completed the requirements for a high school diploma or equivalent. This includes programs of an academic, vocational, and continuing professional education purpose, and excludes avocational and adult basic education programs.
Postsecondary institutions (basic classification by level)
4-year institution An institution offering at least a 4-year program of college-level studies wholly or principally creditable toward a baccalaureate degree.
2-year institution An institution offering at least a 2-year program of college-level studies which terminates in an associate degree or is principally creditable toward a baccalaureate degree. Data prior to 1996 include some institutions that have a less-than-2-year program, but were designated as institutions of higher education in the Higher Education General Information Survey.
Less-than-2-year institution An institution that offers programs of less than 2 years’ duration below the baccalaureate level. Includes occupational and vocational schools with programs that do not exceed 1,800 contact hours.

Projections of Education Statistics to 2026 159
Prekindergarten Preprimary education for children typically ages 3–4 who have not yet entered kindergarten. It may offer a program of general education or special education and may be part of a collaborative effort with Head Start.
Preschool An instructional program enrolling children generally younger than 5 years of age and organized to provide children with educational experiences under professionally qualified teachers during the year or years immediately preceding kindergarten (or prior to entry into elementary school when there is no kindergarten). See also Nursery school and Prekindergarten.
Primary school A school with at least one grade lower than 5 and no grade higher than 8.
Private institution An institution that is controlled by an individual or agency other than a state, a subdivision of a state, or the federal government, which is usually supported primarily by other than public funds, and the operation of whose program rests with other than publicly elected or appointed officials.
Private nonprofit institution An institution in which the individual(s) or agency in control receives no compensation other than wages, rent, or other expenses for the assumption of risk. These include both independent nonprofit institutions and those affiliated with a religious organization.
Private for-profit institution An institution in which the individual(s) or agency in control receives compensation other than wages, rent, or other expenses for the assumption of risk (e.g., proprietary schools).
Private school Private elementary/secondary schools surveyed by the Private School Universe Survey (PSS) are assigned to one of three major categories (Catholic, other religious, or nonsectarian) and, within each major category, one of three subcategories based on the school’s religious affiliation provided by respondents.
Catholic Schools categorized according to governance, provided by Catholic school respondents, into parochial, diocesan, and private schools.
Other religious Schools that have a religious orientation or purpose but are not Roman Catholic. Other religious schools are categorized according to religious association membership, provided by respondents, into Conservative Christian, other affiliated, and unaffiliated schools. Conservative Christian schools are those “Other religious” schools with membership in at least one of four associations: Accelerated Christian Education, American Association of Christian Schools, Association of Christian Schools International, and Oral Roberts University Education Fellowship. Affiliated schools are those “Other religious” schools not classified as Conservative Christian with membership in at least 1 of 11 associations—Association of Christian Teachers and Schools, Christian Schools International, Evangelical Lutheran Education Association, Friends Council on Education, General Conference of the Seventh-Day Adventist Church, Islamic School League of America, National Association of Episcopal Schools,
National Christian School Association, National Society for Hebrew Day Schools, Solomon Schechter Day Schools, and Southern Baptist Association of Christian Schools—or indicating membership in “other religious school associations.” Unaffiliated schools are those “Other religious” schools that have a religious orientation or purpose but are not classified as Conservative Christian or affiliated.
Nonsectarian Schools that do not have a religious orientation or purpose and are categorized according to program emphasis, provided by respondents, into regular, special emphasis, and special education schools. Regular schools are those that have a regular elementary/secondary or early childhood program emphasis. Special emphasis schools are those that have a Montessori, vocational/technical, alternative, or special program emphasis. Special education schools are those that have a special education program emphasis.
Projection In relation to a time series, an estimate of future values based on a current trend.
Public school or institution A school or institution controlled and operated by publicly elected or appointed officials and deriving its primary support from public funds.
Pupil/teacher ratio The enrollment of pupils at a given period of time, divided by the full-time-equivalent number of classroom teachers serving these pupils during the same period.
RR2 The coefficient of determination; the square of the correlation coefficient between the dependent variable and its ordinary least squares (OLS) estimate.
Racial/ethnic group Classification indicating general racial or ethnic heritage. Race/ethnicity data are based on the Hispanic ethnic category and the race categories listed below (five single-race categories, plus the Two or more races category). Race categories exclude persons of Hispanic ethnicity unless otherwise noted.
White A person having origins in any of the original peoples of Europe, the Middle East, or North Africa.
Black or African American A person having origins in any of the black racial groups of Africa. Used interchangeably with the shortened term Black.
Hispanic or Latino A person of Cuban, Mexican, Puerto Rican, South or Central American, or other Spanish culture or origin, regardless of race. Used interchangeably with the shortened term Hispanic.
Asian A person having origins in any of the original peoples of the Far East, Southeast Asia, or the Indian subcontinent, including, for example, Cambodia, China, India, Japan, Korea, Malaysia, Pakistan, the Philippine Islands, Thailand, and Vietnam. Prior to 2010–11, the Common Core of Data (CCD) combined Asian and Pacific Islander categories.

160 Appendix F. Glossary
Native Hawaiian or Other Pacific Islander A person having origins in any of the original peoples of Hawaii, Guam, Samoa, or other Pacific Islands. Prior to 2010–11, the Common Core of Data (CCD) combined Asian and Pacific Islander categories. Used interchangeably with the shortened term Pacific Islander.
American Indian or Alaska Native A person having origins in any of the original peoples of North and South America (including Central America), and who maintains tribal affiliation or community attachment.
Two or more races A person identifying himself or herself as of two or more of the following race groups: White, Black, Asian, Native Hawaiian or Other Pacific Islander, or American Indian or Alaska Native. Some, but not all, reporting districts use this category. “Two or more races” was introduced in the 2000 Census and became a regular category for data collection in the Current Population Survey (CPS) in 2003. The category is sometimes excluded from a historical series of data with constant categories. It is sometimes included within the category “Other.”
Region See Geographic region.
Regression analysis A statistical technique for investigating and modeling the relationship between variables.
Regular school A public elementary/secondary or charter school providing instruction and education services that does not focus primarily on special education, vocational/technical education, or alternative education.
Resident population Includes civilian population and armed forces personnel residing within the United States; excludes armed forces personnel residing overseas.
Revenue All funds received from external sources, net of refunds, and correcting transactions. Noncash transactions, such as receipt of services, commodities, or other receipts in kind are excluded, as are funds received from the issuance of debt, liquidation of investments, and nonroutine sale of property.
Revenue receipts Additions to assets that do not incur an obligation that must be met at some future date and do not represent exchanges of property for money. Assets must be available for expenditures.
Rho A measure of the correlation coefficient between errors in time period t and time period t minus 1.
SSalary The total amount regularly paid or stipulated to be paid to an individual, before deductions, for personal services rendered while on the payroll of a business or organization.
School A division of the school system consisting of students in one or more grades or other identifiable groups and organized to give instruction of a defined type. One school may share a building with another school or one school may be housed in several buildings. Excludes schools that have closed or are planned for the future.
School district An education agency at the local level that exists primarily to operate public schools or to contract for public school services. Synonyms are “local basic administrative unit” and “local education agency.”
Secondary enrollment The total number of students registered in a school beginning with the next grade following an elementary or middle school (usually 7, 8, or 9) and ending with or below grade 12 at a given time.
Senior high school A secondary school offering the final years of high school work necessary for graduation.
Serial correlation Correlation of the error terms from different observations of the same variable. Also called Autocorrelation.
Special education school A public elementary/secondary school that focuses primarily on special education for children with disabilities and that adapts curriculum, materials, or instruction for students served.
Standard error of estimate An expression for the standard deviation of the observed values about a regression line. An estimate of the variation likely to be encountered in making predictions from the regression equation.
Student An individual for whom instruction is provided in an educational program under the jurisdiction of a school, school system, or other education institution. No distinction is made between the terms “student” and “pupil,” though “student” may refer to one receiving instruction at any level while “pupil” refers only to one attending school at the elementary or secondary level. A student may receive instruction in a school facility or in another location, such as at home or in a hospital. Instruction may be provided by direct student-teacher interaction or by some other approved medium such as television, radio, telephone, and correspondence.
Student membership Student membership is an annual headcount of students enrolled in school on October 1 or the school day closest to that date. The Common Core of Data (CCD) allows a student to be reported for only a single school or agency. For example, a vocational school (identified as a “shared time” school) may provide classes for students from a number of districts and show no membership.
TTeacher see Instructional staff.
Time series A set of ordered observations on a quantitative characteristic of an individual or collective phenomenon taken at different points in time. Usually the observations are successive and equally spaced in time.
Time series analysis The branch of quantitative forecasting in which data for one variable are examined for patterns of trend, seasonality, and cycle.

Projections of Education Statistics to 2026 161
Type of school A classification of public elementary and secondary schools that includes the following categories: regular schools, special education schools, vocational schools, and alternative schools. See also Regular school, Special education school, Vocational school, and Alternative school.
UUnadjusted dollars See Current dollars.
Undergraduate students Students registered at an institution of postsecondary education who are working in a baccalaureate degree program or other formal program below the baccalaureate, such as an associate’s degree, vocational, or technical program.
Ungraded student (elementary/secondary) A student who has been assigned to a school or program that does not have standard grade designations.
VVariable A quantity that may assume any one of a set of values.
YYears out In forecasting by year, the number of years since the last year of actual data for that statistic used in producing the forecast.