Embed Size (px)
Citation preview

Projection Radiography
Ho Kyung [email protected]
Pusan National University
Medical PhysicsPrince & Links 5
Projection radiography
• Most commonly used method of medical imaging utilizing x rays, called conventionalradiography
• Regarding shadow cast by a semitransparent body illuminated by x rays
• Representing a projection of the 3‐D volume of the body onto a 2‐D imaging surface
limiting depth resolution; hence limiting contrast
(conspicuity: "hide" important lesions)
• Representing the “transmission” of the x‐ray beam thru the patient, weighted by the integrated loss of beam E due to scattering & absorption in the body
• To screen for pneumonia, heart disease, lung disease, bone fractures, cancer & vascular disease
• Overall imaging conditions of projection radiographic system
– Exposure time ~0.1 sec
– Image size 14 17 in.
– Exposure level 30 mR of a chest radiograph (= 1/10 of the annual bgn dose)
2

3
General projection radiography systemFluoroscopy system(C‐arm system)
Mammography system
Instrumentation
• X‐ray tube
• Filters/collimators
• Grids
• Detectors
4

X‐ray tubes
5
• Cathode assembly
– Filament
• Thin thoriated* tungsten wire
(*thoriate: add thorium or thorium dioxide to increase thermionic flow)
• Typ. filament current = 3–5 A at 6–12 V
• Thermionic emission of e–‘s, accelerated toward the anode producing tube current, referred to as the mA(typ. 50–1,200 mA)
• Filament current heat (resistance) # of discharged e–‘s tube current
– Focusing cup
• Small depression in the cathode containing the filament
• To help focus the e– beam toward a particular spot on the anode
Focal point: a bevelled edge of the anode disk
6

• Anode
– Made from molybdenum on which a rhenium‐alloyed tungsten target is coated
– Mo in the target area for mammography x‐ray tube
– Tube voltage kVp (typ. 30–150 kVp)
– Generating “characteristic” & “bremsstrahlung” x rays
– ~1% of conversion efficiency (~99% heat)
– Stator electromagnets induce the rotors to rotate the anode
• To avoid melting the anode target area
• 3,200–3,600 rpm
7
• Exposure mA (tube current) s (exposure time) = mAs during the applied kVp
– Controlled by fixed timer circuit or automatic exposure control (AEC) timer
• Controlling the overall exposure determined by the duration of the applied kVp
– Fixed timer circuit
• Silicon‐controlled rectifier (SCR) switch timed by a microprocessor
• Timing accuracy ~ 0.001 s
• Radiologists control the “mA” & the exposure “time” directly, hence determining the “mAs”
– AEC timer
• 5‐mm‐thick parallel plate ionization chamber placed btwn the patient table & the imager
• Voltage signal from ion chamber triggers the SCR, which shuts off the tube voltage
• Radiologists control the “mAs” & the exposure time is determined automatically by the AEC
• Set max. time to prevent accidental overdose due to that AEC circuit malfunctions or the ion chamber is missing or incorrectly positioned
8

Filtration & restriction
• Filtration
– Process of absorbing low‐E x‐ray photons before they enter the patient
– X‐ray spectrum: polyenergetic, bremsstrahlung + characteristic radiations
– Very “undesirable” for low‐E photons to enter the body
• Almost entirely absorbed w/i the body contributing to “patient dose” but not the image
– Inherent filtering
• Tungsten anode itself
• Glass housing of the x‐ray tube & the dielectric oil
• Accentuated over time due to the aging of x‐ray tubes (vaporization of W filaments)
– Added filtering
• Placing metal in the x‐ray beam outside of the tube
– Al (1–2 mm thick) typically
– Higher‐E systems: Cu + Al (to attenuate the 8 keV characteristic x rays from Cu)
• Additional 1.0 mm Al/Eq of filtering by the “silvered mirror” placed w/i the "collimator"
– Beam hardening
• The increase in the beam’s “effective energy” as a progressive shift in the position of the spectrum “to the right” due to filtering
Note that the National Council on Radiation Protection & Measurements (NCRP) recommends a min. filtration of 2.5 mm Al/Eq at the exit port of the x‐ray tube for the reduction of patient dose
9
10

Example
For radiography systems operating above 70 kVp, the NCRP recommends a min. total filtration of 2.5 mm Al/Eq at the exit port of the x‐ray tube. Although such filtration reduces high‐energy as well as low‐energy x‐rays, thus requiring longer exposure times to properly expose the x‐ray film, the overall dose to the patient is reduced because of the reduction in low‐energy x‐rays are absorbed almost entirely by the patient. At 80 kVp, what thickness of Cu would provide 2.5 mm Al/Eq of filtration? (Note: 𝜇 𝜌⁄ (Al) = 0.2015 cm2/g & 𝜇 𝜌⁄ (Cu) = 0.7519 cm2/g at 80 kVp; 𝜌 (Al) = 2.699 g/cm3, 𝜌 (Cu) = 8.960 g/cm3)
11
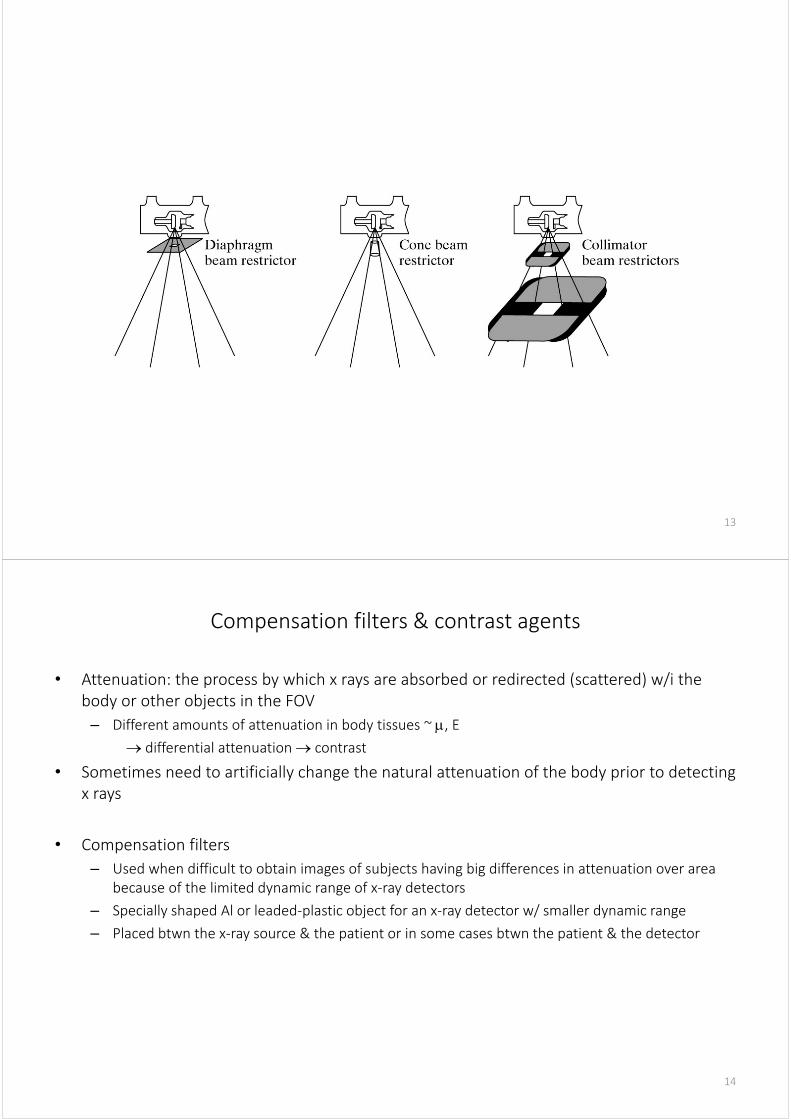
• Restriction beam
– Process of absorbing the x rays outside a certain field of view
– To avoid exposing parts of the patient that need not be imaged
– To help reduce the deleterious effects of “Compton scatter”
– Basic kinds of beam restrictors
① Diaphragms
– Flat pieces of lead w/ holes
– Simple & inexpensive
– Fixed geometry used in dedicated systems that have only on purpose (e.g., chest imaging)
② Cones or cylinders
– Fixed geometry & better performance
③ Collimators
– Variable diaphragms comprised of movable pieces of lead
– Expensive but flexible
– Usually two collimators: one near the tube & one farther away from the tube
» “Mirror” btwn them to illuminate the FOV w/ an alignment grid
12
13
Compensation filters & contrast agents
• Attenuation: the process by which x rays are absorbed or redirected (scattered) w/i the body or other objects in the FOV
– Different amounts of attenuation in body tissues ~ , E differential attenuation contrast
• Sometimes need to artificially change the natural attenuation of the body prior to detecting x rays
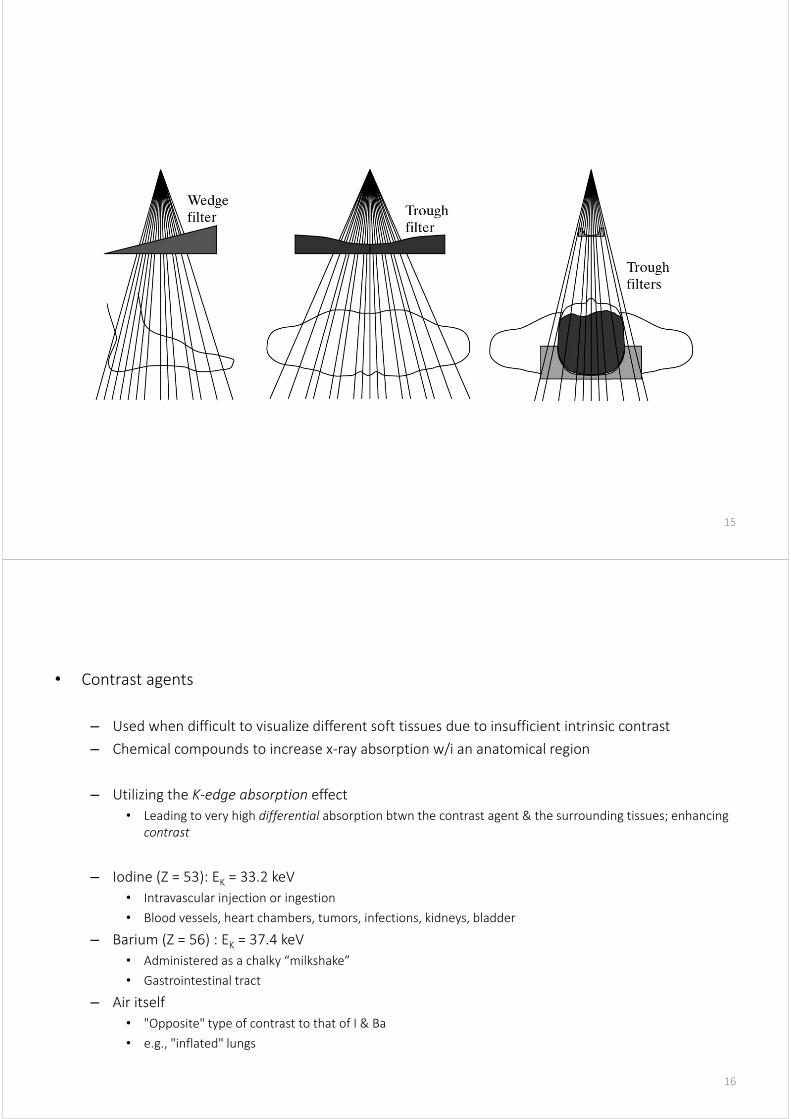
• Compensation filters
– Used when difficult to obtain images of subjects having big differences in attenuation over area because of the limited dynamic range of x‐ray detectors
– Specially shaped Al or leaded‐plastic object for an x‐ray detector w/ smaller dynamic range
– Placed btwn the x‐ray source & the patient or in some cases btwn the patient & the detector
14
15
• Contrast agents
– Used when difficult to visualize different soft tissues due to insufficient intrinsic contrast
– Chemical compounds to increase x‐ray absorption w/i an anatomical region
– Utilizing the K‐edge absorption effect
• Leading to very high differential absorption btwn the contrast agent & the surrounding tissues; enhancing contrast
– Iodine (Z = 53): EK = 33.2 keV
• Intravascular injection or ingestion
• Blood vessels, heart chambers, tumors, infections, kidneys, bladder
– Barium (Z = 56) : EK = 37.4 keV
• Administered as a chalky “milkshake”
• Gastrointestinal tract
– Air itself
• "Opposite" type of contrast to that of I & Ba
• e.g., "inflated" lungs
16

17
18
After injection Before injection (mask image) After subtraction

Grids, airgaps, & scanning slits
• Scattering process
– Causing a random “fog” throughout the image; thereby reducing the contrast of image
• Reduction methods: grids, airgaps, & scanning slits
• Grids
– Thin strips of Pb alternating w/ highly transmissive interspace mat’l (e.g., Al or plastic)
– Linear, focused grid
19
– “Crosshatch” grids, “parallel” grids, …
– Grid ratio
• A measure of the effectiveness of the grid for reducing scatter
• grid ratio
– ℎ = height of the lead strips
– 𝑏 = spacing btwn the lead strips
– 6:1–16:1 in conventional radiographic systems
– Down to 2:1 in mammography systems
– Higher grid ratio for thick body parts (e.g., abdomen or chest)
– Lower grid ratio for thin body parts (e.g., extremities)
– Grid spacing
• Generally reported using its reciprocal, known as grid frequency
• 60 cm‐1 for conventional radiographic systems
• 80 cm‐1 for mammography systems
20

Note that grids w/ higher grid ratios (tall lead strips or fine lead strip spacing) are more capable of stopping off‐axis radiation => Requiring higher patient dose to maintain a high‐quality image
Consider the tradeoff btwn primary & scatter radiations
– Grid conversion factor (GCF)
• Characterizing the amount of additional exposure required for a particular grid
• GCF
– Ranging from 3 to 8
• Use a grid when the tube voltage > 60 kVp (isotropic scattering for low‐E photons);
when imaging a body part thicker than 10 cm
– Stationary grids
• Introducing visible artifacts
– Potter‐Bucky diaphragm
• Moving the grid 2 to 3 cm during exposure in a linear or circular path
21
• Airgaps
– Leaving an airgap btwn the patient & the detector an effective means of scatter rejection
– Cons:
• Increased geometric magnification
• Blurring or unsharpness due to x‐ray focal‐spot size effect
• Scanning slits
– Placed in front of and/or in back of the patient
– Providing greater than 95% scatter reduction
– More complex & costly system
– Longer exposure times
22

Film‐screen detectors
Direct exposure of x‐rays to a photographic film
About 1 to 2% of the x rays are stopped by the film ( detection efficiency)
Requiring an unnecessarily large x‐ray dose to the patient
A very inefficient way to create a photograph
Use of intensifying screens on both sides of the film, but an additional image blurring due to light scattering should be considered
23
• Intensifying screens
– Base
• Provided for mechanical stability
• Somewhat flexible to be pushed tightly against the film
• Typ. made of polyester plastic
– Reflective layer
• Reflecting light from the phosphor back into the film rather than getting lost in the base
• Typ. about 25 m thick
• Made of magnesium oxide (MgO) or titanium dioxide (TiO2)
– Protective coating
• Applied to film side of the screen to protect it from repeated film loading & unloading
24

– Phosphors
• Converting x rays into light
• Luminescentmaterials
– Fluorescence 1 10‐8 s of the excitation
– Phosphorescence in which light emission can be delayed
Causing "afterglow" motion artifact, image lag
• Should be highly x‐ray attenuating
– high Z (so large )• Should emit many light photons for every x‐ray photon that is stopped
– High conversion efficiency
» A measure of the number of light photons emitted per incident x‐ray photon
» Typ. btwn 5 to 20% depending on the type of phosphor & its thickness
» ~103 light photons per incident 50‐keV x‐ray photon
» Speed of screen
• "Faster" if the conversion efficiency is higher• Calcium tungstate (CaWO4) discovered by Thomas Edison
• Rare earth phosphors in the late 1970s (terbium‐doped gadolinium oxysulfide, Gd2O2S:Tb)
25
• Radiographic film
– Optical film to capture the optical image created w/i the screens that sandwich the film
– Common size in US: 14 17, 14 14, 10 12, 8 10, & 7 17 in.
– Image quality depends on optical properties & details of chemical development
• Radiographic cassette
– A holder for two intensifying screens & the film "sandwiched" btwn
– One side "radiolucent"; the other "a sheet of lead foil"
26
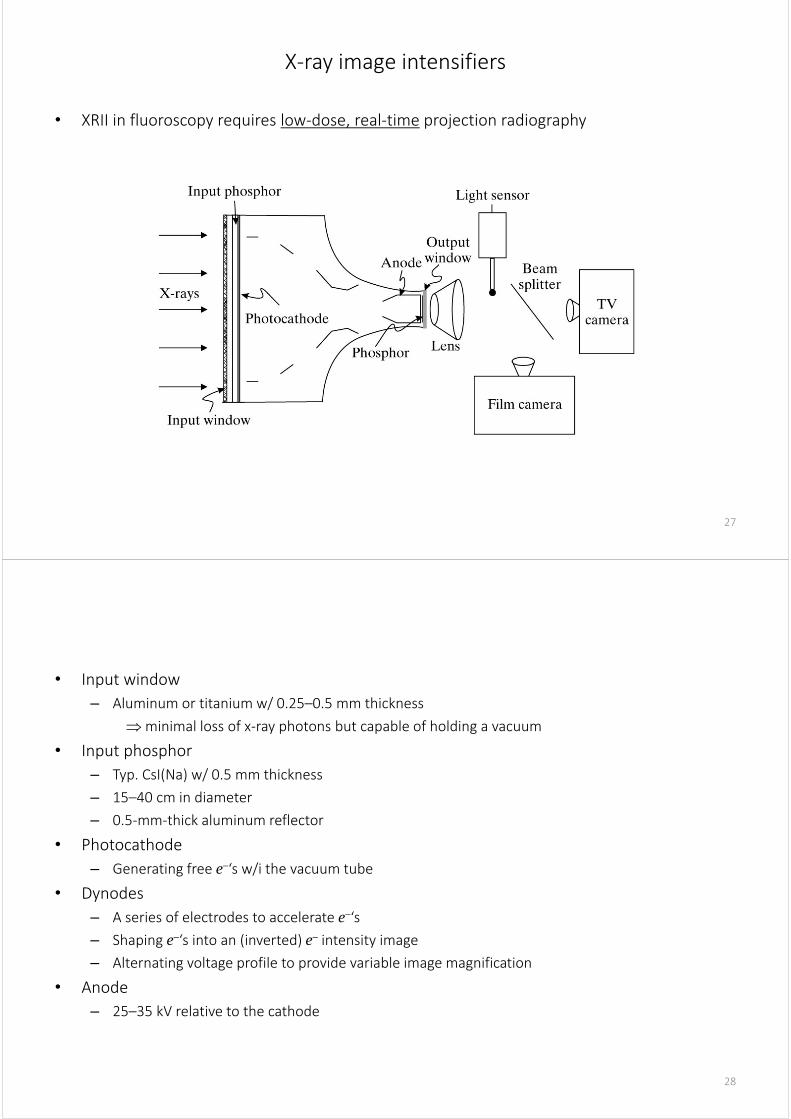
X‐ray image intensifiers
• XRII in fluoroscopy requires low‐dose, real‐time projection radiography
27
• Input window
– Aluminum or titanium w/ 0.25–0.5 mm thickness
minimal loss of x‐ray photons but capable of holding a vacuum
• Input phosphor
– Typ. CsI(Na) w/ 0.5 mm thickness
– 15–40 cm in diameter
– 0.5‐mm‐thick aluminum reflector
• Photocathode
– Generating free e–‘s w/i the vacuum tube
• Dynodes
– A series of electrodes to accelerate e–‘s
– Shaping e–‘s into an (inverted) e– intensity image
– Alternating voltage profile to provide variable image magnification
• Anode
– 25–35 kV relative to the cathode
28

• Output phosphor screen
– P20‐type phosphor
• Deposited on the output window (15‐mm‐thick glass & 25–35 mm in diameter)
– Thin Al film on the inner side of the phosphor as the anode & reflector
• Lens
– Magnifying images
• Light sensor
– Providing an automatic gain control (i.e., feedback to the x‐ray tube current) to provide a relatively constant image brightness
• TV camera
– Capturing the light image & sending to a TV monitor for real‐time views
• Film camera
– Capturing selected still images onto film
29
Image Formation
• Basic imaging equation
Consider a particular line segment thru the object starting at the x‐ray origin & ending on the detector plane at point (x, y):
30
Intensity of x rays incident at 𝑥, 𝑦
𝐼 𝑥, 𝑦 𝑆 𝐸 𝐸′𝑒 ; ; ,,
d𝐸′
• 𝑆 𝐸 = the spectrum of the incident x-ray
• 𝑠 = distance from x-ray origin to the point 𝑥, 𝑦 on the detector plane = 𝑟

Geometric effects
Undesirable (“multiplicative”) effects due to the natural x‐ray beam divergence
• Inverse square law
– Dependency of the net flux of photons (i.e., photons per unit area) on 1/𝑟2
– Intensity at the origin of the detector assuming no attenuation
𝐼 [# of photons/area]
𝐼 = beam intensity [# of photons] integrated over a small sphere surrounding the source
𝑑 = the source‐to‐detector distance
– Intensity at 𝑟 𝑟 𝑥, 𝑦 on the detector
𝐼𝐼
4𝜋𝑟𝐼 𝐼 because 𝑟 𝑑
– cos2 drop‐off of x‐ray intensity due to the inverse square law
𝐼𝐼
4𝜋𝑟4𝜋𝑑 𝐼4𝜋𝑟
𝐼𝑑𝑟
𝐼 cos2𝜃
Resulting in “false” object attenuation in a circular pattern around the detector origin
31
Example
The inverse square law has a very practical use in radiography. Suppose an acceptable chest radiograph was taken using 30 mAs at 80 kVp from 1 m. Suppose that it was now requested that one be taken at 1.5 m at 80 kVp. What mAs setting should be used to yield the same exposure?
32
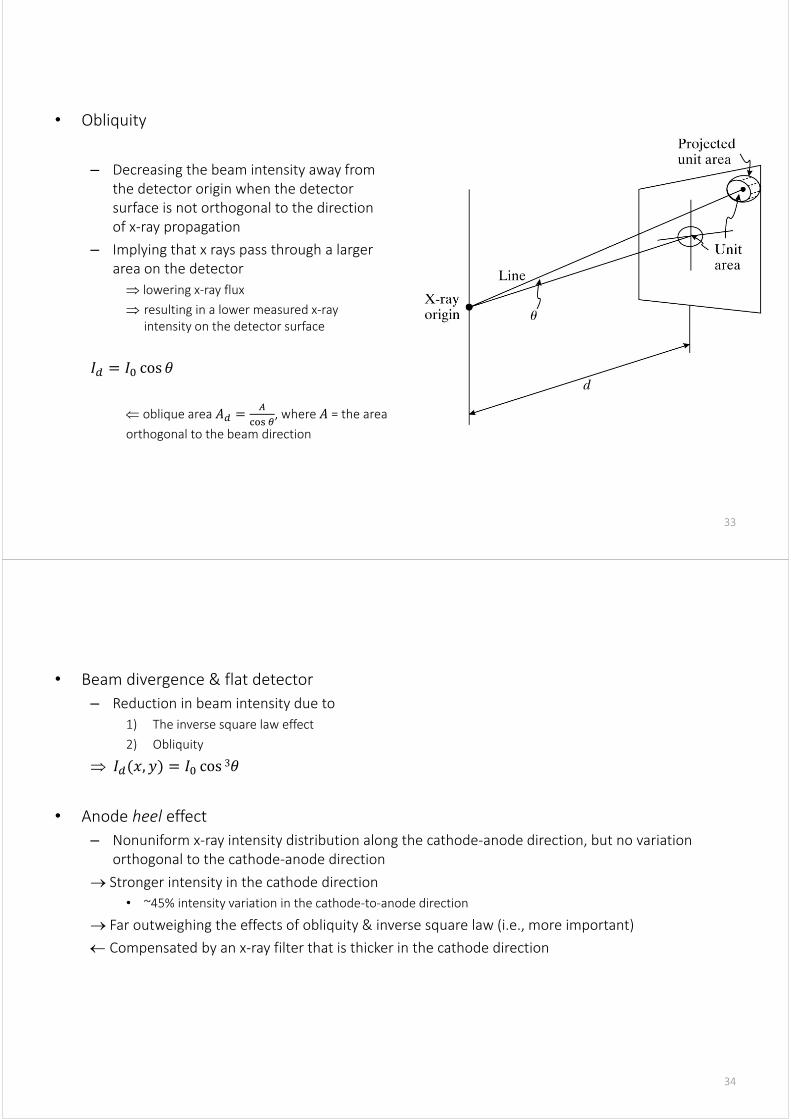
• Obliquity
– Decreasing the beam intensity away from the detector origin when the detector surface is not orthogonal to the direction of x‐ray propagation
– Implying that x rays pass through a larger area on the detector
lowering x‐ray flux
resulting in a lower measured x‐ray intensity on the detector surface
𝐼 𝐼 cos 𝜃
oblique area 𝐴 , where 𝐴 = the area
orthogonal to the beam direction
33
• Beam divergence & flat detector
– Reduction in beam intensity due to
1) The inverse square law effect
2) Obliquity
𝐼 𝑥, 𝑦 𝐼 cos 3𝜃
• Anode heel effect
– Nonuniform x‐ray intensity distribution along the cathode‐anode direction, but no variation orthogonal to the cathode‐anode direction
Stronger intensity in the cathode direction
• ~45% intensity variation in the cathode‐to‐anode direction
Far outweighing the effects of obliquity & inverse square law (i.e., more important)
Compensated by an x‐ray filter that is thicker in the cathode direction
34

Example
Suppose a chest x‐ray is taken at 2 yards using 14 inch by 17 inch film. What will be the smallest ratio 𝐼 𝐼⁄ across the film (assuming no object attenuation)?
35
• Path length
– X‐ray intensity at 𝑥, 𝑦 0, 0 :𝐼 0,0 𝐼 𝑒
– X‐ray intensity at 𝑥, 𝑦 0, 0 :𝐼 𝑥, 𝑦 𝐼 𝑒 ⁄
Considering the 1/𝑟2 & obliquity:𝐼 𝑥, 𝑦 𝐼 cos 3𝜃 𝑒 ⁄
Causing a shading artifact w/i a homogeneous (attenuation & thickness) object
Misleading as a different attenuation w/ithe object or different object thickness
36
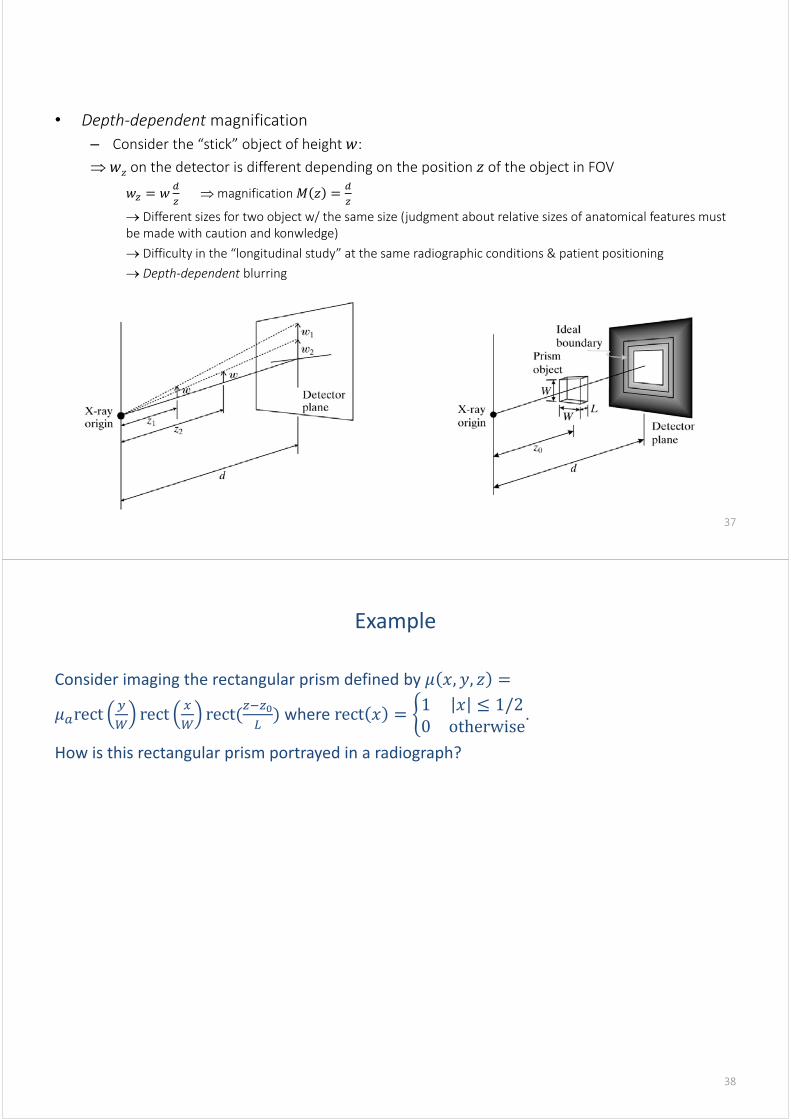
• Depth‐dependentmagnification
– Consider the “stick” object of height 𝑤:
𝑤𝑧 on the detector is different depending on the position 𝑧 of the object in FOV
𝑤 𝑤 magnification 𝑀 𝑧
Different sizes for two object w/ the same size (judgment about relative sizes of anatomical features must be made with caution and konwledge)
Difficulty in the “longitudinal study” at the same radiographic conditions & patient positioning
Depth‐dependent blurring
37
Example
Consider imaging the rectangular prism defined by 𝜇 𝑥, 𝑦, 𝑧
𝜇 rect rect rect where rect 𝑥 1 𝑥 1/20 otherwise
.
How is this rectangular prism portrayed in a radiograph?
38

• Imaging equation w/ geometric effects
– Consider an idealized object 𝑡𝑧 𝑥, 𝑦 :
• Infinitesimally thin;
• Located in a single plane 𝑧;• Capable of differentially attenuating x rays as a function of 𝑥 & 𝑦; Can be regarded as a transmittivity
𝐼 𝑥, 𝑦 𝐼 cos 3𝜃 𝑒 ⁄ 𝐼 cos 3𝜃 𝑡 𝑥, 𝑦 at 𝑧 𝑑
– cos 𝜃
– Considering the magnification at arbitrary 𝑧, where 0 𝑧 𝑑;
𝐼 𝑥, 𝑦 𝐼 cos 3𝜃 𝑡 𝑥 𝑀 𝑧⁄ , 𝑦 𝑀 𝑧⁄
or
𝐼 𝑥, 𝑦 𝐼𝑑
𝑑 𝑥 𝑦𝑡 𝑥𝑧 𝑑⁄ , 𝑦𝑧 𝑑⁄
Reasonable approximation only for relatively thin objects that have nearly the same 𝑀 𝑧 & no variation in attenuation in the 𝑧 direction
39
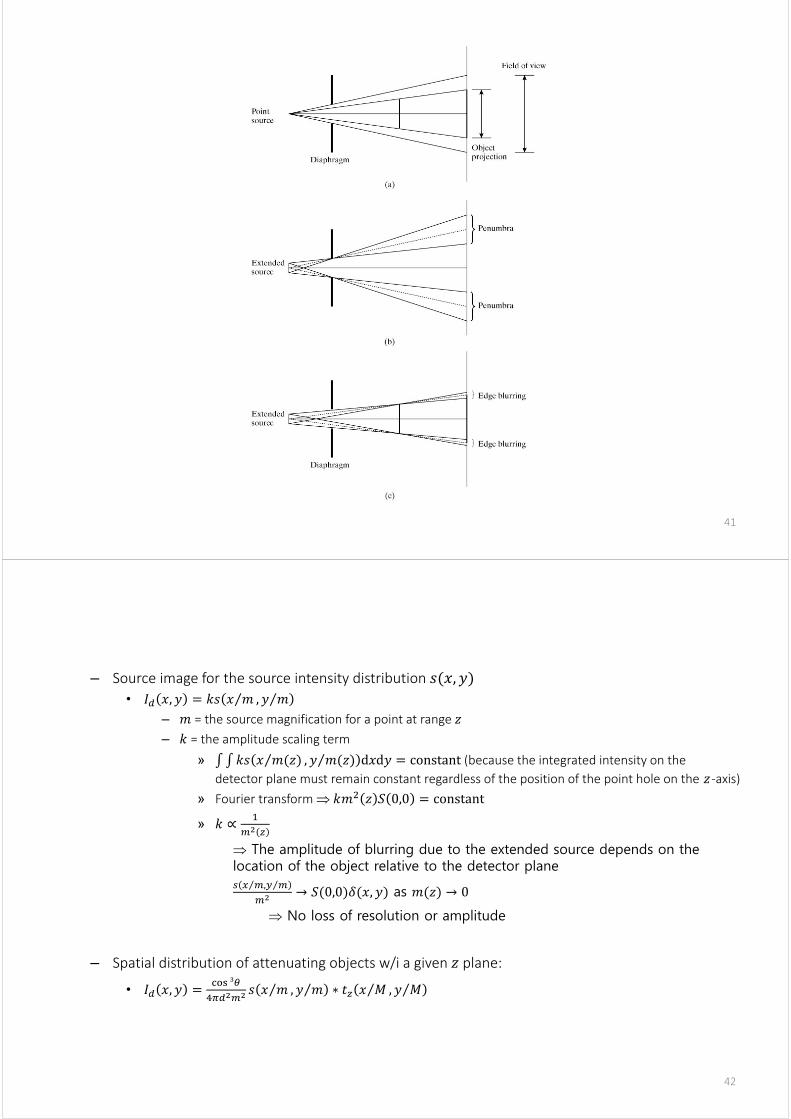
Blurring effects
Due to “extended” sources & the intensifying screen
• Extended sources (= finite focal spot size)
Fuzziness both at the edge of the FOV & object boundaries
– Size of a point hole located at range 𝑧 for the source w/ diameter 𝐷;
𝐷𝑑 𝑧
𝑧𝐷 𝑚 𝑧 𝐷
𝑚 𝑧𝑑 𝑧
𝑧𝐷 𝑀 𝑧 1 𝐷
» source magnification
» Negative because it inverts the image of the source 1 – 𝑀 𝑧
40
41
– Source image for the source intensity distribution 𝑠 𝑥, 𝑦• 𝐼 𝑥, 𝑦 𝑘𝑠 𝑥 𝑚⁄ , 𝑦 𝑚⁄
– 𝑚 = the source magnification for a point at range 𝑧– 𝑘 = the amplitude scaling term
» 𝑘𝑠 𝑥 𝑚 𝑧⁄ , 𝑦 𝑚 𝑧⁄ d𝑥d𝑦 constant (because the integrated intensity on the detector plane must remain constant regardless of the position of the point hole on the 𝑧‐axis)
» Fourier transform 𝑘𝑚 𝑧 𝑆 0,0 constant
» 𝑘 ∝
The amplitude of blurring due to the extended source depends on the location of the object relative to the detector plane
⁄ , ⁄→ 𝑆 0,0 𝛿 𝑥, 𝑦 as 𝑚 𝑧 → 0
No loss of resolution or amplitude
– Spatial distribution of attenuating objects w/i a given 𝑧 plane:
• 𝐼 𝑥, 𝑦 𝑠 𝑥 𝑚⁄ , 𝑦 𝑚⁄ ∗ 𝑡 𝑥 𝑀⁄ , 𝑦 𝑀⁄
42

• Film‐screen blurring
Consider an “additional convolution” w/ the film‐screen impulse response function ℎ 𝑥, 𝑦 assuming that light photons isotropically scatter:
• 𝐼 𝑥, 𝑦 𝑠 𝑥 𝑚⁄ , 𝑦 𝑚⁄ ∗ 𝑡 𝑥 𝑀⁄ , 𝑦 𝑀⁄ ∗ ℎ 𝑥, 𝑦
– Tradeoff btwn image resolution (or blur) & detector efficiency • = the fraction of photons captured by the detector on average
~0.3 for CaWO4
43
Film characteristics
• Usually negligible MTF of the film compared w/ the intensifying screen
• Ignoring the image created directly on the film by x rays due to very poor Only considering the image created by the light produced in the phosphors adjacent the film
X rays captured by the screen converted to light photons & captured by the film a latent image (i.e., not visible) a blackening of the film
• Characterizing film as a transformation btwn exposure to light & the degree of blackeningof film optical density of the film
44

• Optical transmittivity = the fraction of light transmitted thru the exposed film
– 𝑇
• 𝐼 = the irradiation of the incident light [energy/area/sec]
• 𝐼 = the irradiation of the transmitted light [energy/area/sec]
• Optical opacity = 𝑇
• Optical density = the common logarithm of the optical opacity
𝐷 log𝐼𝐼
Characterizing “how black” the film in on a logarithmic scale Usable when 0.25 𝐷 2.25 Best discrimination of shading gray when 1 𝐷 1.5
45
• H&D (Hurter & Driffield) curve
– S‐shaped curve:
• Low D toe@ low exposure / ”linear” portion / high D shoulder@ high exposure
– Base fog = non‐zero optical density even in the absence of exposure
– In the linear region:
• 𝐷 Γ log
– 𝑋 = the exposure when the linear region would hit the horizontal axis (𝐷 = 0)
– Γ = the slope of the H&D curve in the linear region ( “contrast”)
» Called the “film gamma”, typ. 0.5–3
» Γ contrast but latitude • Latitude = the range of exposures over which the H&D curve is linear ( “dynamic range”)
• Speed of film = the inverse of the exposure at which “D = 1 + fog level”
46

47
Noise & Scattering
• Signal‐to‐noise ratio (SNR)
Consider the detector intensities from a rectangular object assuming unity magnification & infinitesimal source size:
– Local contrast 𝐶
• Addition of noise due to the random fluctuation in # of photons arriving in each small area of detector
Called “quantum mottle”
Responsible for the impression of detector measurements of x‐ray intensity
48

– SNR 𝐶
• X‐ray intensity in the number of photons using the effective energy (ℎ𝜈) for polyenergetic beam:
– 𝐼
• Average background intensity:
– 𝐼
• Variance of the number of photons per burst per area 𝐴 in the background:
– 𝜎 𝑁
Then, the local SNR:
• SNR 𝐶 𝑁 𝐶 Φ𝐴𝑅𝑡𝜂
– Φ = the number of photons per Roentgen per cm2
– 𝐴 = the unit area
– 𝑅 = the body’s radiation exposure in Roentgens
– 𝑡 = the fraction of photons transmitted thru the body
– 𝜂 = the detector efficiency
49
• SNR 𝐶 𝑁– How to improve the visibility of a particular structure in a radiograph?
• Increase the contrast of the structure
– Change x‐ray energy (kVp)
– Use a contrast agent
– Use dual‐energy techniques
• Increase the number of photons used in the visualization or analysis
– Increase mAs
– Increase x‐ray energy (more penetration)
– Use a large‐pixel detector
– Use a more efficient detector
50
• Quantum efficiency & detective quantum efficiency
– Quantum efficiency
• Probability that a single photon incident upon the detector will be detected
– Detective quantum efficiency
• Considering the transformation of SNR from a detector’s input to its output
• A measure of the degradation in the SNR due to the detection process
• The fraction of photons that are detected “correctly”
• DQE QE 1
– DQE
» SNR = the intrinsic SNR of the incident radiation
» SNR = the SNR of the measured quantity
51
Example
Consider a hypothetical detector having QE = 0.5 and the ability to perfectly localize every photon that is stopped by the detector. What is the DQE of this detector?
52
Example
Suppose that an x‐ray tube is set up to fire 𝑛 10,000‐photon bursts at a detector and the detector’s output 𝑥 is recorded as 𝑥 , 𝑖 1, ⋯ , 𝑛. Suppose that the mean and variation of 𝑥is found to be �̅� 8,000 and 𝜎 40,000, respectively. What is the DQE of this detector?
53
• Compton scattering
Resulting in a decrease in image contrast & a decrease in SNR
– Effect on image contrast
Recall the local contrast 𝐶
• Assuming that CS adds a constant intensity 𝐼𝑠 to both target & background intensities
𝐶𝐼 𝐼 𝐼 𝐼
𝐼 𝐼𝐶
𝐼𝐼 𝐼
𝐶1 𝐼 𝐼⁄
Scatter reduces contrast by the factor 1 1 𝐼 𝐼⁄⁄
– 𝐼 𝐼⁄ called “scatter‐to‐primary ratio”
• SNR w/ scatter
– SNR 𝐶 𝐶 𝐶⁄
– SNR⁄
54

Example
Suppose 20% of the incident x‐ray photons have been scattered in a certain material before they arrive at detectors. What is the scatter‐to‐primary ratio? By what factor is the SNR degraded?
55