Embed Size (px)
Citation preview

Projected Changes in the Characteristics of Precipitation and Temperature Trends in Java Island using AIMS Model Version 1.0
I Dewa Gede Arya Putra1,2, Mohammad Syamsu Rosid1, Ardhasena Sopaheluwakan2, Donaldi Sukma Permana2, Jaepil Cho3
1Physics Department of Mathematic and Natural Science Faculty – University of Indonesia Campus, Pondok Cina, Beji, Depok, Jawa Barat, Indonesia.2Center for Research and Development - BMKG Gn. Sahari Selatan, Kemayoran, Jakarta Pusat, DKI Jakarta, Indonesia.3Climate Research Department - APEC Climate Center (APCC), 12 Centum 7-ro, U-dong, Haeundae, Busan, South Korea.

Outline
1.Introduction2.Methodology3.Results and discussion4.Conclusions
Changes Processes Impacts
Water Quality
Flooding
Dried streams
Drought
Land use (Urbanization)
Climate
(temperature)
1. Introduction
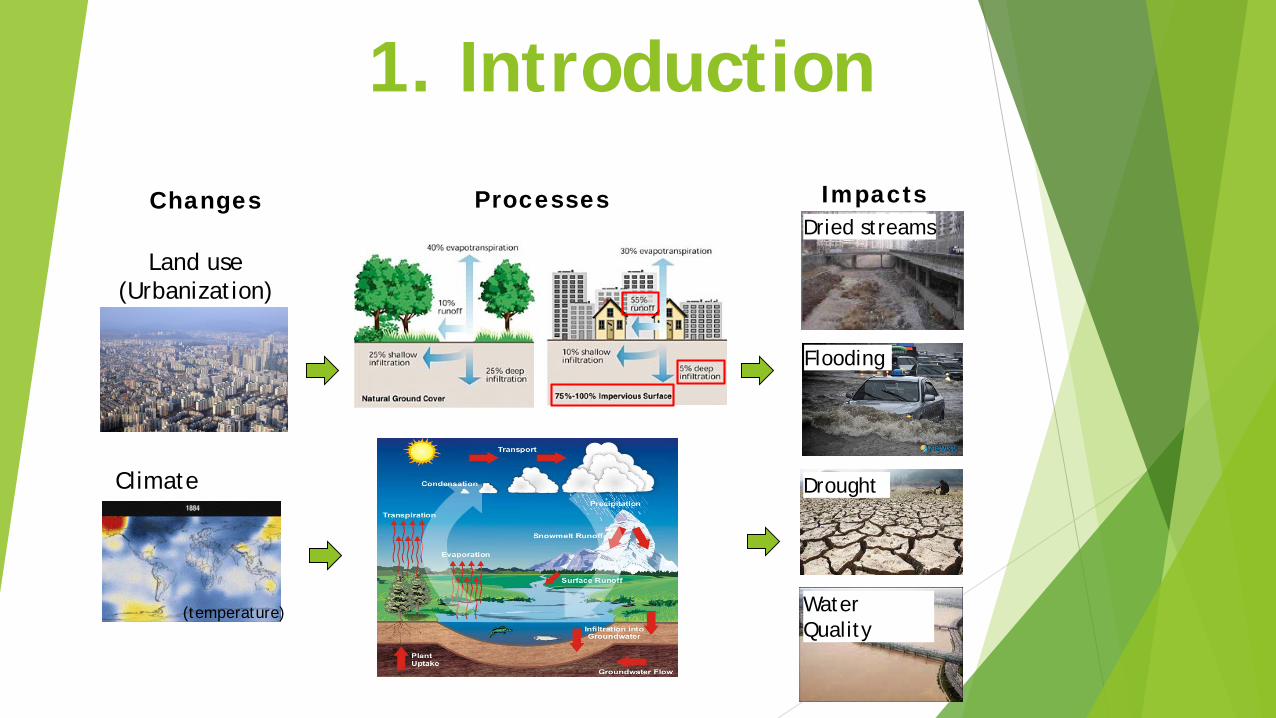
Global climate models (GCM)
Global climate models (GCM) and regional climate models (RCM) provide climate change dataat global and regional scales, respectively, for practical use, such as climate change adaptationpolicy-making. The GCM model is used to simulate monthly average rainfall, minimumtemperature, and maximum temperature for baseline, medium term and long term. 30-yearclimate observation data, which is a minimal period for determining climate change. Climatechange studies involve analyzing past climate, current climate conditions, and estimating futureclimate possibilities. As a result, studies on climate change require an integrated assessment ofthe climate system or the earth system.
Real Earth SystemGCM: Global Climate Model

Climate Information Created Using GCMs and RCMs
Real Earth SystemGCM: Global Climate Model
RCM: Regional Climate ModelProcesses in GCM

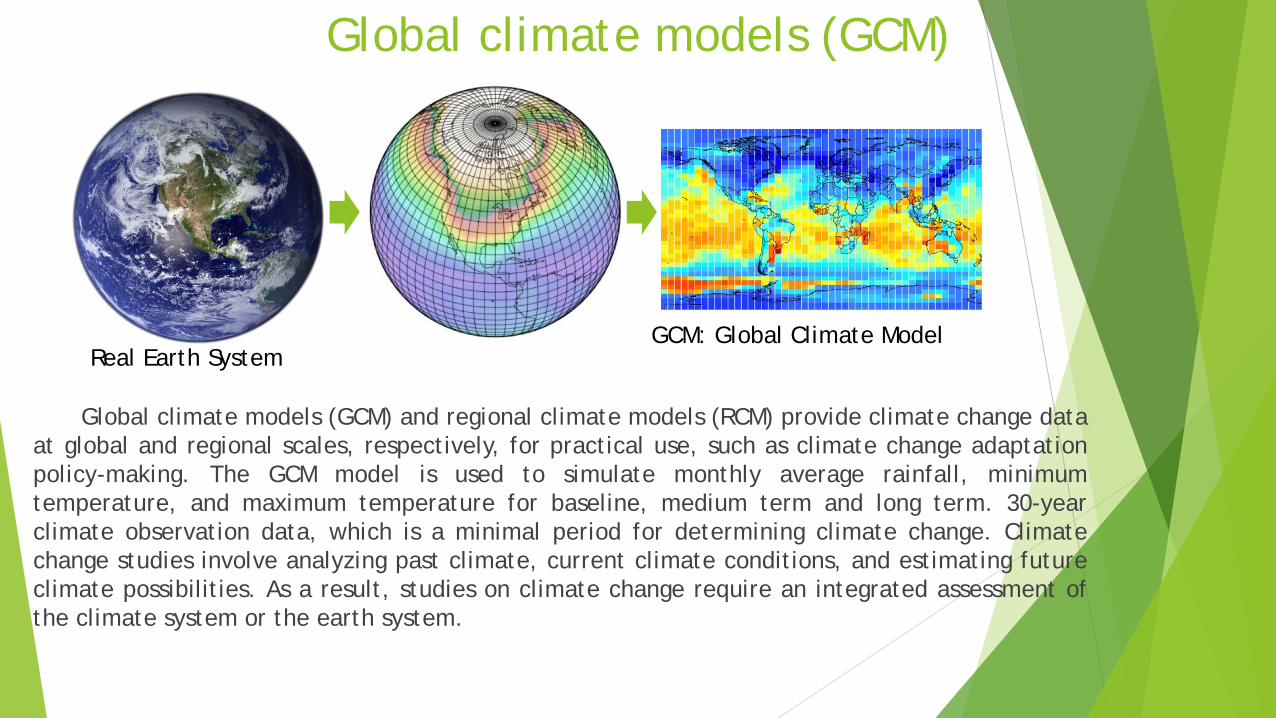
Seamless Climate Service
Seamless Prediction and Services Frameworke
Source: http://slideplayer.com/slide/1447561/
Weather
Seasonal Forecast (SF)
Climate ChangeAdaptation(CCA)
Subseasonal to Seasonal (S2S) Disaster
Risk Management
(DRM)

2. Methodology
Research area
17 Meteorological Stations in Java Island
Prcp Tmax Tmin
Mountly Climatological Pattern

Climate Service: Development of user-centered downscaling Tools
AIMS: APCC Integrated Modeling SolutionSoftware Optimization• Dynamically optimize your software• Run-time reduced by 60~70%• Open Source (currently in closed Beta)• Supports R, Javascript, Python

ID Variable Description Unit
cdd Precipitation Consecutive dry days, PRCP < 1mm Day
cwd Consecutive wet days, PRCP ≥ 1mm Day
prcptot Annual total PRCP in wet days (daily PRCP ≥ 1mm) mm
txn TMAX (Maximum temperature)
Min TMAX oC
txx Max TMAX oC
tnn TMIN (minimum temperature)
Min TMIN oC
tnx Max TMIN oC
AIMS is a desktop application based on the open source R program which contains climate statistical donationmethods made by APEC Climate Center. Conducts statistical downscaling of daily CMIP5 (Coupled ModelIntercomparison Project 5) climate change scenario data at a station level using empirical quantile mappingmethod (Cho et al., 2016). quantile mapping was then applied to correct additional systematic bias by constructingthe transfer functions under the cumulative density function framework between the model and observation usingsix types of transfer functions. Quantile mapping is routinely applied to correct biases of regional climate modelsimulations compared to observational data. If the observations are of similar resolution as the regional climatemodel, quantile mapping is a feasible approach.
Source:Expert Team on Climate Change Detection and Indices (ETCCDI)http://etccdi.pacificclimate.org/

Characteristics of the CMIP5 models used in this study. (Rhee, 2015)Model Name Institution and Country Grid SpacingCanESM2 CCCma, Canada 2.8CCSM4 NCAR, United States 1.25CSIRO Mk3.6.0 CSIRO in collaboration with the Queensland Climate Change Centre of Excellence, Australia 1.9
FGOALS-g2 LASG, IAP, Chinese Academy of Sciences, and Center forEarth System Science, Tsinghua University, China
2.8
FGOALS-s2 LASG, IAP, Chinese Academy of Sciences, China 2.8GFDL-ESM2G GFDL, United States 2.0GFDL-ESM2M GFDL, United States 2.0HadGEM2-CC Met Office Hadley Centre, United Kingdom, with additional realizations
contributed by Instituto Nacional de Pesquisas Espaciais (INPE), Brazil1.25
HadGEM2-ES Met Office Hadley Centre, United Kingdom, with additional realizationscontributed by INPE, Brazil
1.25
INM-CM4.0 Institute of Numerical Mathematics, Russia 1.5IPSL-CM5A-LR IPSL, France 1.9MIROC5 Atmosphere and Ocean Research Institute at the University of Tokyo,
National Institute for Environmental Studies, and JAMSTEC, Japan1.4
MIROC-ESM Atmosphere and Ocean Research Institute at the University of Tokyo,National Institute for Environmental Studies, and JAMSTEC, Japan
2.8
MIROC-ESM-CHEM Atmosphere and Ocean Research Institute at the University of Tokyo,National Institute for Environmental Studies, and JAMSTEC, Japan
2.8
MPI-ESM-LR Max Planck Institute for Meteorology, Germany 1.9MRI-CGCM3 Meteorological Research Institute, Japan 1.1NorESM1-M Norwegian Climate Centre, Norway 1.9
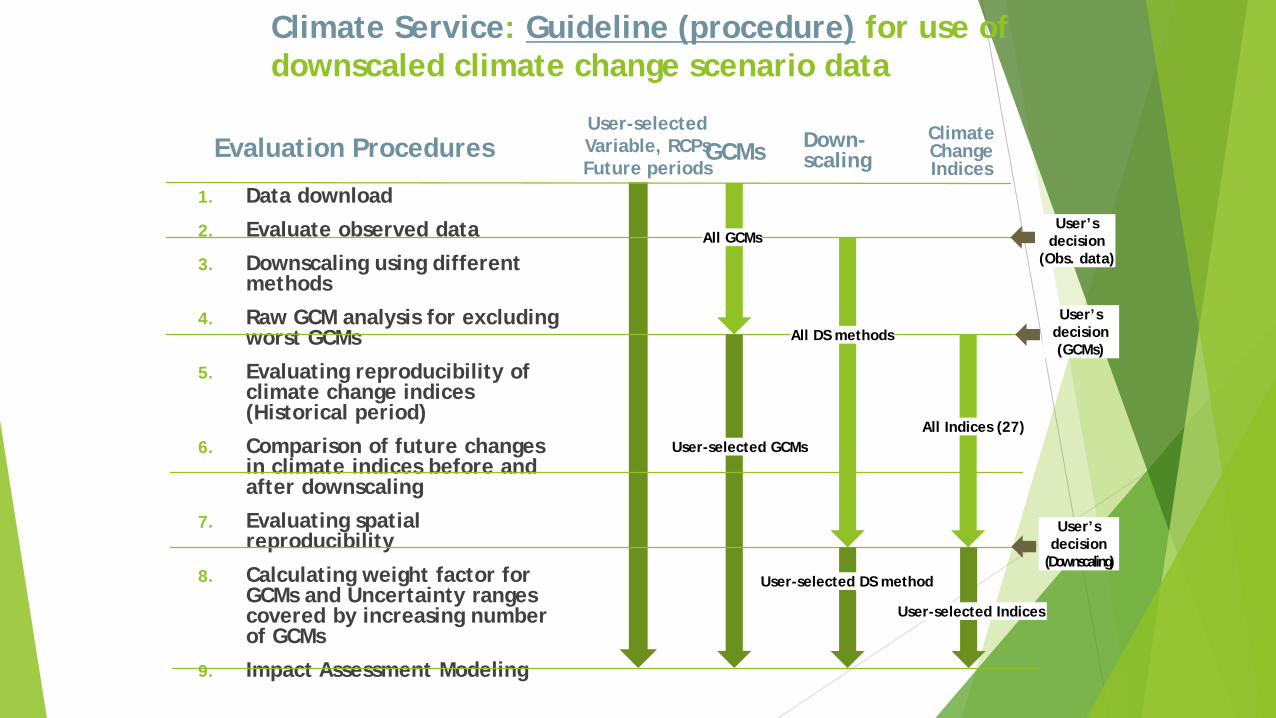
1. Data download
2. Evaluate observed data
3. Downscaling using different methods
4. Raw GCM analysis for excluding worst GCMs
5. Evaluating reproducibility of climate change indices (Historical period)
6. Comparison of future changes in climate indices before and after downscaling
7. Evaluating spatial reproducibility
8. Calculating weight factor for GCMs and Uncertainty ranges covered by increasing number of GCMs
9. Impact Assessment Modeling
Climate Service: Guideline (procedure) for use of downscaled climate change scenario data
GCMsUser-selectedVariable, RCPsFuture periods
User-selected GCMs
All GCMs
Down-scaling
All DS methods
User-selected DS method
Climate Change Indices
All Indices (27)
User-selected Indices
Evaluation Procedures
User’s decision
(Obs. data)
User’sdecision(GCMs)
User’sdecision
(Downscaling)

AIMS downscaling package
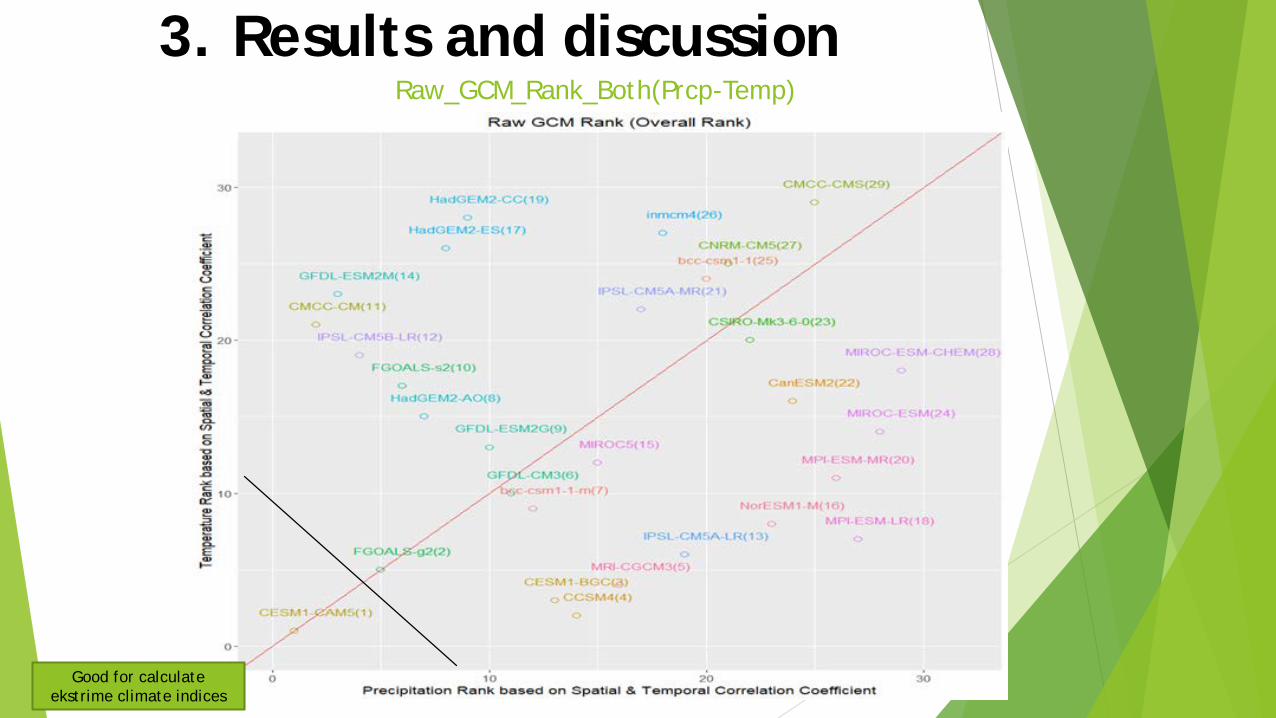
Raw_GCM_Rank_Both(Prcp-Temp)
3. Results and discussion
Good for calculate ekstrime climate indices

Future Change for Annual total precipitation
2071-21002041-20702011-2040Historical
4500
4000
3500
3000
2500
2000
1500
1000
mm
Pcp rcp45
2071-21002041-20702011-2040Historical
5000
4000
3000
2000
1000
mm
pcp rcp85
Prcptot(mm)
Historical RCP45 RCP851981-2010 2011-
20402041-2070
2070-2100
2011-2040
2041-2070
2070-2100
minimum 1625.4 1393.1 1372.2 1800.7 1229.5 1771.7 1811.01st Quantile 2140.9 2176.9 1840.7 2120.2 1863.3 2226.6 2545.7
Median 2349.8 2571.3 2295.0 2704.8 2305.9 2423.7 2863.5Mean 2338.2 2580.3 2395.8 2765.2 2296.1 2594.8 3007.9
3rd Quantile 2531.8 3009.6 3107.0 3367.1 2711.6 2905.8 3338.7Maximum 3156.2 3840.4 3396.8 4320.6 3210.0 3952.4 4530.0

Future Change for (CDD) Maximum length of dry spell (consecutive dry days < 1 mm)
cdd (day) Historical RCP45 RCP851981-2010 2011-
20402041-2070
2070-2100
2011-2040
2041-2070
2070-2100
minimum 19 19 24 14 20 18 181st
Quantile 31 32 46 34 29 40 51Median 43 50 62 50 55 72 81Mean 51 69 78 69 74 79 843rd
Quantile 71 113 117 103 108 111 116Maximum 97 153 171 177 195 194 169
2071-21002041-20702011-2040Historical
200
150
100
50
0
day
cdd rcp45
2071-21002041-20702011-2040Historical
200
150
100
50
0
Day
cdd rcp85
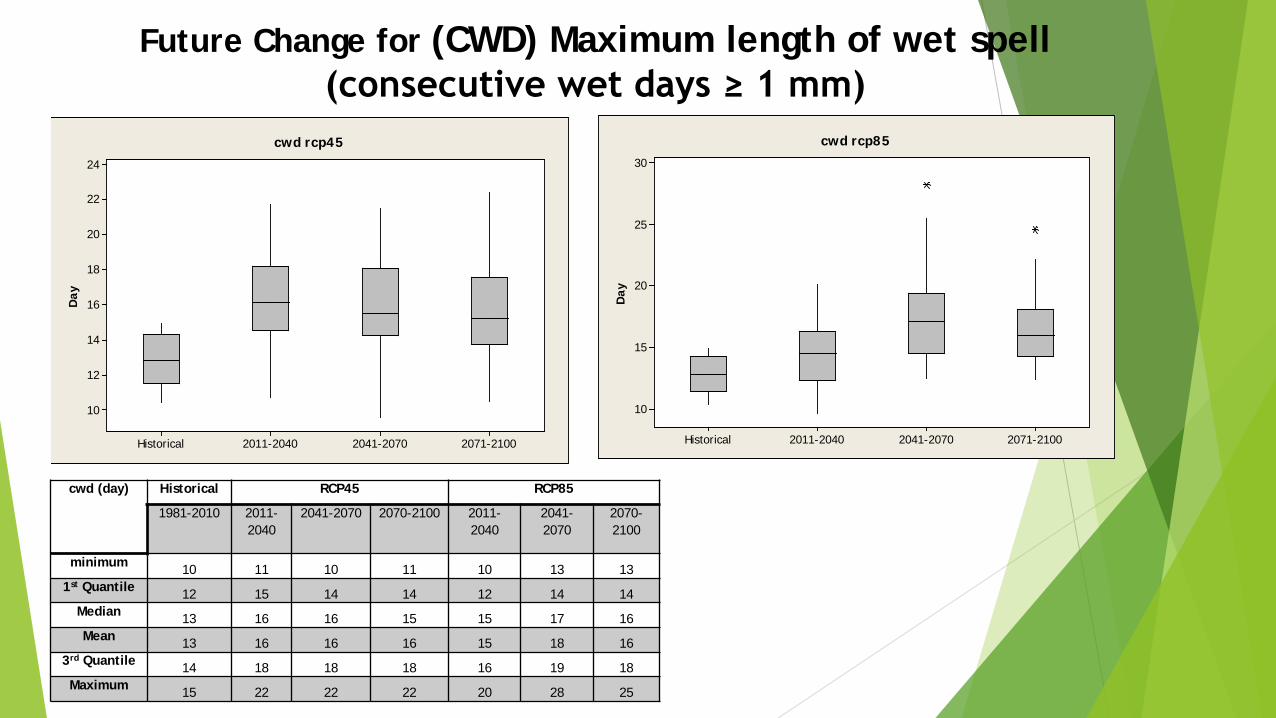
Future Change for (CWD) Maximum length of wet spell (consecutive wet days ≥ 1 mm)
cwd (day) Historical RCP45 RCP85
1981-2010 2011-2040
2041-2070 2070-2100 2011-2040
2041-2070
2070-2100
minimum 10 11 10 11 10 13 131st Quantile 12 15 14 14 12 14 14
Median 13 16 16 15 15 17 16Mean 13 16 16 16 15 18 16
3rd Quantile 14 18 18 18 16 19 18Maximum 15 22 22 22 20 28 25
2071-21002041-20702011-2040Historical
30
25
20
15
10
Day
cwd rcp85
2071-21002041-20702011-2040Historical
24
22
20
18
16
14
12
10
Day
cwd rcp45

Future Change for Daily minimum from temperature of maximum
txn (oC) Historical RCP45 RCP851981-2010 2011-
20402041-2070
2070-2100
2011-2040
2041-2070
2070-2100
minimum 25.3 25.1 26.6 26.8 25.3 26.9 28.41st Quantile 25.6 26.0 27.1 27.8 26.2 27.9 29.3
Median 25.8 26.6 27.6 28.1 26.5 28.3 29.6Mean 25.8 26.5 27.6 28.1 26.7 28.3 29.63rd
Quantile 25.9 27.0 27.9 28.4 27.4 28.9 30.0Maximum 26.8 27.9 28.8 29.4 28.4 29.7 30.6
2071-21002041-20702011-2040Historical
30
29
28
27
26
25
'C
txn rcp45
2071-21002041-20702011-2040Historical
31
30
29
28
27
26
25
'C
txn rcp85

Future Change for Daily maximum from temperature of maximum
2071-21002041-20702011-2040Historical
39
38
37
36
35
34
33
'C
txx rcp45
2071-21002041-20702011-2040Historical
41
40
39
38
37
36
35
34
33
'C
txx rcp85
txx (oC) Historical RCP45 RCP851981-2010 2011-
20402041-2070
2070-2100
2011-2040
2041-2070
2070-2100
minimum 33.6 34.0 35.7 36.1 34.3 35.5 37.81st Quantile 34.3 35.0 36.0 36.6 34.9 36.8 38.3
Median 34.6 35.6 36.3 37.2 35.6 37.2 39.1Mean 34.7 35.6 36.6 37.1 35.7 37.3 39.03rd
Quantile 35.2 36.3 37.1 37.6 36.4 37.8 39.6Maximum 35.7 36.8 37.9 38.6 37.5 38.8 40.3

Future Change for Daily minimum from temperature of minimum
tnn (oC) Historical RCP45 RCP85
1981-2010 2011-2040
2041-2070 2070-2100 2011-2040 2041-2070 2070-2100
minimum 17.5 17.9 18.0 20.4 18.1 20.1 21.91st Quantile 18.4 19.2 20.2 20.8 19.4 20.8 22.4
Median 19.0 19.8 20.6 21.2 19.7 21.2 22.9Mean 18.9 19.7 20.5 21.1 19.8 21.3 23.0
3rd Quantile 19.4 20.4 21.0 21.4 20.4 21.9 23.6Maximum 20.3 21.0 21.6 21.9 21.6 22.9 24.2
2071-21002041-20702011-2040Historical
22
21
20
19
18
17
'C
tnn rcp45
2071-21002041-20702011-2040Historical
25
24
23
22
21
20
19
18
17
'C
tnn rcp85
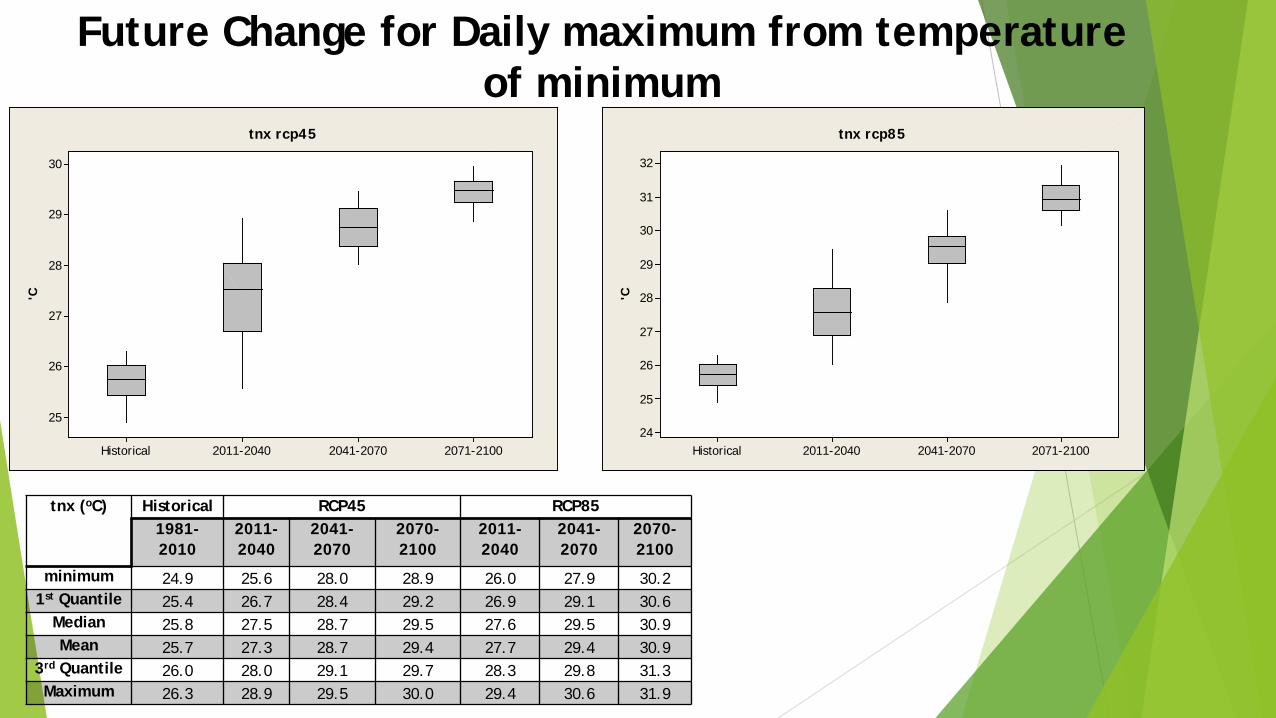
Future Change for Daily maximum from temperature of minimum
tnx (oC) Historical RCP45 RCP851981-2010
2011-2040
2041-2070
2070-2100
2011-2040
2041-2070
2070-2100
minimum 24.9 25.6 28.0 28.9 26.0 27.9 30.21st Quantile 25.4 26.7 28.4 29.2 26.9 29.1 30.6
Median 25.8 27.5 28.7 29.5 27.6 29.5 30.9Mean 25.7 27.3 28.7 29.4 27.7 29.4 30.9
3rd Quantile 26.0 28.0 29.1 29.7 28.3 29.8 31.3Maximum 26.3 28.9 29.5 30.0 29.4 30.6 31.9
2071-21002041-20702011-2040Historical
30
29
28
27
26
25
'C
tnx rcp45
2071-21002041-20702011-2040Historical
32
31
30
29
28
27
26
25
24
'C
tnx rcp85

Percentage future climate change IndicesClimate Indices
(%) Future Change of RCP45
(%) Future Change of RCP85
2011-2040
2041-2070
2071-2100
2011-2040
2041-2070
2071-2100
prcptot 10 2 18 -2 11 29cdd 35 51 33 44 54 64cwd 27 25 21 15 38 28txn 3 7 9 4 10 15txx 3 5 7 3 7 12tnn 4 9 12 5 13 22tnx 6 12 15 8 15 20
The projection based on the best MME 3 GCM uses the SQM method after the bias correction is done, the dominant change in the rain climate index and temperature occurs with the trend of increasing percentage relative to the historical (1981-2010) in the period 2011-2040, 2041-2070 and 2071-2100. For more complete changes in the future on the island of Java, see Table Beside:
4. ConclusionsBased on the results of climate projections using thesimple quantil mapping (SQM) method with biascorrection using the AIMS version 1 model to obtainfuture climate conditions, it can be seen that there isan increase in rainfall and an increase in temperaturetrends in the period 2011-2040, 2041-2070 and 2071-2100.