Embed Size (px)
Citation preview

Project Work Plan
Case Study 1: Where should I place my restaurant?
Technology and Data Sources
This report uses and leverages geospatial mapping technology and data. Geographic Information Systems (GIS) software, Esri ArcGIS, are used to profile dynamic patterns associated with competition factors and consumer patterns, issues facing any entrepreneur developing a successful business plan. The primary applications and use of this technology relate to the following challenges in developing a successful business plan leveraging geospatial technology and data:
1. What type(s) of existing competition exist in my targeted service area and what is the historic sales volume do these competitors historically produce?
a. What types of sales should I expect based on historic competitor sales in the region?
b. Where are my competitors locating in the region and how might this impact my decision to locate my business?
c. How large is my targeted market in my proposed region relative to total sales and employees counts?
2. What types of consumer patterns exist in a targeted region relative to trends, habits, and cultural variations demonstrated within a market? Simply put, on what are consumers spending money, or not, in relation to national trends for a targeted product, service or goods? Is my product or service in demand by local consumers?

3. Where is the best location to maximize my access to targeted consumer markets or issues associated with competition? How does the combination of knowing existing competition factors and consumer demand drive my decision to locate my business to maximize sales?
Data Sources
The analysis for this study is based on the following data sources:
1. Demographic- Esri Demographic Estimates from U.S. Census 2011 a. Profile of American population relating age, income, housing, employment, and
ethnicity patterns within population. 2. Lifestyle – Esri Consumer Segmentation Profiles 2011
a. Comprehensive profile of the American population relating to how they spend money, family demographics and overall lifestyle shaping consumer expenditure patterns.
3. Consumer – Consumer Expenditure Survey (CEX) from the Bureau of Labor Statistics 2011
a. Estimates from survey on how families spend money and how these expenditures are benchmarked against national patterns for the same product, service or good.
4. Business – InfoGroup a. Comprehensive analysis on over 12 million businesses benchmarking the sales
volume, industry sector, and employee counts for businesses in 2011.
Background: An aspiring entrepreneur wants to open an Italian restaurant in either Mattoon or Charleston but does not know where the best location would be. This restaurant would be similar to the Olive Garden; nicer than a pizza parlor but priced where the average middle-class couple or family could easily afford an evening dinner there once in a while. This would be a sit-down restaurant, offering quick lunches of soup, salads and a limited selection of small – portion pastas but will focus much more on the dinner crowd with a large selection of Italian dishes and wines.
1. Who are my competitors?
a. Analysis indicates the following characteristics of existing competitors in the targeted region for expanding a new potential Italian restaurant.
i. 96 restaurants ii. Minimum Annual Sales 2011: $40,000
iii. Maximum Annual Sales 2011: $4,480,000 iv. Total Market Sales 2011: $76,440,000

v. Average Store Sales 2011: $796,250 b. Specific analysis reveals the following restaurants as most closely aligning with
competitors for the proposed new Italian restaurant in the Charleston-Mattoon zip codes.
i. Angelo’s Pizza ii. Jerry’s Pizza
iii. Monical’s Pizza (Charleston) iv. Monical’s Pizza (Mattoon) v. Pagliacci’s
vi. Pagliai’s Pizza vii. Pizza Hut (Charleston)
viii. Pizza Hut (Mattoon) c. These targeted full service Italian restaurants produce the following sales and
labor force results for the Charleston-Mattoon zip codes in 2011: i. 8 restaurants
ii. Minimum Annual Sales 2011: $728,000 iii. Maximum Annual Sales 2011: $1,680,000 iv. Total Market Sales 2011: $8,976,00 v. Average Store Sales 2011: $1,122,000
2. Where is my competition? a. Analysis of restaurant locations in Charleston and Mattoon reveals a highly
focused pattern of store locations around two main road (See Map Below)

b. Most restaurants, as indicated above in the map, locate along route 16 (east-west) and route 45 running (north-south) through Mattoon, IL.
c. Analysis of targeted Italian restaurant locations reveals clustering of store locations in Charleston and Mattoon (See Map Below)
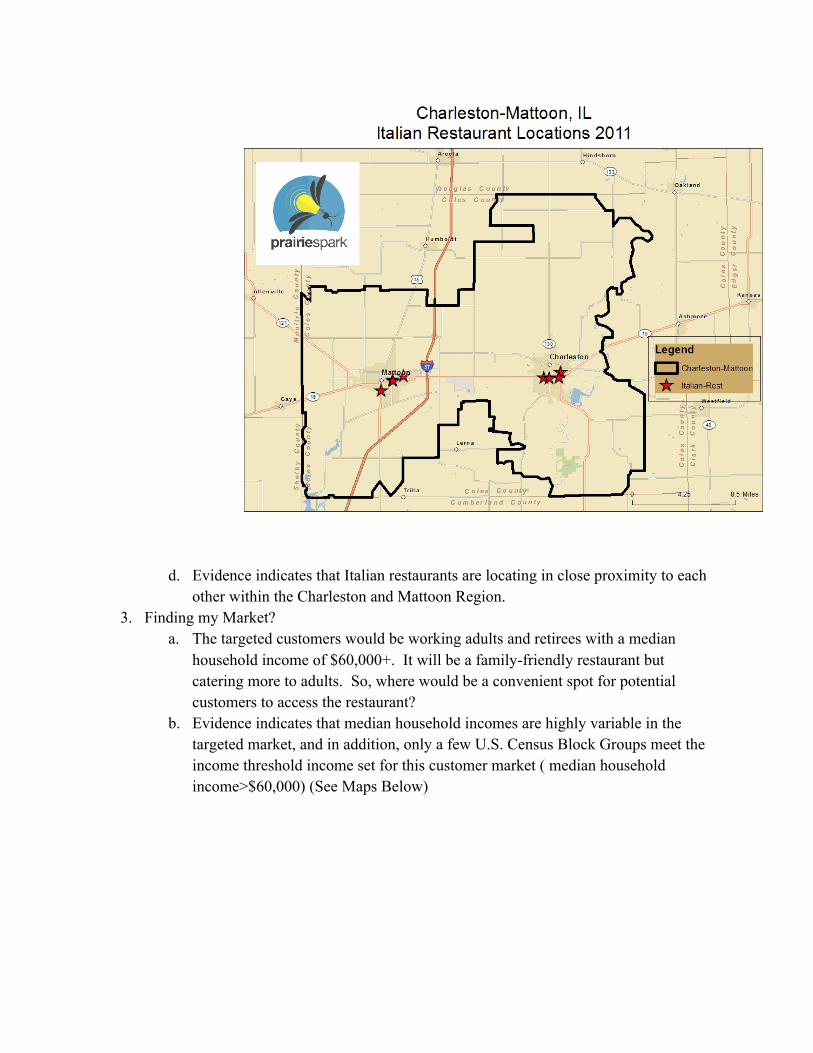
d. Evidence indicates that Italian restaurants are locating in close proximity to each
other within the Charleston and Mattoon Region. 3. Finding my Market?
a. The targeted customers would be working adults and retirees with a median household income of $60,000+. It will be a family-friendly restaurant but catering more to adults. So, where would be a convenient spot for potential customers to access the restaurant?
b. Evidence indicates that median household incomes are highly variable in the targeted market, and in addition, only a few U.S. Census Block Groups meet the income threshold income set for this customer market ( median household income>$60,000) (See Maps Below)


Analysis reveals most existing Italian restaurants locating within five miles of key consumer markets as defined by income thresholds. Both communities appear to have higher income neighborhoods on the southern ends of both communities, however, it appears greater geographic areas of the Charleston market meet the income threshold set in the analysis.
4. Which community has greater demand for Italian Family Dining? Analysis reveals from, American Consumer Demand Survey Data, that Charleston and Mattoon consumer markets reveal varying levels of spending in relation to spending time and money on dining. The following summary market profiles and highlight analysis from Restaurant Market Potential Report for Charleston and Mattoon:
Restaurant/Dining Product/Consumer Behavior Adults Percent MPI – Charleston Activity Number of Adults Percentage of
Population MPI Ranking
Went to family restaurant/steak house in last 6 months
15,808 71.9% 100
Family restaurant/steak house last 6 months: Olive Garden
4,434 20.2% 114

Restaurant/Dining Product/Consumer Behavior Adults Percent MPI – Mattoon Activity Number of Adults Percentage of
Population MPI Ranking
Went to family restaurant/steak house in last 6 months
12,355 70.5% 98
Family restaurant/steak house last 6 months: Olive Garden
2,966 16.9% 95
Potential strengths in Charleston market in contrast to the Mattoon market as defined by the Restaurant Market Report (See attached reports):
1. Higher number of adults reporting going out to eat (family restaurant or steakhouse) over the last six months (15,808>12,355);
2. Slightly higher MPI Ranking on dining out rates in relation to national averages (100>98); 3. Larger number of adults report visiting franchise Italian restaurants, Olive Garden, over
the last six months (4,434>2,966); 4. Significantly higher MPI ranking for visiting Olive Garden Restaurants (114>95).
How important is the EIU Market?
The following analysis indicates the impact of the high density of college students residing near Eastern Illinois University in Charleston, IL. The following analysis is based on a one-square mile grid and models consumer expenditure patterns on dining out at restaurants (2011). Patterns reveal strong variations and clustering of spending in a couple of key, as indicated by green, through the Charleston-Mattoon Market:

The map indicates the following trends about Italian restaurant locations in the region:
1. Most businesses are locating very close to the highest spending consumer markets for restaurants:
2. The highest square mile of consumer spending on restaurants is located on or near the EIU Campus and constitutes a market of over $4.9 million in sales;
3. A strong secondary market of three square miles of higher consumer spending exist in the Mattoon Market in the central and southern region of the City of Mattoon
Does the large the student population near make a difference?
Analysis targeted four hypothetical locations identified as potential targets based on a prior analysis:
1. EIU (Near student housing and administration buildings) 2. Downtown Charleston (Courthouse) 3. Route 16 (Airport) 4. Mattoon-Interstate (Halfway between downtown and interstate)
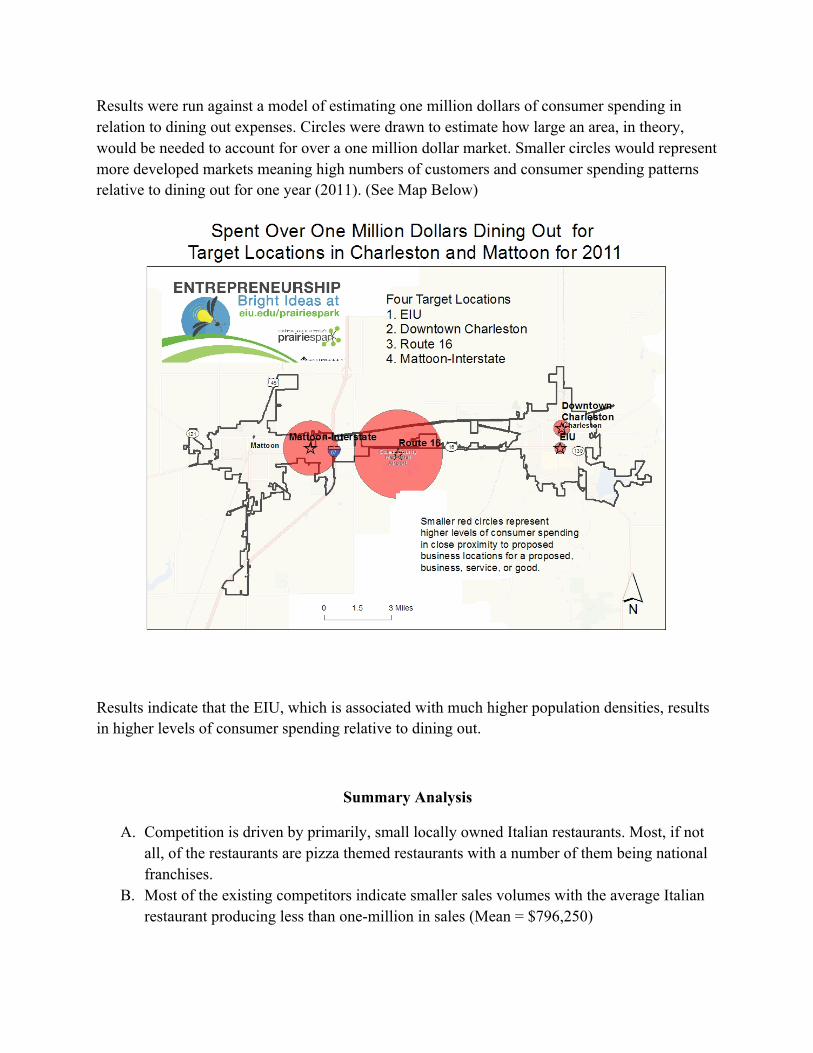
Results were run against a model of estimating one million dollars of consumer spending in relation to dining out expenses. Circles were drawn to estimate how large an area, in theory, would be needed to account for over a one million dollar market. Smaller circles would represent more developed markets meaning high numbers of customers and consumer spending patterns relative to dining out for one year (2011). (See Map Below)
Results indicate that the EIU, which is associated with much higher population densities, results in higher levels of consumer spending relative to dining out.
Summary Analysis
A. Competition is driven by primarily, small locally owned Italian restaurants. Most, if not all, of the restaurants are pizza themed restaurants with a number of them being national franchises.
B. Most of the existing competitors indicate smaller sales volumes with the average Italian restaurant producing less than one-million in sales (Mean = $796,250)

C. Most competitors are located in two key markets along route 16 in Charleston and Mattoon
D. Consumer behavior and expenditure patterns reveal lower family incomes hurt this market. Few areas of the county met the threshold, median family income over $60,000, in the Charleston-Mattoon Market. A couple of markets do exist with incomes above $60,000; however, the Charleston market has more areas meeting the criteria.
E. Key analysis for the study reveals that Charleston consumers are spending MORE on dinging at restaurants, and specifically more money on dining out at Italian restaurants (Olive Garden).
F. Four hypothetical locations were compared for consumer spending on dining out, and the evidence indicates that EIU’s large student population, consumer spending, and residential patterns do favor high rates of spending at restaurants in the targeted region.