Embed Size (px)
Citation preview

Evaluation of Environmentally Superior Technology: Swine Waste Treatment System for Elimination of Lagoons, Reduced Environmental Impact, and Improved Water Quality.
(Solids separation / nitrification-denitrification / soluble phosphorus
removal / solids processing system)
FINAL REPORT
For the NC Attorney General – Smithfield Foods / Premium Standard Farms / Frontline Farmers Agreements
Prepared by Matias Vanotti, PI
USDA-ARS

Project Title: Evaluation of Environmentally Superior Technology: Swine Waste Treatment System for Elimination of Lagoons, Reduced Environmental Impact, and Improved Water Quality.
Project Reference: USDA Agreement 58-6657-2-202 / NCSU Subcontract #2001-0478-02 USDA-ARS CRIS Project # 6657-13630-001-05 Principal Investigator, e-mail and address:
Dr. Matias B. Vanotti [email protected] USDA-ARS Coastal Plains Research Center 2611 W. Lucas St. Florence, SC 29501 Telephone: 843-669-5203 x108
Co-PI’s and address:
Drs. Patrick Hunt1, Ariel Szogi1, Frank Humenik2, and Patricia Millner3 QA Manager: Mrs. Aprel Ellison1 1 USDA-ARS Coastal Plains Research Center, Florence, SC. 2 NCSU, Waste Management Programs, Raleigh, NC. 3 USDA-ARS, Sustainable Systems Laboratory and Environmental Microbial Safety Laboratory, Beltsville, MD.
Duration Dates: 10/01/2001 – 06/30/2002, extended to 12/31/2004 Dates Covered for Report: 10/01/2001 – 5/25/2004
Mention of a trade name, proprietary product, or vendor does not constitute a guarantee orwarranty of the product by the USDA and does not imply its approval to the exclusion of other products or vendors that also may be suitable.2

Table of Contents
Project Title, Investigators, and Dates........................................................................................... 2 Executive Summary......................................................................................................................... 5 Technology Description................................................................................................................... 6 Technology Provider and Cooperating Sub-Contractors ............................................................ 6 Background ...................................................................................................................................... 7 General Operation of the Treatment System ............................................................................. 8 Handling of Liquid Manure in the Barns................................................................................... 8 Objectives.......................................................................................................................................... 9 Results ...............................................................................................................................................10 Permitting and Agreement .........................................................................................................10 Construction...............................................................................................................................10 Sample Collection, Analytical Methods, and Monitoring .........................................................10 Technology Verification Conditions..........................................................................................12 Timeframe...........................................................................................................................12 Weather ...............................................................................................................................13 Livestock and Manure Inventory ........................................................................................14 Loading Rates of Solids and Nutrients ...............................................................................15 Ecopurin Solid-Liquid Separation Module................................................................................16 Background.........................................................................................................................16 Performance Verification of the Solids-Liquid Separation Module ...................................16 Operation ..................................................................................................................16 Polymer Use Efficiency.............................................................................................17 Solids Separation Efficiency .....................................................................................17 Nutrient and Carbon Removal Efficiency .................................................................19 Copper and Zinc Removal Efficiency .......................................................................20 Solids Production......................................................................................................21 Biogreen Nitrogen Removal Module.........................................................................................23 Background.........................................................................................................................23 Performance Verification of the Biological N Removal Module .......................................24 Water and Air Temperatures ....................................................................................24 Nitrogen Loading Rates ............................................................................................25 Acclimation of Bacteria to High Ammonia Conditions ............................................27 Ammonia Removal Efficiency ...................................................................................28 TKN, BOD, and COD Removal ................................................................................28 Five-tank Configuration Without Methanol Injection ..............................................29 Five-tank Configuration With Methanol Injection ...................................................29 Three Tank Configuration.........................................................................................31 Waste Sludge Generated by Biological N Removal System......................................31 Effect of Nitrogen Loading Rate: Pilot Plant Evaluation........................................31 Cold Temperature Effect on Nitrification of Immobilized Bacteria .........................33 Soluble Phosphorus Removal Module.......................................................................................36 Background.........................................................................................................................36 Performance Verification of the Soluble Phosphorus Removal Module............................36 Soluble P Removal Efficiency ...................................................................................36
3

Calcium Phosphate Production ................................................................................38 Effectiveness of Filter Bags for Dewatering.............................................................39 Effluent pH................................................................................................................40 Total Wastewater Treatment System.........................................................................................41 System Performance..................................................................................................42 Reduction of Odor Compounds.................................................................................47 Reduction of Microbial Indicators of Fecal Contamination.....................................47 Electrical Power Use ................................................................................................48 Anaerobic Lagoon Conversion into Aerobic Pond....................................................................49 Conditions Prior to Conversion................................................................................49 Water Quality Changes.............................................................................................51 Odor Changes ...........................................................................................................52 Ammonia Emissions Changes ...................................................................................52 Operational Problems Experienced and Solutions.....................................................................53 Salt Deposits .............................................................................................................53 Electrical Grounding ................................................................................................53 Foaming ....................................................................................................................53 Operator Training.......................................................................................................................53 Process Control and Automation ...............................................................................................54 Second Generation Technology ......................................................................................................54 Conclusions.......................................................................................................................................55 Acknowledgements ..........................................................................................................................55
4

Executive Summary
Systems of treatment technologies are needed that capture nutrients, reduce emissions of ammonia and nuisance odors, and kill harmful pathogens. A system of swine wastewater treatment technologies was developed to accomplish many of these tasks. The project was a collaborative effort involving scientists, engineers and personnel from private businesses, university and USDA. The project addressed one of the nation’s greatest environmental problems – the cleanup and disposal of manure from swine-production wastewater. The system greatly increased the efficiency of liquid/solid separation by injection of polymer to increase solids flocculation. Nitrogen management to eliminate ammonia emissions was accomplished by passing the liquid through a module where immobilized bacteria transformed nitrogen. Subsequent alkaline treatment of the wastewater in a phosphorus module precipitated calcium phosphate and killed pathogens. Treated wastewater was recycled to clean hog houses and for crop irrigation. The system went through full-scale demonstration and verification as part of the Smithfield Foods / Premium Standard Farms / Frontline Farmers - North Carolina Attorney General Agreement to identify technologies that can replace current lagoons with Environmentally Superior Technology. Objectives of this report were to provide critical performance evaluation of the Swine Manure Treatment System to determine if the technology meets the criteria of Environmentally Superior Technology defined in section II.C of the Agreement. Specifically, evaluation of technical and operational feasibility and performance standards related to the elimination of discharge of animal waste into waters and the substantial elimination of nutrient and heavy metal contamination of soil and groundwater. The treatment plant completed design, permitting, construction, startup, and one year operation period under steady-state conditions. The full-scale demonstration facility was installed on a 4,400-head finishing farm in Duplin County, North Carolina. Major goals in the demonstration and verification of the new wastewater treatment system for swine manure at full scale were achieved including replacement of anaerobic lagoon treatment, and consistent treatment performance, with varying solid and nutrient loads typical in animal production, and cold and warm weather conditions. The system used polymer liquid-solid separation technology, nitrification/denitrification technology, and soluble P removal technology linked together into a practical system. The system removed 97.6% of the suspended solids, 99.7% of BOD, 98.5% of TKN, 98.7% of ammonia, 95% of total P, 98.7% of copper and 99.0% of zinc. In less than a year, the anaerobic lagoon that was replaced with the treatment system was converted into an aerobic pond with ammonia concentration in the liquid of < 30 mg/L that substantially reduced ammonia emissions. The treatment system also removed 97.9% of odor compounds in the liquid and reduced pathogen indicators to non-detectable levels. It was verified that the technology is technically and operationally feasible. Based on performance results obtained, the treatment system meets the criteria of Environmentally Superior Technology defined in section II.C of the Agreement on performance standards for the elimination of discharge of animal waste to surface waters and groundwater and for the substantial elimination of nutrient and heavy metal contamination of soil and groundwater.
5
Technology Description: Production Farm Treatment Facility: Waste Stream from Barns → Homogenization Tank → Solid-Liquid Separation with Polymer (Liquid Phase) Nitrification/Denitrification → Clean Water Storage → Recycle to Barns → Excess Treated Water to Phosphorus Removal Module (Marketable Product) → Crop Irrigation. Solids Processing Facility: (Solid Phase) Composting → Curing → Screening → Blending → Marketable Products (Organic Fertilizer, Soil Amendment, and Soilless Media).
Technology Provider: Super Soil Systems USA, Inc
Mr. Lewis M. Fetterman, President and CEO [email protected] 484 Hickory Grove Rd, Clinton, NC 28328 Telephone 910-564-5545 Super Soil Systems Project Scientist: Dr. C. Ray Campbell, Vice President Research & Development
Cooperating Sub-Contractors
Solids-liquid separation (Ecopurin Solids Separation Module) and engineering: SELCO Network, M.C., Castellon, Spain Mr. Jesus Martinez Almela, President and CEO [email protected] SELCO’s Project Engineers: Mr. Jorge Barrera Marza, Design Engineer, New Technologies Division Mrs. Miriam Lorenzo Navarro, Chemical Engineer, Project Management Division Mr. Sergio Carda Mundo, Electrical Engineer, Design & Calculus Division Mr.Fernando Bernal Roures, Mechanical Engineer, Technical Vice President Biological ammonia removal (Biogreen Immobilized Bacteria Module): Hitachi Plant Engineering & Construction Co., Ltd., Tokyo, Japan Mr. Yasunori Nakayama, General Manager, International Sales Dept. [email protected] Hitachi Plant Project Engineers and Scientists: Mr. Hirotaka Horiuchi, General Manager, Water Treatment Division, Overseas Dept. Dr. Bassem Osman, Project Manager, Water Treatment Division, Overseas Dept.
6

Dr. Hiroyoshi Emori, Chief Engineer, Water Treatment Division, Research & Development Dept. Dr. Tatsuo Sumino, Chief Researcher, Matsudo Research Laboratory. Development of international markets for environmentally friendly pork meat and trading: Mitsui & Co., LTD. Tokyo, Japan Mr. Hirofumi Ogawa, Manager, Industrial Systems Division, Solution Equipment Dept. [email protected]
Background:
Systems of treatment technologies are needed that capture nutrients, reduce emissions of ammonia and nuisance odors, and kill harmful pathogens. A system of swine wastewater treatment technologies was developed to accomplish many of the tasks listed above. The system greatly increases the efficiency of liquid/solid separation by injection of polymer to increase solids flocculation. Nitrogen management to reduce ammonia emissions is accomplished by passing the liquid through a module where immobilized bacteria transform nitrogen. Subsequent alkaline treatment of the wastewater in a phosphorus module precipitates calcium phosphate and kills pathogens. Treated wastewater is used for crop irrigation. The system has been pilot tested and went through full-scale demonstration and verification as part of the Smithfield Foods-Premium Standard Farms/North Carolina Attorney General agreement to identify technologies that can replace current lagoons with Environmentally Superior Technology. The full-scale demonstration facility was installed on Goshen Ridge, a 4,400-head finishing farm in Duplin County, NC. The on-farm system used polymer liquid-solid separation, nitrification/denitrification, and soluble P removal technologies. The on-farm system was invented by USDA-ARS scientists (M.B. Vanotti, A.A. Szogi and P.G. Hunt, “Wastewater Treatment System” Serial No 09/903,620 Allowed April 21, 2004, US Patent & Trademark Office). It was constructed and operated by Super Soil Systems USA of Clinton, NC. The project was completed with the centralized solid processing facility at Super Soil Systems USA headquarters in Sampson County, NC, where separated manure solids are subject to aerobic composting and blending processes that produce value-added products such as organic fertilizer, soil amendments, and proprietary soilless media for use in horticultural markets. The following diagram illustrates the treatment system installed on Goshen Ridge farm:
Solid-liquid Soluble EEfffflluueenntt Separation Phosphorus Nitrification
Removal DenitrificationSwine
CCaallcciiuumm Houses SSeeppaarraatteedd PPhhoosspphhaatteessoolliiddssReuse
7

General Operation of the Treatment System Barns (6) were flushed once a week. Typically, half of the barns were emptied on Monday and the other half on Thursday. Flushed manure was pumped into the homogenization tank where it was kept well mixed before solids separation. The solid-liquid separation module produced a solids stream and a liquid stream. The separated solids were removed from the farm every day using trailers, and the liquid effluent was lifted into the nitrogen module. After going through nitrification and denitrification, the effluent from the nitrogen module was discharged into the clean water storage tank and used to recharge pits under the houses. Excess water not used to recharge the pits was gravity fed from the clean water storage tank into the phosphorus module. Treated effluent from the phosphorus module was stored in the existing lagoon before use in crop irrigation. Phosphorus bags were left to dry in a drying concrete pad and removed from the farm on a monthly basis.
Phosphorus separation module
Solid-liquid separation module
Clean water storage tank
Homogenization tank
Handling of Liquid Manure in the Barn The barns used slatted floors and a pit-recCarolina. A significant management chanamount of liquid used for pit recharge wa
Biological nitrogenremoval module
s
harge system typical of many farms in North ge to optimize treatment in this project was that the
s significantly less than typically used in pit-
8

recharge systems. For example, before the new treatment system was installed, pits were refilled with lagoon liquid to the overflow level (23,000 gal/barn on this farm), and additional volume generated by the pigs during the week displaced pit liquid and overflowed into the lagoon. Once a week, the pits were completely emptied (flushed) into the lagoon using a pull-plug device. After the treatment plant was operational, flow of raw manure into the lagoon was discontinued and pits were refilled with treated effluent only. The treated effluent was liquid that received N treatment and stored in the clean water tank. The frequency of flushing (once/week) was maintained, but the pits were not refilled to the overflow level as done before. Instead, refill was stopped by the operator when liquid level was 1 to 2 inches higher than the top of the sloped floor. Pit refill volume during treatment plant operation was low and varied from 2,100 to 6,000 gal/barn. This is only 10 to 25% the amount of liquid previously used in the same pit-recharge system. This management change affected manure to be treated in two ways: 1) Flushed manure had significantly higher strength, and 2) Volume of manure to be treated was significantly reduced. Refilling was done immediately after a barn was flushed; refill flow rate was 100 gpm. After pulling the plug, liquid manure first flowed into an underground pit serving all six barns that was placed between barns 2 and 3. From there, liquid manure was quickly (500 gpm) pumped into the homogenization tank.
Objectives: To provide critical performance evaluation of the Swine Manure Treatment System and Solids Processing Technologies in Proposal #001 Project Award, NC Attorney General/Smithfield Foods & Premium Standard Farm Agreements, to determine if the technology meets the criteria of Environmental Superior Technology defined in section II.C of the Agreement. Specifically, evaluation of technical and operational feasibility and performance standards related to the elimination of discharge of animal waste to surface waters and groundwater, and for the substantial elimination of nutrient and heavy metal contamination of soil and groundwater. Performance verification of the wastewater treatment facility component was completed and it is summarized in this report for the initial phase of Technologies Determinations July 2004. Due to technology start-up delays, performance verification of the solids processing facility component will be covered in a separate report and targeted for a subsequent Technology Determination date.
9

Results: 1. Permitting and Agreements
All necessary agreements and State permits for installation and operation of the treatment facilities at Goshen Ridge farm and Hickory Grove Rd. farm were completed.
2. Construction
2.1 Solids Processing Facility (Hickory Grove) Construction and installation of the Solids Processing Facility was completed Nov. 2003. These include: o Soil blending building. o Concrete pad (250 x 40 ft), compost bins and roof. o Automated composting machinery. 2.2 Production Farm Treatment Facility (Goshen Ridge)
Construction and installation of the wastewater treatment facility at Goshen Ridge farm started in February 2002 and were completed in October 2002. Construction details were provided in the progress report of July 25-Oct. 24, 2002.
3. Sample collection, analytical methods, and monitoring
Liquid samples were collected using four refrigerated automated (Sigma 900max) samplers placed before and after each of the treatment modules as follows: 1) the untreated liquid manure in the mixing tank before solids separation, 2) the effluent from the solid-liquid separation treatment, 3) the effluent after the nitrification-denitrification treatment, and 4) the effluent after the phosphorus removal treatment. Each sample was the composite of four sub-samples taken over a 3.5-day period. The exception was during the first five weeks of evaluation of the separation module when the automated samplers were programmed to take samples twice a day (3 am and 3 pm) and the samples were combined daily to evaluate separation process stability and mixing conditions of the homogenization tank. After TSS analyses, these samples were combined in the laboratory into two weekly samples for the other water quality determinations. Grab samples were also taken weekly at intermediate points of the nitrogen system. Samples of lagoon supernatant liquid were obtained monthly from each of the three lagoons in the farm; a sample was collected by combining eight sub-samples taken around a lagoon. Once a week, liquid and solids samples were transported on ice to the ARS Florence laboratory for analyses. For the separated solids, we collected one sample from each trailer leaving the farm. After moisture determination, the solid samples from individual trailers were combined into two weekly samples for chemical analyses. Bulk density of solids was measured 23 times throughout the evaluation with calibrated, 5-gal. buckets and used for solids production determinations. For phosphorus product, all bags produced up to Jan 15, 2004, were weighed
10

at the storage facility on Feb. 2, 2004. For chemical and moisture determinations of the phosphorus product, we sampled 20% of the bags that included each batch of bags produced at the farm. Wastewater analyses were performed according to Standard Methods for the Examination of Water and Wastewater (APHA, AWWA & WEF, 1998). Solids analyses of the treated and untreated liquid samples included total solids (TS), total suspended solids (TSS), and volatile suspended solids (VSS). Total solids are the solids remaining after evaporation of a sample to constant weight at 105°C and include TSS and dissolved solids (DS). Total suspended solids (TSS) are the solids portion retained on a glass microfiber filter (Whatman grade 934-AH, Whatman, Inc., Clifton, N.J.) after filtration and drying to constant weight at 105°C, while volatile suspended solids (VSS) is the fraction of the TSS that was lost on ignition in a muffle furnace at 500°C for 15 min. Therefore, the TSS and VSS are measurements of the insoluble total and volatile solids that are removable by separation.
Chemical analyses consisted of pH, electrical conductivity (EC), chemical oxygen demand (COD), 5-d biochemical oxygen demand (BOD5), ammonia-N (NH3-N), total Kjeldahl N (TKN), orthophosphate-P (PO4), and total P (TP). For COD, we used the closed reflux, colorimetric method (Standard Method 5220 D). The orthophosphate (PO4-P or soluble P) fraction was determined by the automated ascorbic acid method (Standard Method 4500-P F) after filtration through a 0.45-µm membrane filter (Gelman type Supor-450, Pall Corp., Ann Arbor, Mich.). The same filtrate was used to measure NH4-N by the automated phenate method (Standard Method 4500-NH3 G), NO3-N by the automated cadmium reduction method (Standard Method 4500-NO3
- F), and soluble COD. Particulate COD is the difference between COD and soluble COD determinations. Total P and TKN were determined using the ascorbic acid method and the phenate method, respectively, adapted to digested extracts (Technicon Instruments Corp., 1977). The organic P fraction is the difference between total P and PO4 analyses and includes condensed and organically bound phosphates. The organic N fraction is the difference between Kjeldahl N and ammonia-N determinations. Alkalinity was determined by acid titration to the bromocresol green endpoint (pH=4.5) and expressed as mg CaCO3 L-1. Microelements were measured in acid digestion extracts using inductively coupled plasma (ICP) analysis. Solids samples were analyzed for moisture content using a microwave moisture analyzer. Dry samples were digested with concentrated acid and the extracts were analyzed for TKN and TP with the automated method described before. Carbon content was determined using a LECO dry combustion analyzer. Microelements in the solids were measured by ICP analysis after acid digestion. A chromatographic method developed by ARS was used to measure concentration of malodorous compounds contained in liquid passing through the treatment system and in each of the three lagoons. Briefly, water samples (40 mL) were centrifuged and the supernatant was passed through extraction columns containing 100 mg of Tenax TA (Supelco Inc.) The columns were rinsed with 2 mL of deionized water and dried with a stream of high-purity N2. Retained compounds were eluted into 2-mL vials with 400 µL of a 50:50 mixture of CH2Cl2:hexane. Individual key odor compounds in the samples were identified by mass
11

spectral analysis (GC-MS). Levels of these compounds were quantified relative to external standards of the compounds obtained from commercial sources. Microbiological analyses of liquid samples were done in the laboratory of Dr. Patricia Millner in Beltsville, MD using the standard protocols for pathogens and indicator microbes for the examination of wastewater. Ammonia emissions from the lagoons were measured with the passive flux sampler method (Sommer et al., 1996, J. Environ. Qual. 25:241-247). Ammonia samplers were mounted at four heights (0.75, 1.50, 2.25 and 3.00 m) in duplicate, on each of four masts, and placed perpendicular to each other around a lagoon. The method separated NH3 emissions from the lagoon surface and its surroundings. Each sampler consisted of two connected glass tubes coated on the inside with oxalic acid to absorb NH3. The absorbed NH3 was extracted in the laboratory and analyzed using Standard Method 4500-NH3 G. Ammonia emission rate was determined by integration of horizontal and vertical fluxes using mass balance equations. Volume of flushed manure was measured with a Doppler flowmeter mounted on the pipe that transported manure from the barns into the homogenization tank. The meter was calibrated using the actual volume collected in the homogenization tank so that both measures were the same. Actual volume was calculated using measurements of liquid height before and after emptying manure from a barn, and area of the tank. Volume of manure used to refill barn pits was measured using a paddlewheel flowmeter on the pipe that connected the clean water storage tank and the barns. This flowmeter was checked against changes in volume in the clean water storage tank using a level sensor or manual height measurements before and after refilling the barns. Sensors in the plant were connected to the PLC used for plant automation and then to a SCADA network (Monitor Pro, Schneider Automation, Inc.) and field computer that stored monitoring and process data every five minutes.
4. Technology Verification Conditions
4.1 Timeframe
Performance verification started March 1, 2003, with the solids separation unit fully operational. The nitrogen module was brought in-line April 1, 2003. The phosphorus module was started last on April 15, 2003. The complete system was continuously operated until January 15, 2004, coinciding with the end of the 2nd OPEN team (cold weather) evaluation. Operation was stopped for two weeks to change the configuration of the nitrogen module and restarted February 1, 2004. We evaluated the system performance with this new configuration for an additional month until March 1, 2004.
12

4.2 Weather Performance evaluation included cold and warm weather conditions with average daily air temperatures ranging from -4.2 to 31.1oC (24.4 to 88.0oF) (Figure 1).
-10
-5
0
5
10
15
20
25
30
35Ja
nFe
bM
arA
prM
ay Jun
Jul
Aug Sep
Oct
Nov Dec Jan
Feb
Air
Tem
pera
ture
(o C)
Daily MAXDaily MINAverage
Figure 1: Air temperature during Jan 2003-Feb 2004. Data are Max and Min of average daily temperatures and monthly average of average daily temperatures.
13

4.3 Livestock and Manure Inventory New batches of pigs were received Jan-Feb 2003, June-July 2003, Nov-Dec, 2003, and March 2004. These pigs did not receive antibiotics and the meat was marketed with a different label indicating this change. Pig inventory and weight data are summarized in Table 1. Total pig weight varied greatly within production cycles from a low of about 200-300 Animal Units (1 AU=1000 lb) to a high of about 750 to 800 AU. Average manure production varied from 8,100 to 14,600 gallons per day (Table 1). Volume production was generally higher in warmer months. A total of 3.34 million gallons of flushed manure were processed from March 1, 2003 to Jan. 15, 2004, or an average of 10,300 gallons per day. On the average, the flushed manure contained 33.7% recycle treated water (used to refill the pits) and 66.3% manure and wasted water (urine, feces, water wasted by pigs). The manure and wasted water production (flushed manure – pit recharge, Table 1) averaged 7,137 gal/day or 13.9 gal/1000 lb/day (Apr. to Jan.). This average is consistent with the table value of 12.1 gal/1000 lb/d for manure and wasted water production in feeder-to-finish operations provided by Chastain et al. (Ch. 3, Confined Animal Manure Managers Certification Program, Clemson University,1999). Although the table value works well with a 10-month average, it poorly predicts the monthly variations of manure and wasted water volume observed, suggesting that other factors such as changes in diet, water consumption, or temperature are needed to explain monthly volume variations.
Table 1: Inventory of pigs and manure volume generation at Goshen Ridge farm (Barns 1 to 6) during evaluation period Mar 2003-Jan 2004. Pig inventory records provided by farmer (Premium Standard Farms). Manure volumes measured by evaluation team. Flushed manure is the average daily volume of the total volume received in the homogenization tank each month. Pit recharge is the average daily volume of the total volume of treated manure recycled to the barns each month. January information is for the first 15 days.
Pigs and manure information Mar Apr May Jun Jul Aug Sep Oct Nov Dec Jan
Number of pigs 3978 3975 3441 978 2787 4115 4015 3749 2831 4120 3814
Weight/pig (lb)
114 175 224 186 46 106 167 216 145 100 137
Total Weight (lb x 1000)
454 697 764 270 191 436 671 805 328 410 520
Flushed Manure (gpd x 1000)
8.1 8.6 9.6 9.5 11.4 11.9 14.6 12.7 8.8 9.5 9.0
Pit Recharge (gpd x 1000)
-- 5.1 4.7 4.7 4.4 2.1 2.3 4.0 1.8 2.8 2.3
14

4.4 Loading Rates of Solids and Nutrients Loading rates of solids and nutrients into the system were well correlated with changes in total pig weight (Figure 2, A and B). Nitrogen production averaged 0.29 lb N/1000 lb/day but varied from 0.18 to 0.42 lb N/1000 lb/day. A value of 0.42 (provided by SCS National Engineering Waste Management Handbook) was used for design of the nitrogen module in this project. Suspended solids production averaged 1.93 lb TSS/1000 lb/day (range 1.1-3.4). This is significantly lower than the value of 5.05 lb TSS/1000 lb/day used for project design, also from the SCS reference. Two conclusions are derived from this new information: 1) Sizing of the nitrification tank was appropriate to handle the highest N load, and 2) Sizing of the separation module and polymer demand projections were both overestimated.
0
100
200
300
400
500
600
700
800
900
MA
R
AP
R
MA
Y
JUN
JUL
AU
GS
EP
OC
T
NO
V
DE
C
JAN
Tota
l pig
wei
ght (
lb x
100
0)
0
10
20
30
40
50
60
70
80
90
Tota
l Nitr
ogen
Loa
d (k
g/da
y)
Total N load
0
100
200
300
400
500
600
700
800
900
MA
RA
PR
MA
YJ U
N
J UL
AU
GS
EP OC
TN
OV
DE
C
J AN
Tota
l Pig
Wei
ght (
lb x
100
0)
0
400
800
1,200
TSS
load
(lb/
day)
TSS load
Figure 2: Changes in Total Nitrogen (A) and Suspended Solids (B) loading rates into the treatment system as affected by total pig weight in the barns (shown in blue color).
15

5. Ecopurin Solid-Liquid Separation Module
Background: In contrast to systems that use slow anaerobic digestion of waste in lagoons, systems that use quick separation of solids and liquids can conserve much of the organic fraction of animal waste. However, to effectively recover the solids, some form of flocculation must be used. Polyacrylamides were found to be effective. The solids in the treatment facility are separated from the liquid with the Ecopurin separation module developed by a Spanish company, Selco MC. The module is contained in a separation building. It is fully automated through the use of a programmable logic controller (PLC) for 24 hr/day operation. Treatment parameters such as polymer rate, wastewater flow, and mixing intensity are set by the operator using a tactile screen in the control panel. In the main module, the liquid manure is reacted with polymer and separated with a self-cleaning rotating screen. Subsequently, a dissolved air flotation unit (DAF) polishes the liquid effluent while a small filter press dewaters the solids. The dewatered solids fall in a 120-ft3 trailer and are transported daily to the central processing plant. The separated liquid is discharged into a small concrete pit where it is continuously pumped into the biological N removal module for further treatment.
Performance Verification of the Solids-Liquid Separation Module Operation During the first 1.5 months of evaluation, the separation module operated at a flow rate of 2.5 m3/h. Although this rate was half the design capacity of the separation module (5 m3/h), the amount of raw manure was insufficient for a 7-days-per-week operation and the flow rate was further reduced to 2 m3/h during the remainder of the evaluation (10.5 months). This was important in order to provide continuous flow to the biological module and optimize the total system. The exception was during a period of five days before hurricane Isabel landed in NC (9/18/03); flow was doubled (4 m3/h) to process manure in advance in all houses and create additional (3 weeks) manure storage capacity in the pits under the houses if needed for extended power blackout.
16

Polymer Use Efficiency Rate of polymer application was calculated based on volume of manure that was flushed each month and corresponding amount (50 lb bags) of polymer used in the separation process. The application rate varied from 106 ppm to 178 ppm (average = 135.8 ppm) as a consequence of fluctuations in wastewater strength during production cycles. Polymer use efficiency rate based on solids removal increased with wastewater strength (Figure 3). For example, polymer use efficiency increased from 32 g TSS separated/g polymer (3.04 g polymer/100 g TSS) to 190 g TSS separated/g polymer (0.56 g polymer/100 g TSS) with changes in TSS concentration from 4.90 to 23.7 g/L (monthly averages). Thus, it is more economical to treat higher strength flushed manure. The average polymer use efficiency obtained during the evaluation (3/03 to 1/04) was 76.8 g TSS separated/g polymer (1.63 g polymer/100 g TSS).
020406080
100120140160180200
0 4 8 12 16 20 24 28
Total Suspended Solids (g/L)
Poly
mer
Use
Effi
cien
cy
(g T
SS S
epar
ated
/g P
AM)
Figure 3: Effect of wastewater strength on polymer use efficiency. Data shown are monthly averages for the period 3/03-1/04. (Polymer use efficiency = -10.9 + 8.16 TS, R2 = 0.94).
Solids Separation Efficiency Data in Figure 4 show the TSS separation efficiency of the module obtained during first 5-wk of evaluation when samples were taken daily to evaluate process stability and confirm that liquid manure in homogenization tank was well mixed between the two weekly flushes. Separation efficiency was consistently high with an average of 94% TSS separation. This high-separation efficiency was maintained during the remainder of the evaluation even though strength of the liquid manure varied greatly from about 0.4% to 2.8% TSS (Figure 5 and Table 2).
17

02000400060008000
10000120001400016000
1 4 7 10 13 16 19 22 25 28 31 34
Days
mg/
L
0
25
50
75
100
%
TSS In TSS Out % Effic.
Figure 4: Total suspended solids (TSS) removal efficiency of the solid-liquid separation module during first five weeks of evaluation. 24-h samples taken at 3 am and 3 pm.
Figure 5: Total suspended solids (TSS) concentration in liquid swine manure before and after solid-liquid separation treatment with Ecopurin process during one year of performance evaluation.
18

Nutrient and Carbon Removal Efficiency Treatment performance of the separation module for a variety of water quality parameters is summarized in Table 2. The process separated most of the suspended solids, oxygen demanding compounds, and organic nutrients associated with these solids. Reduction of organic compounds such as COD is an important consideration for the efficiency of the nitrification treatment, while capture of carbon and organic nutrients is important for the efficiency of the solids processing operation. Separation efficiency of nutrients was improved with treatment of higher strength wastewater. For example, the TKN and TP separation efficiencies obtained with effluent containing lower than average TSS concentration (< 11,072 mg/L, Table 2) were 36% and 66%, respectively. On the other hand, efficiencies obtained with effluent containing higher than average TSS concentration increased to 43% for TKN and 72% for TP. Soluble ammonia and soluble phosphate concentrations changed little (< 4 and 11% reduction, respectively) with separation treatment. In contrast, organic N and P were effectively captured in the solids resulting in average concentration reductions of 84 and 90%, respectively (Table 2).
Figure 6: Total phosphorus (TP) concentration in liquid swine manure before and after solid-liquid separation treatment with Ecopurin process during one year of performance evaluation.
19

The separation module removed 2/3 of the total P contained in the flushed manure (Figure 6). The treatment was more effective separating P than N. The N:P ratio of the effluent was improved from 3.2 to 5.8, resulting in a more balanced effluent for crops if no further treatment is applied.
Table 2: Removal of solids, nutrients, oxygen demanding compounds, metals, and heavy metals from liquid swine manure by solid-liquid separation module (Ecopurin process). Data are means (± standard deviation) of one-year evaluation (March 1st , 2003 – March 1st , 2004, n=135).
Water Quality
Parameter
Raw Liquid
Swine Manure mg/L (± s.d)
Liquid After Solids Separation
Treatment mg/L (± s.d)
Reduction Efficiency
(%) Total Suspended Solids (TSS) 11,072 (5,660) 766 (392) 93
Volatile Suspended Solids (VSS) 8,100 (4,804) 558 (282) 93
Chemical Oxygen Demand (COD) 16,881 (9,058) 3,957 (2,390) 77
Particulate COD 13,321 (8,119) 1,252 (838) 91
Biochemical Oxygen Demand (BOD5) 3,405 (2,495) 1,311 (1,244) 61
Total Kjeldahl Nitrogen (TKN) 1,617 (557) 988 (322) 39
Organic Nitrogen 714 (314) 112 (88) 84
Total Phosphorus 573 (215) 170 (44) 70
Organic Phosphorus 436 (189) 45 (32) 90
Sulfur 142 (62) 27 (12) 81
Calcium 269 (123) 60 (24) 78
Magnesium 198 (88) 24.5 (20.3) 88
Zinc 25.9 (11.3) 1.5 (1.9) 94
Copper 26.2 (11.5) 1.5 (1.7) 94
Iron 90.4 (40.5) 6.4 (6.5) 93
pH 7.60 (0.19) 7.91 (0.15)
Electrical Conductivity (mS/cm) 10.44 (3.09) 10.39 (2.88)
Copper and Zinc Removal Efficiency Also important to this project was the separation of heavy metals, especially copper and zinc. Results indicate that most of the copper and zinc in the liquid swine manure were efficiently removed (94%) from the liquid phase using the solid-liquid separation module (Table 2 and Figure 7).
20

Figure 7. Copper and zinc concentration in liquid swine manure before and after solid-liquid separation treatment with Ecopurin process. Data shown are weekly averages of two composite samples.
Solids Production A total of 259 trailers containing 748 m3 of separated solids were produced and left Goshen Ridge farm in a 10.5-month period from March 1, 2003, to Jan 15, 2004. This amount of manure weighed approximately 596,200 kg (1,314,300 lb or 657 tons) and contained 18.2% (± 1.3%) of solids (81.8% moisture), 40,805 kg of carbon, 5,379 kg of nitrogen, 3,805 kg of phosphorus, 280 kg of copper, and 281 kg of zinc (Table 3). Mass balance calculations showed that the amount of manure that left the farm in trailers agreed with predicted amount of solids separated based on wastewater flow and TSS concentration before and after separation treatment (Figure 8).
21

Table 3: Amount and composition of solids produced from separation treatment (Ecopurin process). Concentration values are on a dry manure basis. Data are means (± standard deviation) and totals obtained March 1, 2003-January 15, 2004, n=74.
Element
Average Concentration
% (± s.d.)
Min-max Concentration
%
Total produced
kg Total Nitrogen 4.96 (0.66) 3.49-6.26 5,379
Total Phosphorus 3.51 (0.59) 2.46-4.99 3,805
Copper 0.26 (0.04) 0.20-0.38 280
Zinc 0.26 (0.05) 0.16-0.37 281
Total Carbon 37.62 (2.33) 33.18-43.11 40,805
Potassium 0.83 (0.15) 0.51-1.17 902
Calcium 2.17 (0.24) 1.66-2.81 2,360
Magnesium 1.89 (0.21) 1.54-2.38 2,052
Sulfur 1.01 (0.19) 0.62-1.39 1,097
0
100
200
300
400
500
600
700
800
MAR APR MAY JUN JUL AUG SEP OCT NOV DEC JAN
S
olid
s S
epar
ated
(Ton
)
Trailer Measurements
TSS removal * Flow calculation
Figure 8: Separated manure solids that left Goshen Ridge farm from March 1, 2003, to Jan. 15, 2004. Data compare trailer measurements with predicted amount of solids separated based on wastewater flow and TSS concentration before and after separation treatment. 1 Ton=2,000 lb.
22

6. Biogreen Nitrogen Removal Module
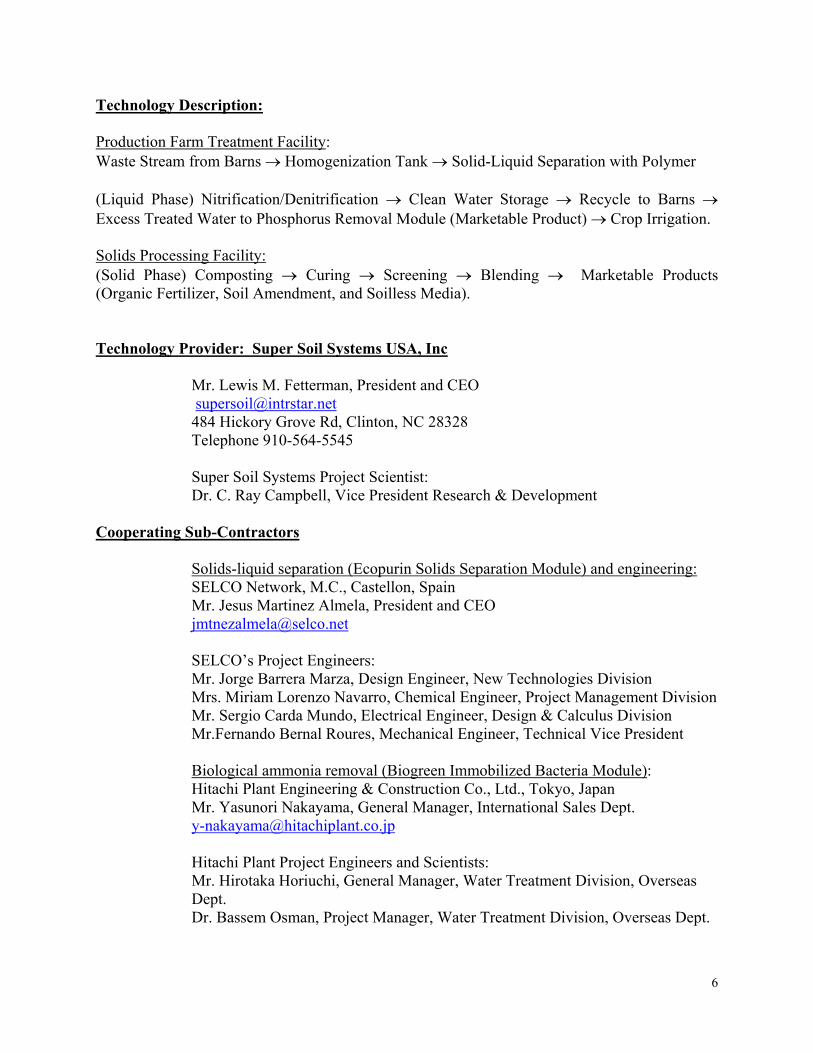
Background: Once the solids are removed, a relatively smaller amount of suspended organic waste remains to be treated in the wastewater by the nitrification/denitrification. The liquid contains significant amounts of soluble ammonia and phosphorus. The demonstration project uses a Biogreen process (Hitachi Plant Engineering & Construction Co., Tokyo, Japan) that biologically removes the ammonia-N. The process has a pre-denitrification configuration where nitrified wastewater is sent through a denitrification cycle to remove most (> 80%) of the nitrate using the soluble carbon (COD) contained in the manure after separation. A unique feature of the process is that the concentration of bacterial biomass in the nitrification tank is increased by using nitrifying bacteria encapsulated in polymer gel pellets. These pellets are permeable to ammonia and oxygen needed by the nitrifiers and are kept inside the tank by means of a screen structure. The reaction tank at Goshen contains 12 m3 of the nitrifying pellets. There is a second denitrification tank built into the system where methanol can be injected for reducing the remainder nitrate in the effluent. Effective water volume of the installed tanks was: Denitrif. #1= 263 m3, Nitrification= 110 m3, Denitrif. #2= 110 m3, Oxic= 21 m3, Settling=33 m3, and Effluent storage tank = 299 m3 .
The following diagram illustrates the biological N removal module installed:
Nitrified Liquor Recycling Settling P-module Tank
Separated Effluent Waste- BB BB water
House Denitrification
Nitrification Oxic Pit Tank Tank Denitrification
RechargeTank 1Return Sludge
Tank 2
23
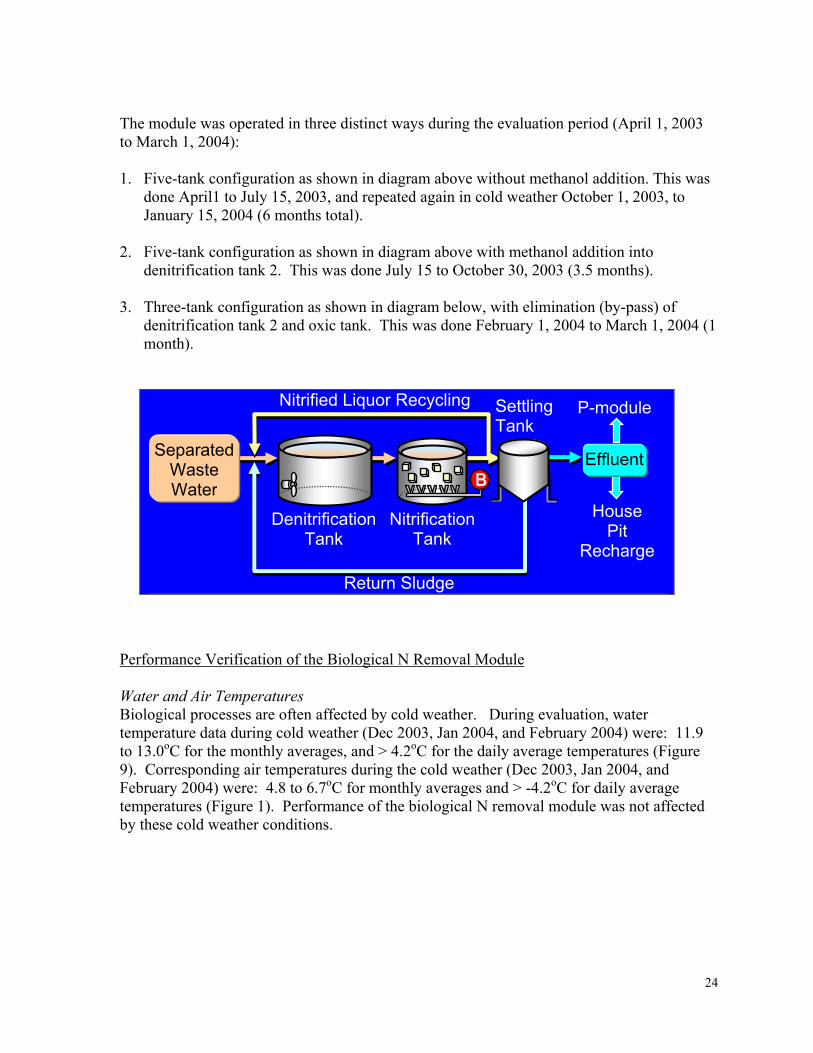
he module was operated in three distinct ways during the evaluation period (April 1, 2003
. Five-tank configuration as shown in diagram above without methanol addition. This was
. Five-tank configuration as shown in diagram above with methanol addition into
. Three-tank configuration as shown in diagram below, with elimination (by-pass) of
04 (1
Tto March 1, 2004): 1
done April1 to July 15, 2003, and repeated again in cold weather October 1, 2003, to January 15, 2004 (6 months total).
2denitrification tank 2. This was done July 15 to October 30, 2003 (3.5 months).
3denitrification tank 2 and oxic tank. This was done February 1, 2004 to March 1, 20month).
Effluent
P-module Settling
Denitrification
Return Sludge
Nitrification
Separated
BB
House
Recharge
erformance Verification of the Biological N Removal Module
Nitrified Liquor Recycling Tank
Waste Water
Pit Tank Tank
P
ater and Air Temperatures affected by cold weather. During evaluation, water
e: 11.9
ted
WBiological processes are oftentemperature data during cold weather (Dec 2003, Jan 2004, and February 2004) werto 13.0oC for the monthly averages, and > 4.2oC for the daily average temperatures (Figure 9). Corresponding air temperatures during the cold weather (Dec 2003, Jan 2004, and February 2004) were: 4.8 to 6.7oC for monthly averages and > -4.2oC for daily averagetemperatures (Figure 1). Performance of the biological N removal module was not affecby these cold weather conditions.
24

0
5
10
15
20
25
30
35
40
Feb
Ma
Apr Ma
Jun
Jul
Aug Sep
Oct
Nov
Dec Ja
nFe
b
Wat
er T
empe
ratu
re (
o C)
Daily MAXDaily MINAverage
Figure 9: Water temperature in nitrification tank during Jan 2003-Feb 2004. Data are Max and Min of average daily temperatures and monthly average of average daily temperatures.
Nitrogen Loading Rates Nitrogen loading rates to the nitrogen module fluctuated greatly (150%) within production cycles (Figure 10 A). These loading fluctuations were well predicted by changes in total pig weight in the barns (Figure 10 B). Total N loading rate averaged 37 kg/day and varied monthly from 20 to 50 kg/day. Ammonia-N loading rate averaged 32 kg/day and varied monthly from 18 to 45 kg/day. The immobilized bacterial system responded well to these highly changing conditions as evidenced by performance (Tables 4 to 6).
0
150
300
450
600
750
900
MA
RA
PR
MA
YJU
N
JUL
AU
G
SEP OC
TN
OV
DE
C
J AN
Tota
l Pig
Wei
ght (
lb x
100
0)
0.00
10.00
20.00
30.00
40.00
50.00
60.00
Nitr
ogen
load
(Kg/
day)
NH4 loadTKN load
A
25

TKN = 0.0395x + 16.883
NH4 = 0.0379x + 13.22
0
10
20
30
40
50
60
0 200 400 600 800 1000
Pig weight (lb x 1000)
Nitr
ogen
load
(Kg/
day)
TKN load NH4 loadB
Figure 10: (A) Changes in Total Kjeldahl Nitrogen (TKN) and Ammonia (NH4-N) loading rates into the biological N removal module during evaluation compared to changes in total pig weight in the barns (blue line), and (B) Correlation between TKN and NH4-N loading rates into the biological N removal module and total pig weight in the barns.
0
300
600
900
1,200
1,500
1,800
APR
MA
Y
JUN
JUL
AU
G
SEP OC
T
NO
V
DE
C
JAN
Tota
l Pig
Wei
ght (
lb x
100
0)
0
20
40
60
80
100
120N
itrog
en lo
ad (K
g/da
y)
NH4 loadTKN load
Figure 11. Predicted N loading into the biological N removal module in an operation with 12 barns and twice the number of pigs. Calculations used actual pig weight records for barns 1-6 and the same pig weight records but with a 2-month lag for the new barns (7-12). N loadings were calculated using equations in Figure 10 (B) applied to pig weight data in both units (barns 1-6 and 7 to 12). Data shown are the totals for pig weight (blue line) and N loadings.
26

Data in Figure 10 (A) also suggest that the N loading fluctuations can be controlled if pig production cycles are gradually distributed among barns. This is important because sizing of N treatment systems are based on maximum loadings, and elimination of N peaks will result in smaller size systems. For example, we made calculations to predict the total N loading into the N module in an operation having twice the number of pigs (12 barns instead of 6), but half of the new pigs arrive in barns 1-6 in January and the other half in barns 7-12 in March (two-month difference). Results of these calculations show a more stabilized system with reduced N load fluctuations (from 150% to about 36%) during the year (Figure 11). Predicted total N loading after doubling the numbers of pigs was 71 kg/day in the average and varied monthly from a low of 62 to a high of 83 kg/day. Predicted ammonia-N loading averaged 63 kg/day and varied monthly from a low of 53 to a high of 73 kg/day.
Acclimation of Bacteria to High Ammonia Conditions Once the proper mixers and recirculation equipment were in place and tanks filled with wastewater, it took about four weeks for the nitrifying bacteria to be fully acclimated to the high-strength swine wastewater (Figure 12). Acclimation process was carried out in a stepwise procedure where flow loads were increased from 25% of the flow being processed by the separation module to 100% (full-scale). Ammonia concentration in the effluent was monitored daily during this acclimation period using quick kit tests that were confirmed in the laboratory on a weekly basis. Pellets were sampled every week to conduct nitrification and respiration activity tests done in bench reactors also in the laboratory at Florence. For design purposes, pellets were considered fully acclimated with an activity of 6 kg N/m3-pellet/day (Figure 12) that is equivalent to a nitrification capacity of 72 kg N/day in the treatment module.
Figure 12: Nitrification activity of pellets during acclimation to swine wastewater.
0123456789
25-M
ar1-A
pr8-A
pr
15-A
pr
22-A
pr
29-A
pr6-M
ay
Kg
NO
3-N
/ m
3-pe
llets
/day
Tank
s fil
led,
new
mix
ers
on
Rec
ircul
atio
n st
arts 25% flow 100% flow75% flow50% flow
27

Ammonia Removal Efficiency Ammonia removal efficiencies of the Biogreen process were consistently high (> 95%) during both the first month acclimation period and the subsequent 10 months evaluation (Figure 13). These high process efficiencies were obtained with influent ammonia concentrations varying from 400 to 1500 mg/L and loading rates varying from about 20 to 50 kg N/day.
Figure 13: Ammonia (NH4-N) and Total Kjeldhal Nitrogen (TKN) concentration in liquid swine manure before and after biological N treatment. Influent is the liquid after solids separation.
TKN, BOD and COD Treatment After solids separation, most of the TKN was made of soluble ammonia; and, therefore, removal efficiencies for TKN were also high (> 95%). Influent TKN concentration varied from 460 to 1730 mg/L (Figure 13). The treatment also significantly reduced alkalinity, volatile solids, BOD, and COD concentrations in the liquid effluent (Table 4). Reduced manure carbon compounds were consumed mostly in the first denitrification tank and used as an electron donor in the denitrification process. Ratio COD/N of 5.4:1 was very favorable for denitrification. On the average, 94% of the soluble COD and 88% of the soluble BOD that were removed by the biological treatment were consumed in the first denitrification tank.
28

Five-tank Configuration Without Methanol Injection During 6 months, methanol was not injected into the second denitrification tank; and, as a result, some oxidized-N (average 237mg/L) remained in the effluent. Oxidized-N fraction was made of 33 mg/L nitrite and 204 mg/L nitrate. The hypothesis was that additional denitrification could be obtained in the pits under the houses when fresh manure was combined with the treated effluent used to refill these pits. Recycle volume to barns was 33% of the total effluent from the N module. Results showed that oxidized N (nitrate + nitrite) in the refill water was eliminated under the houses and that the liquid contained 1 mg/L of oxidized-N after this loop. On a mass balance basis, 21.4 kg N/week were removed through denitrification under the houses. Therefore, total mass N removal by nitrogen system was 81%.
Table 4: Removal of TKN, ammonia, and oxygen-demanding compounds from separated liquid swine manure by biological N removal module (Biogreen process) using five-tank configuration (DN1, Nitrification, DN2, Oxic, and Settling) and no methanol added. Data are averages of 5.5-month evaluation (April 10, 2003, to July 15, 2003; and Nov. 1, to Jan. 15, 2004, n=62).
Water Quality
Parameter
Liquid After Solids Separation
Treatment (mg/L)
Liquid After Biological N
Treatment (mg/L)
Concentration Reduction Efficiency
(%) Alkalinity (mg/L) 4,564 459 90
Volatile Suspended Solids (VSS) 637 82 87
Chemical Oxygen Demand (COD) 4,404 672 85
Biochemical Oxygen Demand (BOD5) 1,520 27 98
Soluble BOD5 813 6 99
Total Kjeldahl Nitrogen (TKN) 1,005 28 97
Ammonia Nitrogen (NH4-N) 887 16 98
Oxidized N (NO3-N + NO2-N) 1 237 --
Total N (TKN + Oxidized N) 1,006 265 74
pH 7.88 7.17 --
Five-tank Configuration With Methanol Injection Performance data of the nitrogen system when methanol was added to the second denitrification tank (July 15-Oct. 30, 2003) are shown in Table 5. Average nitrate + nitrate concentration in the effluent was 208 mg/L (99% nitrate and 1% nitrite). Thus, goals of total oxidized-N elimination were not met. The period was characterized by low strength wastewater with low COD/N ratio (2.7:1). Methanol operation was difficult under highly changing conditions related to pig production cycles, which resulted in an underestimation of the amount of chemical needed. For these reasons, methanol addition was discontinued in the operation, and the system was further modified to remove unnecessary tanks.
29

Table 5: Removal of TKN, ammonia, and oxygen-demanding compounds from separated liquid swine manure by biological N removal module (Biogreen process) using five-tank configuration (DN1, Nitrification, DN2, Oxic, and Settling) and methanol added into DN2. Data are averages of 3.5-month evaluation (July 15, 2003, to Oct. 30, 2003, n=45).
Water Quality
Parameter
Liquid After Solids Separation
Treatment (mg/L)
Liquid After Biological N
Treatment (mg/L)
Reduction Efficiency
(%) Alkalinity (mg/L) 3,636 505 86
Volatile Suspended Solids (VSS) 484 57 88
Chemical Oxygen Demand (COD) 2,154 491 77
Biochemical Oxygen Demand (BOD5) 384 35 91
Soluble BOD5 210 7 97
Total Kjeldahl Nitrogen (TKN) 811 44 95
Ammonia Nitrogen (NH4-N) 707 38 95
Oxidized N (NO3-N + NO2-N) 0 208 --
Total N (TKN + Oxidized N) 811 252 69
pH 7.93 7.31 --
Table 6: Removal of TKN, ammonia, and oxygen-demanding compounds from separated liquid swine manure by biological N removal module (Biogreen process) using streamlined three-tank configuration (DN1, Nitrification, and Settling). Data are averages of one-month evaluation (Feb. 1, 2004, to March 1, 2004, n=13).
Water Quality
Parameter
Liquid After Solids Separation
Treatment (mg/L)
Liquid After Biological N
Treatment (mg/L)
Reduction Efficiency
(%) Alkalinity (mg/L) 6,013 1,040 83
Volatile Suspended Solids (VSS) 741 132 82
Chemical Oxygen Demand (COD) 4,943 808 84
Biochemical Oxygen Demand (BOD5) 1,716 66 96
Soluble BOD5 1,482 37 98
Total Kjeldahl Nitrogen (TKN) 1,279 29 98
Ammonia Nitrogen (NH4-N) 1,091 7 99
Oxidized N (NO3-N + NO2-N) 0 210 --
Total N (TKN + Oxidized N) 1,279 239 81
pH 7.99 7.31 --
30

Three-tank configuration Data in Table 6 show performance of the streamlined 3-Tank nitrogen removal module. Operational considerations, such as recirculation between tanks (nitrified liquor recycle and return sludge) and aeration of nitrification tank, were the same as before. The simplified system performed optimally under the most demanding conditions: winter weather and high N loads when total pig weight was highest in the production cycle. Under these conditions, ammonia removal efficiency was 99% with influent concentration that varied form 970 to 1190 mg/L. TKN removal efficiency was also high (98%) with influent concentration varying from 1010 to 1570 mg/L. Waste Sludge Generated by Biological N Removal System The biological system generated very little amount of waste sludge. This is because most of the organic and oxygen-demanding compounds were separated by the liquid-solids separation process or consumed during denitrification before the aeration treatment. Sludge was wasted every day by diverting about < 1 m3 of the return sludge from the settling tank into the solids separation module (homogenization tank). Waste sludge volume averaged 220 gal/day (6,482 gal/month) in the period April 1, 2003, to March 1, 2004. Average TSS concentration was 6,346 mg/L, and corresponding amount of dry sludge wasted was 156 kg/month. Assuming 93% separation efficiency of TSS, this wasted sludge contributed 145 kg of dry solids per month to the separated manure, or 1.4% of the total separated waste (596,200 kg containing 18.2% solids in 10.5 months, Figure 8). All the separated sludge solids left the farm mixed in the manure solids (Table 3), and the separated liquid was returned to the biological N system. Effect of Nitrogen Loading Rate: Pilot Plant Evaluation One important question frequently asked during design and installation of the technology was, “What would be the effect of increasing nitrogen load so that more animals can be treated in the same facility?” To answer this question, the evaluation team cooperated with Hitachi Plant scientists and provided verification to a pilot rate study at Goshen Ridge farm. The same pilot plant was previously used at the Swine Unit of the NCSU Lake Wheeler Rd. Field Laboratory to test feasibility of the Biogreen process with liquid swine manure and derive the data used to design the full-scale plant at Goshen Ridge farm (Vanotti et al., Proc. Int. Symp. Addressing Animal Production and Environmental Issues, NCSU, Oct. 3-5, 2001). In the new evaluation, the pilot plant was operated at very high loading rates (Figure 14). Loading rates were adjusted by changing the influent flow rate. The influent was the same separated liquid used in the full-scale plant. A total of 10 runs representing different loading rates or conditions were done from April 22, 2003, to Jan 8, 2004; each run lasting 3 to 4 weeks of continuous operation. Liquid samples were collected three times per week and analyzed in the ARS-Florence laboratory for water quality parameters as described for the full-scale plant.
31

1009080706050
Rem
oval
eff
icie
ncy
(%)
0
0.5
1
1.5
0 0.5 1 1.5NH4-N loading (kg-N/m3/d)
NH
4-N
rem
oval
(kg
-N/m
3 /d)
Full scale plantPilot scale plant
Figure 14. Nitrification efficiency of Biogreen process as affected by increasing ammonia loading rates. Data include both full-scale and pilot-scale performance obtained at Goshen Ridge farm. Full-scale data are averages of one month evaluation. Pilot-scale data are averages of 3-4 week runs conducted at varied loads.
Full-scale plant
Pilot-scale plant
32

Data in Figure 14 show the results obtained in the pilot rate study compared with results obtained in the full-scale plant. Ammonia loading rates varied from 0.163 to 0.407 kg N/m3-tank/d in the full-scale plant (equivalent to 17.9 to 44.8 kg NH4-N/day), and from 0.51 to 1.40 kg N/m3-tank/d in the pilot-scale plant. The total NH4-N removed increased with increasing loading rates. Ammonia removal efficiencies were maintained in the high range (87 to 100%) when loading rates were < 0.80 kg N/m3-tank/d. However, higher NH4-N loadings resulted in lower efficiencies (61 to 79%). Two conclusions are derived from this pilot rate study: 1) The full-scale plant had more capacity to treat ammonia than the original design, and 2) Doubling the number of pigs to be handled by one plant appears feasible. The second conclusion assumes that pig production cycles are gradually distributed among barns so that N load fluctuations are reduced and ammonia generation is more uniformly distributed throughout the year (Figure 11). Under this production condition, we estimated that the total NH4-N loading associated with doubling the number of pigs would fluctuate from a low of 53 kg/day to a high of 73 kg/day (average 63 kg/day). Since the volume of the nitrification tank in full-scale was 110 m3, these loads are equivalent to a range of 0.48 to 0.66 kg N/m3-tank/day (average 0.57 kg N/m3-tank/day), which can be used in Figure 14 to predict expected performance. Based on pilot data obtained, it is possible to treat effectively 0.66 kg N/m3-tank/d that corresponds to the projected maximum monthly load when number of pigs is doubled. Cold Temperature Effect on Nitrification of Immobilized Bacteria In addition to N load, cold weather nitrification is an important consideration for stabilized performance of biological processes applied to continuous animal production systems. We conducted a winter simulation experiment in the laboratory starting in June 2003 to evaluate performance of immobilized bacteria under cold weather conditions. Bench fluidized reactors (1.2 L) containing 120 mL of pellets (10% v/v) were operated under continuous flow using swine lagoon wastewater from Goshen Ridge units 2 and 3 containing 330-450 mg NH4-N/L, and 140 to 290 mg BOD5/L. Pellets were taken from the full-scale plant. Water temperature in the reactors was controlled using a refrigerated circulating bath with car antifreeze liquid. Optimal aeration conditions were provided with air-pump and stone diffuser in bottom of reactor; dissolved oxygen (DO) concentration was 7.0 to 9.4 mg/L with the highest DO associated with the lowest temperatures. Starting with 15oC, and a hydraulic residence time (HRT) of 18 hrs, wastewater process temperatures were decreased 2.5-3oC every three weeks to a lowest of 3oC. Ammonia was completely removed in all of these runs, which precluded calculation of nitrification potential. The continuous flow experiment was repeated using higher N loads obtained with HRT of 12 hrs, each temperature run lasting 2 weeks. A series of batch tests were also done to determine nitrification rate at cold temperatures with a different method, each batch temperature test lasting 8 hours and replicated 3 times. Results of the continuous (HRT 12 hrs) and batch tests are summarized in Figure 15. As expected, the effect of process temperature on nitrification rate was well described by the exponential equation (Figure 15). The temperature coefficient (Q10) obtained was consistent between methods and averaged 1.41. This means that nitrification rate of immobilized pellets is decreased by 29% for each 10oC decrease in water temperature (Table 7). This is
33

significantly different than the Q10 of 2 (rate is halved every 10oC decrease) commonly used to predict activity of activated sludge and other biological processes under cold weather conditions. Thus, the immobilized technology appears well suited for nitrification under cold weather conditions.
1
10
100
1000
0 5 10 15 20 25 30
Water Temperature (0C)
Nitr
ifica
tion
rate
(m
g-N
/hou
r/L-p
elle
t)
Continuous flow
y = 137.07e0.0318x R2 = 0.93
Batch tests
y = 140.81e0.0373x R2 = 0.99
Figure 15. Nitrification rate of swine wastewater with nitrifying pellets as affected by cold water temperatures. Study was done with refrigerated bench reactors at ARS-Florence laboratory using nitrifying pellets from Goshen treatment plant. Continuous flow data are averages of 2-week runs. Batch test data are averages of three replicates.
34

Nitrification rate of immobilized pellets obtained in the temperature experiments was also calculated for a 12-m3 pellet-volume used in the full-scale plant (Table 7). Results of this calculation suggest that immobilized pellet biomass used in the full-scale plant was sufficient to handle both a maximum monthly load of 44.8 kg NH4-N/day and a minimum monthly average water temperature of 11oC that were experienced in the field (Figures 14 and 9). Results also suggest that additional immobilized biomass would be needed (about 3.5 m3 more immobilized pellets) for complete NH4-N removal during cold weather if the number of pigs is doubled (Table 7). These results indicate potential nitrification performance under cold weather conditions that were obtained in laboratory tests, and provide support to our conclusion that performance of the full-scale biological N removal module was not affected by the cold weather conditions (Figure 9). Users of the technology should refer to recommendations by the technology provider for design and engineering considerations.
Table 7: Cold weather nitrification of immobilized pellets. Nitrification rate calculated from regression equations in Figure 15. A volume of 12 m3 of pellets was used in the full-scale demonstration project. A 73 kg NH4-N/day load corresponds to maximum load after doubling the number of pigs in full-scale operation.
Nitrification Rate (mg-N/hour/L-pellet)
Water
Temperature
oC
Continuous
flow
Batch Tests
Average
Average Nitrification
Rate (kg-N/day/ m3 pellet)
Nitrification potential of 12
m3 pellets
(kg-N/day)
Pellet amount to
treat 73 kg-N/day (m3)
25 303.5 357.8 330.7 7.94 95.2 9.2
20 258.9 296.9 277.9 6.67 80.0 10.9
15 220.9 246.4 233.7 5.61 67.2 13.0
10 188.4 204.5 196.5 4.71 56.5 15.5
5 160.7 169.7 165.2 3.96 47.5 18.4
35

7. Soluble Phosphorus Removal Module
Background: After biological N treatment, the liquid flows by gravity to the phosphorus separation module developed by USDA-ARS where P is recovered as calcium phosphate and pathogens are destroyed by alkaline pH. Figure 16 shows a schematic diagram of the phosphorus separation module, and Figure 17 shows a detailed picture of the technology installed at Goshen Ridge farm. Liquid is mixed with hydrated lime in a reaction chamber. A pH controller is linked to the lime injector and keeps the process pH at 10.5-11.0. The liquid and precipitate are separated in a settling tank. The precipitated calcium phosphate sludge is further dewatered in filter bags with a capacity of about 50 lb each. Polymer is added to the precipitate to enhance P separation. Automation to the system is provided by sensors integrated to a programmable logic controller (PLC) for 24 hr/day operation. The PLC is shared with the biological N removal module; treatment parameters such as process pH are et by the operator using another tactile screen in the plant control panel. s
Figure 16. Schematic diagram of phosphorus separation module constructed in the full-scale manure treatment system demonstration project at Goshen Ridge farm, Duplin County, NC.
Performance Verification of the Soluble Phosphorus removal Module
Soluble P Removal Efficiency Evaluation of the phosphorus module started April 15, 2003, after the preceding units in the treatment train were both in steady-state. Results of this evaluation for the phosphorus module alone are summarized in Figure 18 and Table 8. Removal efficiencies of the soluble phosphate averaged 94% for wastewater containing 77 to 191 mg/L PO4-P.
36

Figure 17. Phosphorus separation reactor installed at Goshen Ridge hog farm in Duplin County, NC. Storage tank (1) in background holds wastewater from which ammonia nitrogen and carbonate buffers have already been removed. This wastewater gravity flows to reaction chamber (2) along with a slurry of water and hydrated lime suspended in mixing chamber (3). More lime slurry is stored in a tote container (4) until needed. Lime slurry is 30% suspension ready to use supplied by Chemical Lime Company. Liquid flows from the reaction chamber (2) into cone-shaped settling tank (5). There, phosphorus sludge settles to the bottom (6) and is later removed, filtered, and dried in filter bags. Cleaned wastewater flows from top of settling tank via the white pipe (7) and is delivered to sump (8). An underground pipe carries cleaned wastewater to storage pond or nearby subsurface irrigation experiment for crops.
Table 8: Removal of phosphorus from liquid swine manure after biological N treatment (ARS developed process). Data are means for the period of April 15, 2003 - March 1, 2004 (n=121).
Water Quality
Parameter
Liquid After Biological N
Treatment
Liquid After Phosphorus Treatment
Efficiency
(%)
pH 7.24 10.49 --
Alkalinity, mg/L 529 735 --
Electrical Conductivity, mS/cm 5.13 4.86 --
BOD5 , mg/L 33 10 70
Soluble phosphorus , mg/L 134 8 94
37

Figure 18: Concentration of soluble phosphorus before and after treatment in the phosphorus removal module.
Calcium Phosphate Production A total of 285 bags of calcium phosphate product containing 1,160 lb of P2O5 and 1,450 lb of calcium were produced and left Goshen Ridge farm in a 9-month period (April 15, 2003, to Jan 15, 2004) (Table 9). Each bag weighed an average of 34.8 kg (± 6.5) and contained 8.1 kg of dry matter (23.3% solids and 76.7% moisture). The phosphorus was 90% (± 2.5%) plant available based on standard citrate P analysis used by the fertilizer industry.
Table 9: Amount and composition of calcium phosphate solids produced from separation treatment with the phosphorus separation module. Concentration values are on a dry basis. Data are means and totals obtained April 2003-January 2004.
Element
Average Concentration (%)
Standard Deviation (%)
Total produced (lb)
P2O5 24.4 4.5 1,160
Calcium 27.7 2.6 1,450
Magnesium 1.8 0.4 88
Total N 0.1 0.2 5
38

Effectiveness of Filter Bags for Dewatering We evaluated retention of the calcium phosphate precipitate by filter fabrics. Filtration tests were done in the laboratory and involved nylon filters of two mesh sizes and non-woven polypropylene filters used in the phosphorus separation module at Goshen Ridge farm (Table 10). Results of these tests indicated that filter bags used in the project can retain 99.5% of the suspended solids (TSS) and total P contained in the precipitate.
Table 10. Effectiveness of dewatering filter bags to retain calcium phosphate product after flocculation. Data show total suspended solids (TSS) and total phosphorus (TP) concentration in the liquid after filtration using two fabric types and various mesh sizes. Before filtration, the precipitate contained 14,670 mg TSS/L and 1,697 mg TP/L. Data are average of two filtrate replicates per mesh size; means followed by the same letter are not significantly different (LSD at 5% level)*. Tests done at ARS-Florence laboratory.
Fabric Type Mesh Size
(µm)
TSS† After
Dewatering (mg /L)
TSS‡ Efficiency
(%)
TP After
Dewatering (mg /L)
TP Efficiency
(%)
800 805 a 94.5 49 a 97.1 Monofilament nylon**
200 185 b 98.7 17 b 99.0
Non-woven polypropylene¶ 190 - 210 65 b 99.5 9 b 99.5
* Polymer rate applied to precipitate = 30 mg active polymer/L. **Commercial monofilament nylon filter fabric with constant 200-µm or 800-µm mesh size. ¶ Commercial polypropylene non-woven fabric with variable 190 to 210 mesh size used in the soluble P removal module at Goshen Ridge farm. † Total suspended solids (TSS) and total P (TP) determined in the filtrate. ‡ Efficiency expressed as percentage retained in filter relative to concentration of unfiltered phosphate precipitate (14,670 mg TSS/L and 1,697 mg TP/L). Example: TP Efficiency = [(1,697 - 9) / 1697] × 100 = 99.5%.
39

Effluent pH
The high pH (10.5) in the process is necessary to produce calcium phosphate and kill pathogens. However, the liquid is poorly buffered, and the high pH in the effluent decreases readily once in contact with the air. This is demonstrated in data in Figure 19 showing that, due to low buffer capacity, the CO2 in the air can create enough acidity to rapidly lower pH. Most of the treated effluent in the plant was stored in the former lagoon that was converted into an aerobic pond (Section 9). We did not detect a pH increase in the pond water after one year of operation and > 2 millions gallons of treated effluent added.
8.0
8.5
9.0
9.5
10.0
10.5
11.0
0 30 60 90 120 150 180 210 240 270 300 330
Time (min)
pH
Figure 19. Reduction of pH in P-treated effluent with aeration treatment. Treatment of 1 L liquid using 2 L/min aeration. Two replicates shown. Data from Vanotti et al., ASAE ISAAFPW 2003, Research Triangle Park, NC, Oct. 12-15.
An irrigation experiment was conducted in 2003 in the field next to the treatment plant. A total of 53,800 gallons of P-treated effluent were used from September to November, 2003 to irrigate soybeans and coastal hay in a subsurface drip irrigation experiment conducted by USDA-ARS. The effluent for this irrigation experiment had high pH; it was diverted in a sump (Figure 17) right after the P-reactor and before discharge into the former lagoon. Results of the soybean experiment summarized in Table 11 indicate that the high pH in the effluent did not hinder yields; to the contrary, yield of soybean was enhanced with supplemental irrigation using the treated effluent.
40

Table 11: Irrigation of soybean with liquid manure effluent after going through the treatment system using a subsurface drip irrigation system. Soybean was planted June 25, 2003, and irrigated from September to November 2003 with effluent from the phosphorus separation module. Irrigation amount was based on crop demand calculations derived from ET measurements at on-site weather station. Data are the average of four soybean cultivars (Delta, Northrup, Pioneer, and Southern States), two underground tube spacings, and four plot replicates.
Irrigation Treatment
Treated Effluent Applied to All Plots
m3 (gallons)
Irrigation Rate
mm (inches)
Soybean Grain Yield
kg/ha Non-Irrigated 0 0 1, 648
Irrigated
29,682 77.2 (3.04) 2,022
Soybean plots irrigated with a subsurface drip irrigation system using treated effluent from phosphorus separation module.
41

8. Total Wastewater Treatment System
System Performance System performance data were obtained during 10.5 months from April 15, 2003, to March 1, 2004, when all three modules were in-line. Overall, the demonstration system at full-scale performed to design expectations or better with respect to elimination of solids, COD, BOD, TKN, ammonia (NH4-N), phosphorus, copper, and zinc (Table 12).
Table 12: Removal of suspended solids, COD, BOD, nutrients, and heavy metals by total treatment system at Goshen Ridge farm. Data are means for the period of April 15, 2003 - March 1, 2004 (n=121).
Water Quality
Parameter
Raw Flushed Manure (mg/L)
After Solids Separation Treatment
(mg/L)
After Biological N
Treatment (mg/L)
After Phosphorus Treatment
(mg/L)
System Efficiency
(%)
TSS 11,051 823 122 264 97.6
VSS 8,035 591 77 85 99.0
COD 16,138 3,570 617 445 97.4
BOD5 3,132 1,078 33 10 99.7
TKN 1,584 953 34 23 98.5
NH4-N 872 835 23 11 98.7
Organic N 712 111 12 11 98.5
Oxidized N* 1 1 224 224 --
Total N** 1,584 954 258 247 84.4
Total P 576 174 147 29 95.0
Soluble P 135 121 134 8 94.1
Copper 26.8 1.54 0.53 0.36 98.7
Zinc 26.3 1.47 0.40 0.25 99.0
pH 7.60 7.91 7.24 10.49 --
EC (mS/cm) 10.44 10.39 5.13 4.86 --
* Oxidized-N = NO3-N + NO2-N (nitrate plus nitrite) ** Total N = TKN + Oxidized-N System efficiency for Total N = 89.4% on a mass balance basis. This considers that 33% of the N treated effluent was recycled in a closed loop to refill barns where oxidized N was eliminated. (Table 13).
42

Data in Table 12 and Figures 20 to 25 show the unique contributions of each technology component to the efficiency of the total system. Solid-liquid separation was effective separating suspended solids and organic nutrients. By capturing the suspended particles, most of the volatile and oxygen-demanding organic compounds are removed from the liquid stream. Instead of breaking down organic compounds, the oxygen in the aeration treatment is used efficiently to convert ammonia. The effluent from the solids separation contained significant amounts of N and P mostly in the soluble form (Figures 23 and 24). The ammonia was treated effectively in the N module. The treatment also consumed remaining carbon (BOD, COD) in the denitrification step. Soluble phosphorus was not significantly changed by liquid-solid separation or nitrogen treatment (Figure 24) but reduced significantly in the P-module where P was recovered as a calcium phosphate material. A mass-balance approach was required to understand system removal of Total N and oxidized N (nitrite + nitrate). Mass balance utilized nutrient concentration as well as water flows. Water flows corresponding with system performance evaluation period are provided in Table 13. We calculated that 870 kg of oxidized-N was removed by denitrification in the closed loop recycling N treated water to the barns during the 10.5 month system evaluation period. The amounts of total N (TKN + oxidized N) contained in the flushed manure and treated effluent were 19,100 kg and 2,020 kg, respectively. Thus, total N removal on a mass basis (TN in – TN out) was 89.4%. Most (91%) of the remaining N was oxidized N. A significant amount was further removed by denitrification in the lagoon, most likely by combination with the lagoon sludge. Nitrate was first noticeable (2 mg/L) in the lagoon liquid in August 2003 but concentration remained very low (<36 mg N/L) in the subsequent months (Oct. 2003-May 2004). Detailed changes in lagoon characteristics are described in section 9 of this report.
Table 13: Wastewater flow in treatment plant during period April 15, 2003 to March 1st, 2004 corresponding to total system operation. Raw flushed manure, effluent recycle to barns and phosphorus measured with flowmeters. Separated effluent incorporates the balance of polymer water and separated solids. Effluent to storage pond is the effluent of the phosphorus module minus effluent used for irrigation experiment.
Flow Path
Totals Gallons
Average Gallons/Day
Raw Flushed Manure to Homogenization Tank 3,183,300 10,302
Separated Effluent to Nitrogen Module 3,188,500 10,319
N Treated Effluent to Refill Barns 1,039,200 3,363
N Treated Effluent to Phosphorus Module 2,160,700 6,993
P Treated Effluent to Storage Pond (Lagoon) 2,106,900 6,818
P Treated Effluent to Irrigation Experiment 53,800 --
43

44

45

46

Reduction of Odor Compounds The treatment system was also effective in reducing odor-generating compounds contained in the liquid (Table 14). By measuring in the liquid the concentration of compounds typically associated with bad smell in animal wastes, we were able to quantify the potential of the effluent to produce offensive odors. The largest reduction was observed after the liquid passed through aeration in the nitrogen treatment. Removal efficiency was particularly high for skatole and p-cresol, major contributors to malodor in these samples. The treatment system eliminated 97.9% of the odor compounds evaluated.
Table 14: Reduction of odor compounds contained in the liquid by the treatment system at Goshen Ridge farm. Data are means (standard error) of measurements taken September 2003 - October 2003 (n=5). System efficiency compares reduction of odor compound concentration in liquid after phosphorus treatment with concentration in raw flushed manure.
Odor
Compound
Raw Flushed Manure
ppb (± s.e.)
After Solids Separation Treatment ppb (± s.e.)
After Biological N
Treatment ppb (± s.e.)
After Phosphorus Treatment ppb (± s.e.)
System Efficiency
(%)
Phenol 11.76 (2.03) 5.35 (1.36) 3.47 (1.35) 2.17 (1.23) 81.3
p-Cresol 34.87 (7.60) 53.45 (39.47) 0.08 (0.03) 0.06 (0.01) 99.8
Ethylphenol 21.55 (12.18) 13.94 (8.16) 0.07 (0.03) 0.05 (0.01) 99.8
4-Propylphenol 5.24 (0.99) 3.82 (1.06) 0.08 (0.03) 0.06 (0.01) 98.9
Indole 3.52 (1.89) 4.78 (0.42) 0.84 (0.53) 0.23 (0.16) 93.5
Skatole 129.84 (27.93) 100.35 (27.51) 0.07 (0.03) 1.72 (1.02) 98.7
Total 206.78 181.69 4.61 4.29 97.9
Reduction of Microbial Indicators of Fecal Contamination The treatment system was also effective in reducing pathogen indicators in liquid swine manure (Table 15). This work was done to confirm that treatment pH in the P-module was effective as this module was never tested before in full-scale. Comprehensive pathogen studies were done by OPEN team that should be used for Technology Determination in this standard. Results showed a consistent trend in reduction of microbial indicators as a result of each step in the treatment system. Results also confirmed pilot studies that the phosphorus removal step via alkaline calcium precipitation produces a sanitized effluent. Total Gram Negative, Fecal coliforms, E. coli, and Enterococci were reduced to non detectable levels (< 10 cfu/mL).
47

Table 15: Microbiological analyses of liquid manure effluent before treatment and at each step of the treatment system. Values are means (standard error) of log10 MPN bacteria per mL for duplicate samples for four sampling dates (July, Sept., Nov., and Dec. 2003). BDL (below detectable limit) indicates there were no colonies to count; upper threshold limit value was 10 colony forming units/mL (1 colony/100 µL).
Indicator
Microorganism
Raw Flushed Manure
log10/mL (± s.e.)
After Solids Separation Treatment
log10/mL (± s.e.)
After Biological N Treatment
log10/mL (± s.e.)
After Phosphorus Treatment
log10/mL
Total Gram Negative
6.58 (1.59) 6.29 (1.82) 3.46 (1.11) BDL
Total Coliforms 4.49 (0.45) 3.84 (0.50) 2.11 (0.70) BDL
Total Fecal Coliforms
3.79 (0.36) 3.09 (0.29) 1.01 (0.23) BDL
Total Enterococci 5.73 (0.41) 4.84 (0.28) 2.67 (0.55) BDL
E. coli present + + + -
Electrical Power Use We measured run-time (hours/day) of all (35) electrical devices installed in the plant contributing to the treatment system. This was done with the SCADA monitoring system that counted total hours per day during 275 days form April 2003 to January 2004. Average run-time was multiplied by power use of each electrical device (kw) to calculate daily power requirements (kWh/day). Details for each device were provided to the economic team and presented in their report (Super Soil Technology table 2). The summary daily power use by unit process was:
Unit Process kWh/day Lift Station and return to barns 2.99 Homogenization tank 76.46 Solids separation 94.78 Biological N treatment 266.18 Phosphorus removal 25.81 TOTAL 466.22
48

9. Anaerobic Lagoon Conversion into Aerobic Pond
Conditions Prior to Conversion We monitored water quality of all three lagoons on the same farm starting one year before treatment operation started in Unit 1. During 2002, the lagoons stored and treated the liquid manure from six houses each (Barns 1-6, 7-12, and 13-18) with similar number of pigs and production management. Concentrations of nitrogen, COD, BOD, volatile solids, and electrical conductivity in 2002 were similar among lagoons (Table 16). Sludge depths were measured in the fall of 2001 and 2002 averaging 23.6”, 19.3”, and 18.8” for lagoons #1, 2, and 3, respectively. Total nitrogen concentration in the three lagoons fluctuated yearly from a high at the end of winter of about 700 mg/L to a low at the end of summer of about 350 mg/L. Ammonia-N followed the same pattern and varied from about 600 to 300 mg/L, respectively (Figure 26). Photo shows Farm Unit 1 (front), Unit 2, and Unit 3 (back).
49

Table 16: Changes in water quality in Goshen Ridge lagoons. Unit 1 (Barns 1-6): Lagoon received flushed manure during 2002, and liquid from treatment plant after December 2002. Units 2 and 3 (Barns 7-12 and 13-18): Lagoons received flushed manure during 2002 to 2004. The three units maintained similar number of pigs and production management. EC=electrical conductivity. Data are averages of duplicate samples collected monthly.
Year Lagoon pH TKN (mg/L)
NH4-N (mg/L)
NO3-N (mg/L)
COD (g/L)
VSS (mg/L)
BOD5 mg/L
EC (mS/cm)
2002 (Jan-Dec) Unit 1 8.0 505 464 0 1.7 192 207 7.7 Unit 2 8.0 521 467 0 1.7 225 170 7.2 Unit 3 8.0 517 469 0 1.7 225 196 7.3 2003 (Jan-Dec) Unit 1 8.0 230 186 4 0.9 136 131 4.9 Unit 2 7.9 522 447 0 1.5 215 214 7.0 Unit 3 7.9 439 375 0 1.4 245 222 6.1 2004 (Jan-Feb) Unit 1 8.0 45 23 34 0.3 50 16 3.4 Unit 2 7.9 440 411 0 1.5 189 237 6.4 Unit 3 7.9 530 462 0 2.0 255 571 6.4
Figure 26: Changes in ammonia nitrogen concentration with time in Goshen Ridge lagoons. Unit 1 (Barns 1-6): Lagoon received flushed manure during 2002 and liquid from treatment plant after December 2002. Units 2 and 3 (Barns 7-12 and 13-18): Lagoons received flushed manure in 2002, 2003, and 2004. The three units maintained similar number of pigs and production management.
50

Water Quality Changes Significant differences in water quality characteristics among lagoons were observed starting in 2003 after manure flush to lagoon #1 was halted and 100% of the manure generated was processed through the treatment plant. The quality of the liquid in lagoon #1 was rapidly improved during 2003 as cleaned effluent replaced dirty liquid. Ammonia concentration stabilized at a low value of about 20 mg/L in Nov. 2003 (Figure 26). Average data for the first two months of 2004 show significant improvements in a variety of water quality parameters; reductions in concentrations were: 96% BOD, 83% COD, 95% ammonia, 91% TKN, and 47% electrical conductivity. Nitrate was first noticeable (2 mg/L) in the lagoon liquid in August 2003 but concentration remained very low compared to influent (Figure 27). Concentration increased with lower temperatures in winter 2003-2004 and decreased again with spring temperatures, indicating biological activity, most likely denitrification using carbon in the sludge.
0
100
200
300
400
JUL
AUG
JUL
AUG
SEP
OCT
NOV
DEC
JAN
FEB
MAR
APR
MAY
Ni
trat
e +
nitr
ite (m
g N
/L)
Pond liquid Treated effluent
Figure 27. Concentration of oxidized-N (nitrite + nitrate) in treated effluent discharging into lagoon #1 (storage pond), and in the lagoon liquid. July 1, 2003 to May 19, 2004.
Lagoon #1 color changed from brown to blue in summer 2003; the lagoon was converted into an aerobic pond by fall 2003. Dissolved oxygen (DO) concentration and oxidation-reduction potential (ORP) were monitored in fall 2003 and winter 2004 (Oct. 2003-Mar. 2004, n=5). DO concentration averaged 3.41 mg/L in lagoon #1, 0.51 mg/L in lagoon #2, and 0.57 mg/L in lagoon #3. Corresponding ORP values were +73, -84, and -194, respectively.
51

Odor Changes We also measured concentration of odor compounds contained in the liquid of the three lagoons. A marked reduction in the concentrations of malodorous compounds was observed in liquid from the treated lagoon as compared to liquid from the two traditional lagoons (Table 17). The reduction was especially marked in the case of para-cresol, ethylphenol, and skatole, all of which are compounds with low odor detection thresholds that make important contributions to swine waste odors
Table 17: Reduction of odor compounds in the liquid of three lagoons at Goshen Ridge farm. Data are means (standard error) for the period of September 2003 – October 2003 (n=5). Odor compound reduction compares concentration in lagoon #1 with the average concentration of lagoons #2 and #3.
Odor
Compound
Treated Lagoon (Unit 1)
ppb (± s.e.)
Traditional Lagoon (Unit 2)
ppb (± s.e.)
Traditional Lagoon (Unit 3)
ppb (± s.e.)
Odor Compound Reduction
(%)
Phenol 3.89 (1.42) 3.03 (1.50) 9.02 (3.67) 35.4
p-Cresol 0.69 (0.60) 4.38 (3.86) 3.73 (2.20) 83.0
Ethylphenol 0.24 (0.15) 2.76 (1.78) 3.76 (2.22) 92.6
4-Propylphenol 0.09 (0.01) 0.21 (0.18) 0.11 (0.05) 43.8
Indole 1.06 (0.40) 0.86 (0.37) 1.69 (1.17) 16.9
Skatole 0.67 (0.35) 15.20 (4.18) 32.93 (10.32) 97.2
Total 6.64 26.44 51.24 82.9
Ammonia Emissions Changes Emissions were markedly affected by weather conditions and water quality. During cold weather conditions (avg. air temperature = 5.4oC), ammonia emissions in both the treated and traditional lagoons were low (Table 18), even though NH4-N concentration in the liquid varied > 400 mg/L among lagoons (Figure 22). However, these water quality differences significantly affected ammonia emissions during warmer weather conditions (avg. air temperature = 21.8 oC); we measured emissions of 49 kg ammonia-N per day from the traditional lagoon versus zero ammonia emissions from the converted lagoon (Unit 1). As comparison, 50 kg N/day was also the maximum load treated by Biogreen system in Unit 1.
Table 18 . Ammonia emissions from converted and traditional swine lagoons at Goshen Ridge Farm.
Lagoon Date
Sampling Period (hours)
Average Air Temperature
(oC)
Emission Rate
(kg NH3-N / ha / d)
Daily Emission per
Lagoon* (kg NH3-N/d)
Treated Feb. 18, 2004 23 5.4 1 0.8 Traditional Feb. 18, 2004 23 5.4 3 3
Treated Apr. 20, 2004 23 21.8 0 0 Traditional Apr. 20, 2004 23 21.8 49 49
* Converted lagoon = 0.9 ha (2.2 ac); traditional lagoon = 1.0 ha (2.5 ac)
52

10. Operational Problems Experienced and Solutions: Salt Deposits Perhaps the biggest problem encountered was the formation of salt crystal deposits in the pump and piping used to lift the liquid from the solid-liquid separation module into the nitrogen module. The problem started in July 2003 and forced the system to be shut down for several hours every week to remove deposits from inside the pump and pipes. A simple solution was developed and implemented in August 2003 by redesigning the lifting station and running a closed acid loop to flush the problem pipes and pump. Diluted acid was stored in a 40-gal container and reused for several months. The acid flush operation is normally done in 2-3 min, once per week, while the lifting pit is being filled, without need to stop flow in the plant.
Electrical Grounding Several sensitive electronic devices such as magnetic flowmeters, PLC, and touch-screens were frequently damaged by electrical surges and had to be repaired or replaced during the first months of operation. The situation was studied by an electrical engineer consultant. The main problem was the lack of grounding connections between various treatment tanks or technology components and the main electrical ground. This correction plus the installation of surge protectors in the electrical panel solved the problem.
Foaming Foam formation in the nitrification tank was a problem encountered at the moment aeration treatment started. Continuous dripping of small amounts antifoam liquid was effective for controlling foaming throughout the 10.5 months evaluation. The exception were three events when antifoam chemical run out or high wind caused poor application, and excessive foam was formed. In January 2004, the delivery system of antifoam was improved, and a simple laser beam detector was placed 1-ft above liquid level as a safety mechanism that temporarily cut aeration if excessive foam had formed. No events were observed after these changes.
11. Operator Training
The system requires an operator with a high-school education. The operator needs to receive 2 weeks training by the company that includes detailed information on plant equipment, operation and maintenance, safety and health aspects, identification and reporting of malfunction, and simple troubleshooting. A trained operator can safely operate two farms within a 20-mile radius, each farm providing treatment to 4,500 to 9,000 pigs. A manual of Operation and Maintenance was developed as part of the demonstration.
In addition to the plant operator, successful operation of the technology also requires support from an engineer technician having a 2 to 4 year engineer technology degree and mechanical/electrical skills. This person can provide support to about 10 farms so that each plant is visited about twice a month to work on specialized issues such as system checks, software, electronics, or parts replacement.
53

12. Process Control and Automation The system was automated through the use of sensors integrated into two programmable logic controllers for 24 hours per day operation. Treatment parameters such as polymer rate, mixing intensity, process pH, or phosphorus sludge dewatering were set by the operator using a tactile screen in the control panel. The plant was usually unattended after 5pm and during weekends.
As part of this evaluation, we used a commercial SCADA (Supervisory control and data acquisition) system to monitor process and treatment conditions from Florence, SC. This wireless network application was developed so that treatment conditions in a cluster of farms can be monitored and controlled from a central facility.
Second Generation Technology A significant number of improved system design and engineering criteria were identified during this demonstration and incorporated into development of second-generation systems. Such is the case of a modular solid-liquid separation unit developed by Selco MC and installed by Super Soil Systems USA on Goshen Ridge farm Unit 3 in February 2004. The modular unit provides manure separation treatment to an identical number of pigs as in Unit 1. Advances included more robust design, simplified installation, and rapid start-up (3 days) since the unit process was completely mounted on a trailer and the farmer only needed to provide a receiving tank, concrete pad and connection to water and electricity. Similar improvements are also being incorporated into the nitrogen and phosphorus components; the overall goal is to develop more robust systems at a reduced cost that will improve acceptability of these new technologies by farmers.
54

Conclusions Major goals in the demonstration and verification of a new wastewater treatment system for swine manure at full scale were achieved including replacement of anaerobic lagoon treatment, and consistent operation with varying solids and nutrient loads typical in animal production, and cold and warm weather conditions. Results from this project have also advanced the state of the science in animal waste treatment. The treatment plant completed design, permitting, construction, startup, and one-year-operation period under steady-state conditions. It was verified at full-scale that the technology is technically and operationally feasible. Based on performance results obtained, the treatment system meets the criteria of Environmentally Superior Technology defined in section II.C of the Agreement on performance standards for the elimination of discharge of animal waste to surface waters and groundwater and for the substantial elimination of nutrient and heavy metal contamination of soil and groundwater. Acknowledgements This performance evaluation was part of USDA-ARS National Program 206: Manure and Byproducts Utilization; CRIS Project 6657-13630-001-00D “Improved animal manure treatment methods for enhanced water quality.” It was partially funded by North Carolina State University and its sponsor Smithfield Foods, Inc through USDA Agreement 58-6657-2-202, NCSU Subcontract #2001-0478-02. The investigators are grateful to the following individuals that contributed to the success of the evaluation: Lewis Fetterman, Super Soil Systems USA, for project leadership, Jesus Martinez Almela, Selco MC, for contributing engineering and project management
expertise, Selco MC engineers Jorge Barrera Marza and Miriam Lorenzo Navarro, for help with design and
implementation of monitoring system, and programming of SCADA, Hitachi Plant engineers Drs. Bassem Osman, Tatsuo Sumino, and Hiroyoshi Emori for help with
pilot plant evaluation and design of winter laboratory experiment, Super Soil Systems USA staff Dr. Ray Campbell and Jeremy Raynal, for their help with field
coordination and data collection, USDA-ARS Florence, SC: Terry Bradshaw, Tracy Stokes, and students Philip Slagle, Deidra
Jones, Sandy Roberts, and Jennifer Hemingway, for their help with sampling and laboratory testing and analyses; Dr. Ken Stone for contributing subsurface irrigation data; Anita Stansbery for assistance with ammonia emissions measurements; and Dr. John Loughrin for odor compound analyses,
USDA-ARS Beltsville, MD: David Ingram and Michele Sumi for their help with microbial analyses,
Mark Rice, NCSU, and Dr. John Chastain, Clemson University, for help with pit volume measurements and management,
Martin Guthrie, Premium Standard Farms, for providing pig production and lagoon sludge records,
55

56
Lynn Worley-Davis, NCSU, for providing coordination between OPEN team and this evaluation, Tenny and Chris Sutton, Sutton Electric, Mt. Olive, NC for help with installation of sensors and
electrical meters used in the evaluation, David Merrill, Hagemeyer Cambar, Wilmington, NC for help with installation of monitoring
software, John Elliott, Chemical Lime, Charlotte, NC, for technical assistance with lime application, Gerald Shumaker, ABS, Meriden, CT, for technical assistance with manure mixers, and Brett Horton and John Russell, CopterViews.com, for taking aerial pictures of the project.