Embed Size (px)
Citation preview
Project Risk ManagementChapter Six RBS AND QUANT/QUALT ANALYSIS
Risk Breakdown Structure A risk breakdown structure is a hierarchy of potential risk
categories for a project.
Similar to a work breakdown structure but used to identify and categorize risks.
RISK BREAKDOWN STRUCTURE
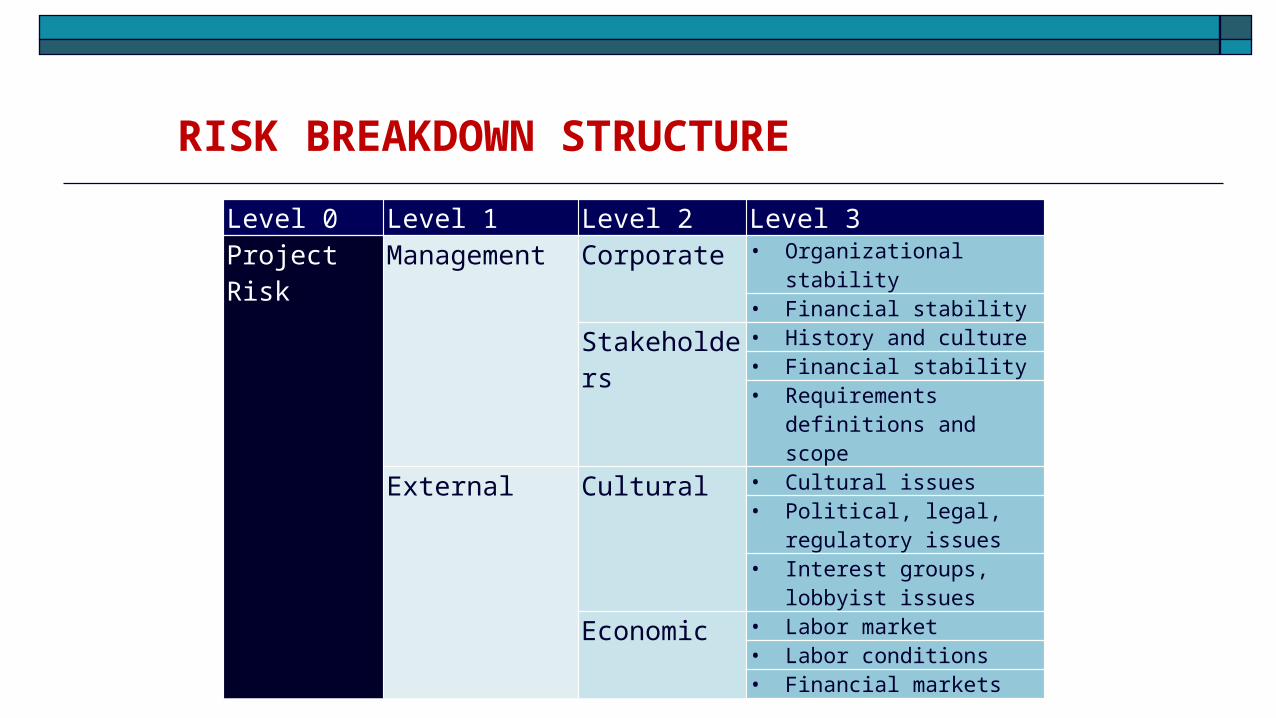
Level 0 Level 1 Level 2 Level 3 Project Risk Management Corporate • Organizational stability
• Financial stabilityStakeholders • History and culture
• Financial stability• Requirements definitions and
scopeExternal Cultural • Cultural issues
• Political, legal, regulatory issues
• Interest groups, lobbyist issues
Economic • Labor market• Labor conditions• Financial markets
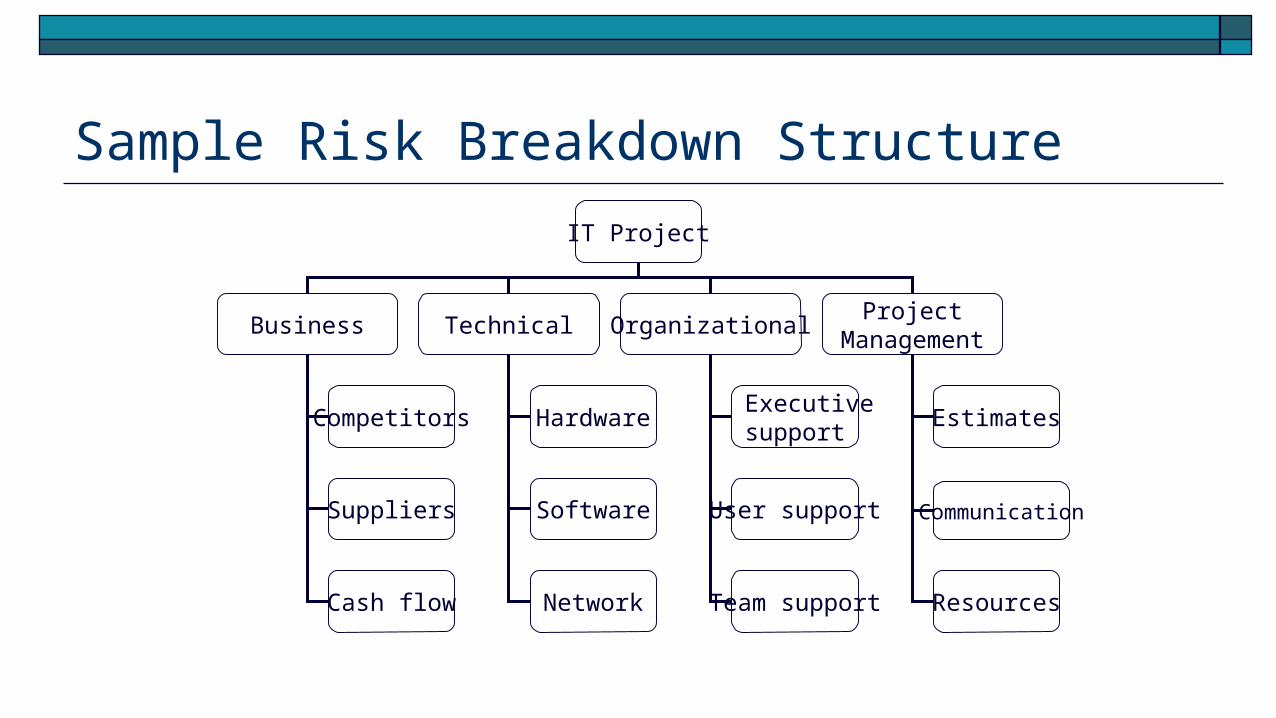
Sample Risk Breakdown Structure
IT Project
Business Technical OrganizationalProject
Management
Competitors
Suppliers
Cash flow
Hardware
Software
Network
Executivesupport
User support
Team support
Estimates
Communication
Resources

Internal Risks• Internal risks can be controlled by project managers and stakeholders. • They originate from all phases of a project. • Examples of internal risks are not meeting time, cost, scope, performance and
value of a project due to technological difficulties. • Internal risks occur due to failure in customer relationships. These may be due
to failure in key success factors of a project.
External Risk These risks are from sources outside the project. Project managers or stakeholders have little or no control over these risks. Physical risks encompass damage by fire, flood, or other catastrophe, computer
virus that infects the development environment or operational system, and a team member who steals confidential project material and makes it available to competitors.
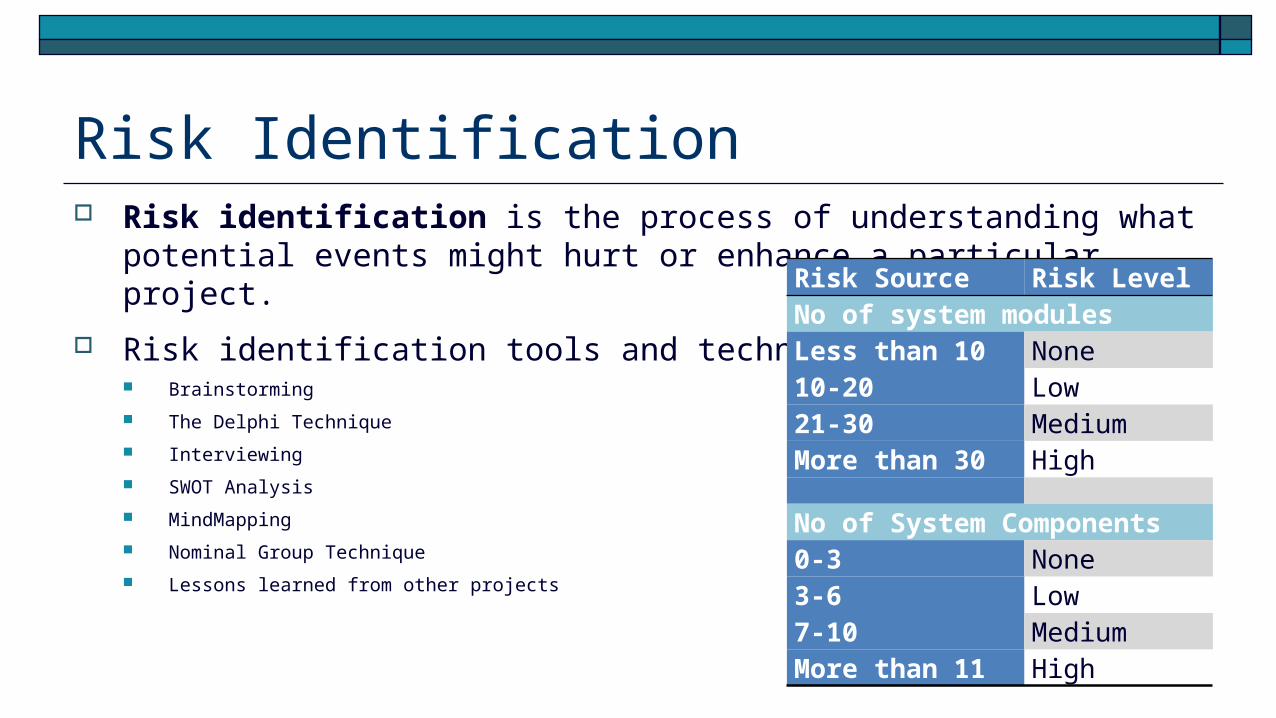
Risk Identification Risk identification is the process of understanding what potential events might hurt
or enhance a particular project.
Risk identification tools and techniques include: Brainstorming
The Delphi Technique
Interviewing SWOT Analysis
MindMapping
Nominal Group Technique
Lessons learned from other projects
Risk Source Risk LevelNo of system modulesLess than 10 None10-20 Low21-30 MediumMore than 30 High
No of System Components0-3 None3-6 Low7-10 MediumMore than 11 High
Brainstorming Brainstorming is a technique by which a group attempts to
generate ideas or find a solution for a specific problem by amassing ideas spontaneously and without judgment.
An experienced facilitator should run the brainstorming session.
Be careful not to overuse or misuse brainstorming. Psychology literature shows that individuals produce a greater number
of ideas working alone than they do through brainstorming in small, face-to-face groups.
Group effects often inhibit idea generation.
Delphi Technique The Delphi Technique is used to derive a consensus among a panel of experts who
make predictions about future developments.
Provides independent and anonymous input regarding future events.
Uses repeated rounds of questioning and written responses and avoids the biasing effects possible in oral methods, such as brainstorming.
Interviewing Interviewing is a fact-finding technique for collecting
information in face-to-face, phone, e-mail, or instant-messaging discussions.
Interviewing people with similar project experience is an important tool for identifying potential risks.
SWOT Analysis SWOT analysis (strengths, weaknesses, opportunities, and
threats) can also be used during risk identification.
Helps identify the broad negative and positive risks that apply to a project.

Potential Negative Risk Conditions Associated With Each Knowledge Area
Knowledge Area Risk Conditions
Integration Inadequate planning; poor resource allocation; poor integrationmanagement; lack of post-project review
Scope Poor definition of scope or work packages; incomplete definitionof quality requirements; inadequate scope control
Time Errors in estimating time or resource availability; poor allocationand management of float; early release of competitive products
Cost Estimating errors; inadequate productivity, cost, change, orcontingency control; poor maintenance, security, purchasing, etc.
Quality Poor attitude toward quality; substandarddesign/materials/workmanship; inadequate quality assuranceprogram
Human Resources Poor conflict management; poor project organization anddefinition of responsibilities; absence of leadership
Communications Carelessness in planning or communicating; lack of consultationwith key stakeholders
Risk Ignoring risk; unclear assignment of risk; poor insurancemanagement
Procurement Unenforceable conditions or contract clauses; adversarial relations
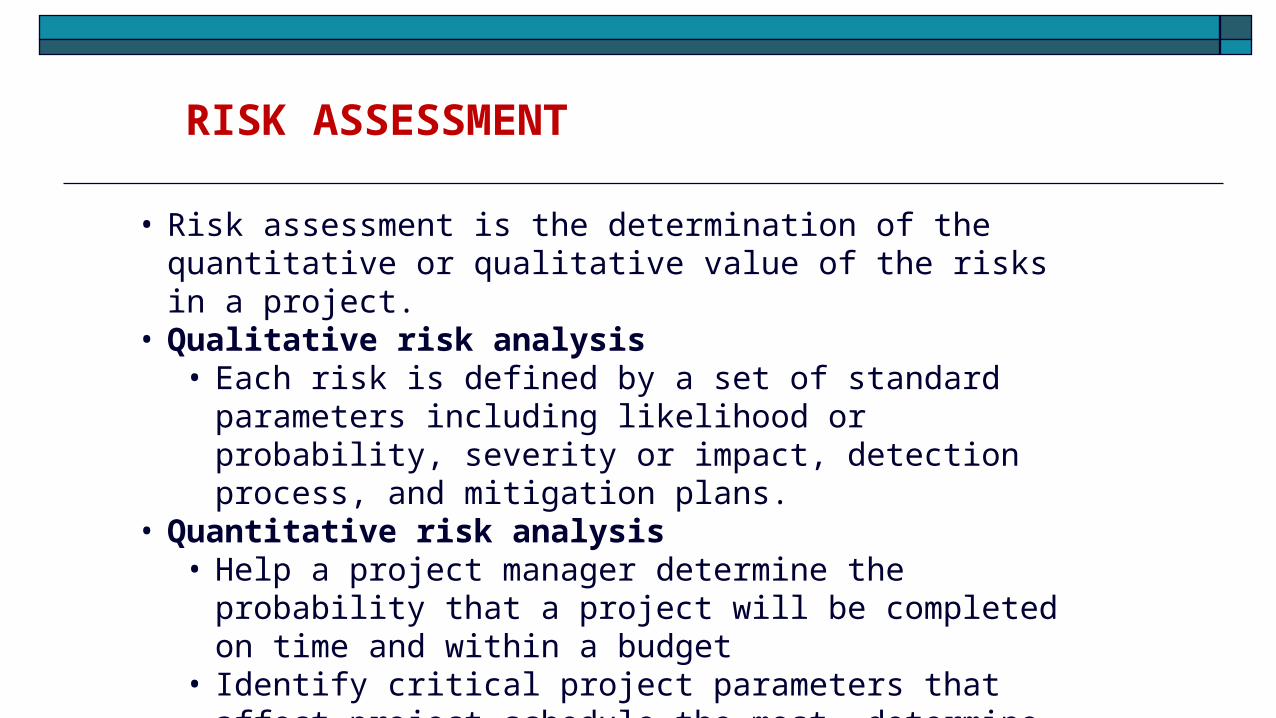
RISK ASSESSMENT
• Risk assessment is the determination of the quantitative or qualitative value of the risks in a project.
• Qualitative risk analysis• Each risk is defined by a set of standard parameters including
likelihood or probability, severity or impact, detection process, and mitigation plans.
• Quantitative risk analysis • Help a project manager determine the probability that a project
will be completed on time and within a budget • Identify critical project parameters that affect project schedule the
most, determine project success rate, and make decisions about viable project alternatives
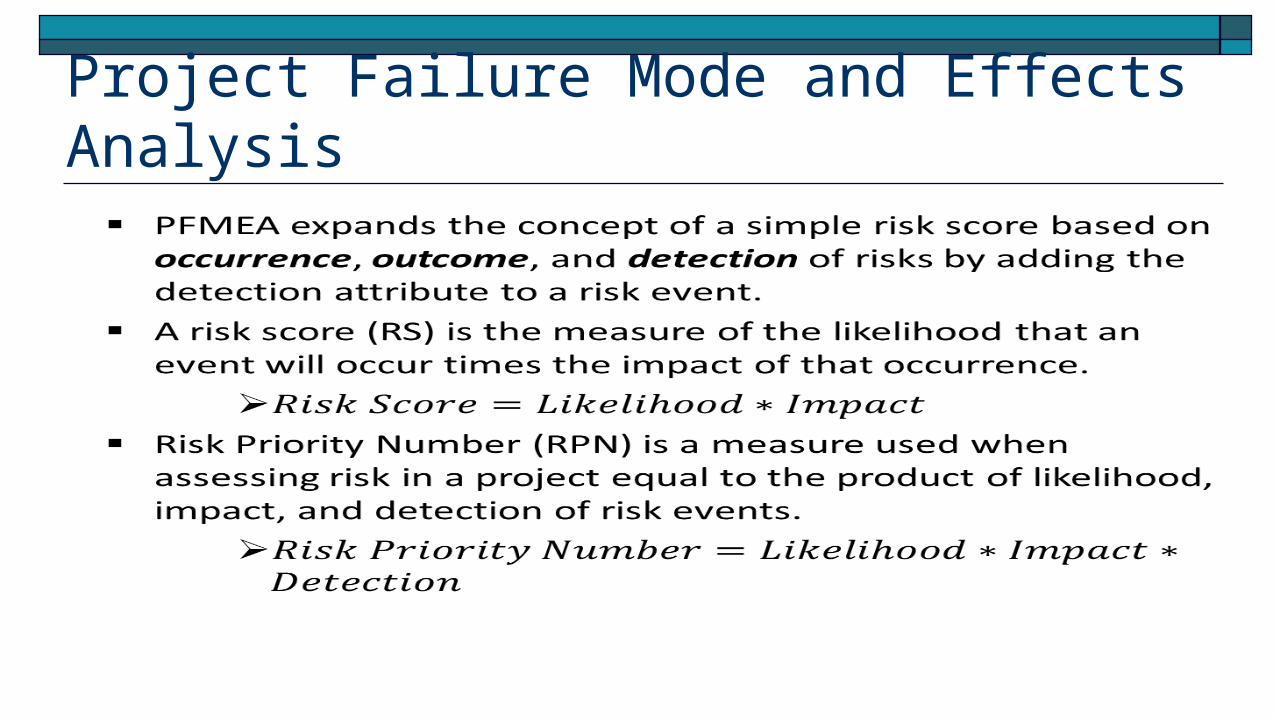
Project Failure Mode and Effects Analysis

Project Failure Mode and Effects Analysis RPN is a measure used when assessing risk in a project. Larger RPN values
normally indicate more critical failure modes or risks. Any risk that has an effect resulting in an impact of 9 or 10 would have a top
priority to control and mitigate. Impact is given the most weight when assessing risk.
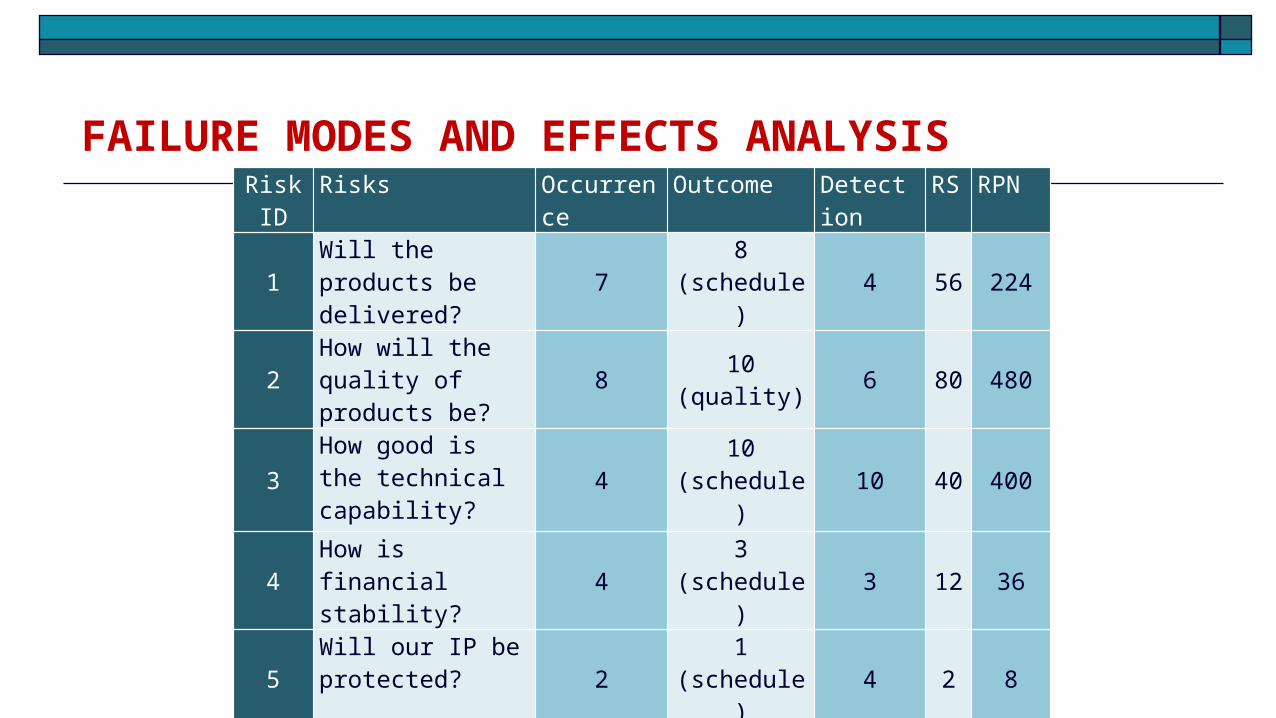
FAILURE MODES AND EFFECTS ANALYSISRisk ID
Risks Occurrence Outcome Detection RS RPN
1Will the products be delivered? 7 8
(schedule) 4 56 224
2How will the quality of products be? 8 10
(quality) 6 80 480
3
How good is the technical capability?
4 10(schedule) 10 40 400
4How is financial stability? 4 3
(schedule) 3 12 36
5Will our IP be protected? 2 1
(schedule) 4 2 8
Probability/Impact Matrix A probability/impact matrix or chart lists the relative probability of a
risk occurring on one side of a matrix or axis on a chart and the relative impact of the risk occurring on the other
List the risks and then label each one as high, medium, or low in terms of its probability of occurrence and its impact if it did occur
Can also calculate risk factors: Numbers that represent the overall risk of specific events based on their
probability of occurring and the consequences to the project if they do occur
PROBABILITY RATING FOR A HAZARD
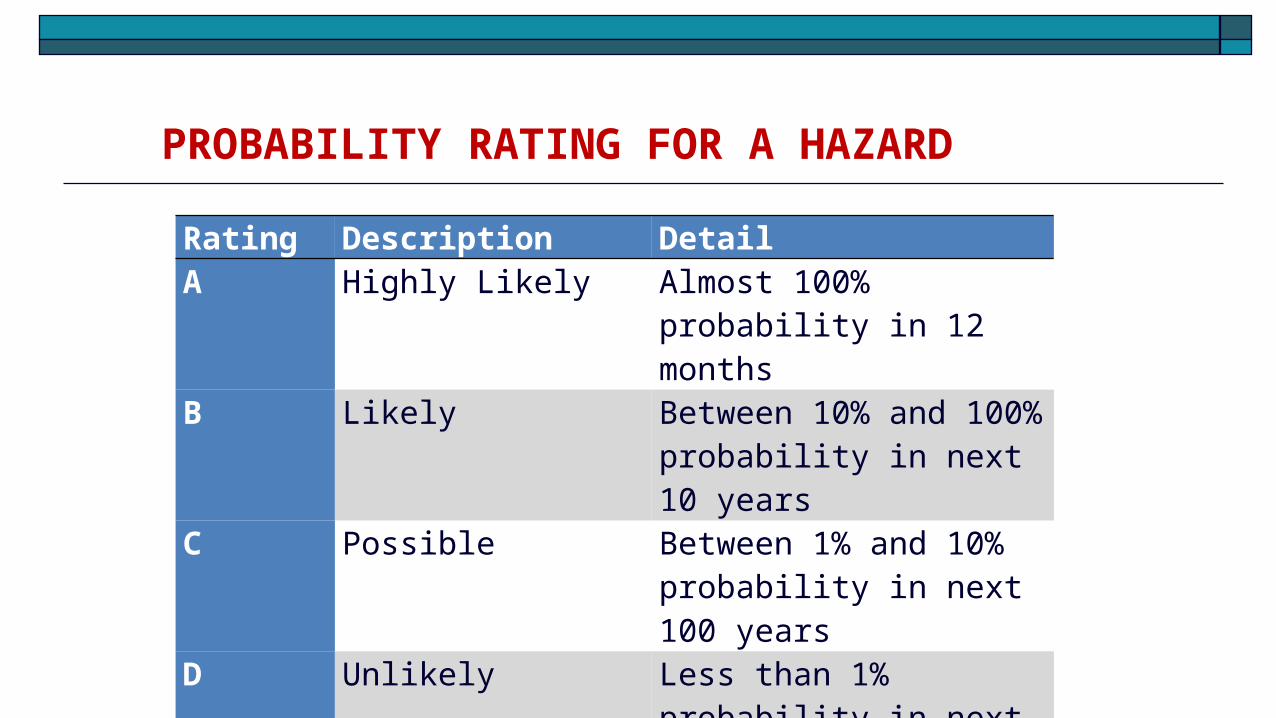
Rating Description DetailA Highly Likely Almost 100% probability in 12
monthsB Likely Between 10% and 100%
probability in next 10 yearsC Possible Between 1% and 10%
probability in next 100 yearsD Unlikely Less than 1% probability in
next 100 years
IMPACT RATING FOR A HAZARD
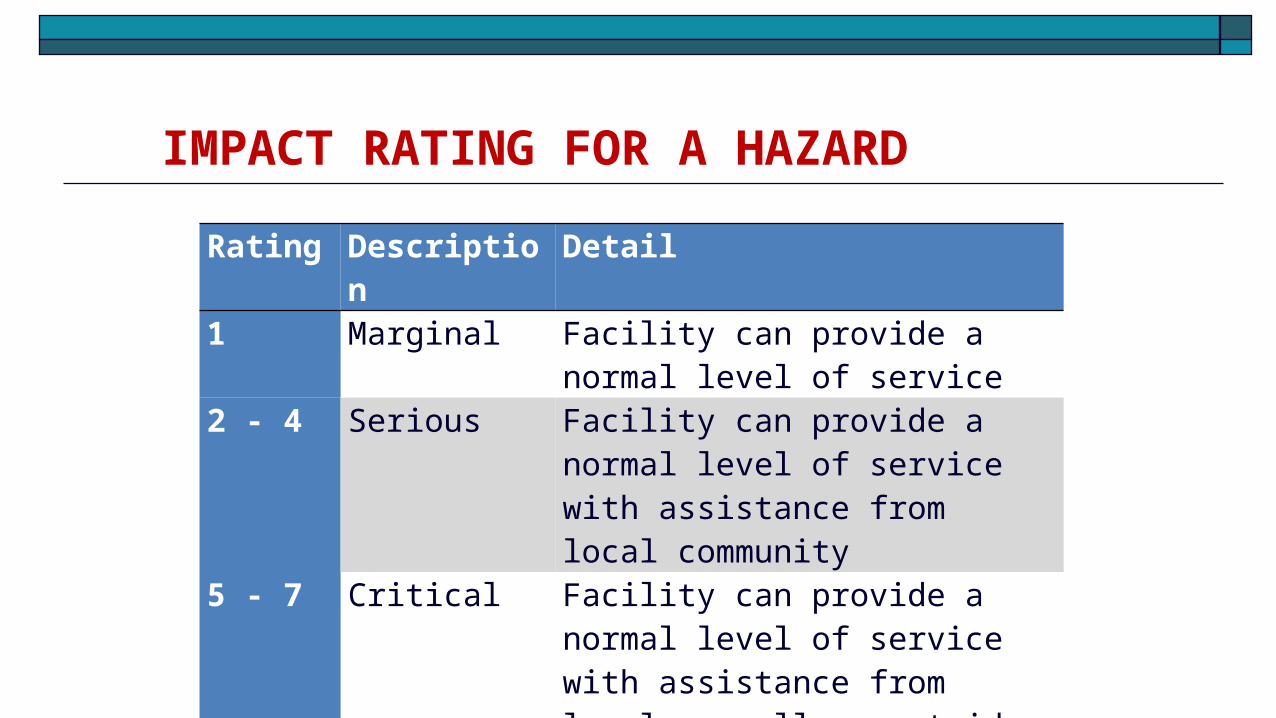
Rating Description Detail1 Marginal Facility can provide a normal level of
service 2 - 4 Serious Facility can provide a normal level of
service with assistance from local community
5 - 7 Critical Facility can provide a normal level of service with assistance from local as well as outside communities
8 - 10 Catastrophic Facility cannot provide services
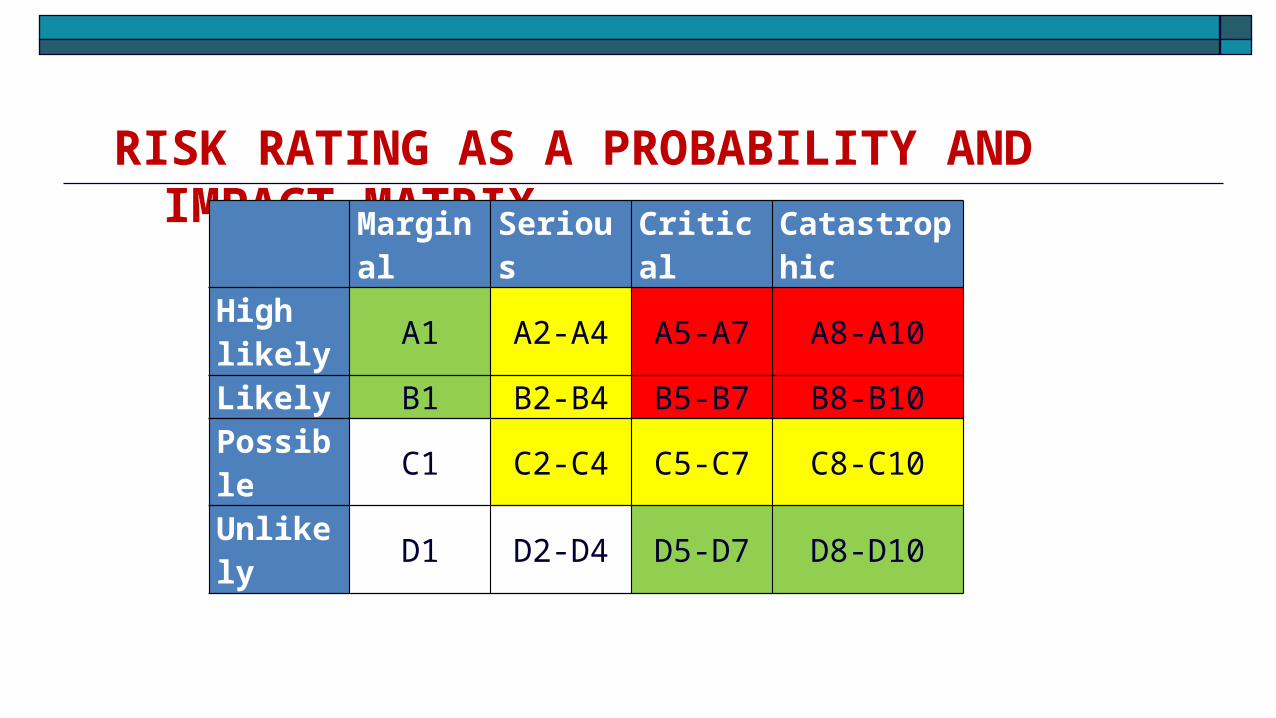
RISK RATING AS A PROBABILITY AND IMPACT MATRIXMarginal Serious Critical Catastrophic
High likely A1 A2-A4 A5-A7 A8-A10Likely B1 B2-B4 B5-B7 B8-B10Possible C1 C2-C4 C5-C7 C8-C10Unlikely D1 D2-D4 D5-D7 D8-D10
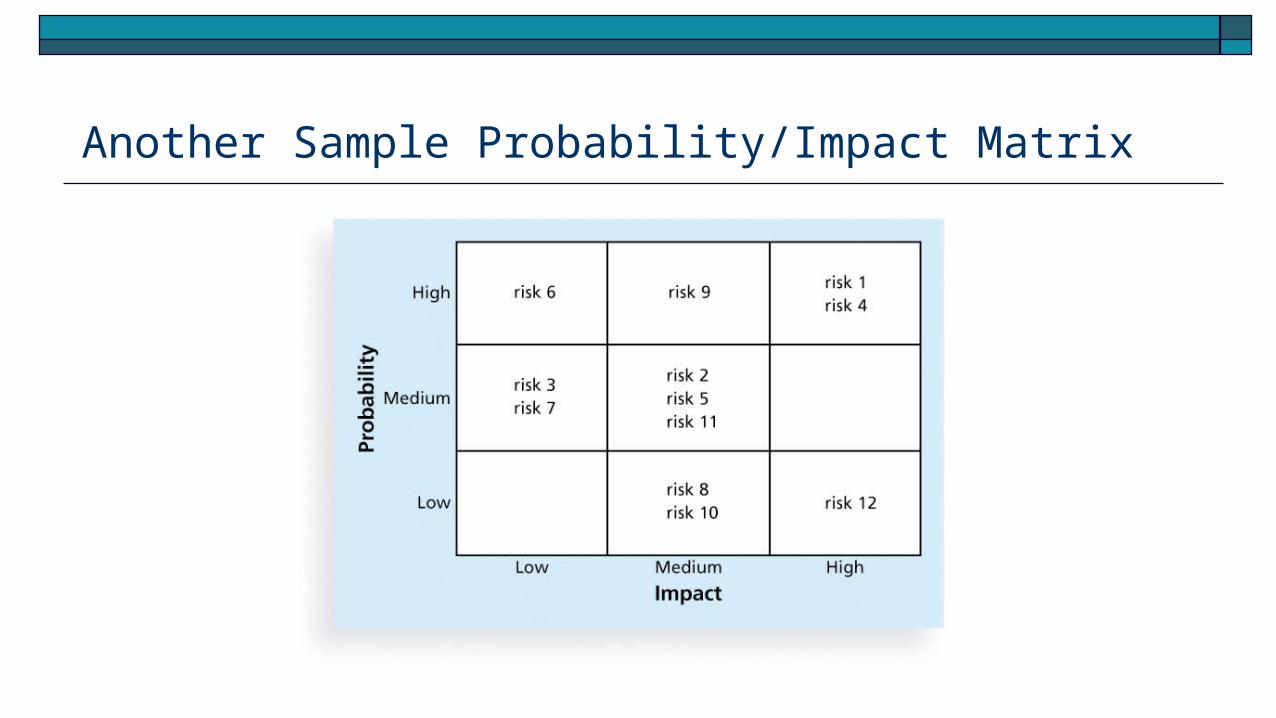
Another Sample Probability/Impact Matrix
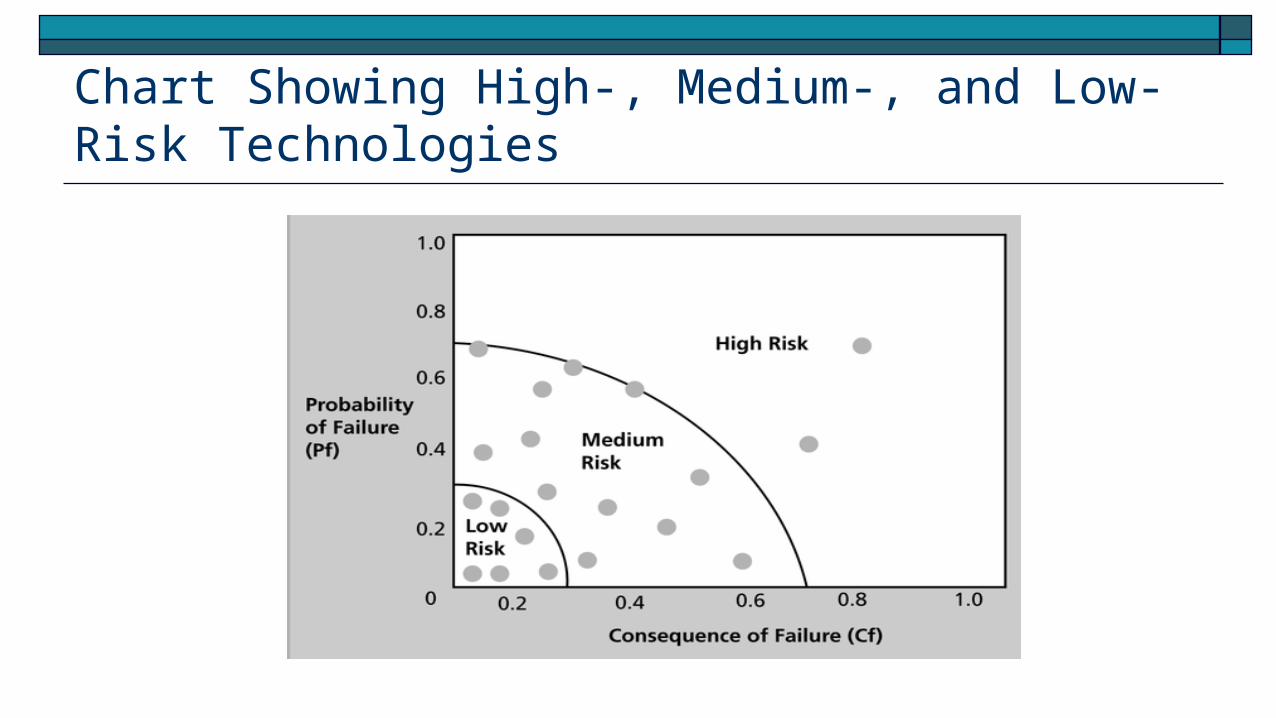
Chart Showing High-, Medium-, and Low-Risk Technologies
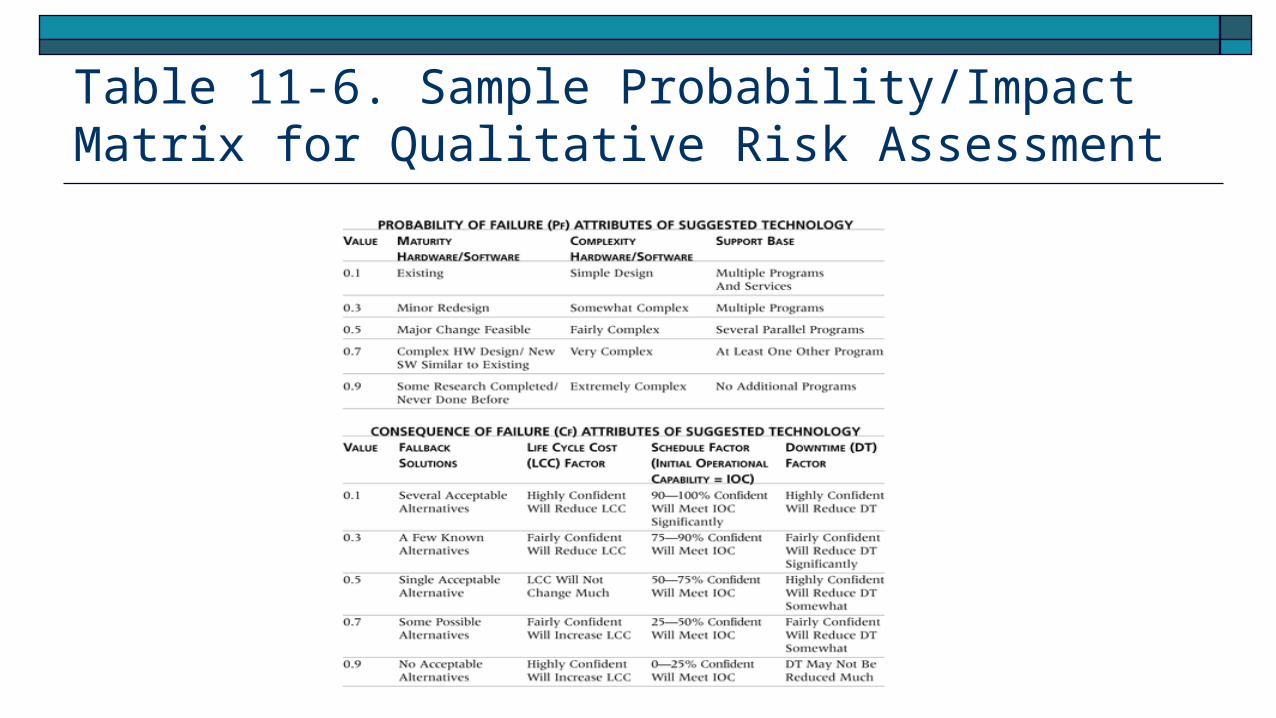
Table 11-6. Sample Probability/Impact Matrix for Qualitative Risk Assessment
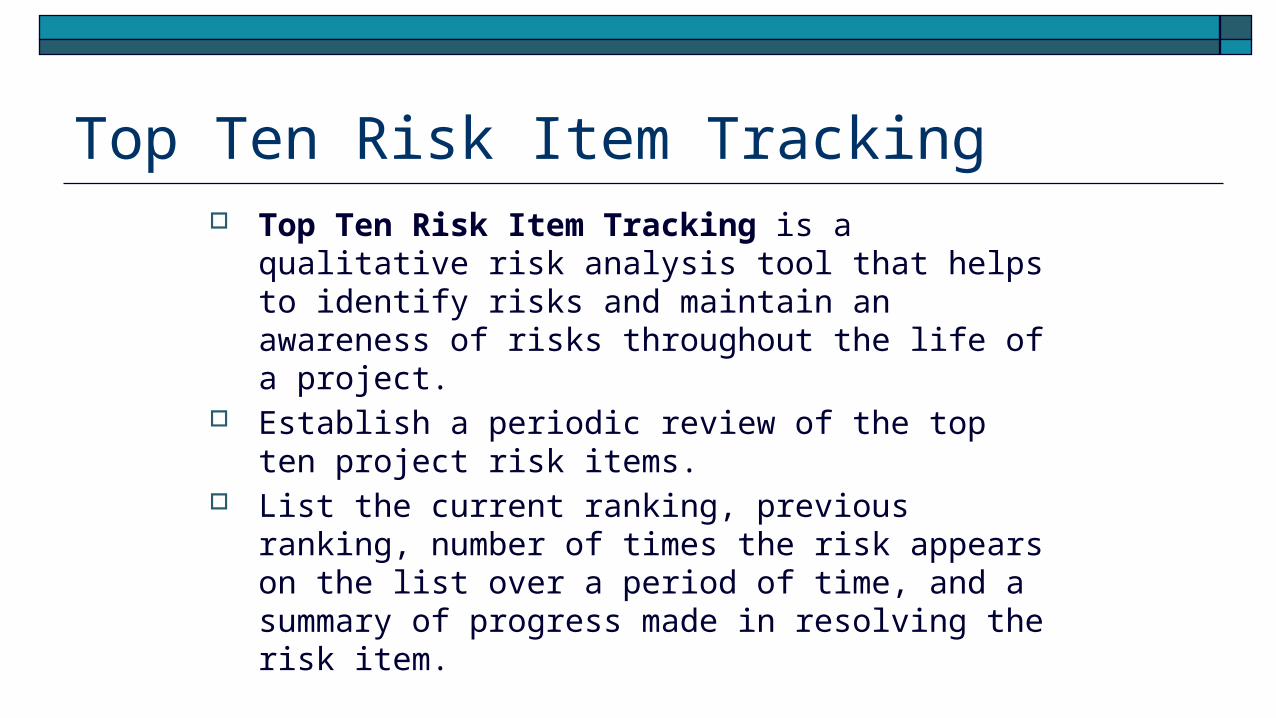
Top Ten Risk Item Tracking Top Ten Risk Item Tracking is a qualitative risk analysis
tool that helps to identify risks and maintain an awareness of risks throughout the life of a project.
Establish a periodic review of the top ten project risk items. List the current ranking, previous ranking, number of times
the risk appears on the list over a period of time, and a summary of progress made in resolving the risk item.
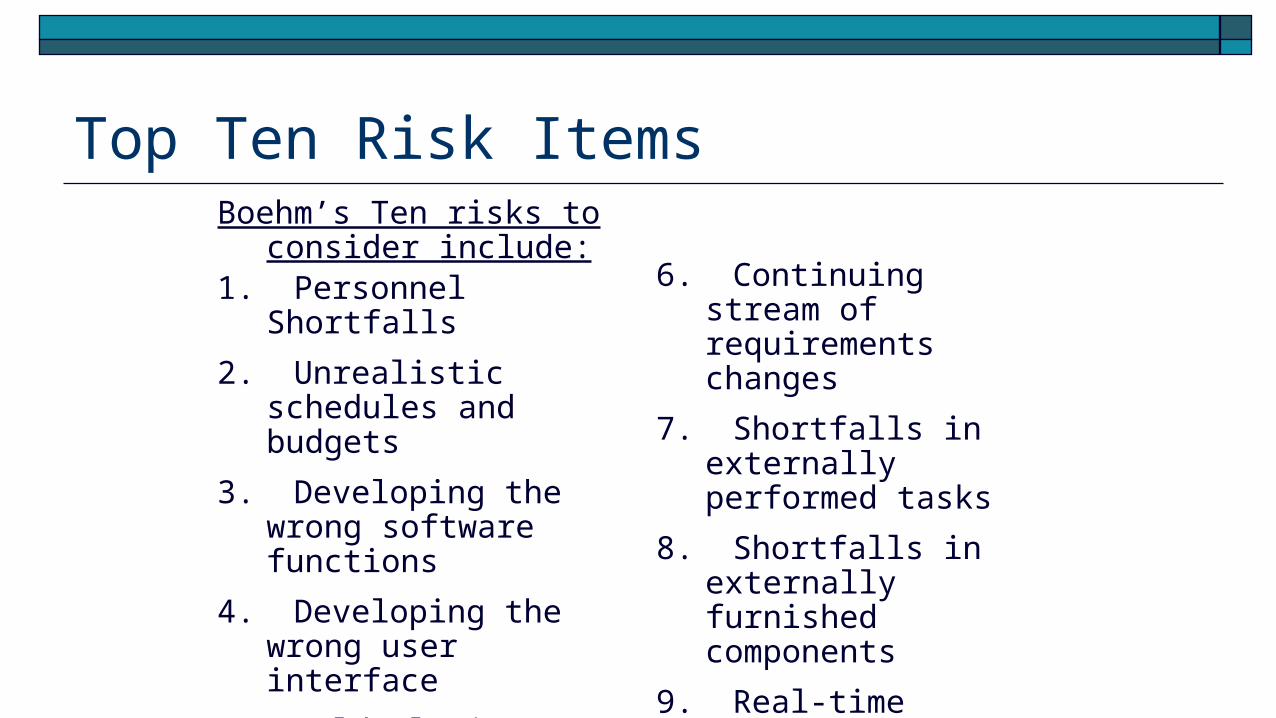
Top Ten Risk ItemsBoehm’s Ten risks to consider
include:1. Personnel Shortfalls
2. Unrealistic schedules and budgets
3. Developing the wrong software functions
4. Developing the wrong user interface
5. Gold plating
6. Continuing stream of requirements changes
7. Shortfalls in externally performed tasks
8. Shortfalls in externally furnished components
9. Real-time performance shortfalls
10. Straining computer science capabilities
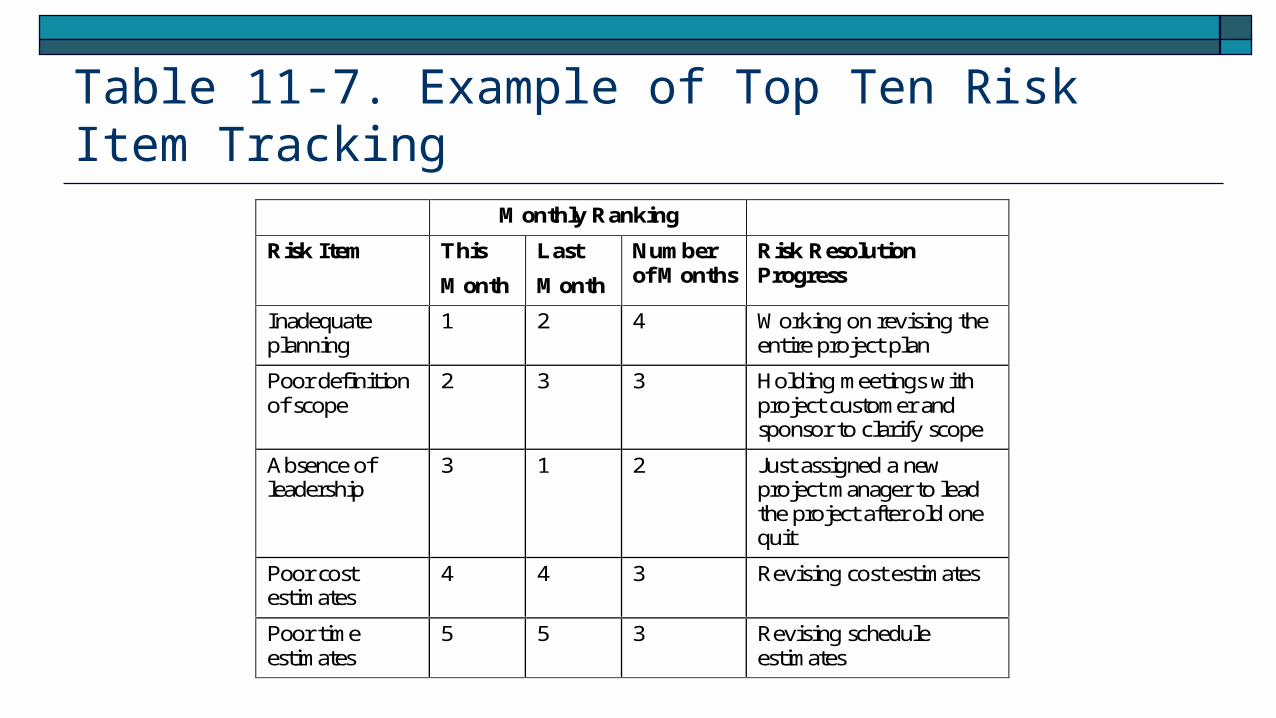
Table 11-7. Example of Top Ten Risk Item TrackingMonthly Ranking
Risk Item This
Month
Last
Month
Numberof Months
Risk ResolutionProgress
Inadequateplanning
1 2 4 Working on revising theentire project plan
Poor definitionof scope
2 3 3 Holding meetings withproject customer andsponsor to clarify scope
Absence ofleadership
3 1 2 Just assigned a newproject manager to leadthe project after old onequit
Poor costestimates
4 4 3 Revising cost estimates
Poor timeestimates
5 5 3 Revising scheduleestimates
Expert Judgment Many organizations rely on the intuitive feelings and past experience of
experts to help identify potential project risks. Experts can categorize risks as high, medium, or low with or without
more sophisticated techniques. Can also help create and monitor a watch list, a list of risks that are low
priority, but are still identified as potential risks.
Quantitative Risk Analysis Often follows qualitative risk analysis, but both can be done
together. Large, complex projects involving leading edge technologies
often require extensive quantitative risk analysis. Main techniques include:
Decision tree analysis Simulation Sensitivity analysis
Decision Trees and Expected Monetary Value (EMV)
A decision tree is a diagramming analysis technique used to help select the best course of action in situations in which future outcomes are uncertain.
Estimated monetary value (EMV) is the product of a risk event probability and the risk event’s monetary value.
You can draw a decision tree to help find the EMV.
BUT BEFORE DECISION TREE ANALYSIS …
Statistics terms to know: Probability Median Mode Mean Skew Variance Sigma or
Standard Deviation
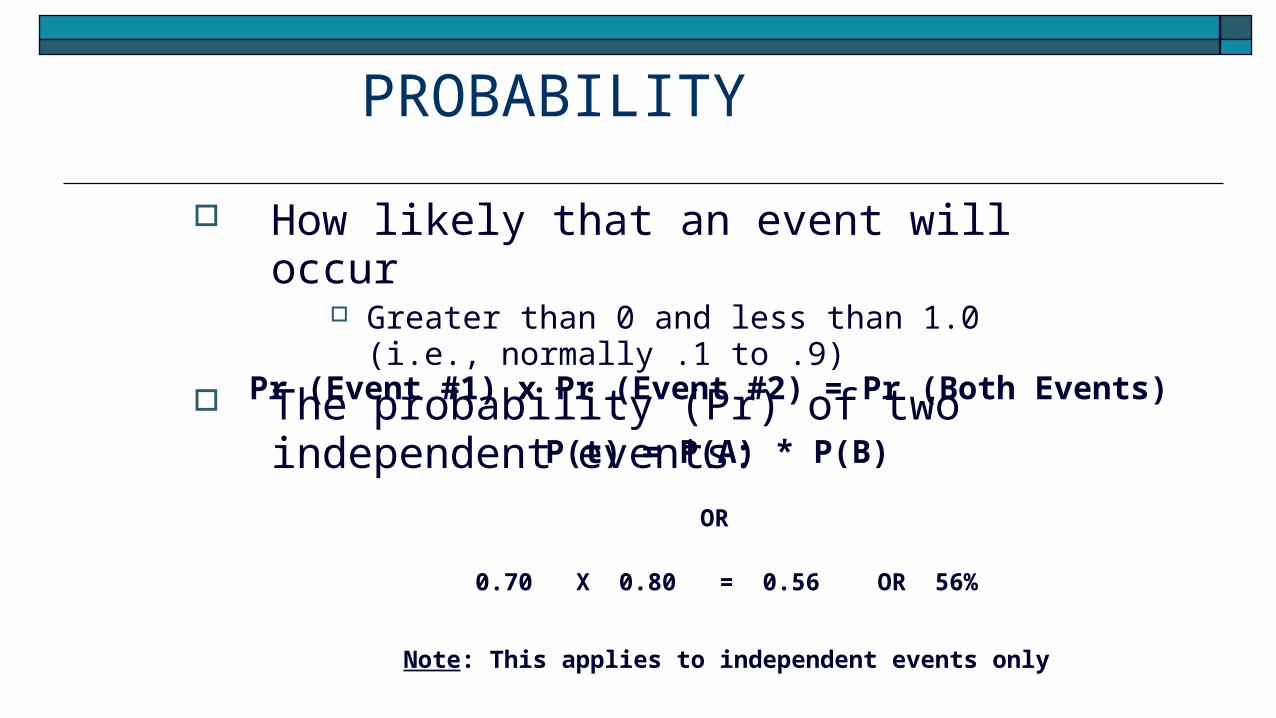
How likely that an event will occur Greater than 0 and less than 1.0 (i.e., normally .1 to .9)
The probability (Pr) of two independent events:
PROBABILITY
Pr (Event #1) x Pr (Event #2) = Pr (Both Events)
0.70 X 0.80 = 0.56 OR 56%
Note: This applies to independent events only
OR
P(t) = P(A) * P(B)
Likelihood of an event can be considered as multiple probabilities: Low (a) Most Likely (m) High (b)
This concept is applied in more complex projects, using the “PERT” approximations
PROBABILITY (continued)
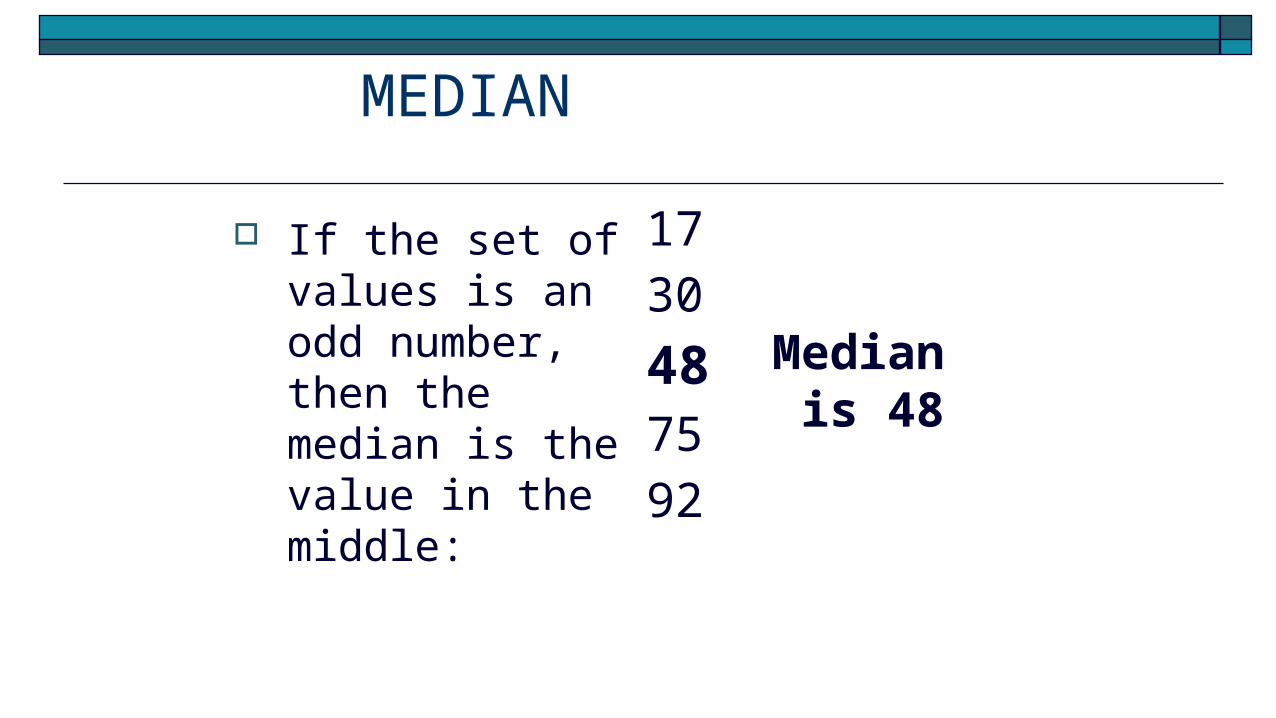
If the set of values is an odd number, then the median is the value in the middle:
17 30
487592
Median is 48
MEDIAN

If the set of values is an even number, then the medianis half-way between the two middle values:
The median is half-way between 30 and 48, so the median here is 39.
17 30
30487592
MEDIAN (continued)
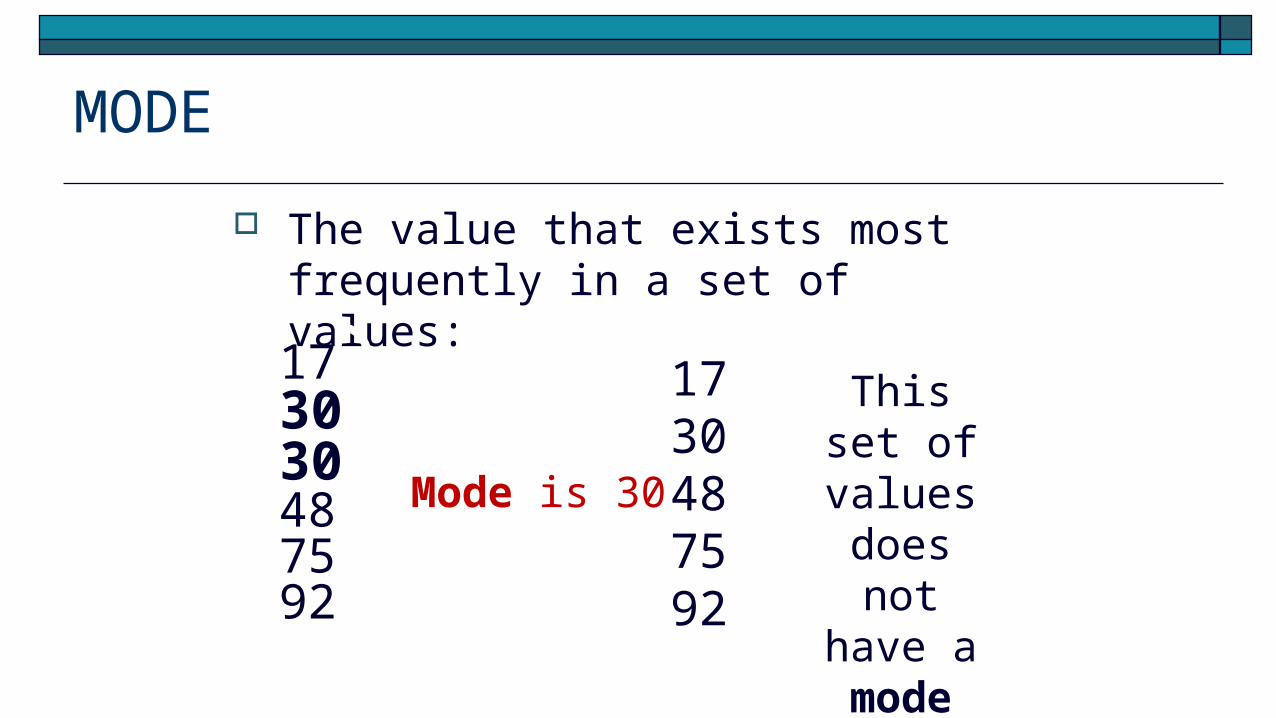
The value that exists most frequently in a set of values:
Mode is 30
17 3030487592
This set of values
does not have a mode
17 30487592
MODE
Mean, or x (aka: Expected Value)
The simple definition: The average Add up all the values and divide by the number of values
The definition for more complex projects: The weighted average
Weighted by the likelihood of the occurrence
MEAN
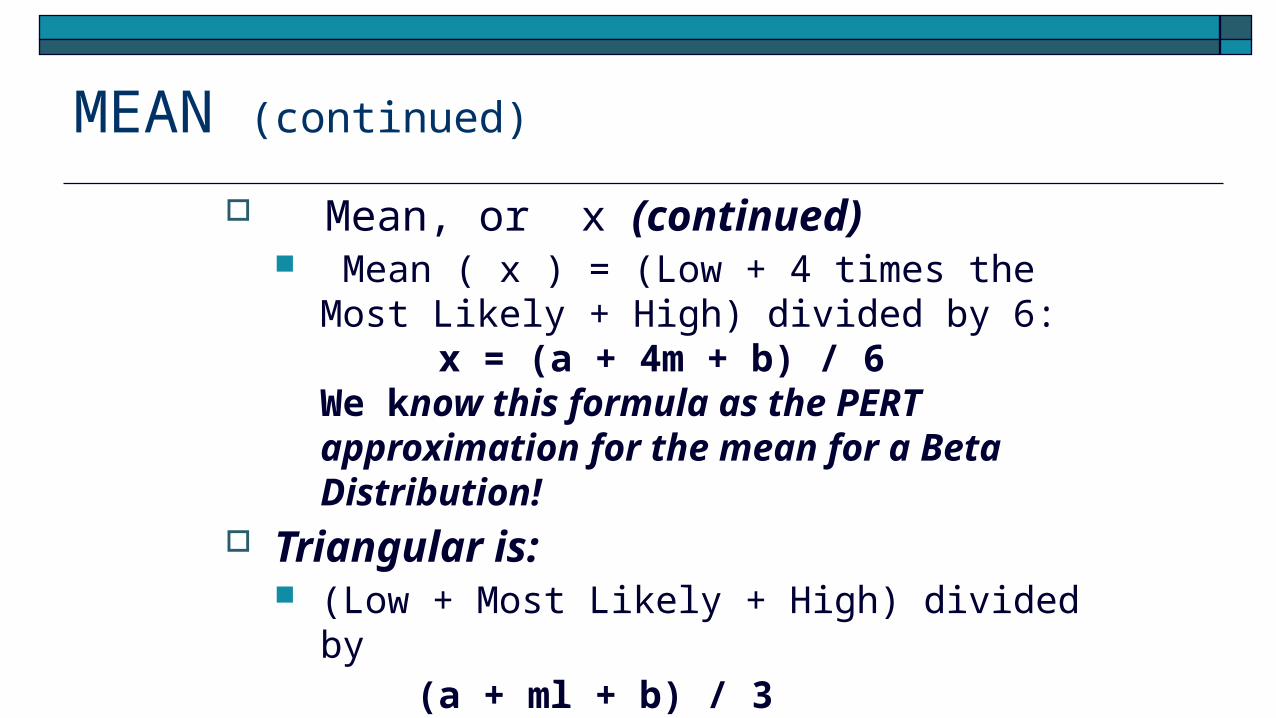
Mean, or x (continued) Mean ( x ) = (Low + 4 times the Most Likely +
High) divided by 6: x = (a + 4m + b) / 6We know this formula as the PERT approximation for the mean for a Beta Distribution!
Triangular is: (Low + Most Likely + High) divided by
(a + ml + b) / 3
MEAN (continued)
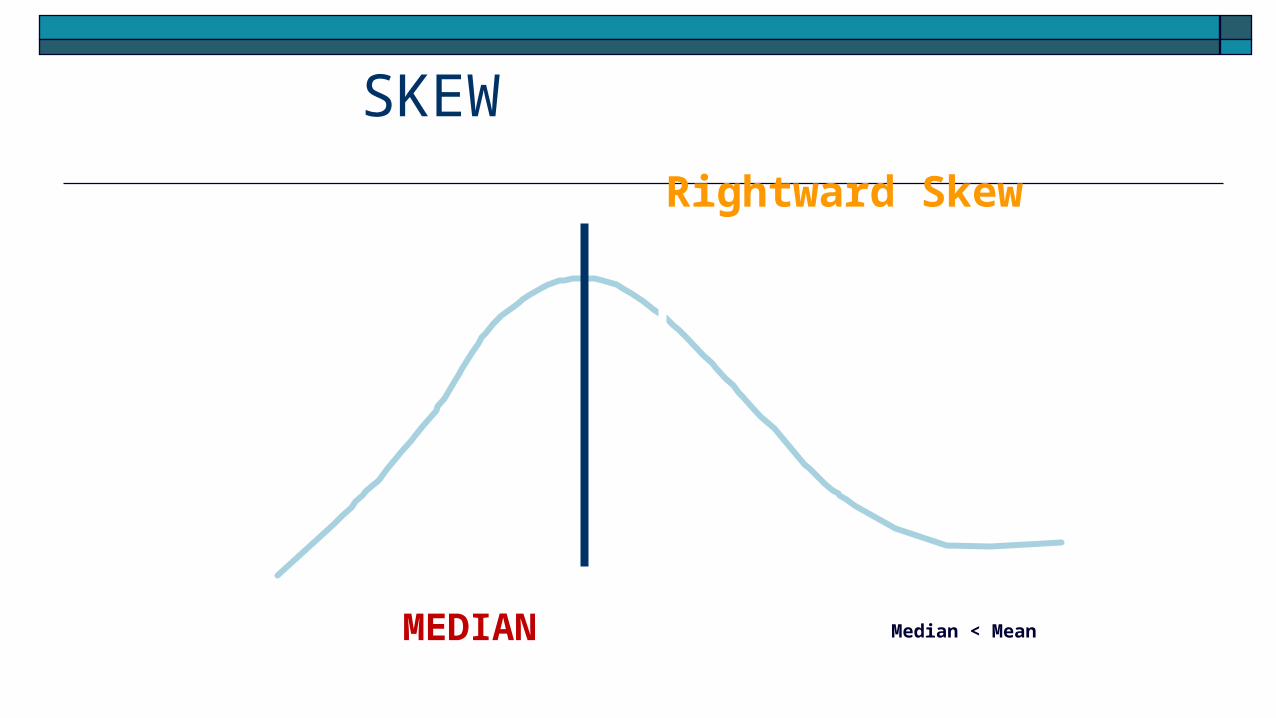
MEDIAN MEAN
Rightward Skew
SKEW
Median < Mean
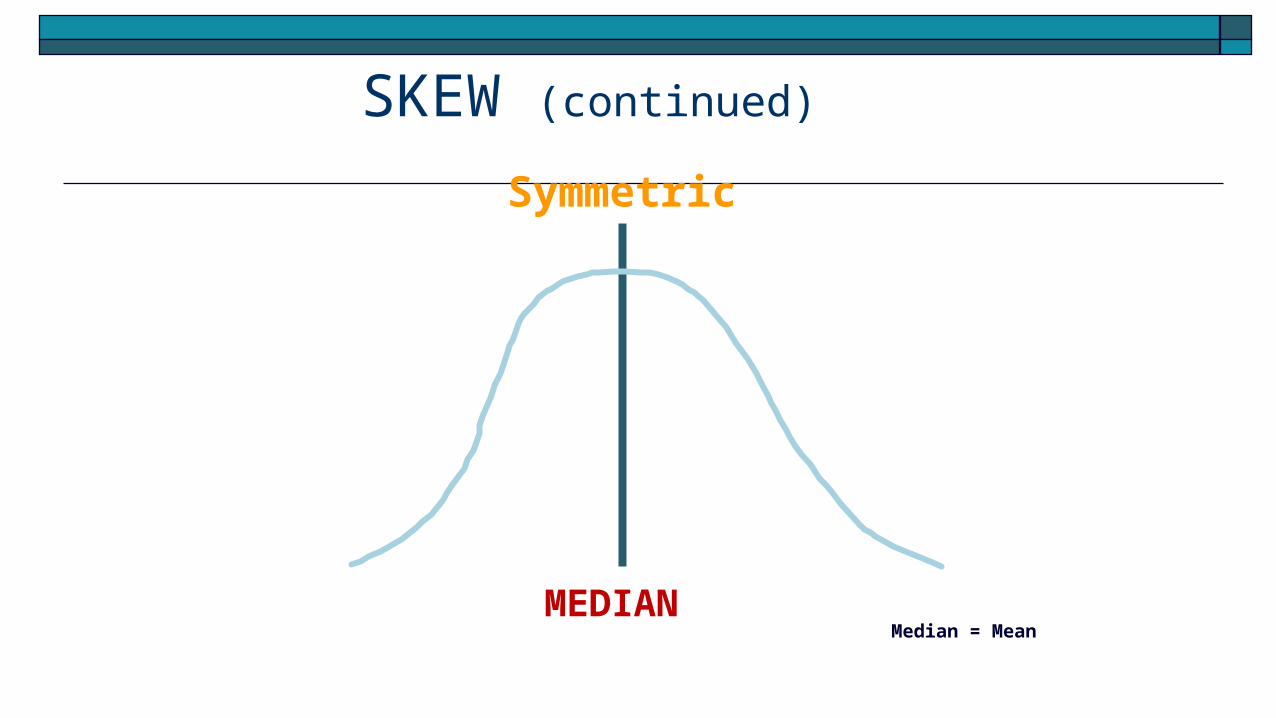
Symmetric
SKEW (continued)
MEDIAN MEAN
Median = Mean
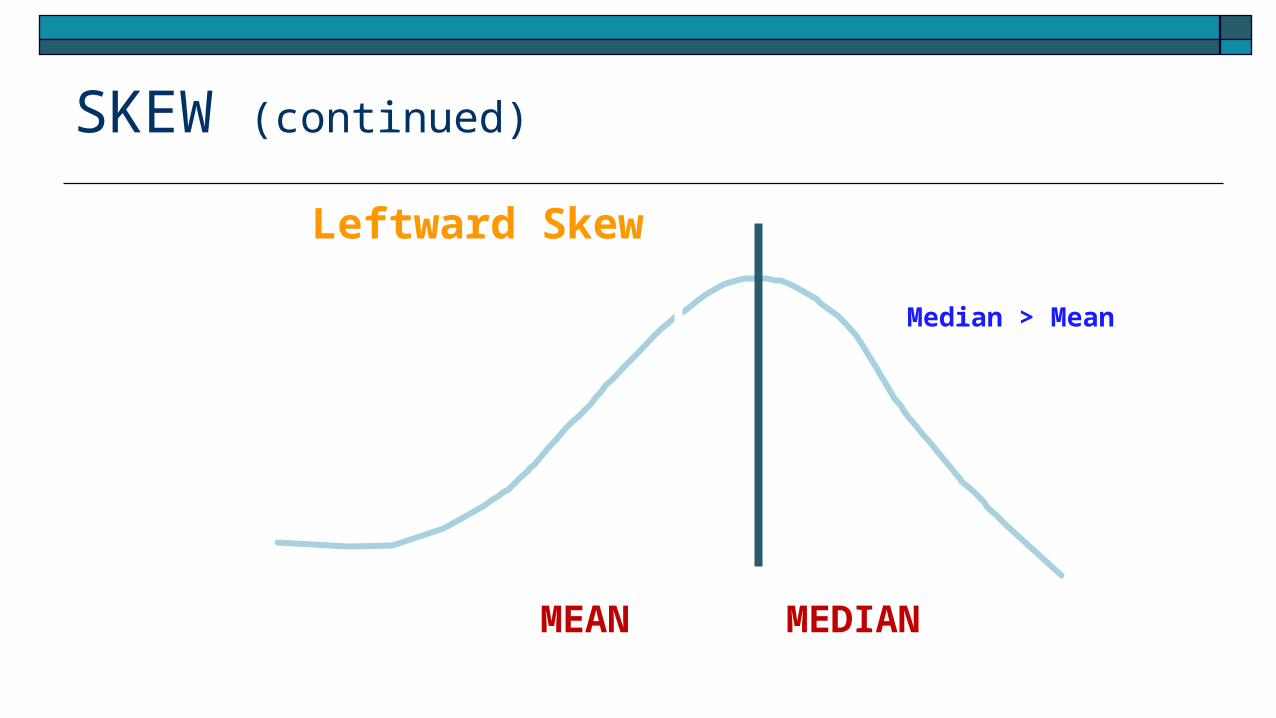
MEAN MEDIAN
Leftward Skew
SKEW (continued)
Median > Mean
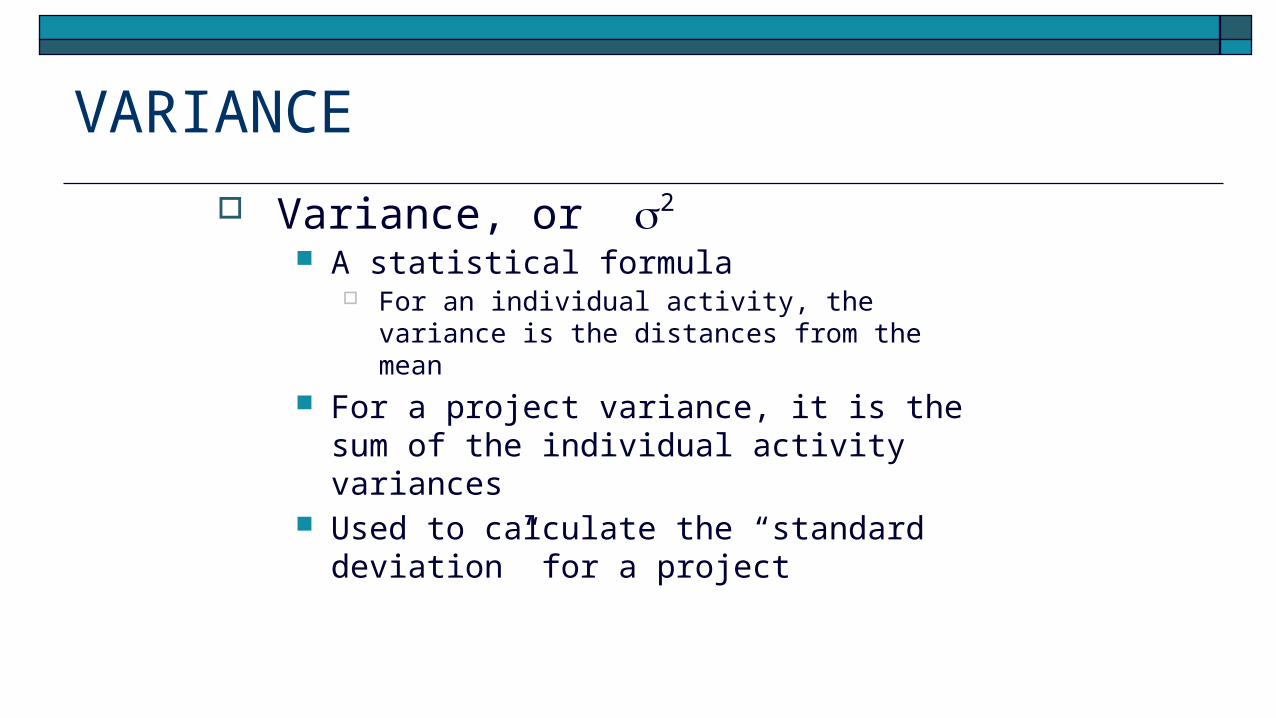
Variance, or 2
A statistical formula For an individual activity, the variance is the distances
from the mean For a project variance, it is the sum of the
individual activity variances Used to calculate the “standard deviation” for a
project
VARIANCE

Sigma, or (aka: Standard Deviation ) The square root of the sum of the variances The measure of the distance from the mean in a
set of probabilities In other words, the probability distribution for a
project Can be used to display the level of risk for the
project
SIGMA
Standard deviation = sum of the variances
PROBABILITY EXAMPLE
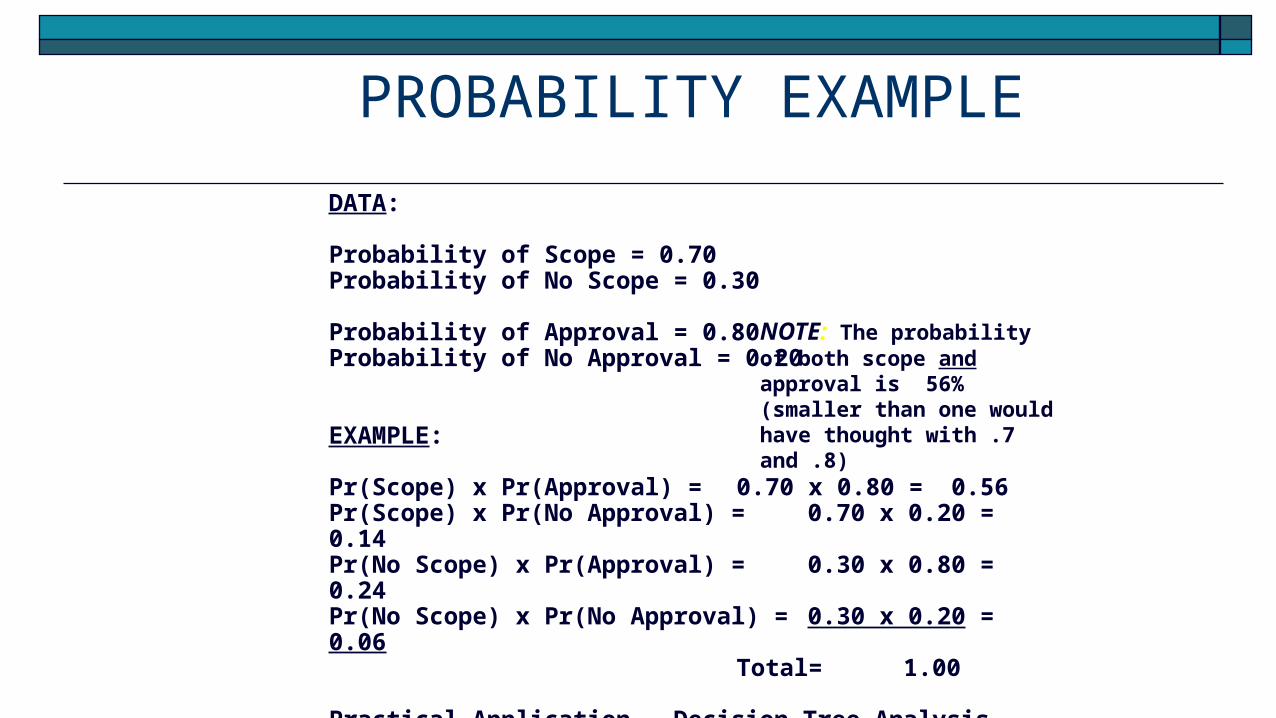
DATA:
Probability of Scope = 0.70Probability of No Scope = 0.30
Probability of Approval = 0.80Probability of No Approval = 0.20
EXAMPLE:
Pr(Scope) x Pr(Approval) = 0.70 x 0.80 = 0.56Pr(Scope) x Pr(No Approval) = 0.70 x 0.20 = 0.14Pr(No Scope) x Pr(Approval) = 0.30 x 0.80 = 0.24Pr(No Scope) x Pr(No Approval) = 0.30 x 0.20 = 0.06 Total= 1.00
Practical Application - Decision Tree Analysis
NOTE: The probability of both scope and approval is 56% (smaller than one would have thought with .7 and .8)
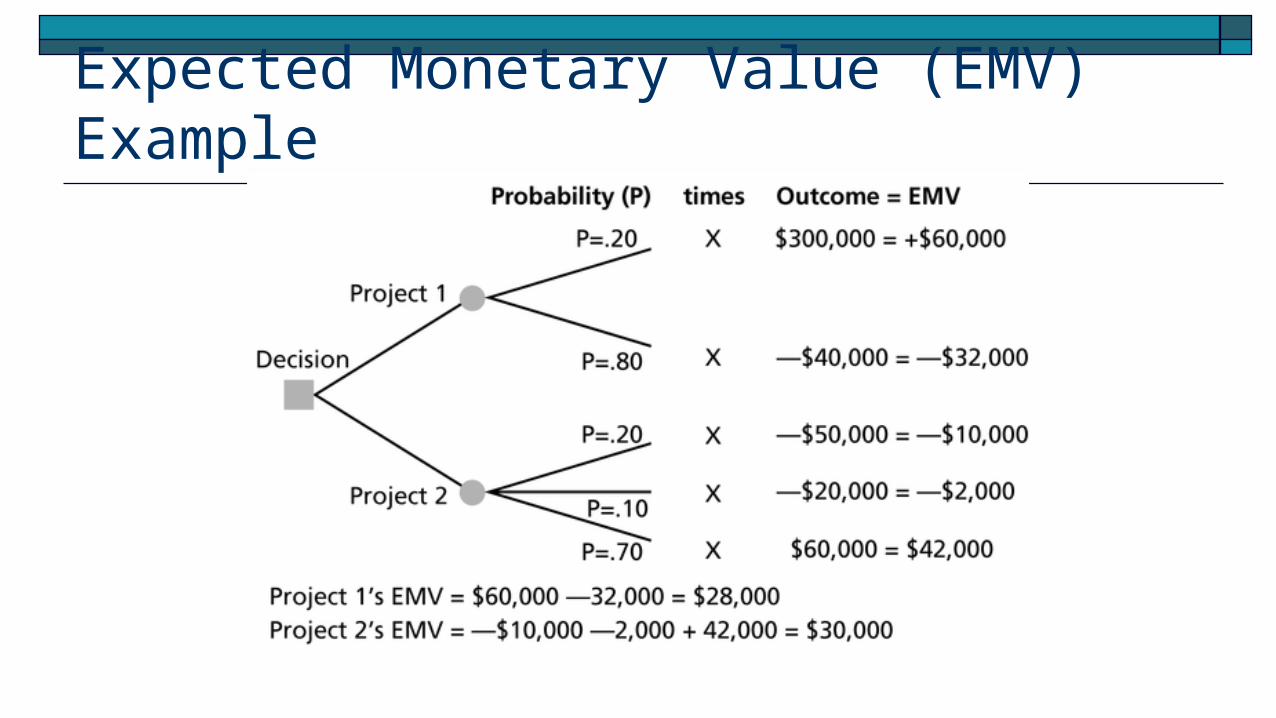
Expected Monetary Value (EMV) Example
DECISION TREES EXAMPLE TWO
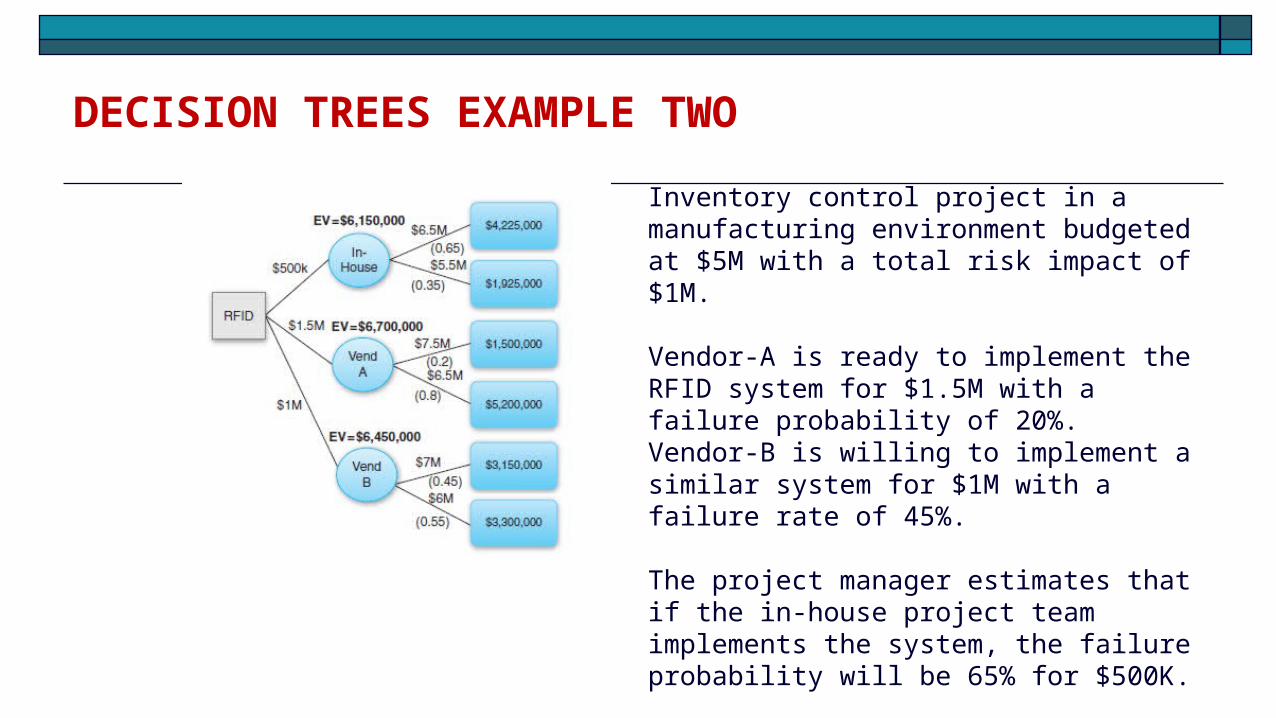
Inventory control project in a manufacturing environment budgeted at $5M with a total risk impact of $1M.
Vendor-A is ready to implement the RFID system for $1.5M with a failure probability of 20%. Vendor-B is willing to implement a similar system for $1M with a failure rate of 45%.
The project manager estimates that if the in-house project team implements the system, the failure probability will be 65% for $500K.
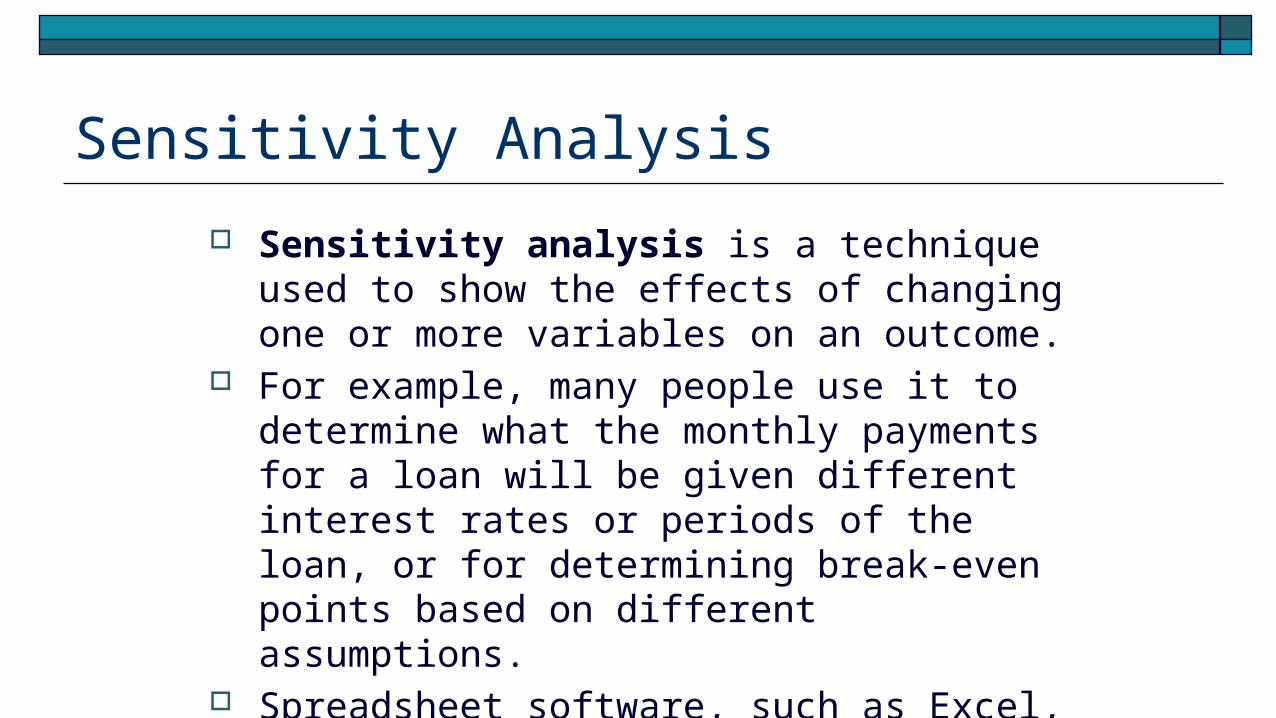
Sensitivity Analysis
Sensitivity analysis is a technique used to show the effects of changing one or more variables on an outcome.
For example, many people use it to determine what the monthly payments for a loan will be given different interest rates or periods of the loan, or for determining break-even points based on different assumptions.
Spreadsheet software, such as Excel, is a common tool for performing sensitivity analysis.
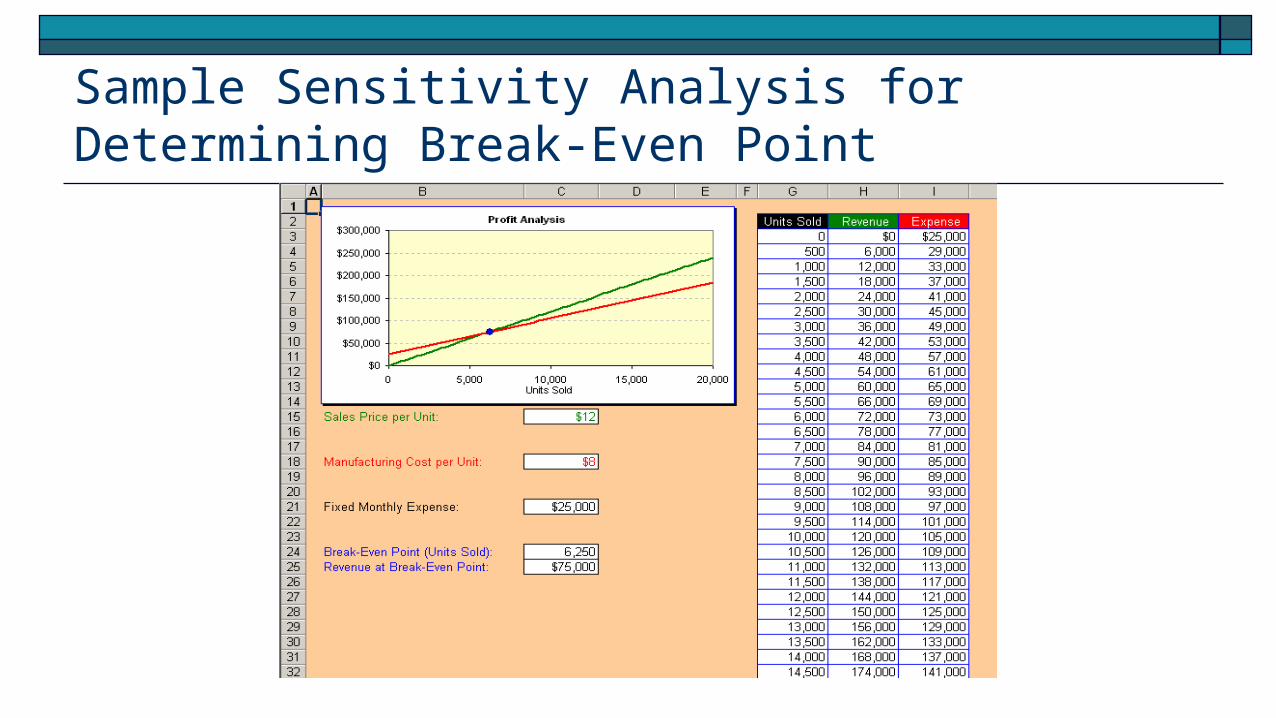
Sample Sensitivity Analysis for Determining Break-Even Point
In Class Activity Refer to the Expected Monetary Value Handout.