Embed Size (px)
Citation preview

Project Quality
Management
Prof. Dr. Daning Hu
Department of Informatics
University of Zurich

Learning Objectives
Define project quality management and understand how
quality relates to various aspects of information technology
projects.
Understand quality planning and the components of a
Quality Assurance / Management Plan.
Describe what quality assurance is.
Describe what quality control is.
Understand the tools and techniques for quality control, such
as Pareto analysis, statistical sampling, Six Sigma, quality
control charts, and testing.
2
What Went Wrong?
In 1986, two hospital patients died after receiving fatal doses of radiation from a Therac 25 machine after a software problem caused the machine to ignore calibration data.
Britain’s Coast Guard was unable to use its computers for several hours in May 2004 after being hit by the Sasser virus, which knocked out the electronic mapping systems, e-mail, and other computer functions, forcing workers to revert to pen, paper, and radios.
More than 100 incidents of lost or stolen financial information were reported over the past year, including personal information of 1.2 federal employees, 200,000 online trading customers, and 33,000 Air Force officers
3

What Is Project Quality?
The International Organization for Standardization (ISO) defines
quality as “the degree to which a set of inherent characteristics
fulfills requirements” (ISO9000:2000).
Other experts define quality based on:
Conformance to requirements: the project’s processes and products meet
written specifications.
Fitness for use: a product can be used as it was intended.
4
What Is Project Quality Management?
Project quality management ensures that the project will satisfy the needs for which it was undertaken.
Processes include:
Quality Planning: identifying which quality standards are relevant to the project and how to satisfy them
Quality Assurance: periodically evaluating overall project performance to ensure the project will satisfy the relevant quality standards
Quality Control: monitoring specific project results to ensure that they comply with the relevant quality standards
5

Quality Planning
Implies the ability to anticipate situations and
prepare actions to bring about the desired
outcome
Important to prevent defects by:
Selecting proper materials
Training and indoctrinating people in quality
Planning a process that ensures the appropriate
outcome 6
Quality Assurance
Quality assurance includes all the activities related to
satisfying the relevant quality standards for a project
Another goal of quality assurance is continuous quality
improvement
Benchmarking generates ideas for quality improvements
by comparing specific project practices or product
characteristics to those of other projects or products
within or outside the performing organization
A quality audit is a structured review of specific quality
management activities that help identify lessons learned
that could improve performance on current or future
projects
Performed by in-house auditors or third parties 7

Chapter 8 - Project Quality Management
Quality Control
Although one of the main goals of QC is to improve
quality, its main outcomes are:
Acceptance decisions- are the products/services
acceptable or should they be rejected and rework is then
necessary
Rework – action taken to bring rejected items into
compliance with products specs. Can be very expensive
Process adjustments – correct or prevent further
quality problems based on quality control measurements
(purchase faster server if response time is too slow)
There are Seven Basic Tools of Quality that help in
performing quality control8

The Cost of Quality
Total cost to produce the product or service of the project according to the quality standards.
The cost of quality is the cost of conformance plus the cost of nonconformance
Conformance means delivering products that meet requirements and fitness for use.
Cost of nonconformance means taking responsibility for failures or not meeting quality expectations.
There is no free lunch!

Cost of Quality
Prevention costs
Keeping defects out of the hands of customers
Includes things like quality planning, training, design reviews
Appraisal costs
Expended to examine the product or process and make certain
the requirements are being met
Like inspection and testing, buying test equipment

Cost of Quality
Failure costs
What it costs when things don’t go according to plan
2 types
Internal failure cost
product is still in the control of the organization
Include corrective action, rework, scrapping and downtime
External failure cost
Product has reached the customer
Include inspections at the customer site, returns, and customer service costs
Plan Quality
What quality standard?
How to achieve that?
Training
Walkthroughs
Reviews
Quality audits
How to make things better – process improvement?
Who is responsible for what?
Project managers are ultimately responsible for quality
management on their projects
12
How Do you Measure Quality of IT Systems?
No. of bugs
Performance
Response time
Volume of data and transactions system should be capable of handling
Usability
Reliability
The ability of a product or service to perform as expected under normal
conditions
Availability
Mean time between failure (MTBF), mean time to recover (MTTR)
13
Perform Quality Assurance
Determining whether standards are being met
Identifying improvements
E.g. recommend certain practices or equipment
Focus on the process
14
Tools Used in Quality Assurance
Benchmarking
comparing specific project practices or product characteristics to those of other projects or products within or outside the performing organization.
Quality audit
See if you are complying with the standards and procedures
Can be done by internal staff (e.g. from QA department) or outsider
Can be scheduled or ad-hoc

Perform Quality Control
Looks at specific measurements to see if project and its
processes are in control
Study the product/result
16
Basic Tools of Quality
Cause & Effect Diagram
Control Chart
Run Chart
Scatter Diagram
Histogram
Pareto Diagram
Flowchart
Cause-and-Effect Diagrams
Cause-and-effect diagrams trace complaints about quality
problems back to the responsible production operations.
They help you find the root cause of a problem.
Also known as fishbone or Ishikawa diagrams.
18

Figure 1: Sample Cause-and-Effect Diagram
19

Chapter 8 - Project Quality Management
Sample Cause-and-Effect Diagram
20
Possible causes of staff leaving before the end of a project
They may include environment, ambition, career prospects,
satisfaction (variety, challenges, recognition), remuneration (basic
pay, benefits - car, health, pension).
Quality Control Charts
A control chart is a graphic display of data that illustrates the
results of a process over time.
The main use of control charts is to prevent defects, rather than
to detect or reject them.
Quality control charts allow you to determine whether a process
is in control or out of control.
21
The Seven Run Rule
You can use quality control charts and the seven run rule to
look for patterns in data.
The seven run rule states that if
seven data points in a row are all below the mean, above the mean, or
are all increasing or decreasing
then the process needs to be examined for nonrandom problems
22

Figure 2: Sample Quality Control Chart
23
The rule violations indicate that a calibration device may need adjustment
Run Chart
A run chart displays the history and pattern of variation of a
process over time.
It is a line chart that shows data points plotted in the order in
which they occur.
Can be used to perform trend analysis to forecast future
outcomes based on historical patterns.
24

Figure 3: Sample Run Chart
25
Scatter Diagram
A scatter diagram helps to show if there is a relationship
between two variables.
The closer data points are to a diagonal line, the more closely
the two variables are related.
26
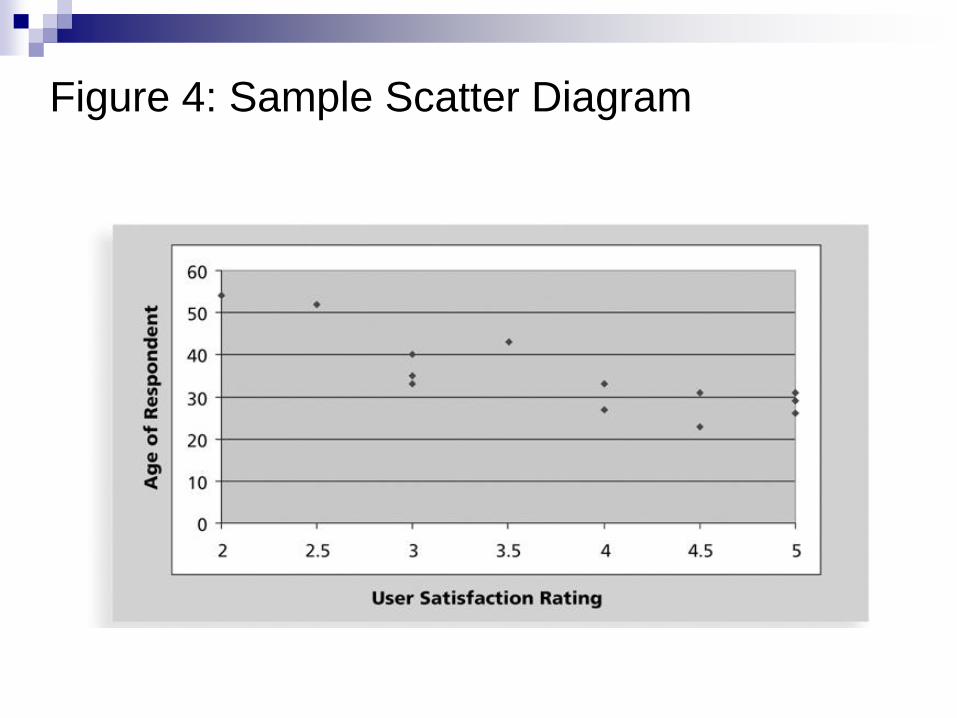
Figure 4: Sample Scatter Diagram
27
Histograms
A histogram is a bar graph of a distribution of variables.
Each bar represents an attribute or characteristic of a problem
or situation, and the height of the bar represents its frequency.
28
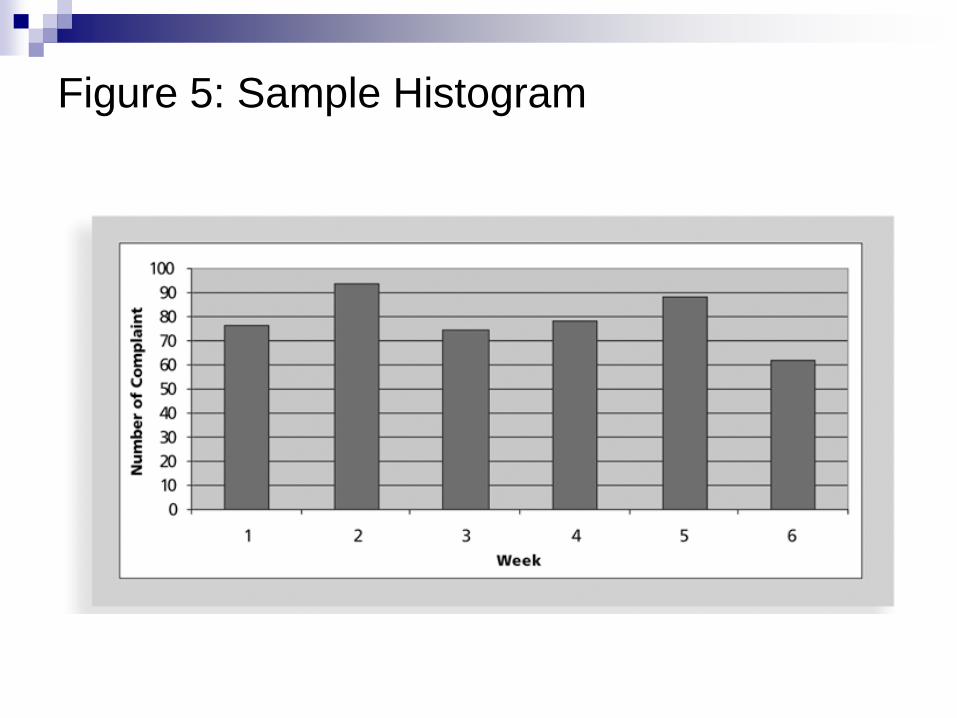
Figure 5: Sample Histogram
29
Pareto Charts
A Pareto chart is a histogram that can help you identify
and prioritize problem areas.
Pareto analysis is also called the 80-20 rule, meaning
that 80 percent of problems are often due to 20 percent of
the causes.
In the following chart, Log-in Problems account for about
55% of the complaints and together with System lock-ups
accounts for about 80% Fixing these two problems can greatly reduce the volume of
compalints
Small problems should be investigated before addressing them in
case the user is in error
30
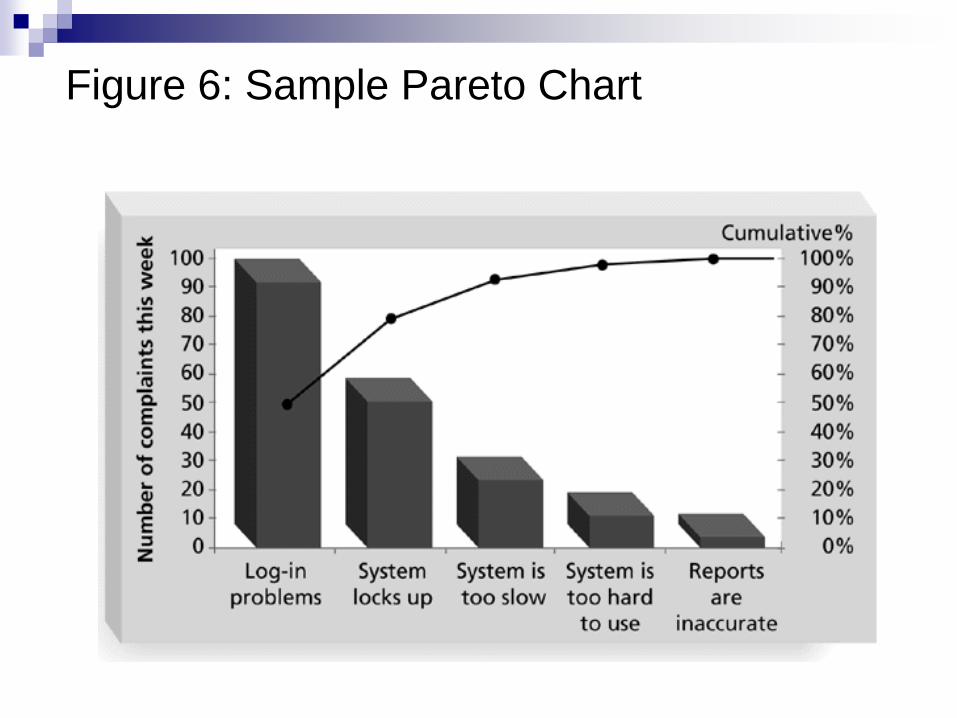
Figure 6: Sample Pareto Chart
31
Flowcharts
Flowcharts are graphic displays of the logic and flow of
processes that help you analyze how problems occur and
how processes can be improved.
They show activities, decision points, and the order of
how information is processed.
32
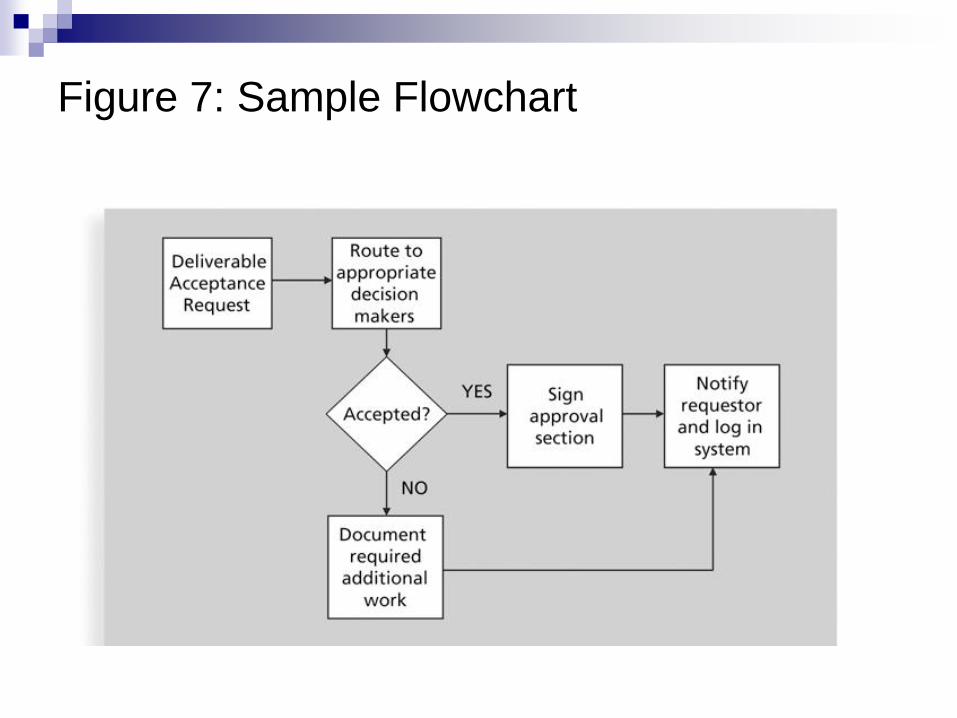
Figure 7: Sample Flowchart
33
Other Quality Management Concepts &
Approaches: Statistical Sampling
Statistical sampling involves choosing part of a population of
interest for inspection.
The size of a sample depends on how representative you want
the sample to be.
34
Standard Deviation
= sigma (σ)
If I just tell you the average mark is 70, do you know anything about the mark distribution?
Standard deviation measures how much variation exists in a distribution of data
Small
data clusters closely around the middle
little variability among the data
Large
Data is spread out around the middle
Greater variability

Figure 8: Normal Distribution and Standard
Deviation
36

Normal Distribution and Standard Deviation
Specification Range
(in +/- Sigmas)
% of
population
within range
Defective units
per billion
1 68.27 317,300,000
2 95.45 45,400,000
3 99.73 2,700,000
4 99.9937 63,000
5 99.999943 57
6 99.9999998 2
Six SigmaImprove quality by reducing variation
Aims to eliminate defects
Motorola – Adoption of Six Sigma
Motorola, Inc. pioneered the adoption of Six Sigma in the 1980s
Why? To stay in business among Japanese competitors.
Chairman set a goal of 10 times improvement in defect reduction every two years (i.e. 100 times in 4 years).
Result: excellent growth and profitability in 1980s and 1990s.
Estimated to have saved about $14 billion.
ISO Standards
ISO 9000 is a family of standards for quality management systems that include:
procedures
keeping records
checking output
monitoring and reviewing processes
facilitating continual improvement
See www.iso.org for more information
39


![Common Law Legal Systems - UZHb020f501-4515-4ba0-acf6... · 2019-03-29 · 250 Kern Alexander 1 S e e Rubenstein v HSBC [ 2011 ] EWHC 2304 (QB) at [83] (discussed below). See also](https://img.dokumen.tips/doc/110x75/5f598e8632e85b76f56fa813/common-law-legal-systems-uzh-b020f501-4515-4ba0-acf6-2019-03-29-250-kern.jpg)