Embed Size (px)
Citation preview

1
Revenue Maximization in Theme Parks -
A Report
Submitted by
Sreenivasan R (27053) M Natesh Muthalan (27093) Shyamkrishnan B (27114)

CONTENTS
Project Overview................................................................................................................................................................................................................................ 4
Background of the Company.............................................................................................................................................................................................................. 5
Revenue Objectives............................................................................................................................................................................................................................ 7
Factors contributing to Revenue........................................................................................................................................................................................................ 8
Revenue Variables.............................................................................................................................................................................................................................. 9
Auxiliaries......................................................................................................................................................................................................................................... 10
Forecasting....................................................................................................................................................................................................................................... 11
Seasonality and other factors influencing forecast...........................................................................................................................................................................12
Other factors................................................................................................................................................................................................................................ 13
Current Forecasting Methods........................................................................................................................................................................................................... 14
Proposed forecasting methods and Forecast Error.......................................................................................................................................................................... 14
Pricing Strategy................................................................................................................................................................................................................................. 16
Types of Prices.................................................................................................................................................................................................................................. 17
Price Adjustments......................................................................................................................................................................................................................... 18
Price Revision Methods & Frequencies............................................................................................................................................................................................ 18
Price Elasticity & Impact................................................................................................................................................................................................................... 18
Revenue Class – The Problem........................................................................................................................................................................................................... 18
Protections....................................................................................................................................................................................................................................... 19
2

Optimization and Revenue Maximization.........................................................................................................................................................................................20
Objective Function............................................................................................................................................................................................................................ 22
EMSR and Problem Solution............................................................................................................................................................................................................. 23
Assumptions..................................................................................................................................................................................................................................... 23
Optimal Demand.............................................................................................................................................................................................................................. 23
Revenue Maximization Methods...................................................................................................................................................................................................... 24
Effectiveness of the Revenue Management System.........................................................................................................................................................................25
Suggested Metrics............................................................................................................................................................................................................................ 26
Excel Sheet Summary....................................................................................................................................................................................................................... 27
3
PROJECT OVERVIEW
Currently the Indian Amusement industry is of Rs. 4,000-crore and the leisure industry expects fresh investment of Rs
10,000 crore by the year 2020. In terms of employment generation, the new amusement parks are likely to create jobs for
six crore man-hours per month. Thus the theme park industry is a new and growing field worthy of further research. The
theme park industry in India is represented by the Indian Association of Amusement Parks & Industries (IAAPI), which is
the apex body representing the interests of a diverse range of amusement, leisure and entertainment business in India. It
also helps to promote, encourage, protect and safeguard the interests of the amusement park industry. We have selected
this industry for our study. In this study we shall try to analyze the various revenue generation and management
techniques followed by an amusement park to gain maximum return on investment. We shall also try to identify gaps in
revenue management and propose solutions for improvement based on our analyses. Our study shall broadly be based on
the following, namely the identification of the forecast methods employed by the amusement park, the estimated
forecast error, the factors affecting the forecast and demand followed by the pricing strategies for the amusement park
and the rides. This will then be supported by the different revenue classes to be defined based on the trend observed in
the customer participation. Finally we will conclude our study by identifying the revenue variable, the maximization
techniques and ways of measuring the effectiveness of the revenue management system. We have decided to study the
Wonderla group of theme parks and will restrict our analysis to the theme park in Cochin.
4

BACKGROUND OF THE COMPANY
Wonderla Holidays Private Limited is an amusement park promoter which operates two large amusement parks in
Bangalore and Kochi under the brand name Wonderla.
Wonderla – Kochi
Wonderla Kochi (previously known as Veega Land) established in 2000, is located just 15kms from Kochi city and is home
for more than 50 amusement rides. It is spread over 30 acres of landscaped space, built to international standards. It is
also the first park in India to get ISO 14001 certified for eco-friendliness and OHSAS 14001 certified for safety. Wonderla
Kochi has been operating safely for 12 years now. Wonderla Holidays Private Limited is in turn promoted by V-Guard.
V-Guard Group, the promoter of Wonderla Holidays Pvt Ltd, is one of India’s top electric and electronic consumer
products brand. Founded and guided by Kochouseph Chittilappilly, V-Guard today is a household name, manufacturing
products like Stabilizers, Water Heaters, Solar Water Heaters, Pumps, UPS, Digital Inverter & Battery, Fans, Wiring Cable,
and Industrial Cable & Induction Motors.
Wonderla has also been the recipient of many awards some of which are listed below
Indian Association of Amusement Parks & Industries [IAAPI]
o Highest number and variety of rides (2011, 2010& 2009)
o Highest number of innovative rides (2011 & 2009)
o Innovative promotional activity through media (2010; 2009 & 2008)
5

Kerala State Energy Conservation award in 2009 & 2011
Confederation of Indian Industry - Excellence award [2010] – 1st prize in small scale industry category awarded to
organizations excelling in the area of Environment, Health and Safety.
Wonderla is also planning to open two new amusement parks in Chennai & Hyderabad with an investment of 400 crores.
6

REVENUE OBJECTIVES
The revenue objectives of the company can be broadly classified into the following categories
Revenue and revenue growth – The objective of the theme park is to attain a QoQ growth in revenue of 20 % and a YoY growth of 15% for the next five years. Our new parks planned for 2015 are expected to exhibit a revenue growth of 35% for the first two years.
Profit Margins – Based on the current market conditions and inflation, our profit margins are expected to rise by 10% every year during the next 5 years. But with increased competition from international players, we expect our profit margins to be affected to some extent.
Costs – With two new parks planned in Chennai and Hyderabad, our costs are expected to rise by around 15% in the next 3 years. Also a capital investment of 400 crores for the new parks is expected and will be spread over a period of 2-3 years. Also with the new tax policies, our operating costs are expected to increase more.
Marketing and Advertising Spend – Since the perception of amusement parks is fast changing, promotional offers and advertising spend should be reconfigured to generate more interest in amusement parks. Hence it has been decided to increase the marketing budget by 20% for the year 2012-13.
Sustainability – With more focus on green initiatives and environment friendly practices we also aim to reduce the impact on the environment to the bare minimum. Water used in the water rides is recycled and used in the restrooms. Dependence on state supplied electricity is also reduced with the introduction of solar panels which contributes to around 15% of the electricity consumed in the park. Thus electricity savings of around 10% is achieved.
7

FACTORS CONTRIBUTING TO REVENUE
The main factors which affect revenue of a theme park can be categorized into four as listed below
8

REVENUE VARIABLES
9

AUXILIARIES
The following are the auxiliaries which also contribute to revenue by providing extra value to customers
Food courts – total 5 in number spread across the theme park at strategic locations. Also since the entry ticket is valid only
for one time entry, the customers are effectively locked in and have to have their food at the food courts inside. Hence the
opportunity to fix the price and offerings to maximize revenue
Ride Extras – Photos of customers on rides for a fixed price in the form of print or CDs
Shops - Shops selling souvenirs, swimwear, toys, branded merchandise like t-shirts, toys, key chains etc
Lockers & Changing Rooms – For use by visitors for a fixed fee, group lockers also available for groups visiting the park
Dormitory – For use by visitors at a nominal price
10

FORECASTING
Forecasting is an essential part of the operations of the theme park. The theme park enjoys full capacity utilization only
during certain periods of the year and hence it is up to the revenue manager to ensure that the customers keep coming
throughout the year. By studying the past data, it is possible to predict the inflow of visitors to the park at different times
of the year. Usually the peaks are during the holiday season and it is relatively free during the rest of the year. Also
forecasting gives us the opportunity to anticipate demand and hence maximize revenue by pricing appropriately based on
the demand. Yet another reason for forecasting is the need to perform routine maintenance on the park attractions. The
rides in the park need to be checked and calibrated at regular intervals to ensure safety and proper working. Hence
identification of off season periods can help in performing maintenance on the rides and attractions.
Forecasting also helps in the following aspects of business
1. Human resource forecasting – How many people are required to serve the visitors in the park
2. New investment planning – Is there a need for the building of a new ride or attraction
3. Working capital management – how much money is required to run the business
4. Risk management – avoid decrease in revenue and maintain reasonable profits at all times
5. Pricing – how much can the customer be charged for his patronage at different times
Forecasting methods are usually classified as Judgmental, experimental, causal and time series. Of these the time series
methods is the easiest as the data is already available from Point of Sale systems and can be analyzed to arrive at
meaningful conclusions. The appropriate forecasting methods will be discussed subsequently.
11
SEASONALITY AND OTHER FACTORS INFLUENCING FORECAST
Seasonality is a major factor influencing the forecast of visitors to a theme park. We see a peak in demand during the
holiday seasons mainly in the months of April, May, October and December. Also visitors visit the park during national
holidays like Diwali, Dussera etc. This is in part due to the accessibility of the theme park. Theme parks are usually situated
at the borders of cities and people have to travel a considerable distance to reach it. Hence they find it difficult to make
frequent trips to theme parks.
OTHER FACTORS
Weather – If the weather is cloudy or if it is raining, the attendance in theme parks will go down, likewise if it is too hot,
water rides may be preferred to dry rides.
Power shortages – if power shortages occur, it may not be feasible to run the park fully on generators and hence certain
high power consuming rides would have to be closed
Accidents/Safety issues – if accidents occur or if the safety of the park is in question then visitors may think twice before
coming to the theme park
Group Bookings – Group bookings may artificially inflate the numbers but may not represent the actual demand for a
particular day
12

Anti Social Elements – In case of incidents like terrorist attacks, people may be more inclined to stay at home rather than
visit theme parks
Governmental regulations – This may also affect demand adversely, for example increasing the service or entertainment
tax may force theme parks to raise the ticket fee hence adversely affecting demand
Recession – This may cause the spending power of the consumer to come down and hence the tendency of the common
man is to save rather than to spend it on entertaining himself
These factors may sometimes cause outliers to be present in forecast data which either needs to be removed or modified
to suit the data.
CURRENT FORECASTING METHODS
Currently judgmental forecasting is used at Wonderla and based on previous year customer behavior. The advantages of
this is that it is cheaper and easy to do while the disadvantage of this method is that the result may not be accurate and
will not take into account the changing needs of visitors to the park. Also other factors discussed above may affect the
forecast to a large extent and may not be identified by a judgmental forecast.
13

PROPOSED FORECASTING METHODS AND FORECAST ERROR
Based on an analysis of the industry and the theme park operations, we propose the Exponential Smoothing method as
the most appropriate forecast technique to predict future demand. The reasons for this choice are given below.
The validity of data changes over time and hence as data gets old, it loses its relevance. But we cannot completely ignore
the old data. Hence the exponential smoothing method assigns exponentially decreasing weights as the observations get
older. Thus recent observations are given more weight age than older observations.
Also since the data shows seasonality and trend together, we decide to go in for the Holt-Winters Method of smoothing
which is also known as triple exponential smoothing or multiplicative seasonal model.
We will try to simplify the process below for our understanding but for all practical purposes, we shall make use of a
computer based application for calculation.
The first step is to find the current underlying level of demand by deseasonalizing the data and removing the random data
(outliers/noise). The next step is to find the current trend or average of demand for the season. This can be done by
dividing total average demand by number of seasons. Then the seasonal index is calculated by dividing the season’s
historic demand by the average demand over the seasons. Now smoothing is applied to the level, trend and seasonality
index to get the corrected values for forecast and the forecast for the month is given by
(Level + Trend)*(Seasonality Index)
Thus the exponential smoothing method is used for forecasts involving seasonality and trend.
14

The forecast error can be calculated using the formulae given below
Forecast Error (FE) = 1n∑i=0
n
A i−Fi
Mean Square Error (MSE) = 1n¿¿
Mean Absolute Deviation (MAD) = 1n∑i=0
n
|A i−F i|
Mean Absolute Percentage Error (MAPE) = 1n (∑i=0
n |A i−F iA i |∗100)PRICING STRATEGY
There can be 3 strategies that are usually followed for pricing. They are
Cost-based pricing
Competitor-based pricing
Value-based pricing
Cost-based Pricing
15

In cost-based pricing, companies set prices based on their costs of providing services. To make a
profit, they set a price that covers their variable and fixed costs and includes a profit margin.
Competition-based Pricing
In competition-based pricing, companies set prices based on what the competition is charging.
When competing service providers, provide similar services, price-sensitive customers will choose
the player with the lowest ticket price. It can offer a low ticket price that competitors with
higher costs cannot afford to match. Alternatively, it can charge the going market rate and earn
higher profits than its competitors.
Value-based Pricing
In value-based or benefit-driven pricing, companies set prices for services based on their
customers’ perceptions of the value of the services. If customers are unsure about how much value
they will receive from a particular service, they may remain with a known supplier or not make a
purchase at all.
TYPES OF PRICES
16

Average admission price - An admission rate is an all-inclusive price paid to gain access to all rides, attractions, and live
entertainment offered by the sample unit. These rates are typically tiered for different types of buyers (e.g. child, adult,
senior, family). Admission prices exclude food/beverage, merchandise, and games. An average admission rate for a
specific type of buyer is preferred. Prices for season passes should be excluded from the average. However, if the sample
unit cannot provide average rates, an individual admission rate is an acceptable fallback.
Single admission price - This is the fallback if average prices are not available. This the price that should be collected for
season passes.
Actual transaction price - For all other primary services, such as food/beverage, merchandise, games, and specialty
rides/attractions, an actual transaction price will be collected.
PRICE ADJUSTMENTS
Discounts based on type of ticket – Access can be on daily, weekly or seasonal basis
Discounts based on groups – prices can be varied based on bulk booking for high numbers
Discounts based on mode of booking – Online booking can be used to promote and can be given at a lower price
PRICE REVISION METHODS & FREQUENCIES
Price Revision will happen every 6 months and a straight growth line method will be applied to cover the operational
costs.
17

PRICE ELASTICITY & IMPACT
The Important aspect of Product Demand curve is how much quantity demanded changes when the price changes based
upon the proposed methods how the changes in the price effects the revenue is explained in the revenue optimization
heading. Also refer to the sheet Number 4 for more details.
REVENUE CLASS – THE PROBLEM
The Tickets should be sold to the customer contributing maximum to the revenue; we need to ensure that we make
appropriate protections for the customer. (Sample Data for a weekend is displayed below)
Existing Revenue Class(Price is indicated in the bracket) Proposed Revenue Class
Adult(520) A-Adult(550)
Children(410) B-Children(420)
Senior Citizen(358) C-Senior Citizen(358)
Groups (380) * Varies according to the age. D-College Group(415)
E-Corporate(490)
F-School(410)
G-Informal Gang (475) ** More than 20 people is
considered to be group.
18

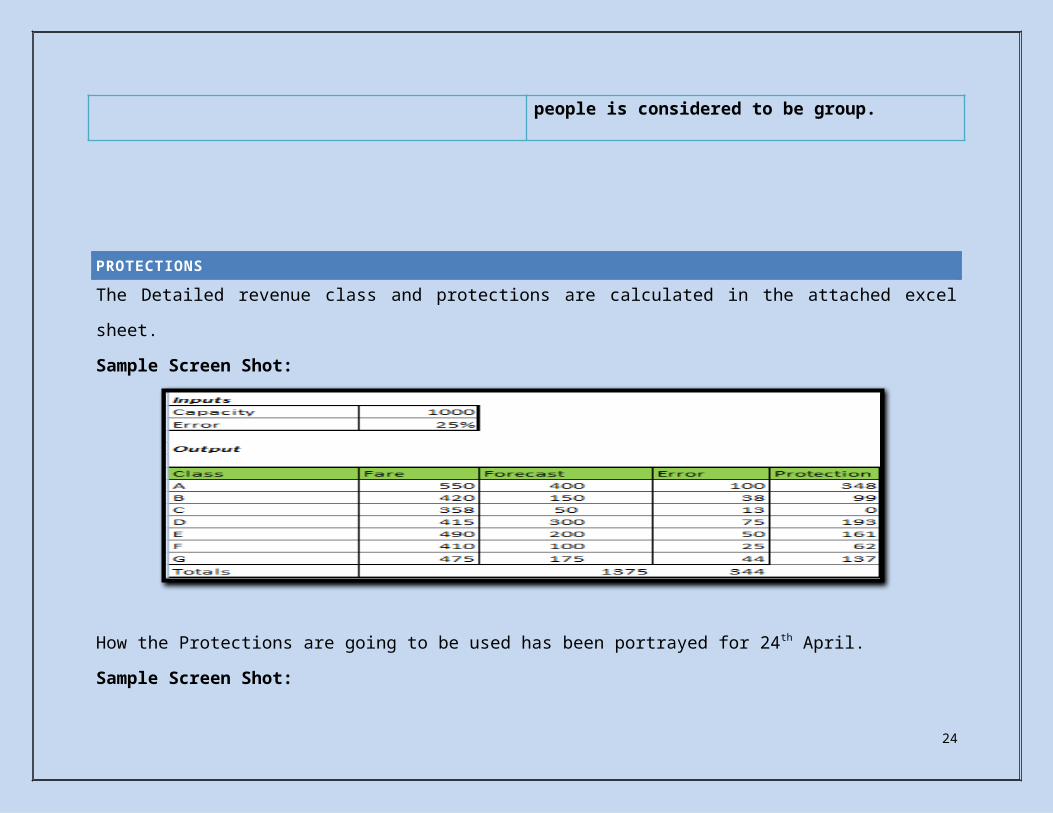
PROTECTIONS
The Detailed revenue class and protections are calculated in the attached excel sheet.
Sample Screen Shot:
How the Protections are going to be used has been portrayed for 24th April.
Sample Screen Shot:
19

OPTIMIZATION AND REVENUE MAXIMIZATION
Existing Method:
Base Ticket is charged for entry into the Theme Park. Revenue will be more as the number of customer increases. The Customer is not charged for the rides and there is no limit for taking the rides, Due to which operational costs
in some cases might be very high.
Proposed Method A:
Base Ticket Price will be lowered. Revenue will be calculated based on two parameters i.e number of people coming in and the amount of rides there
are taking. The More the rides experienced by the customer more will be the revenue. Every Ride will be charged a flat price of Rs 15. In Due course of time, we will get a better understanding of the customer preferences for each ride and this will in
turn help in optimizing our operational costs.
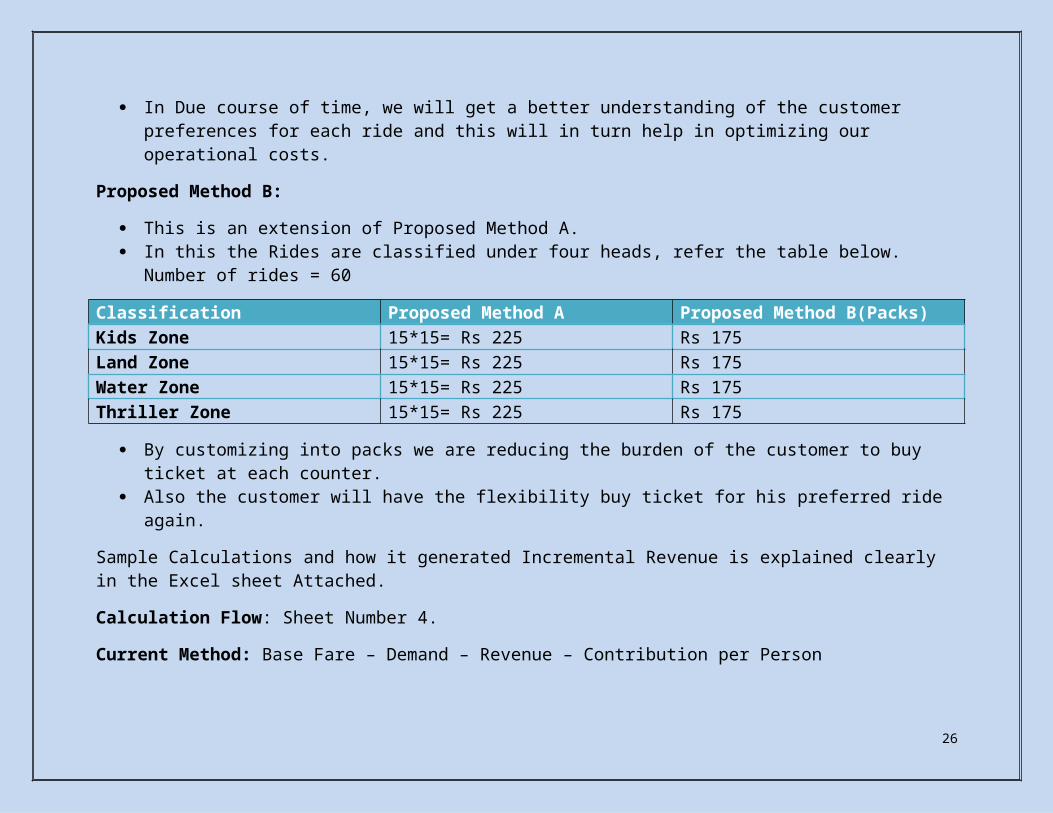
Proposed Method B:
20

This is an extension of Proposed Method A. In this the Rides are classified under four heads, refer the table below. Number of rides = 60
Classification Proposed Method A Proposed Method B(Packs)Kids Zone 15*15= Rs 225 Rs 175Land Zone 15*15= Rs 225 Rs 175Water Zone 15*15= Rs 225 Rs 175Thriller Zone 15*15= Rs 225 Rs 175
By customizing into packs we are reducing the burden of the customer to buy ticket at each counter. Also the customer will have the flexibility buy ticket for his preferred ride again.
Sample Calculations and how it generated Incremental Revenue is explained clearly in the Excel sheet Attached.
Calculation Flow: Sheet Number 4.
Current Method: Base Fare – Demand – Revenue – Contribution per Person
Proposed Method A: Base Fare – Demand – Rides Forecast – Revenue – Contribution per person – Incremental Revenue.
Proposed Method B: Rides Packages – Base Fare – Demand – Rides Forecast – Revenue – Contribution – Incremental Revenue.
The Calculations have been performed for a Weekend and Quarter 1(Jan, Feb, and March).
Screen Shot of Incremental Revenue Graphs for the Proposed Methods:
21

OBJECTIVE FUNCTION
Current Method: Proposed Method:
Revenue = Y
Base Price = X
Customer = A
Function: Y =A*X (The more the number of people more
will be the revenue
Revenue = Y
Base Price = X, Rides = Z
Customer = A
Function: Y =A*X+ A*Z (Introduction of new variable z will
increase the revenue in two ways, based on the number of
people coming in and number of rides enjoyed by them.
22

EMSR AND PROBLEM SOLUTION
Please refer the excel sheet for more details
ASSUMPTIONS
Please refer the excel sheet for more details
OPTIMAL DEMAND
Demand will calculated based on the moving average method, Sample Screenshot is provided below:
23
REVENUE MAXIMIZATION METHODS
Controlled Discounting – Establish higher prices overall and then move the demand to slower times through value pricing.
For example fix higher price for the whole week and decrease them during weekdays when visitors are less in number.
This gives a psychological advantage when pricing to the customer.
Midday Deals – Usually booking peaks when the park opens in the morning and dwindles down as the day progresses. If
capacity is available at around noon, special offers at lower prices can be given for late customers.
Special Shows – Charge extra for shows which can be shown only during particular times of the day. For example a laser
lights show in the evenings.
Up selling – Up sell more rides in case of low utilization of capacity. For example dry rides can be up sold during hot
season when customers prefer water rides.
Profitability of ride – Close down non profitable rides to guide customers towards more profitable ones, hence
maximizing revenue
Themed Restaurants and Food Courts – Food courts which reflect the brand of the theme park will enable better price
control and hence better yield maximization. For example, a special menu can provide food unavailable elsewhere.
Loyalty Program – Special offers for repeat customers. For example, a customer visiting again can bring another person
for free.
24

EFFECTIVENESS OF THE REVENUE MANAGEMENT SYSTEM
We can measure the effectiveness of the revenue management system mainly by measuring the profit generated after
implementing revenue management techniques. Arise in profits by at least 20 % is expected.
Other measures include the following
Percentage increase in visitor count per month – Increase in number of visitors to the park as compared to previous
month
Percentage increase in revenue per quarter – Revenue as compared to previous quarter
Percentage increase in repeat customer – number of customers coming for multiple visits
Customer satisfaction index – Customer satisfaction on a scale of 1-100
Capacity utilization of park rides – The higher the value, the better it is for the theme park
Percentage of Auxiliaries used – The more the extra features are sought after, the higher the revenue
SUGGESTED METRICS
The Following Metrics can be used for key insights and Decision Making.
1. Contribution Margin per Person – Revenue Generated Per Person
Insights: This will help in finding out which demographic segment is contributing maximum for the revenue.
25
This will help in creating fare buckets and packs which will in turn maximize revenue.
2. Revenue/Visitor/Ride – This will indicate which ride is most famous and which is generating the most revenue.
Insights:
We can find the operational cost of each ride and depending upon the revenue generated, we can take decision whether
to keep it operation or not.
3. Revenue / visitor / service – This will indicate which service is generating revenue and where there is more demand for
the service.
Insights:
This will help in increasing or decreasing the service and price it accordingly.
4. Revenue/Hour/Ride: Revenue Generated per hour per ride.
Insights: This will help in optimizing ride further by increasing or decreasing the capacity and will help in projections.
5. Revenue/Advertisements: Revenue Generated through various advertising channels
Insights: Projections regarding the revenue per space used for advertisements, to increase/decrease the billboards so that
it can be used for further addition of rides.
26

EXCEL SHEET SUMMARY
Sheet Number Sheet Name Explanation Sheet 1 Demand Forecasting Sample Calculations for finding the
demand based on Moving Average Method
Sheet 2 Sample Protections 1. Calculations for Protections for the Proposed Revenue Classes.2. Application of the Protection method for a particular date.
Sheet 3 Protection Working sheet Working for the Sheet Number 2.Sheet 4 Proposed Method 1.Current Existing Method Calculation
2. Proposed Method A Calculation.3. Proposed Method B Calculation.
Sheet 5 Revenue Projection Graph indicating the revenue projection for the coming 5 years by using various methods.
Sheet 6 Smell Money Various Methods by which revenue can added to the system
27

**Additional Information Sources: Refer Wonder La Website for details about the various rides.
We are thankful for the various sources through which we prepared this document, there were many articles which
helped us in designing this document, we are very grateful to Goole.com for throwing up wonderful results which helped
us in framing this document !!
28
Excel Attachment