Embed Size (px)
Citation preview

www.pems4nano.eu
Project overview and preliminary results
Contact details Project Coordinator Project Manager Horiba Uniresearch BV Dr. Marcus Rieker Dr. Willem van Dorp [email protected] [email protected] www.horiba.com www.uniresearch.com
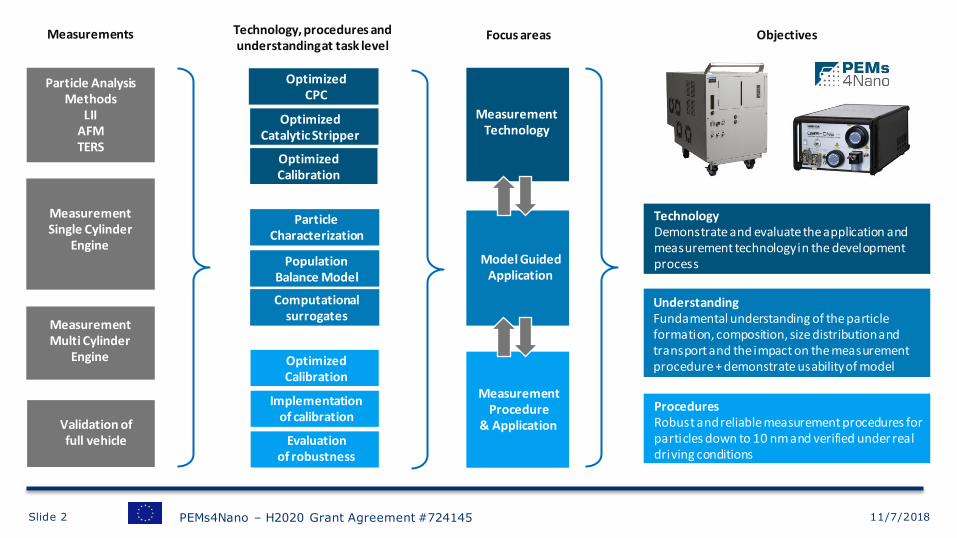
Measurement Technology
Model Guided Application
Measurement Procedure
& Application
Optimized CPC
Optimized Catalytic Stripper
Optimized Calibration
Particle Characterization
Measurement Single Cylinder
Engine
Measurement Multi Cylinder
Engine
Particle Analysis Methods
LII AFM TERS
Population Balance Model
Understanding Fundamental understanding of the particle formation, composition, size distribution and transport and the impact on the measurement procedure + demonstrate usability of model
Validation of full vehicle
Objectives Technology, procedures and understanding at task level
PEMs4Nano – H2020 Grant Agreement #724145 Slide 2
Computational surrogates
Evaluation of robustness
Implementation of calibration
Optimized Calibration
Measurements Focus areas
Technology Demonstrate and evaluate the application and measurement technology in the development process
Procedures Robust and reliable measurement procedures for particles down to 10 nm and verified under real driving conditions
11/7/2018
Slide 3 11/7/2018 PEMs4Nano – H2020 Grant Agreement #724145
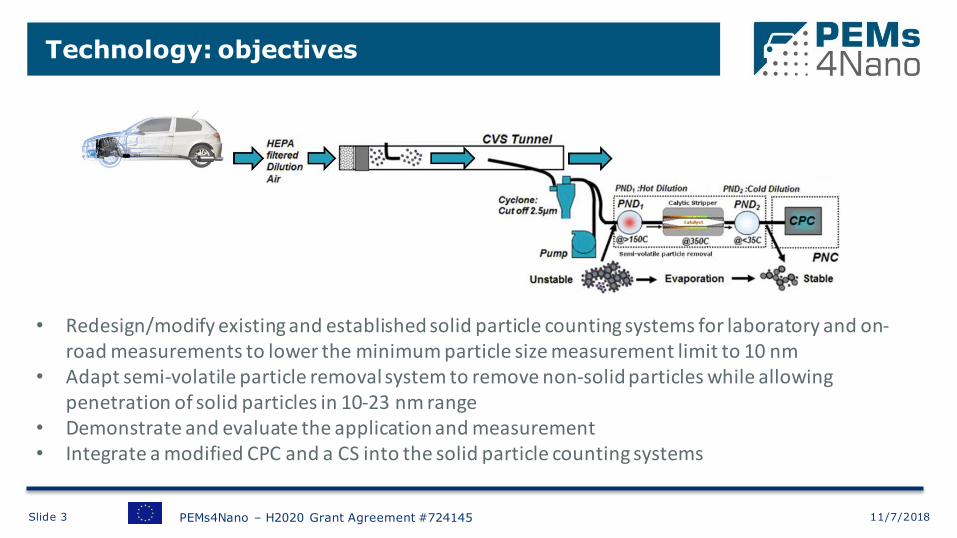
• Redesign/modify existing and established solid particle counting systems for laboratory and on-road measurements to lower the minimum particle size measurement limit to 10 nm
• Adapt semi-volatile particle removal system to remove non-solid particles while allowing penetration of solid particles in 10-23 nm range
• Demonstrate and evaluate the application and measurement • Integrate a modified CPC and a CS into the solid particle counting systems
Technology: objectives

Slide 4 11/7/2018 PEMs4Nano – H2020 Grant Agreement #724145
• Starting point: Two proven CPC models for laboratory and PEMS applications (D50 = 23 nm) • Goal: achieve D50 ≤ 10 nm
• The CPCs were calibrated and validated • For validation thermally conditioned flame soot particles were used • Result: showed 50 % detection efficiency at 10 nm according to ISO 27891 requirements
• A catalytic stripper was calibrated with solid particle aggregates. • Goal: maximize system-measured solid particle penetration for 10 nm and below • Penetration efficiency needed to increase • > 60% was achieved (initial target was set to > 50%)
• Particle counting system calibration procedure was performed • Including Particle Count Reduction Factor (PCRF) calibration for both systems
• MGA validated against measurements for PSD and chemical characterization • Offers guidance on the role of dilution ratios, dilution pipe lengths, in-cylinder inhomogeneities, and
surface vs bulk compositions
Technology: highlights

11/7/2018 Slide 5
Technology: preliminary results
Catalytic stripper (CS) for SPN-PEMS
Solid particle penetration: 10-15% improvement in solid particle penetration 65-75% solid particle(silver) penetration at 10 nm size Meet the ambiguous target of 60% penetration even at 8 nm.
0.99
0.992
0.994
0.996
0.998
1
10 30 50 70 90 110 130 150 170 190 210
Re
mo
val e
ffic
ien
cy
Particle size (nm)
0.75 SLPM 1.0 SLPM
Semi-volatile particle removal: Satisfy well beyond the regulatory requirements of >99% semi-volatile particle (tetracontane) removal (> 104 #/cm3) at 30 nm size.
Regulatory requirements
0.3
0.4
0.5
0.6
0.7
0.8
0.9
1
0 10 20 30 40 50 60 70
Pen
etra
tio
n ef
fici
ency
Particle size (nm)
1.0 SLPM @ 350 C
0.75 SLPM @ 350 CInitial target
PEMs4Nano – H2020 Grant Agreement #724145

11/7/2018 Slide 6 PEMs4Nano – H2020 Grant Agreement #724145
Understanding: particle characterization
Thorough physico-chemical characterization of the smallest particles … needed for better understanding their influence on the particle measurement through the model guided application … optimization of the newly developed PEMS
Use of a single cylinder engine @ Bosch as particle generator … generate a wide variety of particles by testing various engine regimes
Build an extensive database on size-dependent particle structure, morphology, chemical composition … possible further use in engine optimization through the MGA … interest for other GV projects
• Laboratory single cylinder test engine
• In-situ measurement of particle size and
volume fraction - LII
• Tailpipe and engine sampling of particulate
matter
• Ex-situ physicochemical characterisation
• Particle growth and transport model

Slide 7 PEMs4Nano – H2020 Grant Agreement #724145
Understanding: measuring real-time and in-situ
Objectives of LII measurements:
• Measuring in real time and in situ the evolution
of the LII signal in the exhaust line: variation of
the soot volume fraction.
• Realtime control of engine soot emissions
for different engine setpoints
• Comparison with other techniques: SMPS-EEPS
• limit of detection
• smallest size
• Remark: LII signal is assigned to carbon
(metallic particles, oil, condensable species etc.
do not contribute to the signal)
11/7/2018

Slide 8 PEMs4Nano – H2020 Grant Agreement #724145
Understanding: measuring real-time and in-situ
Variation of LII signal with engine setpoints
11/7/2018
Pmi = 5, 8, 10 bars; SOI=-270 SOI=-270, -305, -311; Pmi=10 bars
SOI: start of injection before firing Pmi: indicated mean pressure
Variation of LII intensity: soot volume fraction Variation of LII decay-time: « mean soot diameter » indicator

Slide 9 PEMs4Nano – H2020 Grant Agreement #724145
Sampling line
11/7/2018
Slide 10 PEMs4Nano – H2020 Grant Agreement #724145
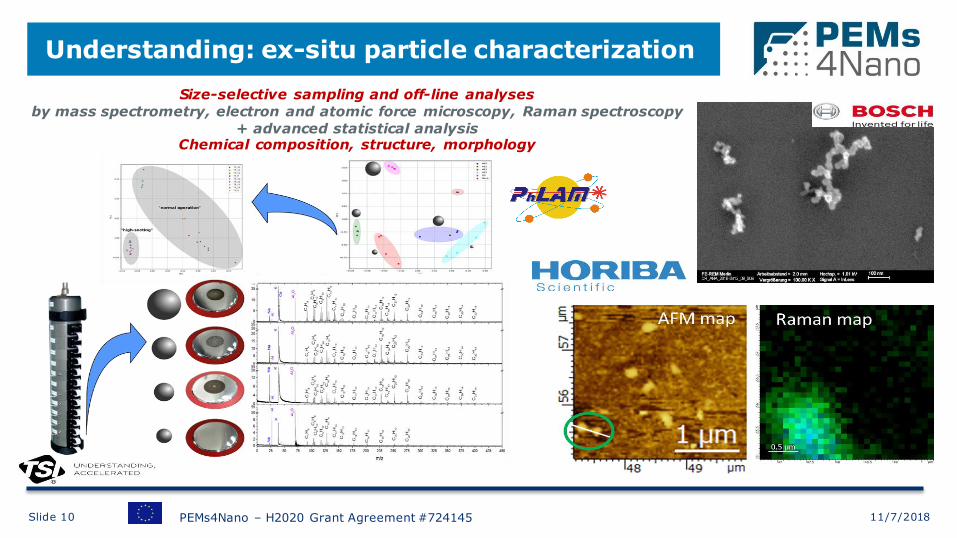
Understanding: ex-situ particle characterization
Size-selective sampling and off-line analyses
by mass spectrometry, electron and atomic force microscopy, Raman spectroscopy
+ advanced statistical analysis Chemical composition, structure, morphology
11/7/2018

Slide 11 PEMs4Nano – H2020 Grant Agreement #724145
AFM and TERS structural analyses
Particle 1: height 10 nm width < 48 nm
Particle 2: height 6 nm width < 43 nm
Average spectrum of Particle 2 Average spectra of Particles 3&4
TERS map (G&D bands)
Zone 1 Zone 2
G band D band
TERS map (G band)
High resolution AFM topography
AFM 3D/2D topography of collected PM (18-10 nm)
11/7/2018
Slide 12 PEMs4Nano – H2020 Grant Agreement #724145
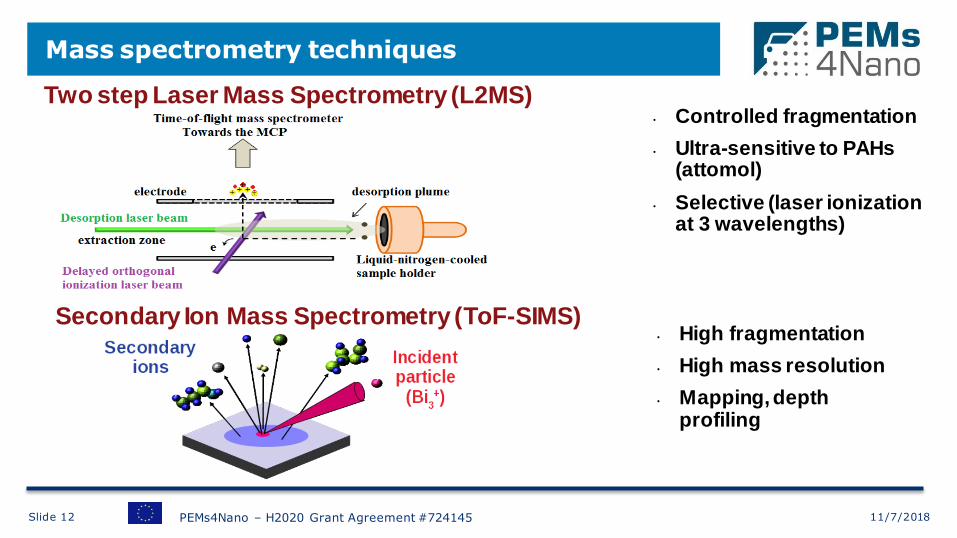
Mass spectrometry techniques
Two step Laser Mass Spectrometry (L2MS) • Controlled fragmentation
• Ultra-sensitive to PAHs (attomol)
• Selective (laser ionization at 3 wavelengths)
Secondary Ion Mass Spectrometry (ToF-SIMS) • High fragmentation
• High mass resolution
• Mapping, depth profiling
11/7/2018

Slide 13 PEMs4Nano – H2020 Grant Agreement #724145
Chemical composition … selective ionization
Spectra dominated by aromatic species R2PI at 266 nm
• Lower mass distribution for smallest particles
56-32 nm
180-100 nm
32-18 nm
100-56 nm
11/7/2018

Slide 14
SPI at 157 nm (7.9 eV)
• Nitrogenated hydrocarbons are present
56-32 nm
180-100 nm
32-18 nm
100-56 nm
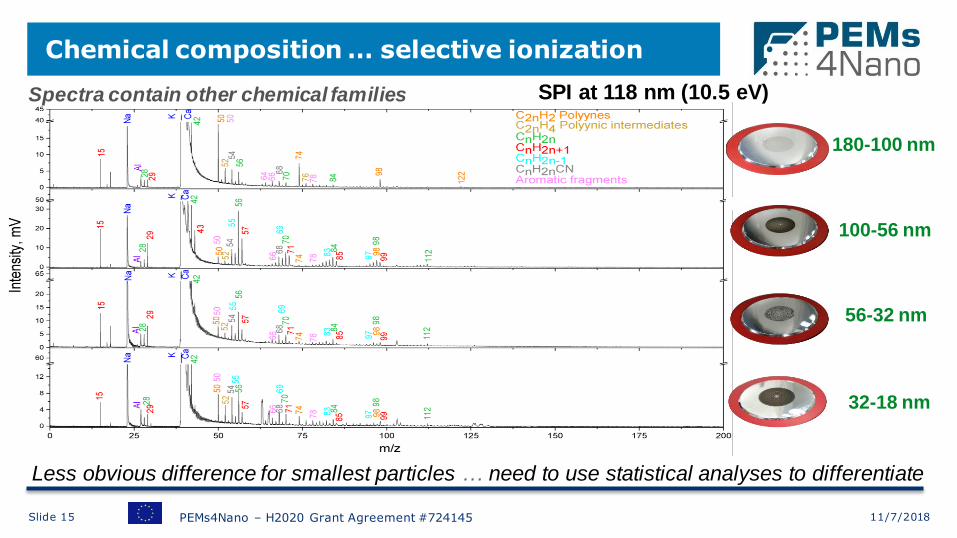
Chemical composition … selective ionization
PEMs4Nano – H2020 Grant Agreement #724145 11/7/2018
Slide 15
Spectra contain other chemical families SPI at 118 nm (10.5 eV)
56-32 nm
180-100 nm
32-18 nm
100-56 nm
Less obvious difference for smallest particles … need to use statistical analyses to differentiate
Chemical composition … selective ionization
PEMs4Nano – H2020 Grant Agreement #724145 11/7/2018

11/7/2018 Slide 16 PEMs4Nano – H2020 Grant Agreement #724145
Understanding: conclusions
• The combination of L2MS, SIMS and PCA allows determination of detailed molecular level surface
chemical composition of soot particles.
• The use of size-selective sampling allowed us to chemically characterize surface chemistry of particles
down to 10 nm.
• Identification of key chemical markers, coupled with powerful PCA statistics, allowed discrimination of:
▲ Gasoline-specific (PAHs, phenol, nitro-phenol)
▲ Lubricant-specific (Hopanoids, steranes and cycloalkanes)
▲ Engine-specific (metals and metal oxides)
• By identifying marker species, we have clearly discriminated particles by source, particle size and
engine regime
Slide 17 PEMs4Nano – H2020 Grant Agreement #724145
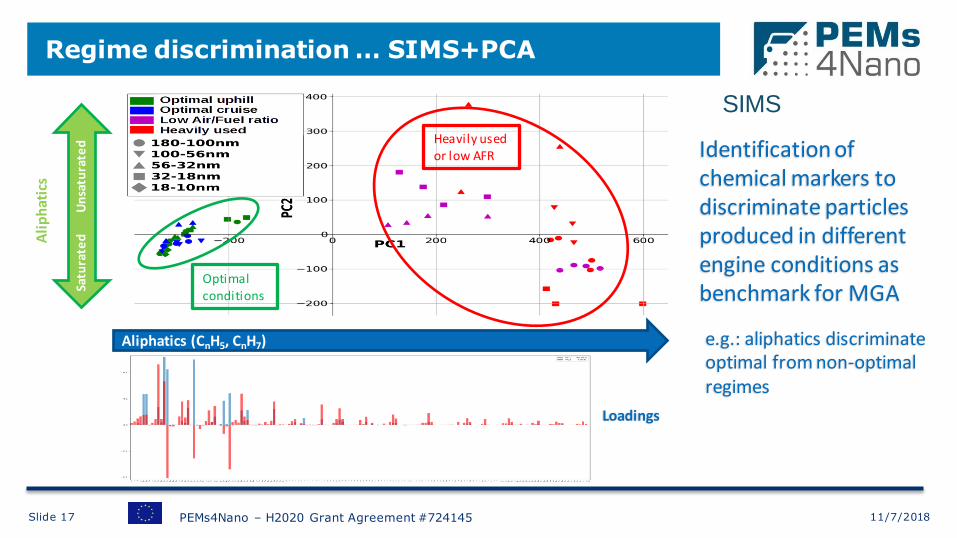
Regime discrimination … SIMS+PCA
Identification of chemical markers to discriminate particles produced in different engine conditions as benchmark for MGA
e.g.: aliphatics discriminate optimal from non-optimal regimes
SIMS
Ali
ph
atic
s
Satu
rate
d
U
nsa
tura
ted
Optimal conditions
Heavily used or low AFR
Loadings
Aliphatics (CnH5, CnH7)
11/7/2018

Slide 18 PEMs4Nano – H2020 Grant Agreement #724145
Source discrimination … SIMS + PCA
Aliphatics and hopanoids Aromatics
Oil contribution
Fuel contribution
Org
anic
car
bo
n c
on
ten
t
Loadings
SIMS
11/7/2018

Slide 19 PEMs4Nano – H2020 Grant Agreement #724145
Size-dependent chemical analysis A
bu
nd
ance
, a.
u.
Particle benchmark -"Optimal uphill"
Size variation by chemical category delivered as key input to the Model Guided Application (U.Cam + CMCL)
Clear trends in size and source have been identified for:
• Cycloalkane and bicycloalkane fragments (CnH2n-3) -
markers of lubricating oil
• Polycyclic aromatic hydrocarbons (PAH) - building blocks of soot particles
11/7/2018
Slide 20
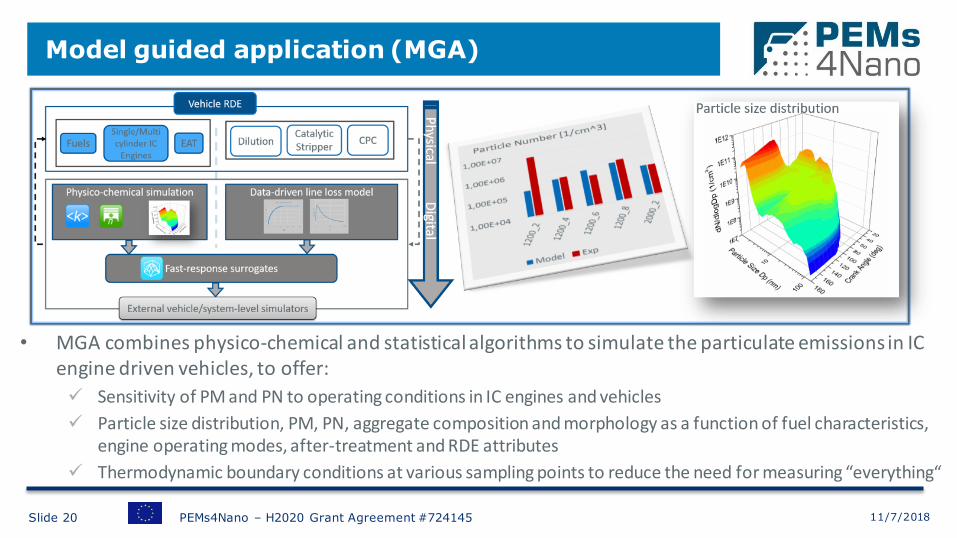
• MGA combines physico-chemical and statistical algorithms to simulate the particulate emissions in IC engine driven vehicles, to offer:
Sensitivity of PM and PN to operating conditions in IC engines and vehicles
Particle size distribution, PM, PN, aggregate composition and morphology as a function of fuel characteristics, engine operating modes, after-treatment and RDE attributes
Thermodynamic boundary conditions at various sampling points to reduce the need for measuring “everything“
PEMs4Nano – H2020 Grant Agreement #724145
Model guided application (MGA)
11/7/2018
11/7/2018 Slide 21 PEMs4Nano – H2020 Grant Agreement #724145
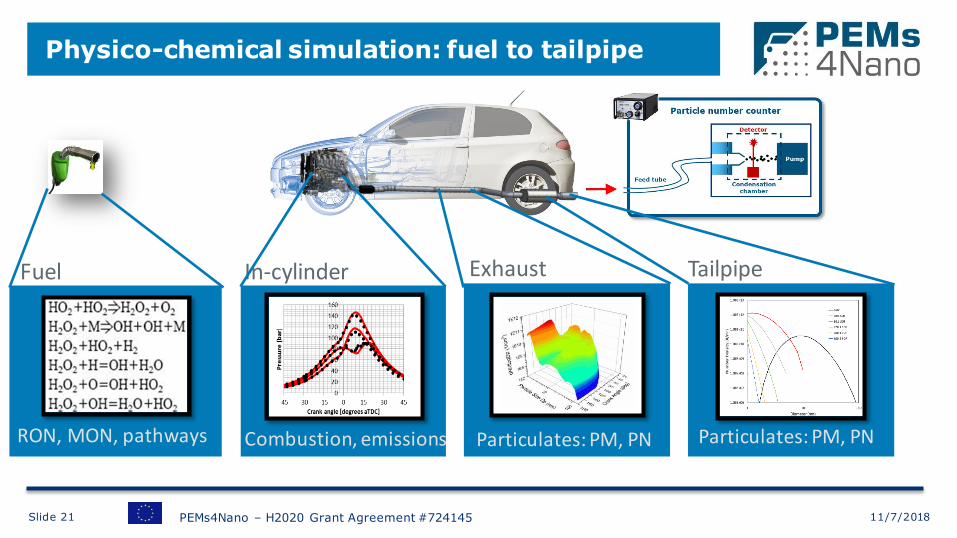
Fuel
RON, MON, pathways
In-cylinder
Combustion, emissions
Exhaust
Particulates: PM, PN
Tailpipe
Particulates: PM, PN
Physico-chemical simulation: fuel to tailpipe

11/7/2018 Slide 22 PEMs4Nano – H2020 Grant Agreement #724145
MGA components and relationship with measurements
Physico-chemical Simulation
Experimental data (engine test bench & vehicle)
Fuel
Fuel analysis: - composition - evaporation curve - amount of aromatics
In-cylinder
Combustion & emissions: - pressure trace analysis - engine out raw emissions
Exhaust & Tailpipe
PN10 and PN23 analysis at various sampling positions along the exhaust
behind TC | behind TWC | behind GPF | Tailpipe CVS tunnel
PN10 & PN23 in CVS tunnel (vehicle roller test bench)
Exhaust
Particulates: PM, PN
Tailpipe
Particulates: PM, PN
In-cylinder
Combustion, emissions
Fuel
RON, MON, pathways
Example for GDI engine
Parameter estimation
Validation
Computational Surrogates
Statistical algorithms

Dual-fuel CNG-Diesel engines
11/7/2018 Slide 23 PEMs4Nano – H2020 Grant Agreement #724145
Understanding: MGA to provide the range
Diesel CIDI engines
HCCI engines
GDI SI engines
Physico-chemical Simulation
Exhaust
Particulates: PM, PN
Tailpipe
Particulates: PM, PN
In-cylinder
Combustion, emissions
Fuel
RON, MON, pathways
Parameter estimation
Validation
Computational Surrogates
Statistical algorithms
PFI SI engines
MGA

Slide 24
o SRM Engine Suite™: Particle population balance includes soot, ash, sulphates and volatiles
o kinetics™ reactor network to account for dilution and sampling
o Validation of engine-out PSDs at multiple loads-speeds
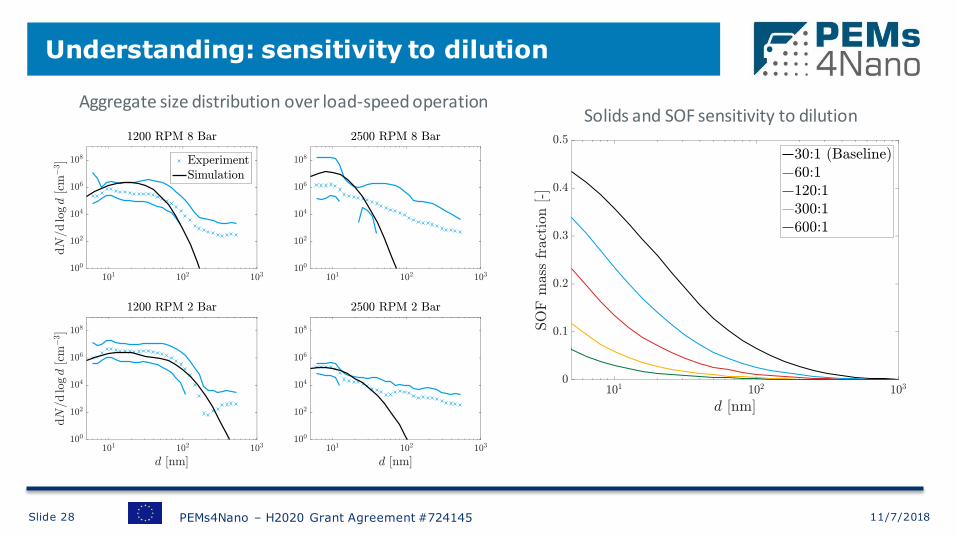
o Dilution and temperature thresholds based on the number density of solids and SOF
PM PN PSD
composition Sensitivities Surrogates
Fuel specifications
SCRE & MCRE ICEs Vehicles & drive
cycles: Operating conditions
Loss transfer functions for measurement
components
Inputs MGA Outputs
PEMs4Nano – H2020 Grant Agreement #724145
Understanding: modelling fuel to tailpipe
11/7/2018
11/7/2018 Slide 25
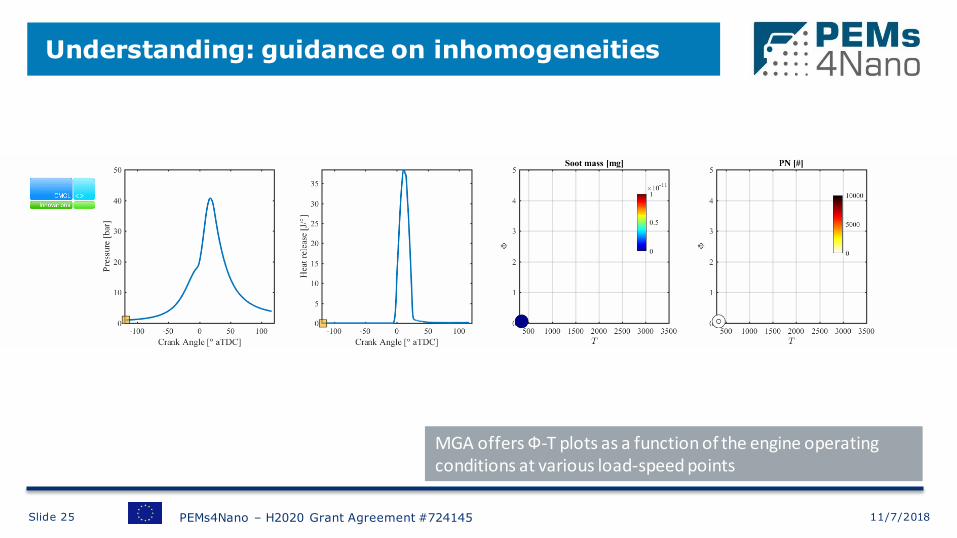
Understanding: guidance on inhomogeneities
MGA offers Ф-T plots as a function of the engine operating conditions at various load-speed points
PEMs4Nano – H2020 Grant Agreement #724145

11/7/2018 Slide 26
• MGA maps the in-cylinder inhomogeneities in Ф-T space with the soot and NOx emissions
• Ф-T plots of stochastic parcels at 4 stages in the engine cycle. There are 2 bulk parcels (stoichiometric) and 10 wall parcels (rich).
• One parcel burns at spark and enters the NOx zone. Mass is transferred from the unburned parcel into the burned parcel as the simulation proceeds
• Later in the simulation, the wall parcels burn and enter the soot zone
• Soot precursors (coronene) formed in the wall parcels contribute to the inception of solid soot particles.
Understanding: guidance on inhomogeneities
The parcels are coloured according to the soot mass within them and the values are normalised to 1 × 10⁻⁷ kg.
MGA offers Ф-T plots as a function of the engine operating conditions at various load-speed points
PEMs4Nano – H2020 Grant Agreement #724145
Slide 27 PEMs4Nano – H2020 Grant Agreement #724145
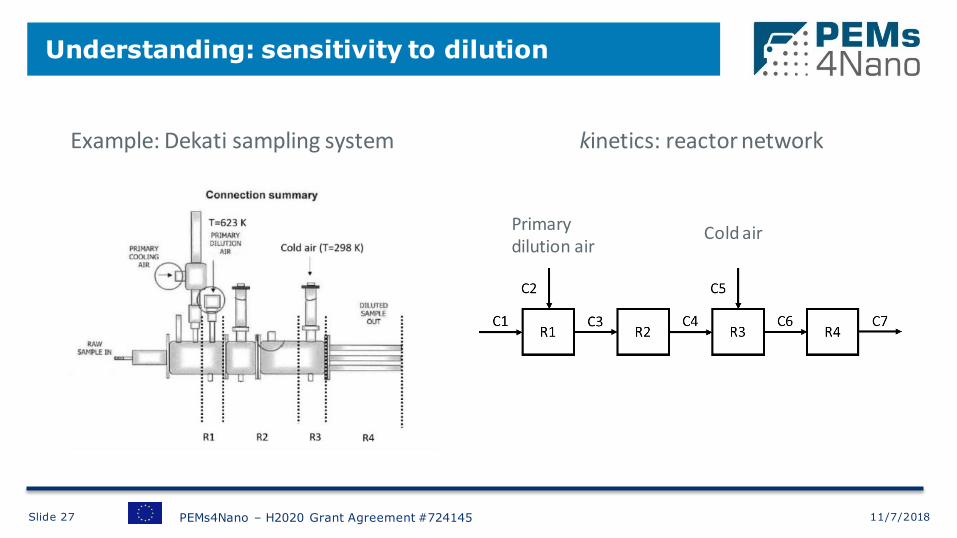
Understanding: sensitivity to dilution
Example: Dekati sampling system kinetics: reactor network
Primary dilution air
Cold air
11/7/2018
Slide 28 PEMs4Nano – H2020 Grant Agreement #724145
Understanding: sensitivity to dilution
Solids and SOF sensitivity to dilution Aggregate size distribution over load-speed operation
11/7/2018

11/7/2018 Slide 29
Understanding: sensitivity to pipe length
Size of R4 (pipe) can be varied easily. Effects on measured PN can be assessed.
PEMs4Nano – H2020 Grant Agreement #724145

Slide 30 PEMs4Nano – H2020 Grant Agreement #724145
Understanding: guidance – bulk vs. surface
0
500
1000
1500
2000
2500
3000
3500
32 56 100 180
TIC
Organic carbon
0
50
100
150
200
250
300
350
32 56 100 180
Elemental carbon
Measurements MGA
- Elemental carbon in opposite
trend with soot mass fraction
- SOF layer thickness matches organic carbon
- Validated a surface characterisation technique using SOF layer thickness
11/7/2018

Slide 31 PEMs4Nano – H2020 Grant Agreement #724145
Understanding: MGA - dissemination
• MGA on a GDI SI single cylinder engine
• MGA maps in-cylinder inhomogeneities in Ф-T w.r.t. soot and NOx emissions
• Sensitivity to dilution and temperature during sampling
• Size-resolved chemical characterisation: bulk vs surface
• Draft manuscript prepared • MGA on a GDI SI multi-cylinder
engine started
11/7/2018

Recommendation for PN > 10 nm assessment… … during engine development process … during vehicle RDE testing
Slide 32 PEMs4Nano – H2020 Grant Agreement #724145
Calibration procedure
Testing protocols
Validation & robustness evaluation
Application advice
Engine operating conditions
Robustness evaluation
11/7/2018
Procedures: objectives
Slide 33 PEMs4Nano – H2020 Grant Agreement #724145 11/7/2018
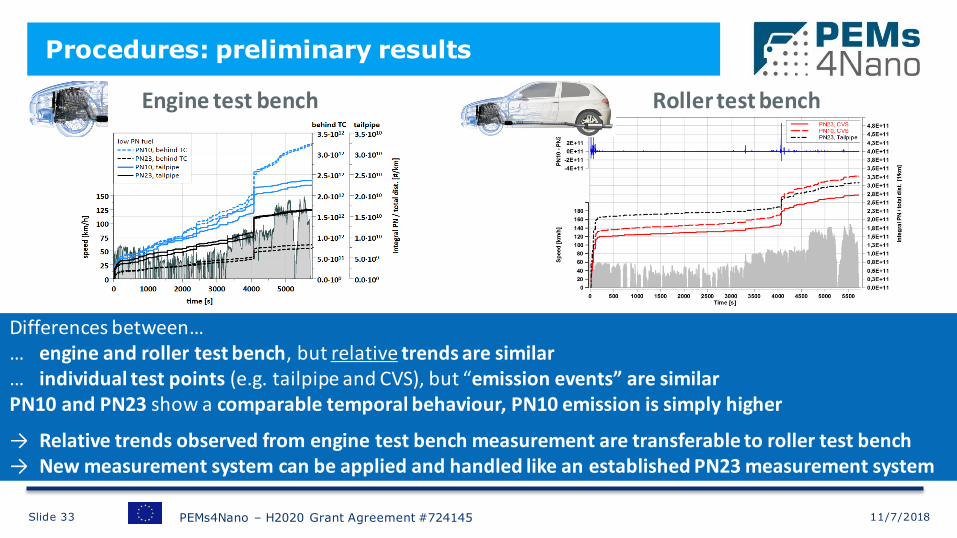
Procedures: preliminary results
Differences between… … engine and roller test bench, but relative trends are similar … individual test points (e.g. tailpipe and CVS), but “emission events” are similar PN10 and PN23 show a comparable temporal behaviour, PN10 emission is simply higher
→ Relative trends observed from engine test bench measurement are transferable to roller test bench → New measurement system can be applied and handled like an established PN23 measurement system
Engine test bench Roller test bench

Slide 34 PEMs4Nano – H2020 Grant Agreement #724145 11/7/2018
Procedures: test schedule
Fundamentals/ PN characterisation with: SEM. TEM AFM-Raman, TERS ToF-SIMS, L2MS LII CPMA AAC
Procedure for engine developement process
Procedure for vehicle RDE testing
single cylinder engine
multi- cylinder engine (I4, 2.0l, T/C, GDI)
4 vehicles on chassis dyno
2 vehicles on real road
vehicle 1: C-segment2: GDI engine: I4, 2.0l, T/C with GPF vehicle 2: D-segment2: GDI engine: I4, 2.0l, T/C without GPF vehicle 3: SUV-segment (Basis Euro5-6c): GDI engine: I4, 2.0l, T/C without GPF vehicle 4: B/C-segment (Basis Euro6d-Temp): GDI engine: I3/I4, 1.0-1.5l, with GPF
1 production engine as basis, modifications on engine hardware & ECU calibration 2 demonstrator vehicle (Basis EU6) with modified vehicle & engine hardware as well as modified engine calibration
single operating points Mini map, load steps, WLTC & RDE cycle
NEDC, WLTC & RDE cycle

11/7/2018 Slide 35 PEMs4Nano – H2020 Grant Agreement #724145
Conclusions
Understanding - On-line/off-line multi-technique characterization of a wide variety of size-selected particles : - for powerful discrimination protocols - for extensive database of particle physical and chemical properties as input for MGA - MGA aligned with measurements on the size-resolved surface (organic carbon) versus bulk (elemental carbon) compositions.
Technology - Two systems (laboratory + PEMS) including subcomponents (e.g. CPC, CS) have been modified for >10 nm measurements - Laboratory system validated and in use since April 2018 - PEMS currently under validation
Procedures - PEMs4Nano lab system can be applied and handled according to PMP-recommendation - MGA combining physico-chemical simulation and statistical algorithms to offer sensitivities in particle characterisation as a function of RDE attributes

End of presentation www.PEMs4Nano.eu
This project has received funding from the European Union’s Horizon 2020 research and innovation
programme under grant agreement No. 724145
Industry
Research partners
Service partner
Slide 36