Embed Size (px)
Citation preview
“WORKING CAPITAL MANAGEMENT”“WORKING CAPITAL MANAGEMENT”“WORKING CAPITAL MANAGEMENT”“WORKING CAPITAL MANAGEMENT”
UNIVERSAL STARCH CHEM. ALLIED LTD.UNIVERSAL STARCH CHEM. ALLIED LTD.UNIVERSAL STARCH CHEM. ALLIED LTD.UNIVERSAL STARCH CHEM. ALLIED LTD.
NORTH MAHARASHTRA UNIVERSITYNORTH MAHARASHTRA UNIVERSITYNORTH MAHARASHTRA UNIVERSITYNORTH MAHARASHTRA UNIVERSITY
TOWARDS PARTIAL FULFILLMENT OFTOWARDS PARTIAL FULFILLMENT OFTOWARDS PARTIAL FULFILLMENT OFTOWARDS PARTIAL FULFILLMENT OF
BACHELOR DEGREE IN BUSINESS ADMINISTRATIONBACHELOR DEGREE IN BUSINESS ADMINISTRATIONBACHELOR DEGREE IN BUSINESS ADMINISTRATIONBACHELOR DEGREE IN BUSINESS ADMINISTRATION
BACHELOR IN BUSINESS ADMINISTRATIONBACHELOR IN BUSINESS ADMINISTRATIONBACHELOR IN BUSINESS ADMINISTRATIONBACHELOR IN BUSINESS ADMINISTRATION
{FINANCIAL MANAGEMENT}{FINANCIAL MANAGEMENT}{FINANCIAL MANAGEMENT}{FINANCIAL MANAGEMENT}
AAAA
PROJECT REPORTPROJECT REPORTPROJECT REPORTPROJECT REPORT
ONONONON
“WORKING CAPITAL MANAGEMENT”“WORKING CAPITAL MANAGEMENT”“WORKING CAPITAL MANAGEMENT”“WORKING CAPITAL MANAGEMENT”
ININININ
UNIVERSAL STARCH CHEM. ALLIED LTD.UNIVERSAL STARCH CHEM. ALLIED LTD.UNIVERSAL STARCH CHEM. ALLIED LTD.UNIVERSAL STARCH CHEM. ALLIED LTD.
DONDAICHA.DONDAICHA.DONDAICHA.DONDAICHA.
SUBMITTED TOSUBMITTED TOSUBMITTED TOSUBMITTED TO
NORTH MAHARASHTRA UNIVERSITYNORTH MAHARASHTRA UNIVERSITYNORTH MAHARASHTRA UNIVERSITYNORTH MAHARASHTRA UNIVERSITY
TOWARDS PARTIAL FULFILLMENT OFTOWARDS PARTIAL FULFILLMENT OFTOWARDS PARTIAL FULFILLMENT OFTOWARDS PARTIAL FULFILLMENT OF
BACHELOR DEGREE IN BUSINESS ADMINISTRATIONBACHELOR DEGREE IN BUSINESS ADMINISTRATIONBACHELOR DEGREE IN BUSINESS ADMINISTRATIONBACHELOR DEGREE IN BUSINESS ADMINISTRATION
SUBMITTED BYSUBMITTED BYSUBMITTED BYSUBMITTED BY
A$HWIN CHOUHANA$HWIN CHOUHANA$HWIN CHOUHANA$HWIN CHOUHAN
BACHELOR IN BUSINESS ADMINISTRATIONBACHELOR IN BUSINESS ADMINISTRATIONBACHELOR IN BUSINESS ADMINISTRATIONBACHELOR IN BUSINESS ADMINISTRATION
{FINANCIAL MANAGEMENT}{FINANCIAL MANAGEMENT}{FINANCIAL MANAGEMENT}{FINANCIAL MANAGEMENT}
{2010{2010{2010{2010----11}11}11}11}
FROMFROMFROMFROM
“WORKING CAPITAL MANAGEMENT”“WORKING CAPITAL MANAGEMENT”“WORKING CAPITAL MANAGEMENT”“WORKING CAPITAL MANAGEMENT”
UNIVERSAL STARCH CHEM. ALLIED LTD.UNIVERSAL STARCH CHEM. ALLIED LTD.UNIVERSAL STARCH CHEM. ALLIED LTD.UNIVERSAL STARCH CHEM. ALLIED LTD.
NORTH MAHARASHTRA UNIVERSITYNORTH MAHARASHTRA UNIVERSITYNORTH MAHARASHTRA UNIVERSITYNORTH MAHARASHTRA UNIVERSITY
TOWARDS PARTIAL FULFILLMENT OFTOWARDS PARTIAL FULFILLMENT OFTOWARDS PARTIAL FULFILLMENT OFTOWARDS PARTIAL FULFILLMENT OF
BACHELOR DEGREE IN BUSINESS ADMINISTRATIONBACHELOR DEGREE IN BUSINESS ADMINISTRATIONBACHELOR DEGREE IN BUSINESS ADMINISTRATIONBACHELOR DEGREE IN BUSINESS ADMINISTRATION
BACHELOR IN BUSINESS ADMINISTRATIONBACHELOR IN BUSINESS ADMINISTRATIONBACHELOR IN BUSINESS ADMINISTRATIONBACHELOR IN BUSINESS ADMINISTRATION
UNIVERSAL STARCH-CHEM ALLIED LTD. DONDAICHA. A PROJECT REPORT
Institute of Management Research and Development, Shirpur. 2
ACKNOWLEDGEMENT Words are indeed inadequate to convey my deep sense of gratitude to all those who have helped me in completing this project to the best of my ability. Being a part of this project has certainly been a unique and a very productive experience on my part. First of all I would like to thank North Maharashtra University, Jalgoan for providing me an opportunity to undertake a project as a partly fulfillment of BBA degree. I am really thankful to my mentor Mr. Ankush Agrawal Sir, for guiding and helping me to solve all kinds of queries regarding the project work. His systematic way of working and incomparable guidance has inspired the pace of the project to a great extent. I would also like to thank my project coordinator Mr. Sachin Surana Sir for guiding me about preparing project report and very thankful to all lecturers, office staff and library staff of Institute of Management Research And Development, Shirpur for their useful guidance and advise. I am very grateful to Mr. J.S Patil Sir (Sr. Administration Manager) UNIV ERSAL STARCH-CHEM ALLIED LTD. Who has given me the opportunity to do this project in their esteemed organization. This project would not have been successful without the help of Mr. Altaf Sheikh Sir (Finance Manager) and Mr. Devendrasingh Rawal (A.C Maintenance Dept.) of UNIVERSAL STARCH-CHEM ALLIED LTD. Last but not least I would like to thank all the employees of UNIVERSAL STARCH-CHEM ALLIED LTD. who have directly and indirectly helped me with their moral support for the completion of my project Finally I would to express sincere thanks to my Dad & Mom for their blessings and appreciation which helped me some or other way in making my project successful. ( Ashwin Chouhan )
UNIVERSAL STARCH-CHEM ALLIED LTD. DONDAICHA. A PROJECT REPORT
Institute of Management Research and Development, Shirpur. 3
TABLE OF CONTENTS
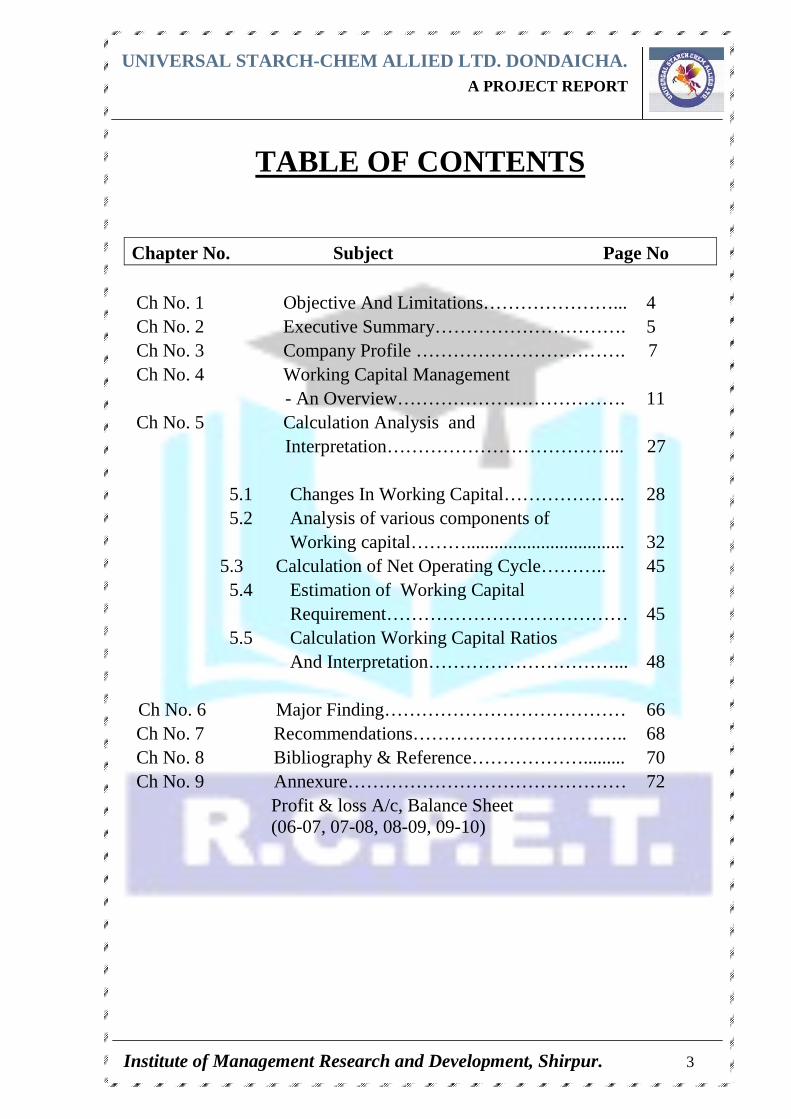
Chapter No. Subject Page No Ch No. 1 Objective And Limitations…………………... 4 Ch No. 2 Executive Summary…………………………. 5 Ch No. 3 Company Profile ……………………………. 7 Ch No. 4 Working Capital Management - An Overview………………………………. 11 Ch No. 5 Calculation Analysis and Interpretation………………………………... 27 5.1 Changes In Working Capital……………….. 28 5.2 Analysis of various components of Working capital……….................................. 32 5.3 Calculation of Net Operating Cycle……….. 45 5.4 Estimation of Working Capital Requirement………………………………… 45 5.5 Calculation Working Capital Ratios And Interpretation…………………………... 48
Ch No. 6 Major Finding………………………………… 66 Ch No. 7 Recommendations…………………………….. 68 Ch No. 8 Bibliography & Reference………………......... 70 Ch No. 9 Annexure……………………………………… 72 Profit & loss A/c, Balance Sheet (06-07, 07-08, 08-09, 09-10)
UNIVERSAL STARCH-CHEM ALLIED LTD. DONDAICHA. A PROJECT REPORT
Institute of Management Research and Development, Shirpur. 4
OBJECTIVES & LIMITATIONS
It is compulsory that under three year full time course of B.B.A. degree, a student has to
undergo different training programs so as to establish himself capable of managing at the
place of his work after the completion of this degree. Thus project work is an unique way
of studying an organization.
The main purpose of assigning this task of project report is to keep new practical
knowledge, establishing relations with different persons outside the organization and to
obtain first hand and factual information.
The project helps to draw out the differences and similarities between the theoretical
knowledge with the actual job conditions, this helps the students to persuade and activate
strategy decision-making when they start their carriers. It provides an opportunity to
develop communication skill and analytical skills.
The project provides the opportunity to understand the working capital management of
Universal Starch-Chem Allied Ltd.
Limitations:
This project focuses only on certain factors, which are important to discuss. But tool of
ratio analysis has certain fundamental and conceptual limitations, this project as well.
The study is only made on one organization so it does not provide any scope of
comparison with other organization.
� The study is based only on last 4-year records.
� The study is restricted to financial position of the company with on attention
given to loans and advances and deposit mobilization.
� While computing ratios, average, percentage, the figures are appropriated to two
decimal places. Therefore sometimes the total may not exactly tally
� Sometime round figures are taken on place of accurate figures.
UNIVERSAL STARCH-CHEM ALLIED LTD. DONDAICHA. A PROJECT REPORT
Institute of Management Research and Development, Shirpur. 5
UNIVERSAL STARCH-CHEM ALLIED LTD. DONDAICHA. A PROJECT REPORT
Institute of Management Research and Development, Shirpur. 6
EXECUTIVE SUMMARY
The group was founded in the year 1973 by Hon'ble Shri Dadasaheb Rawal, the Ex-Ruler, Ex-MLA & Freedom Fighter. This visionary personality thought of bringing industry, power & water works to his town of Dondaicha, which was otherwise an under-developed region of North Maharashtra. In his vision he selected an agro- based industry to process Maize into value-added products. The project entitled “Working Capital Management and Analysis” deals with brief of management of their day to day expenses, inflow as well as outflow of cash in UNIVERSAL STARCH-CHEM ALLIED LTD. DONDAICHA. which is an agro-based industry to process Maize into value-added products. The term of study was kept limited to make the title true. The purpose of the report is to get the in depth understanding of the process of working capital management. The Company has successfully enhanced the production capacity of Maize Refining from 60 MT to 400 MT per day. The objective of this project work is to focus on the working capital of the STARCH-CHEM ALLIED LTD. DONDAICHA. And exploring its potential in the company. The project contain the basic postulates of working capital, procedure of analysis of working capital, ratio being used to define the working capital and the impact of working capital in the company in case of excess or inadequacy. Also, the project contains analysis of estimation of working capital requirement and the procedure to estimate working capital requirement in manufacturing and trading concern. and from the data available it can be concluded that it holds a very strong position in the market. The total turnover of company is around `̀̀̀.85 crores and still counting. Company showing good ratios which indicate sound efficiency , liquidity , and structural health of company.

UNIVERSAL STARCH-CHEM ALLIED LTD. DONDAICHA. A PROJECT REPORT
Institute of Management Research and Development, Shirpur. 7
� Founder � Vision � Mission � Company History � Structure � Capacities � Products
UNIVERSAL STARCH-CHEM ALLIED LTD. DONDAICHA. A PROJECT REPORT
Institute of Management Research and Development, Shirpur. 8
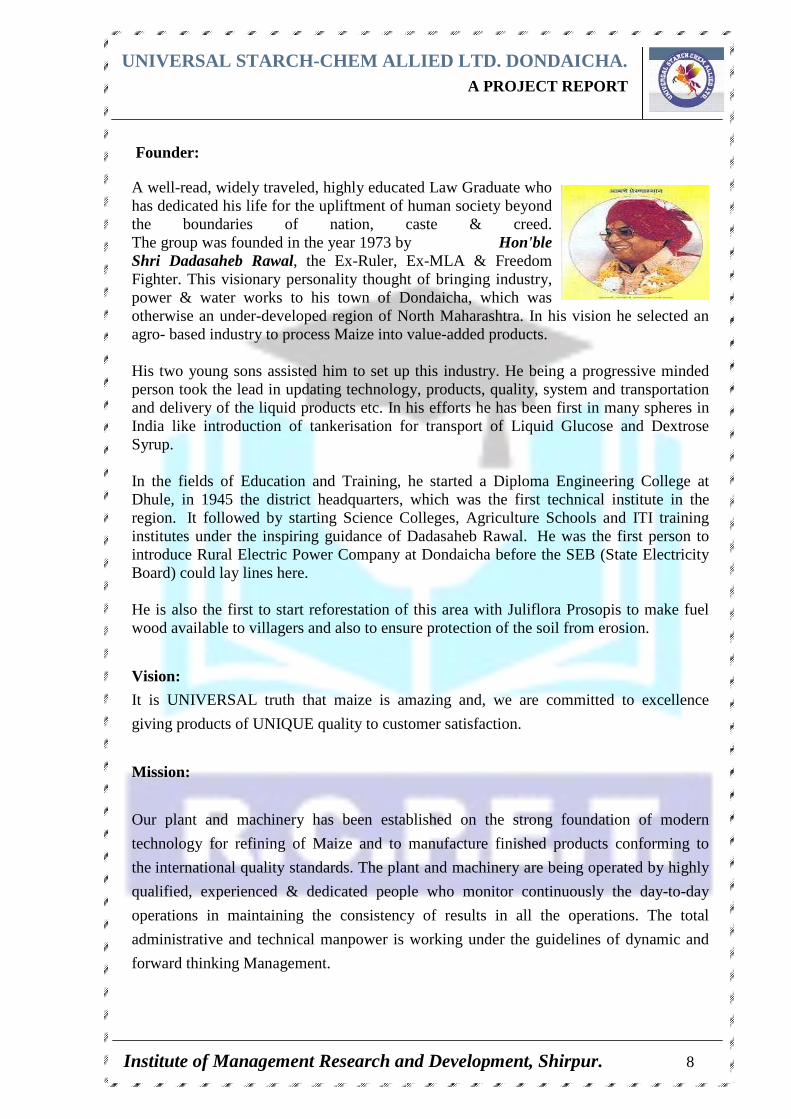
A well-read, widely traveled, highly educated Law Graduate who has dedicated his life for the upliftment of human society beyond the boundaries of nation, caste & creed. The group was founded in the year 1973 by Hon'ble Shri Dadasaheb Rawal, the Ex-Ruler, Ex-MLA & Freedom Fighter. This visionary personality thought of bringing industry, power & water works to his town of Dondaicha, which was otherwise an under-developed region of North Maharashtra. In his vision he selected an agro- based industry to process Maize into value-added products. His two young sons assisted him to set up this industry. He being a progressive minded person took the lead in updating technology, products, quality, system and transportation and delivery of the liquid products etc. In his efforts he has been first in many spheres in India like introduction of tankerisation for transport of Liquid Glucose and Dextrose Syrup. In the fields of Education and Training, he started a Diploma Engineering College at Dhule, in 1945 the district headquarters, which was the first technical institute in the region. It followed by starting Science Colleges, Agriculture Schools and ITI training institutes under the inspiring guidance of Dadasaheb Rawal. He was the first person to introduce Rural Electric Power Company at Dondaicha before the SEB (State Electricity Board) could lay lines here. He is also the first to start reforestation of this area with Juliflora Prosopis to make fuel wood available to villagers and also to ensure protection of the soil from erosion.
Vision:
It is UNIVERSAL truth that maize is amazing and, we are committed to excellence
giving products of UNIQUE quality to customer satisfaction.
Mission:
Our plant and machinery has been established on the strong foundation of modern
technology for refining of Maize and to manufacture finished products conforming to
the international quality standards. The plant and machinery are being operated by highly
qualified, experienced & dedicated people who monitor continuously the day-to-day
operations in maintaining the consistency of results in all the operations. The total
administrative and technical manpower is working under the guidelines of dynamic and
forward thinking Management.
Founder:

UNIVERSAL STARCH-CHEM ALLIED LTD. DONDAICHA. A PROJECT REPORT
Institute of Management Research and Development, Shirpur. 9
Company History
M/s. UNIVERSAL STARCH-CHEM ALLIED LTD. DONDAICHA. Has achieved remarkable milestones during the history of last 30 years since its incorporation in 1973. The Company has successfully enhanced the production capacity of Maize Refining from 60 MT to 400 MT per day.
The product range has been also successfully expanded to cater the requirements of Food, Pharmaceutical, Textile, Paper & Adhesive industries. The process of new product development has been accomplished through the instantaneous efforts of different teams like Marketing, R & D, Engineering & Production. The Company’s R and D Laboratory is recognized by D.S.I.R., Govt. of India. The Company was awarded by OPPI as the “BEST VENDOR’ in the category of ‘Excipient Supplier” for the year 1998-99. The Company has a H.R.D. Centre for training the staff and workers on Total Quality Management, Productivity and ISO 9000.
The Company is thriving in sectors of Energy, Environment under the dynamic leadership of Management. The Company has sophisticated and full-fledged Effluent Treatment Plant along with Bio-Digestors in which Biogas is generated from the factory effluents. The Biogas is being utilized as the fuel for by-product driers and boilers and actively participating in the National Campaign of “SAVE ENERGY SAVE NATION”. The Company has also established Wind Mill to generate 0.6 M.W. power and also succeeded in establishing a Co-Generation Power plant for captive consumption. The Management is dedicated in the service of Mankind with the production and supply of quality products through Maize Refining industry.
Structure:
Chairman & Managing Director : USA -- Universal Starch-Chem Allied Ltd.
Hon'ble Shri.Sarkarsaheb Rawal
Director - Business Development Shri. Jaykumar J. Rawal - M.L.A.
Director - Business Administration
Shri. Rishikesh Rawal
Director Shri. Vikrant Rawal Chief Executive Officer Finance Advisor Mr. M.N. Patwari General Manager - R & D Mr. D.A. Patil General Manager - Q.A. Mr. G.P. Chaudhary General Manager – Engg
UNIVERSAL STARCH-CHEM ALLIED LTD. DONDAICHA. A PROJECT REPORT
Institute of Management Research and Development, Shirpur. 10
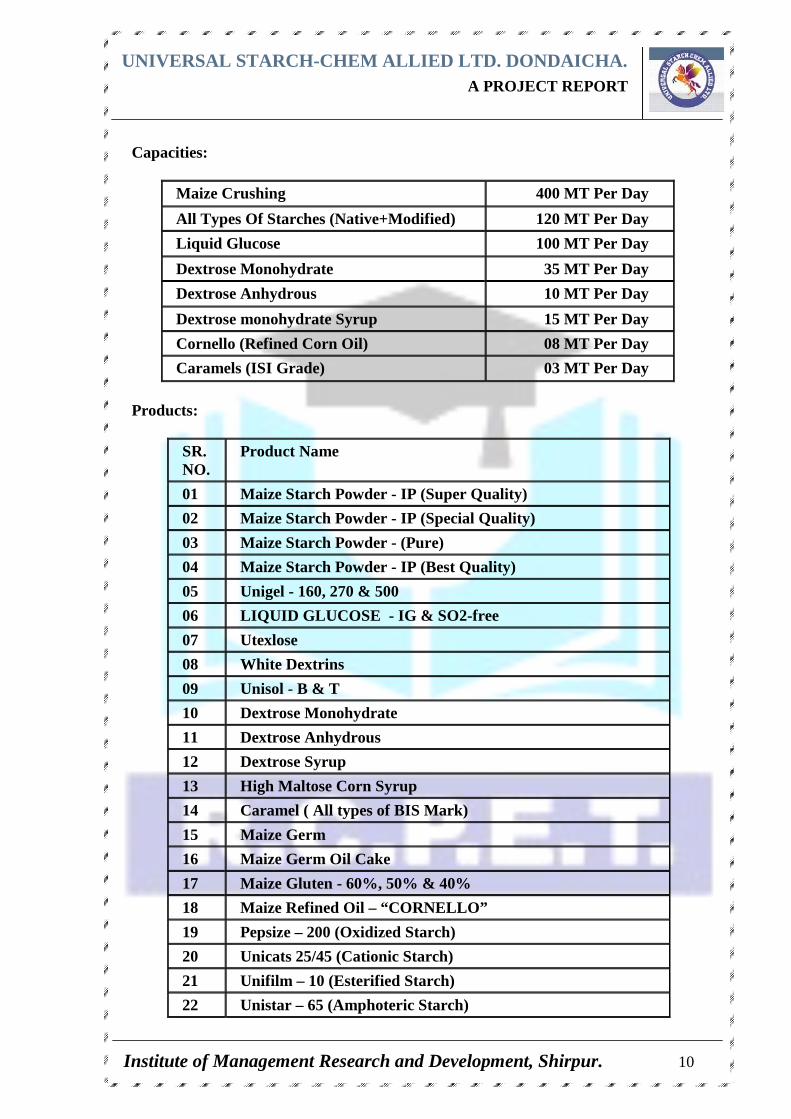
Capacities:
Maize Crushing 400 MT Per Day
All Types Of Starches (Native+Modified) 120 MT Per Day
Liquid Glucose 100 MT Per Day
Dextrose Monohydrate 35 MT Per Day
Dextrose Anhydrous 10 MT Per Day
Dextrose monohydrate Syrup 15 MT Per Day
Cornello (Refined Corn Oil) 08 MT Per Day
Caramels (ISI Grade) 03 MT Per Day
Products:
SR. NO.
Product Name
01 Maize Starch Powder - IP (Super Quality)
02 Maize Starch Powder - IP (Special Quality)
03 Maize Starch Powder - (Pure)
04 Maize Starch Powder - IP (Best Quality)
05 Unigel - 160, 270 & 500
06 LIQUID GLUCOSE - IG & SO2-free
07 Utexlose
08 White Dextrins
09 Unisol - B & T
10 Dextrose Monohydrate
11 Dextrose Anhydrous
12 Dextrose Syrup
13 High Maltose Corn Syrup
14 Caramel ( All types of BIS Mark)
15 Maize Germ
16 Maize Germ Oil Cake
17 Maize Gluten - 60%, 50% & 40%
18 Maize Refined Oil – “CORNELLO”
19 Pepsize – 200 (Oxidized Starch)
20 Unicats 25/45 (Cationic Starch)
21 Unifilm – 10 (Esterified Starch)
22 Unistar – 65 (Amphoteric Starch)
UNIVERSAL STARCH-CHEM ALLIED LTD. DONDAICHA. A PROJECT REPORT
Institute of Management Research and Development, Shirpur. 11
Working capital has been described as the
“Life blood of any business which is apt because it
constitutes a cyclically flowing stream through the
business.”
UNIVERSAL STARCH-CHEM ALLIED LTD. DONDAICHA. A PROJECT REPORT
Institute of Management Research and Development, Shirpur. 12
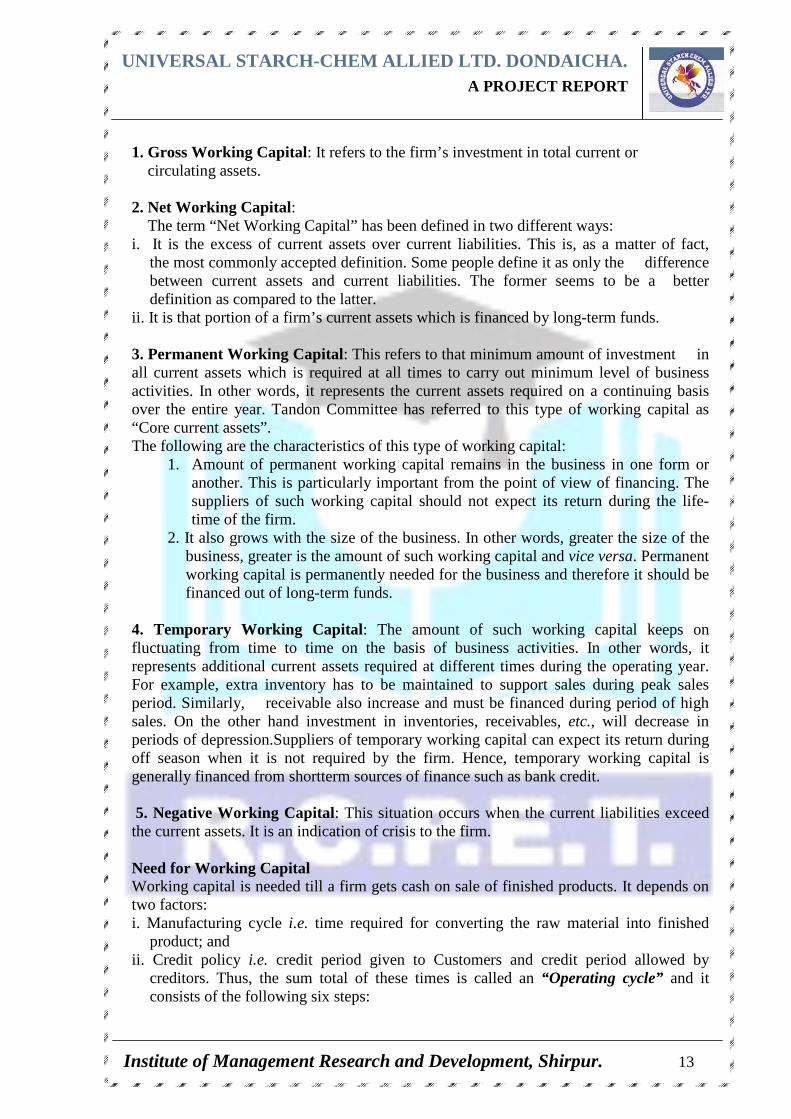
This section includes: INTRODUCTION :
The term working capital is commonly used for the capital required for day-to-day working in a business concern, such as for purchasing raw material, for meeting day-to-day expenditure on salaries, wages, rents rates, advertising etc. But there are much disagreement among various financial authorities (Financiers, accountants, businessmen and economists) as to the exact meaning of the term working capital.
DEFINITION AND CLASSIFICATION OF WORKING CAPITAL:
Working capital refers to the circulating capital required to meet the day to day operations of a business firm. Working capital may be defined by various authors as follows: 1. According to Weston & Brigham - “Working capital refers to a firm’s investment in short term assets, such as cash amounts receivables, inventories etc. 2. Working capital means current assets. - Mead, Baker and Malott 3. “The sum of the current assets is the working capital of the business” - J.S.Mill Working capital is defined as “the excess of current assets over current liabilities and provisions”. But as per accounting terminology, it is difference between the inflow and outflow of funds. In the Annual Survey of Industries (1961), working capital is defined to include “Stocks of materials, fuels, semi-finished goods including work-in-progress and finished goods and by-products; cash in hand and bank and the algebraic sum of sundry creditors as represented by (a) outstanding factory payments e.g. rent, wages, interest and dividend; b)purchase of goods and services; c) short-term loans and advances and sundry debtors comprising amounts due to the factory on account of sale of goods and services and advances towards tax payments”.
The term “working capital” is often referred to “circulating capital” which is frequently used to denote those assets which are changed with relative speed from one form to another i.e., starting from cash, changing to raw materials, converting into work-in-progress and finished products, sale of finished products and ending with realization of cash from debtors.
Working capital has been described as the “life blood of any business which is apt because it constitutes a cyclically flowing stream through the business”.
Working Capital may be classified in two ways a) Concept based working capital b) Time based working capital
Concepts of working capital
UNIVERSAL STARCH-CHEM ALLIED LTD. DONDAICHA. A PROJECT REPORT
Institute of Management Research and Development, Shirpur. 13
1. Gross Working Capital: It refers to the firm’s investment in total current or circulating assets. 2. Net Working Capital: The term “Net Working Capital” has been defined in two different ways: i. It is the excess of current assets over current liabilities. This is, as a matter of fact,
the most commonly accepted definition. Some people define it as only the difference between current assets and current liabilities. The former seems to be a better definition as compared to the latter.
ii. It is that portion of a firm’s current assets which is financed by long-term funds. 3. Permanent Working Capital: This refers to that minimum amount of investment in all current assets which is required at all times to carry out minimum level of business activities. In other words, it represents the current assets required on a continuing basis over the entire year. Tandon Committee has referred to this type of working capital as “Core current assets”. The following are the characteristics of this type of working capital:
1. Amount of permanent working capital remains in the business in one form or another. This is particularly important from the point of view of financing. The suppliers of such working capital should not expect its return during the life-time of the firm.
2. It also grows with the size of the business. In other words, greater the size of the business, greater is the amount of such working capital and vice versa. Permanent working capital is permanently needed for the business and therefore it should be financed out of long-term funds.
4. Temporary Working Capital : The amount of such working capital keeps on fluctuating from time to time on the basis of business activities. In other words, it represents additional current assets required at different times during the operating year. For example, extra inventory has to be maintained to support sales during peak sales period. Similarly, receivable also increase and must be financed during period of high sales. On the other hand investment in inventories, receivables, etc., will decrease in periods of depression.Suppliers of temporary working capital can expect its return during off season when it is not required by the firm. Hence, temporary working capital is generally financed from shortterm sources of finance such as bank credit. 5. Negative Working Capital: This situation occurs when the current liabilities exceed the current assets. It is an indication of crisis to the firm. Need for Working Capital Working capital is needed till a firm gets cash on sale of finished products. It depends on two factors: i. Manufacturing cycle i.e. time required for converting the raw material into finished
product; and ii. Credit policy i.e. credit period given to Customers and credit period allowed by
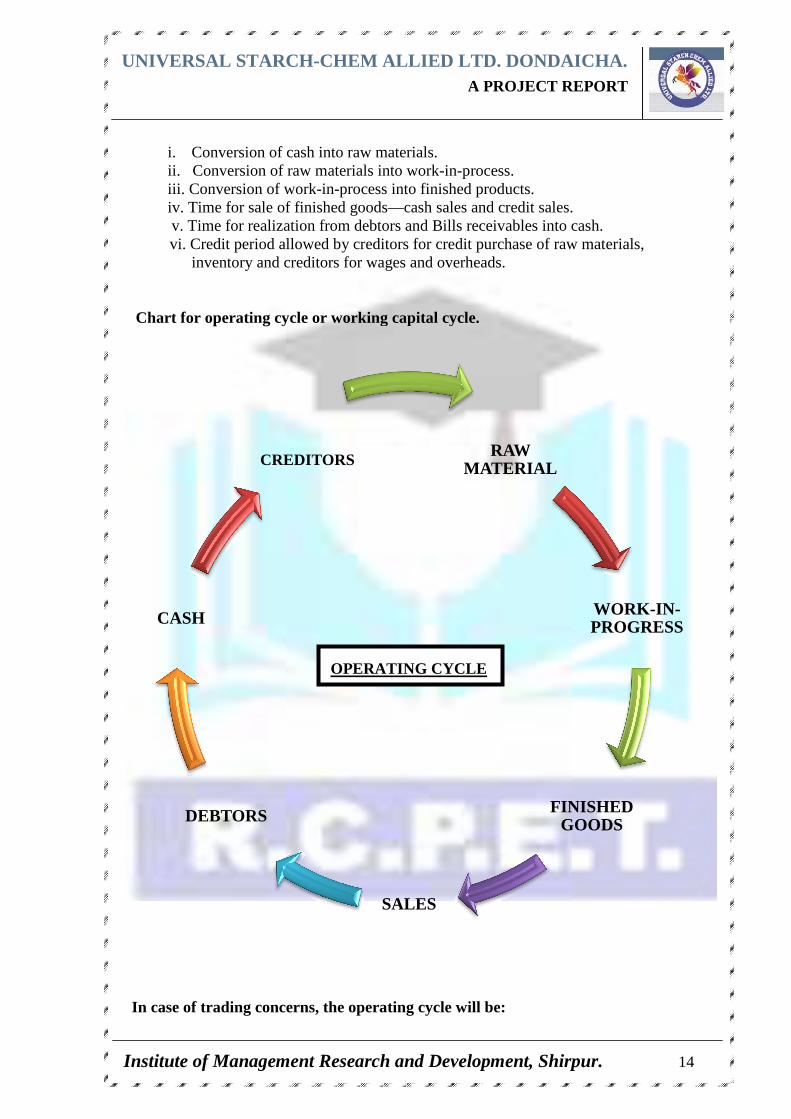
creditors. Thus, the sum total of these times is called an “Operating cycle” and it consists of the following six steps:
UNIVERSAL STARCH
Institute of Management Research and Development, Shirpur.
i. Conversion of cash into raw materials.ii. Conversion of raw materials into work
iii. Conversion of work iv. Time for sale of finished goods v. Time for realization
vi. Credit period allowed by creditors for credit purchase of raw materials, inventory and creditors for wages and overheads.
Chart for operating cycle or working capital cycle.
In case of trading concerns, the operating cycle will be:
DEBTORS
CASH
CREDITORS
NIVERSAL STARCH -CHEM ALLIED LTD. DONDAICHA A PROJECT REPORT
Institute of Management Research and Development, Shirpur.
Conversion of cash into raw materials. Conversion of raw materials into work-in-process.
of work-in-process into finished products. for sale of finished goods—cash sales and credit sales.
realization from debtors and Bills receivables into cash.period allowed by creditors for credit purchase of raw materials,
creditors for wages and overheads.
cycle or working capital cycle.
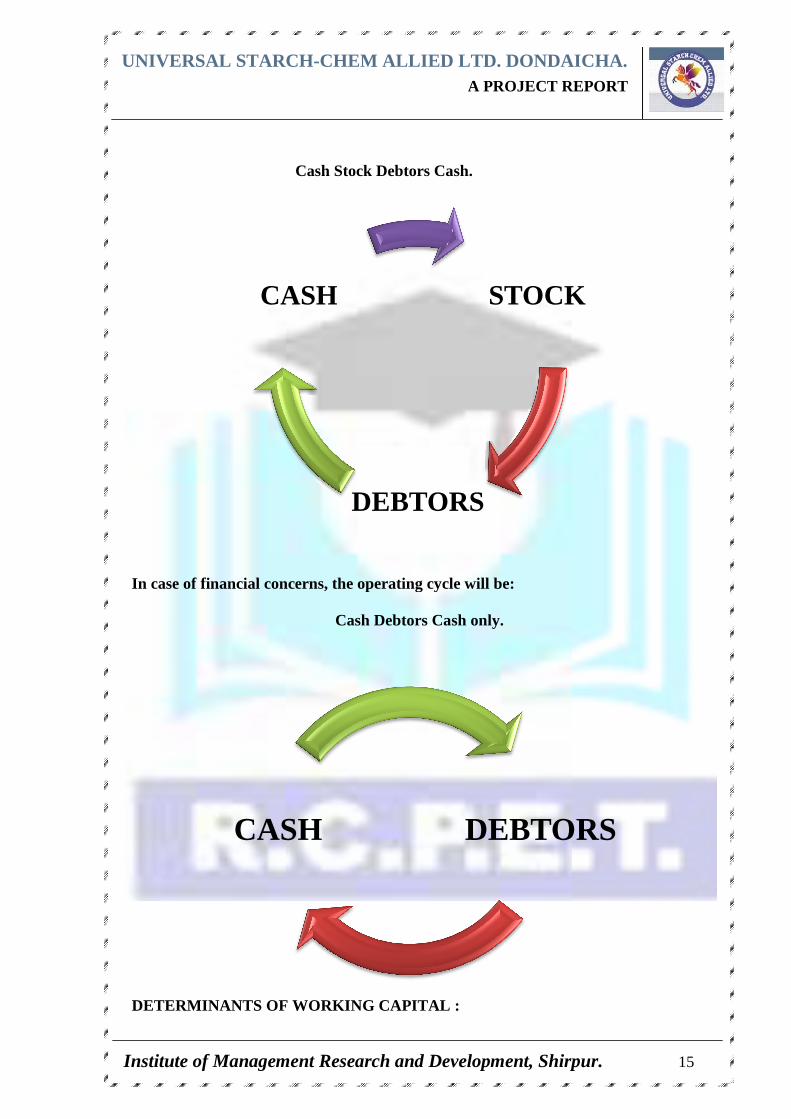
In case of trading concerns, the operating cycle will be:
RAW MATERIAL
FINISHED GOODS
SALES
CREDITORS
OPERATING CYCLE
DONDAICHA . A PROJECT REPORT
Institute of Management Research and Development, Shirpur. 14
s. from debtors and Bills receivables into cash.
period allowed by creditors for credit purchase of raw materials,
WORK-IN-PROGRESS
FINISHED GOODS
UNIVERSAL STARCH
Institute of Management Research and Development, Shirpur.
In case of financial concerns, the operating cycle will be:
DETERMINANTS OF WORKING CAPITAL :
CASH
CASH
NIVERSAL STARCH -CHEM ALLIED LTD. DONDAICHA A PROJECT REPORT
Institute of Management Research and Development, Shirpur.
Cash Stock Debtors Cash.
In case of financial concerns, the operating cycle will be:
Cash Debtors Cash only.
DETERMINANTS OF WORKING CAPITAL :
STOCK
DEBTORS
CASH
DEBTORSCASH
DONDAICHA . A PROJECT REPORT
Institute of Management Research and Development, Shirpur. 15
STOCK
DEBTORS
UNIVERSAL STARCH-CHEM ALLIED LTD. DONDAICHA. A PROJECT REPORT
Institute of Management Research and Development, Shirpur. 16
The factors influencing the working capital decisions of a firm may be classified as two groups, such as internal factors and external factors. The internal factors includes, nature of business size of business, firm’s product policy, credit policy, dividend policy, and access to money and capital markets, growth and expansion of business etc. The external factors include business fluctuations, changes in the technology, infrastructural facilities, import policy and the taxation policy etc. These factors are discussed in brief in the following lines. I. Internal Factors 1. Nature and size of the business The working capital requirements of a firm are basically influenced by the nature and size of the business. Size may be measured in terms of the scale of operations. A firm with larger scale of operations will need more working capital than a small firm. Similarly, the nature of the business - influence the working capital decisions. Trading and financial firms have less investment in fixed assets. But require a large sum of money to be invested in working capital. Retail stores, business units require larger amount of working capital, whereas, public utilities need less working capital and more funds to invest in fixed assets. 2. Firm’s production policy The firm’s production policy (manufacturing cycle) is an important factor to decide the working capital requirement of a firm. The production cycle starts with the purchase and use of raw material and completes with the production of finished goods. On the other hand production policy is uniform production policy or seasonal production policy etc., also influences the working capital decisions. Larger the manufacturing cycle and uniform production policy – larger will be the requirement of working capital. The working capital requirement will be higher with varying production schedules in accordance with the changing demand. 3. Firm’s credit policy The credit policy of a firm influences credit policy of working capital. A firm following liberal credit policy to all customers requires funds. On the other hand, the firm adopting strict credit policy and grant credit facilities to few potential customers will require less amount of working capital. 4. Availability of credit The working capital requirements of a firm are also affected by credit terms granted by its suppliers – i.e. creditors. A firm will need less working capital if liberal credit terms are available to it. Similarly, the availability of credit from banks also influences the working capital needs of the firm. A firm, which can get bank credit easily on favorable conditions, will be operated with less working capital than a firm without such a facility. 5. Growth and expansion of business Working capital requirement of a business firm tend to increase in correspondence with growth in sales volume and fixed assets. A growing firm may need funds to invest in fixed assets in order to sustain its growing production and sales. This will, in turn,
UNIVERSAL STARCH-CHEM ALLIED LTD. DONDAICHA. A PROJECT REPORT
Institute of Management Research and Development, Shirpur. 17
increase investment in current assets to support increased scale of operations. Thus, a growing firm needs additional funds continuously. 6. Profit margin and dividend policy The magnitude of working capital in a firm is dependent upon its profit margin and dividend policy. A high net profit margin contributes towards the working capital pool. To the extent the net profit has been earned in cash, it becomes a source of working capital. This depends upon the dividend policy of the firm. Distribution of high proportion of profits in the form of cash dividends results in a drain on cash resources and thus reduces company’s working capital to that extent. The working capital position of the firm is strengthened if the management follows conservative dividend policy and vice versa. 7. Operating efficiency of the firm Operating efficiency means the optimum utilisation of a firm’s resources at minimum cost. If a firm successfully controls operating cost, it will be able to improve net profit margin which, will, in turn, release greater funds for working capital purposes. 8. Co-ordinating activities in firm The working capital requirements of a firm are depend upon the co-ordination between production and distribution activities. The greater and effective the co-ordinations, the pressure on the working capital will be minimized. In the absence of co-ordination, demand for working capital is reduced. II. External Factors 1. Business fluctuations Most firms experience fluctuations in demand for their products and services. These business variations affect the working capital requirements. When there is an upward swing in the economy, sales will increase, correspondingly, the firm’s investment in inventories and book debts will also increase. Under boom, additional investment in fixed assets may be made by some firms to increase their productive capacity. This act of the firm will require additional funds. On the other hand when, there is a decline in economy, sales will come down and consequently the conditions, the firm try to reduce their short-term borrowings. Similarly the seasonal fluctuations may also affect the requirement of working capital of a firm. 2. Changes in the technology The technological changes and developments in the area of production can have immediate effects on the need for working capital. If the firm wish to install a new machine in the place of old system, the new system can utilise less expensive raw materials, the inventory needs may be reduced there by working capital needs. 3. Import policy Import policy of the Government may also affect the levels of working capital of a firm since they have to arrange funds for importing goods at specified times.
UNIVERSAL STARCH-CHEM ALLIED LTD. DONDAICHA. A PROJECT REPORT
Institute of Management Research and Development, Shirpur. 18
4. Infrastructural facilities The firms may require additional funds to maintain the levels of inventory and other current assets, when there is good infrastructural facilities in the company like, transportation and communications. 5. Taxation policy The tax policies of the Government will influence the working capital decisions. If the Government follow regressive taxation policy, i.e. imposing heavy tax burdens on business firms, they are left with very little profits for distribution and retention purpose. Consequently the firm has to borrow additional funds to meet their increased working capital needs. When there is a liberalized tax policy, the pressure on working capital requirement is minimized. Thus the working capital requirements of a firm are influenced by the internal and external factors. MEASUREMENT OF WORKING CAPITAL : There are 3 methods for assessing the working capital requirement as explained below: a) Percent of Sales Method Based on the past experience, some percentage of sale may be taken for determining the quantum of working capital b) Regression Analysis Method The relationship between sales and working capital and its various components may be plotted on Scatter diagram and the average percentage of past 5 years may be ascertained. This average percentage of sales may be taken as working capital. Similar exercise may be carried out at the beginning of the year for assessing the working capital requirement. This method is suitable for simple as well as complex situations. c) Operating Cycle Method As a first step, we have to compute the operating cycle as follows: i) Inventory period: Number of days consumption in stock = I + M_ 365 Where I = Average inventory during the year. M = Materials consumed during the year. ii) Work-in-process: Number of days of work-in-process = W + _ K_ 365 Where W = Average work-in-process during the year. K = Cost of work-in-process i.e., Material + Labour + Factory overheads. iii) Finished products inventory period: G ÷ F_ 365 Where G = Average finished products inventory during the year F = Cost of finished goods sold during the year.
UNIVERSAL STARCH-CHEM ALLIED LTD. DONDAICHA. A PROJECT REPORT
Institute of Management Research and Development, Shirpur. 19
iv) Average collection period of Debtors: D ÷ F_ 365 Where D = Average Debtors balances during the year. S = Credit sales during the year. v) Credit period allowed by Suppliers: C ÷ P_ 365 Where C= Average creditors’ balances during the year. P = credit purchases during the year. vi) Minimum cash balance to be kept daily. Formula: O.C. = M + W + F + D – C Note: It is also known as working capital cycle. Operating cycle is the total time gap between the purchase of raw material and the receipt from Debtors. Importance or Advantages of Adequate Working Capital Working capital is the life blood and nerve centre of a business. Just as circulation of blood is essential in the human body for maintaining life, working capital is very essential to maintain the smooth running of a business. No business can run successfully without an adequate amount of working capital. The main advantages of maintaining adequate amount of working capital are as follows: 1. Solvency of the business: Adequate working capital helps in maintaining solvency of the business by providing uninterrupted flow of production. 2. Goodwill: Sufficient working capital enables a business concern to make prompt payments and hence helps in creating and maintaining goodwill. 3. Easy loans: A concern having adequate working capital, high solvency and good
credit standing can arrange loans from banks and other on easy and favourable terms. 4. Cash Discounts: Adequate working capital also enables a concern to avail cash discounts on the purchases and hence it reduces costs. 5. Regular supply of raw materials: Sufficient working capital ensures regular supply of raw materials and continuous production. 6. Regular payment of salaries, wages and other day-to-day commitments:
A company which has ample working capital can make regular payment of salaries, wages and other day-to-day commitments which raises the morale of its employees, increases their efficiency, reduces wastages and costs and enhances production and profits.
7. Exploitation of favorable market conditions: Only concerns with adequate working capital can exploit favorable market conditions such as purchasing its requirements in bulk when the prices are lower and by holding its inventories for higher prices.
8. Ability to face Crisis: Adequate working capital enables a concern to face business crisis in emergencies such as depression because during such periods, generally, there is much pressure on working capital.
UNIVERSAL STARCH
Institute of Management Research and Development, Shirpur.
9.Quick and Regular return on Investments:return on his investments. Sufficiency of working capital enables a concern to pay quick and regular dividends to its investors as there may not be much pressure toplough back profits. This gains the confidence of its investors and creates a favourablemarket to raise additional funds i.e., the future.
10. High morale: Adequacy of working capital creates an environment of security, confidence, high morale and creates overall efficiency in a business.
Importance or Advanta
Excess or Inadequate Working Capital
from Banks
Efficient
Supply Chain
Management
Regular
Payments of
Salaries &
Wages
NIVERSAL STARCH -CHEM ALLIED LTD. DONDAICHA A PROJECT REPORT
Institute of Management Research and Development, Shirpur.
Quick and Regular return on Investments: Every Investor wants a quick and return on his investments. Sufficiency of working capital enables a concern to pay quick and regular dividends to its investors as there may not be much pressure toplough back profits. This gains the confidence of its investors and creates a favourable
rket to raise additional funds i.e., the future. Adequacy of working capital creates an environment of security,
confidence, high morale and creates overall efficiency in a business.
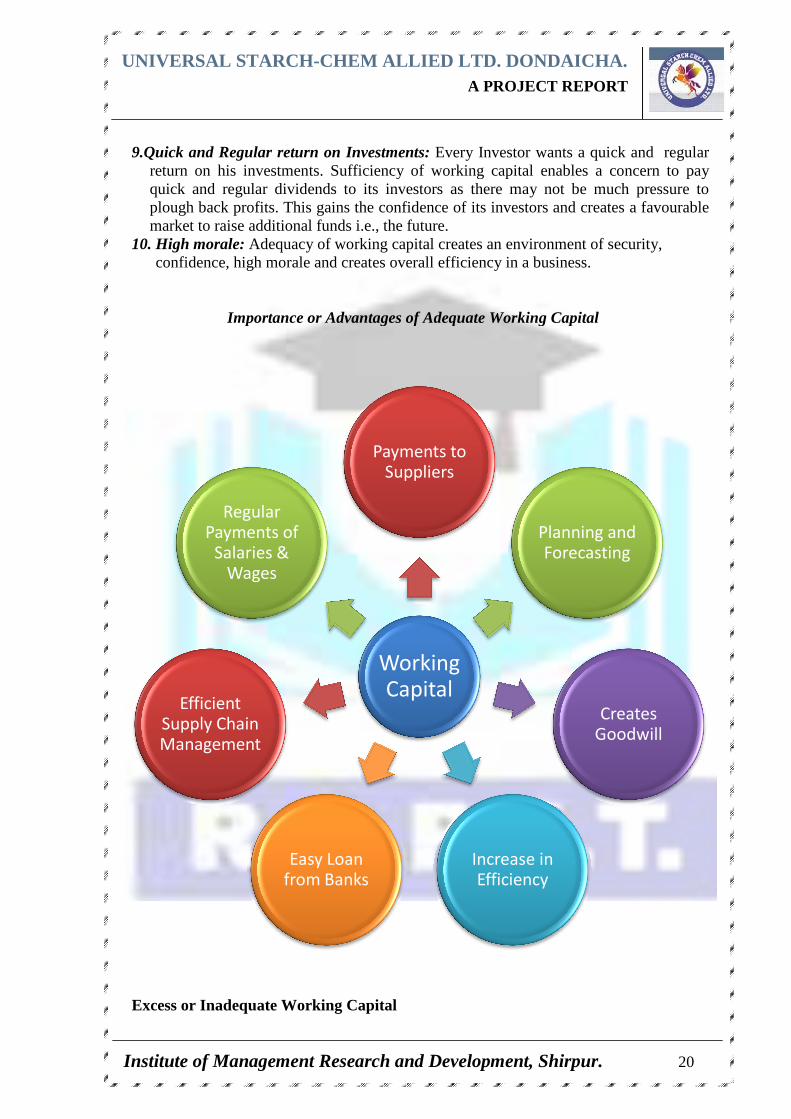
Importance or Advantages of Adequate Working Capital
Excess or Inadequate Working Capital
Working
Capital
Payments to
Suppliers
Planning and
Forecasting
Increase in
Efficiency
Easy Loan
from Banks
Payments of
Salaries &
DONDAICHA . A PROJECT REPORT
Institute of Management Research and Development, Shirpur. 20
Every Investor wants a quick and regular return on his investments. Sufficiency of working capital enables a concern to pay quick and regular dividends to its investors as there may not be much pressure to plough back profits. This gains the confidence of its investors and creates a favourable
Adequacy of working capital creates an environment of security, confidence, high morale and creates overall efficiency in a business.
ges of Adequate Working Capital
Planning and
Forecasting
Creates
Goodwill
UNIVERSAL STARCH-CHEM ALLIED LTD. DONDAICHA. A PROJECT REPORT
Institute of Management Research and Development, Shirpur. 21
Every business concern should have adequate working capital to run its business operations. It should have neither redundant or excess working capital nor inadequate nor shortage of working capital. Both excess as well as short working capital positions are bad for any business. However, out of the two, it is the inadequacy of working capital which is more dangerous from the point of view of the firm. Disadvantages of Redundant or Excessive Working Capital 1. Excessive Working Capital means ideal funds which earn no profits for the business
and hence the business cannot earn a proper rate of return on its investments. 2. When there is a redundant working capital, it may lead to unnecessary purchasing and
accumulation of inventories causing more chances of theft, waste and losses. 3. Excessive working capital implies excessive debtors and defective credit policy
which may cause higher incidence of bad debts. 4. It may result into overall inefficiency in the organization. 5. When there is excessive working capital, relations with banks and other financial
institutions may not be maintained. 6. Due to low rate of return on investments, the value of shares may also fall. 7. The redundant working capital gives rise to speculative transactions. Disadvantages or Dangers of Inadequate Working Capital 1. A concern which has inadequate working capital cannot pay its short-term liabilities
in time. Thus, it will lose its reputation and shall not be able to get good credit facilities.
2. It cannot buy its requirements in bulk and cannot avail of discounts, etc. 3. It becomes difficult for the firm to exploit favourable market conditions and undertake
profitable projects due to lack of working capital. 4. The firm cannot pay day-to-day expenses of its operations and its creates
inefficiencies, increases costs and reduces the profits of the business. 5. It becomes impossible to utilize efficiently the fixed assets due to non-availability of
liquid funds. 6. The rate of return on investments also falls with the shortage of working capital. MANAGEMENT OF WORKING CAPITAL: Working Capital Management involves management of different components of working capital such as cash, inventories, accounts receivable, creditors etc. A brief description follows regarding the various issues involved in the management of each of the above components of working capital. INVENTORY MANAGEMENT: Inventory constitutes an important item in the working capital of many business concerns.Net working capital is the difference between current assets and current liabilities. Inventory is a major item of current assets. The term inventory refers to the stocks of the product of a firm is offering for sale and the components that make up the product Inventory is stores of goods and stocks. This includes raw materials, work-in-process and finished goods. Raw materials consist of those units or input which are used to manufactured goods that require further processing to become finished goods. Finished
UNIVERSAL STARCH-CHEM ALLIED LTD. DONDAICHA. A PROJECT REPORT
Institute of Management Research and Development, Shirpur. 22
goods are products ready for sale. The classification of inventories and the levels of the components vary from organisaion to organisation depending upon the nature of business. For example steel is a finished product for a steel industry, but raw material for an automobile manufacturer. Thus, inventory may be defined as “Stock of goods that is held for future use”. Since inventories constitute about 50 to 60 percent of current assets, the management of inventories is crucial to successful working capital management. Working capital requirements are influenced by inventory holding. Hence, the need for effective and efficient management of inventories. A good inventory management is important to the successful operations of most organisaions, unfortunately the importance of inventory is not always appreciated by top management. This may be due to a failure to recognize the link between inventories and achievement of organizational goals or due to ignorance of the impact that inventories can have on costs and profits. Inventory management refers to an optimum investment in inventories. It should neither be too low to effect the production adversely nor too high to block the funds unnecessarily. Excess investment in inventories is unprofitable for the business. Both excess and inadequate investment in inventories is not desirable. The firm should operate within the two danger points. The purpose of inventory management is to determine and maintain the optimum level of inventory investment. Techniques of Inventory Control The following are the various measures of selective control of inventory: F. Inventory Turnover Ratio i) Inventory Turnover Ratio: __ Cost of goods sold __ average total inventories. The higher the ratio, more the efficiency of the firm ii) Work in process turnover ratio = Cost of goods sold ________ Average inventory of finished goods at costs Here, in this ratio also higher the ratio, more the efficiency of the firm. iii) Weeks inventory finished goods on hand = _________Finished Goods______ Weekly of finished sales goods The ratio reveals that the lower the ratio, the higher the efficiency of the firm iv) Weeks raw material on order = ______Raw material on order_______ Weekly consumption of raw material This ratio indicates that the lower the ratio, the higher the efficiency of the firm. v) Average age of raw material inventory = _Average raw material inventory at cost_ Average daily purchases of raw material This ratio says that the lower the ratio the higher the efficiency of the firm.
vi) Average age of finished goods inventory
UNIVERSAL STARCH
Institute of Management Research and Development, Shirpur.
This ratio comes that the lower
i) Out of stock index =
This ratio indicates the lower the ratio higher the efficiency of the firm.
ii) Spare parts index = Value of This ratio reveals that the higher the ratio the more the efficiency of the firm.
CASH MANAGEMENT :
Cash management is one of the key areas of working capital management. Cash is the most liquid current assets. Cash is the common denominator to which all current assets can be reduced because the other major liquid assets, i.e. receivable and inventory geeventually converted into cash. This underlines the importance of cash management. The term “Cash” with reference to management of cash is used in two ways. In a narrow sense cash refers coins, currency, cheques, drafts and deposits in banks. The broader view of cash includes near cash assets such as marketable securities and time deposits in banks.The reason why these near cash assets are included in cash is that they can readily be converted into cash. Usually, excess cash is invested in marketable securities as it contributes to profitability.of current assets. Every firm should have adequate cash, neither more nor less. Inadequate cash will lead to production interruptions, while excessive cash remains iimpair profitability. Hence, the need for cash management. The cash management assumes significance for the following reasons. Significance: 1. Cash planning - Cash is the most important as well as the least unproductive of all
current assets. Though, it is necessary to meet the firm’s obligations, yet idle cash earns nothing. Therefore, it is essential to have a sound cash planning neither excess nor inadequate.
2. Management of cash flowsSynchronization between cash inflows and cash outflows rarely happens. Sometimes, the cash inflows will be more than outflows because of receipts from debtors, and cash sales in huge amounts. At other times, cash outflows exceed inflows due to payment of taxes, interest and dividends cash management.
3. Maintaining optimum cash balancebalance. The management should also consider the factors determining and influencing the cash balances at various point of time. The cost of excess cash and danger of
NIVERSAL STARCH -CHEM ALLIED LTD. DONDAICHA A PROJECT REPORT
Institute of Management Research and Development, Shirpur.
= __ Average finished goods invetory at cost_____ Average cost of finished goods manufactured per day
This ratio comes that the lower the ratio the higher the efficiency of the firm.
_No. of times out of stock_ No. of items requisitioned This ratio indicates the lower the ratio higher the efficiency of the firm.
Value of spare parts inventory Value of capital equipment
This ratio reveals that the higher the ratio the more the efficiency of the firm.
CASH MANAGEMENT :
Cash management is one of the key areas of working capital management. Cash is the most liquid current assets. Cash is the common denominator to which all current assets can be reduced because the other major liquid
receivable and inventory get eventually converted into cash. This underlines the importance of cash management. The term “Cash” with reference to management of cash is used in two ways. In a narrow sense cash refers coins, currency, cheques, drafts and deposits in
der view of cash includes near cash assets such as marketable securities and time deposits in banks.The reason why these near cash assets are included in cash is that they can readily be converted into cash. Usually, excess cash is invested in marketable ecurities as it contributes to profitability. Cash is one of the most important components
of current assets. Every firm should have adequate cash, neither more nor less. Inadequate cash will lead to production interruptions, while excessive cash remains iimpair profitability. Hence, the need for cash management. The cash management assumes significance for the following reasons.
Cash is the most important as well as the least unproductive of all current assets. Though, it is necessary to meet the firm’s obligations, yet idle cash earns nothing. Therefore, it is essential to have a sound cash planning neither excess
2. Management of cash flows - This is another important aspect of cash management. between cash inflows and cash outflows rarely happens. Sometimes,
the cash inflows will be more than outflows because of receipts from debtors, and cash ales in huge amounts. At other times, cash outflows exceed inflows due to payment of
taxes, interest and dividends etc. Hence, the cash flows should be managed for better
3. Maintaining optimum cash balance - Every firm should maintain optThe management should also consider the factors determining and influencing
the cash balances at various point of time. The cost of excess cash and danger of
DONDAICHA . A PROJECT REPORT
Institute of Management Research and Development, Shirpur. 23
Average finished goods invetory at cost_____ Average cost of finished goods manufactured per day
the ratio the higher the efficiency of the firm.
This ratio indicates the lower the ratio higher the efficiency of the firm.
This ratio reveals that the higher the ratio the more the efficiency of the firm.
Cash management is one of the key areas of working capital management. Cash is the most liquid current assets. Cash is the common denominator to which all current assets
to
time deposits in banks.The reason why these near cash assets are included in cash is that they can readily be converted into cash. Usually, excess cash is invested in marketable
Cash is one of the most important components of current assets. Every firm should have adequate cash, neither more nor less. Inadequate cash will lead to production interruptions, while excessive cash remains idle and will impair profitability. Hence, the need for cash management. The cash management
Cash is the most important as well as the least unproductive of all current assets. Though, it is necessary to meet the firm’s obligations, yet idle cash earns nothing. Therefore, it is essential to have a sound cash planning neither excess
This is another important aspect of cash management. between cash inflows and cash outflows rarely happens. Sometimes,
the cash inflows will be more than outflows because of receipts from debtors, and cash ales in huge amounts. At other times, cash outflows exceed inflows due to payment of
Hence, the cash flows should be managed for better
Every firm should maintain optimum cash The management should also consider the factors determining and influencing
the cash balances at various point of time. The cost of excess cash and danger of
UNIVERSAL STARCH-CHEM ALLIED LTD. DONDAICHA. A PROJECT REPORT
Institute of Management Research and Development, Shirpur. 24
inadequate cash should be matched to determine the optimum level of cash balances. 4. Investment of excess cash - The firm has to invest the excess or idle funds in short
term securities or investments to earn profits as idle funds earn nothing. This is one of the important aspects of management of cash. Thus, the aim of cash management is to maintain adequate cash balances at one hand and to use excess cash in some profitable way on the other hand.
Motives Motives or desires for holding cash refer to various purposes. The purpose may be different from person to person and situation to situation. There are four important motives to hold cash. a. Transactions motive - This motive refers to the holding of cash, to meet routine cash requirements in the ordinary course of business. A firm enters into a number of transactions which requires cash payment. For example, purchase of materials, payment of wages, salaries, taxes, interest etc. Similarly, a firm receives cash from cash sales, collections from debtors, return on investments etc. But the cash inflows and cash outflows do not perfectly synchronize. Sometimes, cash receipts are more than payments while at other times payments exceed receipts. The firm must have to maintain sufficient (funds) cash balance if the payments are more than receipts. Thus, the transactions motive refers to the holding of cash to meet expected obligations whose timing is not perfectly matched with cash receipts. Though, a large portion of cash held for transactions motive is in the form of cash, a part of it may be invested in marketable securities whose maturity conform to the timing of expected payments such as dividends, taxes etc. b. Precautionary motive - Apart from the non-synchronization of expected cash receipts and payments in the ordinary course of business, a firm may be failed to pay cash for unexpected contingencies. For example, strikes, sudden increase in cost of raw materials etc. Cash held to meet these unforeseen situations is known as precautionary cash balance and it provides a caution against them. The amount of cash balance under precautionary motive is influenced by two factors i.e. predictability of cash flows and the availability of short term credit. The more unpredictable the cash flows, the greater the need for such cash balances and vice versa. If the firm can borrow at short-notice, it will need a relatively small balance to meet contingencies and vice versa. Usually precautionary cash balances are invested in marketable securities so that they contribute something to profitability. c. Speculative motive - Sometimes firms would like to hold cash in order to exploit, the profitable opportunities as and when they arise. This motive is called as speculative motive. For example, if the firm expects that the material prices will fall, it can delay the purchases and make purchases in future when price actually declines. Similarly, with the hope of buying securities when the interest rate is expected to decline, the firm will hold cash. By and large, firms rarely hold cash for speculative purposes. d. Compensation motive - This motive to hold cash balances is to compensate banks and other financial institutes for providing certain services and loans. Banks provide a variety of services to business firms like clearance of cheques, drafts, transfer of funds etc. Banks charge a commission or fee for their services to the customers as indirect compensation.
UNIVERSAL STARCH-CHEM ALLIED LTD. DONDAICHA. A PROJECT REPORT
Institute of Management Research and Development, Shirpur. 25
Customers are required to maintain a minimum cash balance at the bank. This balance cannot be used for transaction purposes. Banks can utilise the balances to earn a return to compensate their cost of services to the customers. Such balances are compensating balances. These balances are also required by some loan agreements between a bank and its customers. Banks require a chest to maintain a minimum cash balance in his account to compensate the bank when the supply of credit is restricted and interest rates are rising. Thus cash is required to fulfill the above motives. Out of the four motives of holding cash balances, transaction motive and compensation motives are very important. Business firms usually do not speculate and need not have speculative balances. The requirement of precautionary balances can be met out of short-term borrowings. Objectives The basic objectives of cash management are (i) to make the payments when they become due and (ii) to minimize the cash balances. The task before the cash management is to reconcile
the two conflicting nature of objectives. 1. Meeting the payments schedule - The basic objective of cash management is to meet the payment schedule. In the normal course of business, firms have to make payments of cash to suppliers of raw materials, employees and so on regularly. At the same time firm will be receiving cash on a regular basis from cash sales and debtors. Thus, every firm should have adequate cash to meet the payments schedule. In other words, the firm should be able to meet the obligations when they become due. The firm can enjoy certain advantages associated with maintaining adequate cash. They are: a. Insolvency - The question of insolvency does not arise as the firm will be able to meet
its obligations. b. Good relations - Adequate cash balance in the business firm helps in developing good
relations with creditors and suppliers of raw materials. c. Credit worthiness - The maintenance of adequate cash balances increase the credit
worthiness of the firm. Consequently it will be able to purchase raw materials and procure credit with favorable terms and conditions.
d. Availing discount facilities - The firm can avail the discounts offered by the creditors for payments before the due date.
e. To meet unexpected facilities - The firm can easily meet the unexpected cash expenditure in situations like strikes, competition from customers etc. with little strain. So, every firm should have adequate cash balances for effective cash management.
2. Minimising funds committed to cash balances - The second important objective of cash management is to minimise cash balance. In minimizing the cash balances two conflicting aspects have to be reconciled. A high level of cash balances will ensure prompt payment together with all advantages, but at the same time, cash is a non-earning asset and the larger balances of cash impair profitability. On the other hand, a low level of cash balance may lead to the inability of the firm to meet the payment schedule. Thus the objective of cash management would be to have an optimum cash balance. Factors determining cash needs - Maintenance of optimum level of cash is the main problem of cash management. The level of cash holding differs from industry to industry,
UNIVERSAL STARCH-CHEM ALLIED LTD. DONDAICHA. A PROJECT REPORT
Institute of Management Research and Development, Shirpur. 26
organization to organisation. The factors determining the cash needs of the industry is explained as follows: i. Matching of cash flows - The first and very important factor determining the level of
cash requirement is matching cash inflows with cash outflows. If the receipts and payments are perfectly coincide or balance each other, there would be no need for cash balances. The need for cash management therefore, due to the non-synchronization of cash receipts and disbursements. For this purpose, the cash inflows and outflows have to be forecast over a period of time say 12 months with the help of cash budget. The cash budget will pin point the months when the firm will have an excess or shortage of cash.
ii. Short costs - Short costs are defined as the expenses incurred as a result of shortfall of cash such as unexpected or expected shortage of cash balances to meet the requirements. The short costs includes, transaction costs associated with raising cash to overcome the shortage, borrowing costs associated with borrowing to cover the shortage i.e. interest on loan, loss of trade-discount, penalty rates by banks to meet a shortfall in compensating, cash balances and costs associated with deterioration of the firm’s credit rating etc. which is reflected in higher bank charges on loans, decline in sales and profits.
iii. Cost of cash on excess balances - One of the important factors determining the cash needs is the cost of maintaining cash balances i.e. excess or idle cash balances. The cost of maintaining excess cash balance is called excess cash balance cost. If large funds are idle, the implication is that the firm has missed opportunities to invest and thereby lost interest. This is known as excess cost. Hence the cash management is necessary to maintain an optimum balance of cash.
iv. Uncertainty in business - Uncertainty plays a key role in cash management, because cash flows cannot be predicted with complete accuracy. The first requirement of cash management is a precautionary cushion to cope with irregularities in cash flows, unexpected delays in collections and disbursements, defaults and expected cash needs the uncertainty can be overcome through accurate forecasting of tax payments, dividends, capital expenditure etc. and ability of the firm to borrow funds through over draft facility.
v. Cost of procurement and management of cash - The costs associated with establishing and operating cash management staff and activities determining the cash needs of a business firm. These costs are generally fixed and are accounted for by salary, storage and handling of securities etc. The above factors are considered to determine the cash needs of a business firm.
UNIVERSAL STARCH-CHEM ALLIED LTD. DONDAICHA. A PROJECT REPORT
Institute of Management Research and Development, Shirpur. 27
UNIVERSAL STARCH-CHEM ALLIED LTD. DONDAICHA. A PROJECT REPORT
Institute of Management Research and Development, Shirpur. 28
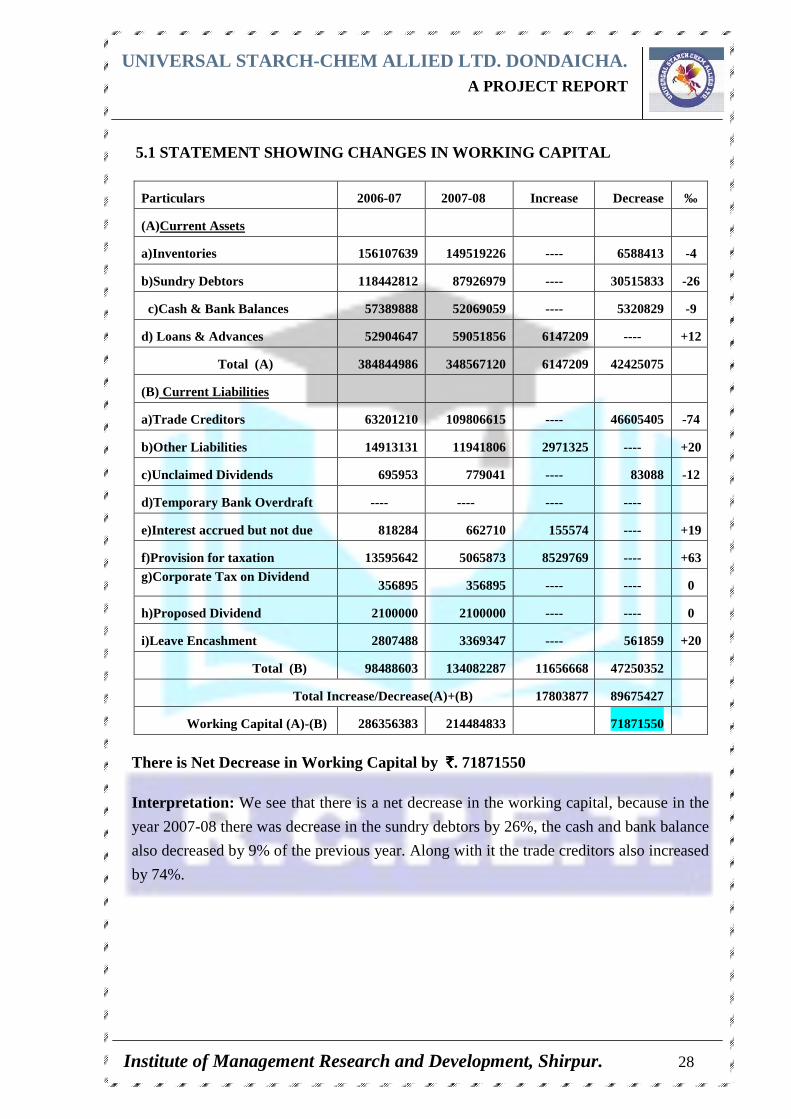
5.1 STATEMENT SHOWING CHANGES IN WORKING CAPITA L
There is Net Decrease in Working Capital by ̀̀̀̀. 71871550
Interpretation: We see that there is a net decrease in the working capital, because in the
year 2007-08 there was decrease in the sundry debtors by 26%, the cash and bank balance
also decreased by 9% of the previous year. Along with it the trade creditors also increased
by 74%.
Particulars 2006-07 2007-08 Increase Decrease ‰
(A)Current Assets
a)Inventories 156107639 149519226 ---- 6588413 -4
b)Sundry Debtors 118442812 87926979 ---- 30515833 -26
c)Cash & Bank Balances 57389888 52069059 ---- 5320829 -9
d) Loans & Advances 52904647 59051856 6147209 ---- +12
Total (A) 384844986 348567120 6147209 42425075
(B) Current Liabilities
a)Trade Creditors 63201210 109806615 ---- 46605405 -74
b)Other Liabilities 14913131 11941806 2971325 ---- +20
c)Unclaimed Dividends 695953 779041 ---- 83088 -12
d)Temporary Bank Overdraft ---- ---- ---- ----
e)Interest accrued but not due 818284 662710 155574 ---- +19
f)Provision for taxation 13595642 5065873 8529769 ---- +63 g)Corporate Tax on Dividend
356895 356895 ---- ---- 0
h)Proposed Dividend 2100000 2100000 ---- ---- 0
i)Leave Encashment 2807488 3369347 ---- 561859 +20
Total (B) 98488603 134082287 11656668 47250352
Total Increase/Decrease(A)+(B) 17803877 89675427
Working Capital (A)-(B) 286356383 214484833 71871550
UNIVERSAL STARCH-CHEM ALLIED LTD. DONDAICHA. A PROJECT REPORT
Institute of Management Research and Development, Shirpur. 29
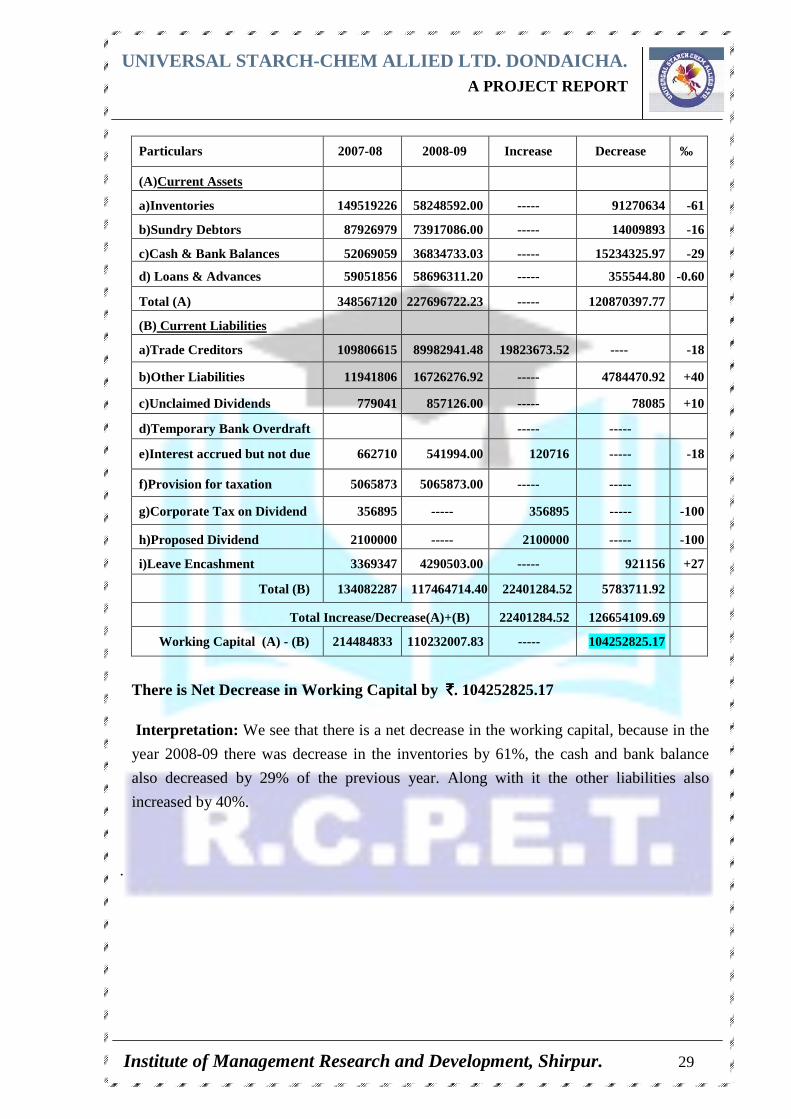
There is Net Decrease in Working Capital by ̀̀̀̀. 104252825.17
Interpretation: We see that there is a net decrease in the working capital, because in the
year 2008-09 there was decrease in the inventories by 61%, the cash and bank balance
also decreased by 29% of the previous year. Along with it the other liabilities also
increased by 40%.
.
Particulars 2007-08 2008-09 Increase Decrease ‰
(A)Current Assets
a)Inventories 149519226 58248592.00 ----- 91270634 -61
b)Sundry Debtors 87926979 73917086.00 ----- 14009893 -16
c)Cash & Bank Balances 52069059 36834733.03 ----- 15234325.97 -29
d) Loans & Advances 59051856 58696311.20 ----- 355544.80 -0.60
Total (A) 348567120 227696722.23 ----- 120870397.77
(B) Current Liabilities
a)Trade Creditors 109806615 89982941.48 19823673.52 ---- -18
b)Other Liabilities 11941806 16726276.92 ----- 4784470.92 +40
c)Unclaimed Dividends 779041 857126.00 ----- 78085 +10
d)Temporary Bank Overdraft ----- -----
e)Interest accrued but not due 662710 541994.00 120716 ----- -18
f)Provision for taxation 5065873 5065873.00 ----- -----
g)Corporate Tax on Dividend 356895 ----- 356895 ----- -100
h)Proposed Dividend 2100000 ----- 2100000 ----- -100
i)Leave Encashment 3369347 4290503.00 ----- 921156 +27
Total (B) 134082287 117464714.40 22401284.52 5783711.92
Total Increase/Decrease(A)+(B) 22401284.52 126654109.69
Working Capital (A) - (B) 214484833 110232007.83 ----- 104252825.17
UNIVERSAL STARCH-CHEM ALLIED LTD. DONDAICHA. A PROJECT REPORT
Institute of Management Research and Development, Shirpur. 30
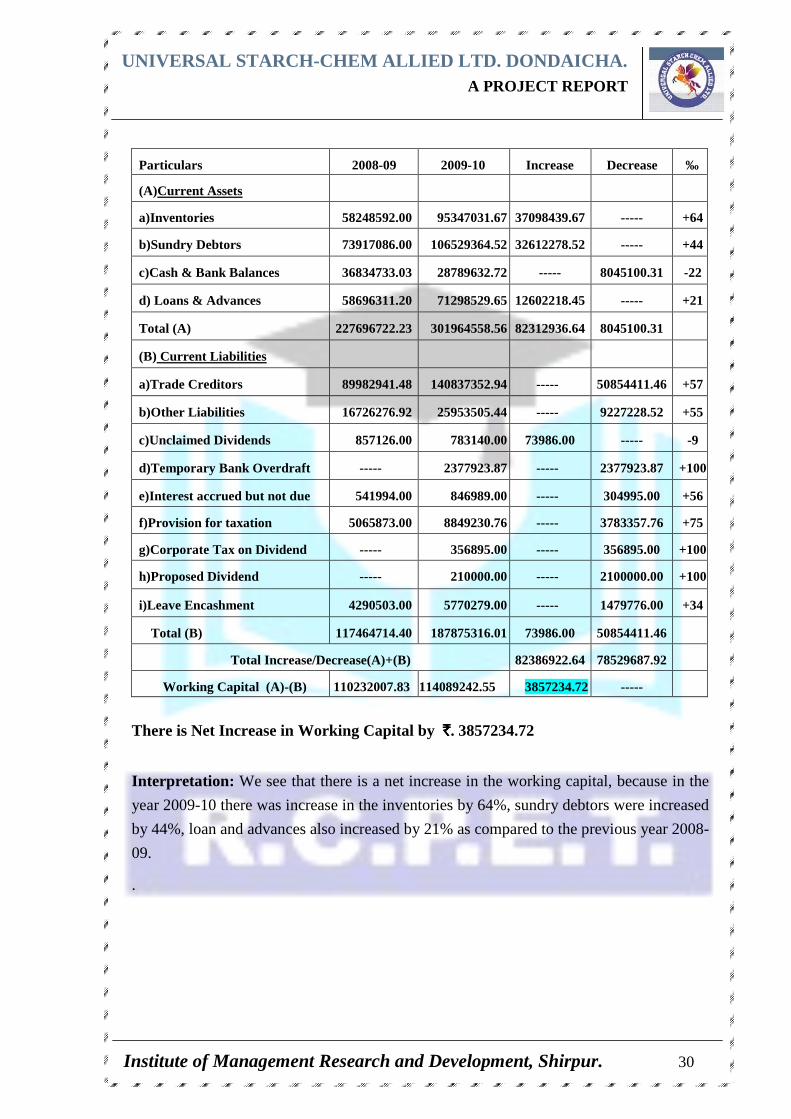
There is Net Increase in Working Capital by ̀̀̀̀ . 3857234.72
Interpretation: We see that there is a net increase in the working capital, because in the
year 2009-10 there was increase in the inventories by 64%, sundry debtors were increased
by 44%, loan and advances also increased by 21% as compared to the previous year 2008-
09.
.
Particulars 2008-09 2009-10 Increase Decrease ‰
(A)Current Assets
a)Inventories 58248592.00 95347031.67 37098439.67 ----- +64
b)Sundry Debtors 73917086.00 106529364.52 32612278.52 ----- +44
c)Cash & Bank Balances 36834733.03 28789632.72 ----- 8045100.31 -22
d) Loans & Advances 58696311.20 71298529.65 12602218.45 ----- +21
Total (A) 227696722.23 301964558.56 82312936.64 8045100.31
(B) Current Liabilities
a)Trade Creditors 89982941.48 140837352.94 ----- 50854411.46 +57
b)Other Liabilities 16726276.92 25953505.44 ----- 9227228.52 +55
c)Unclaimed Dividends 857126.00 783140.00 73986.00 ----- -9
d)Temporary Bank Overdraft ----- 2377923.87 ----- 2377923.87 +100
e)Interest accrued but not due 541994.00 846989.00 ----- 304995.00 +56
f)Provision for taxation 5065873.00 8849230.76 ----- 3783357.76 +75
g)Corporate Tax on Dividend ----- 356895.00 ----- 356895.00 +100
h)Proposed Dividend ----- 210000.00 ----- 2100000.00 +100
i)Leave Encashment 4290503.00 5770279.00 ----- 1479776.00 +34
Total (B) 117464714.40 187875316.01 73986.00 50854411.46
Total Increase/Decrease(A)+(B) 82386922.64 78529687.92
Working Capital (A)-(B) 110232007.83 114089242.55 3857234.72 -----
UNIVERSAL STARCH
Institute of Management Research and Development, Shirpur.
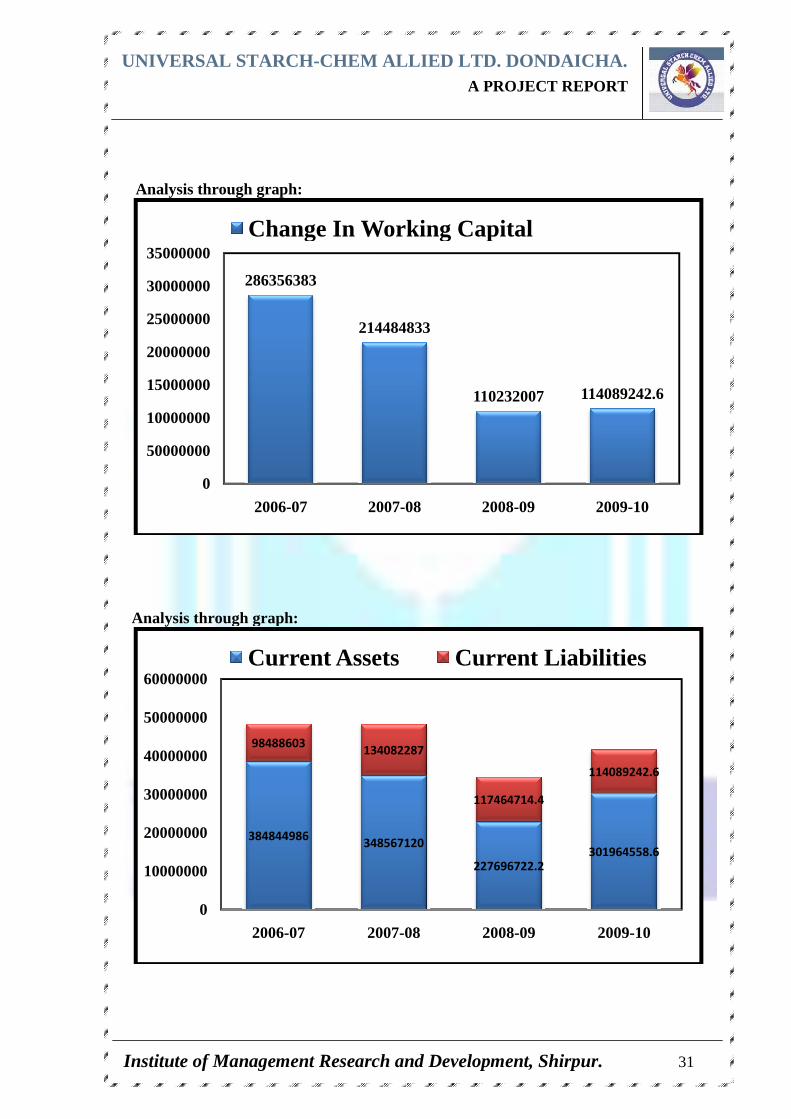
Analysis through graph
Analysis through graph:
286356383
0
50000000
10000000
15000000
20000000
25000000
30000000
35000000
2006
Change In Working Capital
384844986
98488603
0
10000000
20000000
30000000
40000000
50000000
60000000
2006-
Current Assets
NIVERSAL STARCH -CHEM ALLIED LTD. DONDAICHA A PROJECT REPORT
Institute of Management Research and Development, Shirpur.
graph:
through graph:
286356383
214484833
110232007
-07 2007-08 2008-09
Change In Working Capital
384844986348567120
227696722.2
98488603134082287
117464714.4
-07 2007-08 2008-09
Current Assets Current Liabilities
DONDAICHA . A PROJECT REPORT
Institute of Management Research and Development, Shirpur. 31
114089242.6
2009-10
301964558.6
114089242.6
2009-10
Current Liabilities
UNIVERSAL STARCH-CHEM ALLIED LTD. DONDAICHA. A PROJECT REPORT
Institute of Management Research and Development, Shirpur. 32
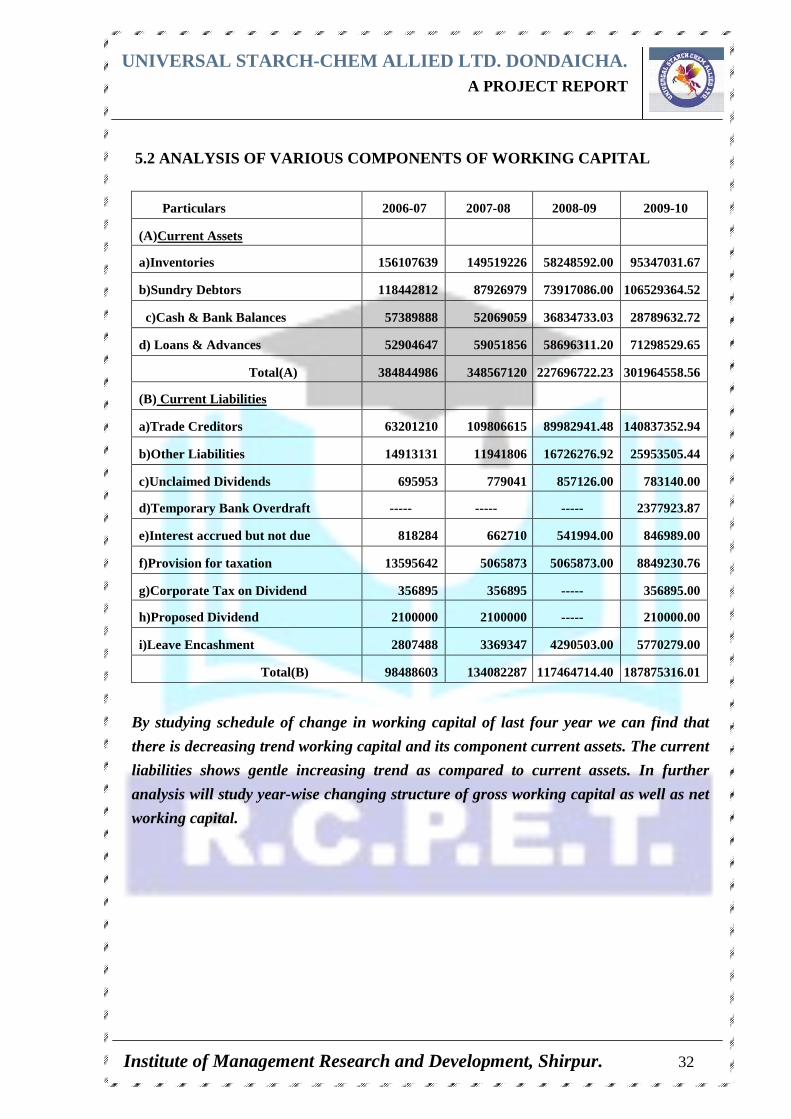
5.2 ANALYSIS OF VARIOUS COMPONENTS OF WORKING CAPIT AL
Particulars 2006-07 2007-08 2008-09 2009-10
(A)Current Assets
a)Inventories 156107639 149519226 58248592.00 95347031.67
b)Sundry Debtors 118442812 87926979 73917086.00 106529364.52
c)Cash & Bank Balances 57389888 52069059 36834733.03 28789632.72
d) Loans & Advances 52904647 59051856 58696311.20 71298529.65
Total(A) 384844986 348567120 227696722.23 301964558.56
(B) Current Liabilities
a)Trade Creditors 63201210 109806615 89982941.48 140837352.94
b)Other Liabilities 14913131 11941806 16726276.92 25953505.44
c)Unclaimed Dividends 695953 779041 857126.00 783140.00
d)Temporary Bank Overdraft ----- ----- ----- 2377923.87
e)Interest accrued but not due 818284 662710 541994.00 846989.00
f)Provision for taxation 13595642 5065873 5065873.00 8849230.76
g)Corporate Tax on Dividend 356895 356895 ----- 356895.00
h)Proposed Dividend 2100000 2100000 ----- 210000.00
i)Leave Encashment 2807488 3369347 4290503.00 5770279.00
Total(B) 98488603 134082287 117464714.40 187875316.01
By studying schedule of change in working capital of last four year we can find that
there is decreasing trend working capital and its component current assets. The current
liabilities shows gentle increasing trend as compared to current assets. In further
analysis will study year-wise changing structure of gross working capital as well as net
working capital.
UNIVERSAL STARCH
Institute of Management Research and Development, Shirpur.
Current Liabilities98488603
20%
2006
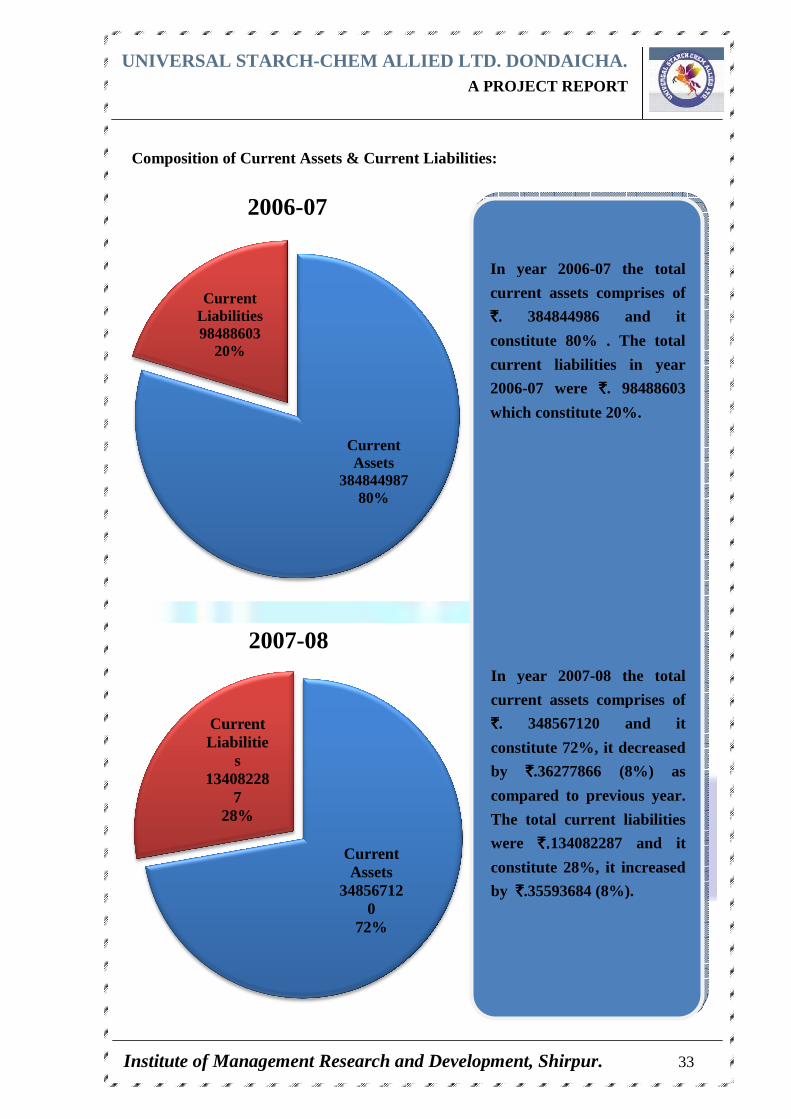
Composition of Current Assets & Current Liabilities
Current Liabilitie
s13408228
728%
2007
NIVERSAL STARCH -CHEM ALLIED LTD. DONDAICHA A PROJECT REPORT
Institute of Management Research and Development, Shirpur.
Current Assets
38484498780%
2006-07
Composition of Current Assets & Current Liabilities:
Current Assets
348567120
72%
2007-08
In year 2006
current assets comprises of
`̀̀̀. 384844986 and it
constitute 80% . The total
current liabilities in year
2006-07 were
which constitute 20%.
In year 2007
current assets comprises of
`̀̀̀. 348567120 and it
constitute 72%, it decreased
by `̀̀̀.36277866 (8%) as
compared to previous year.
The total current liabilities
were `.`.`.`.134082287 and it
constitute 28%, it increased
by ̀̀̀̀ .35593684 (8%).
DONDAICHA . A PROJECT REPORT
Institute of Management Research and Development, Shirpur. 33
In year 2006-07 the total
current assets comprises of
. 384844986 and it
constitute 80% . The total
current liabilities in year
07 were `̀̀̀. 98488603
which constitute 20%.
In year 2007-08 the total
current assets comprises of
. 348567120 and it
constitute 72%, it decreased
.36277866 (8%) as
compared to previous year.
The total current liabilities
134082287 and it
constitute 28%, it increased
.35593684 (8%).
UNIVERSAL STARCH
Institute of Management Research and Development, Shirpur.
Current Liabilities18787531
6.0138%
2009
Current Liabilities117464714
.434%
2008
NIVERSAL STARCH -CHEM ALLIED LTD. DONDAICHA A PROJECT REPORT
Institute of Management Research and Development, Shirpur.
Current Assets
301964558.6562%
2009-10
Current Assets
227696722.2
66%
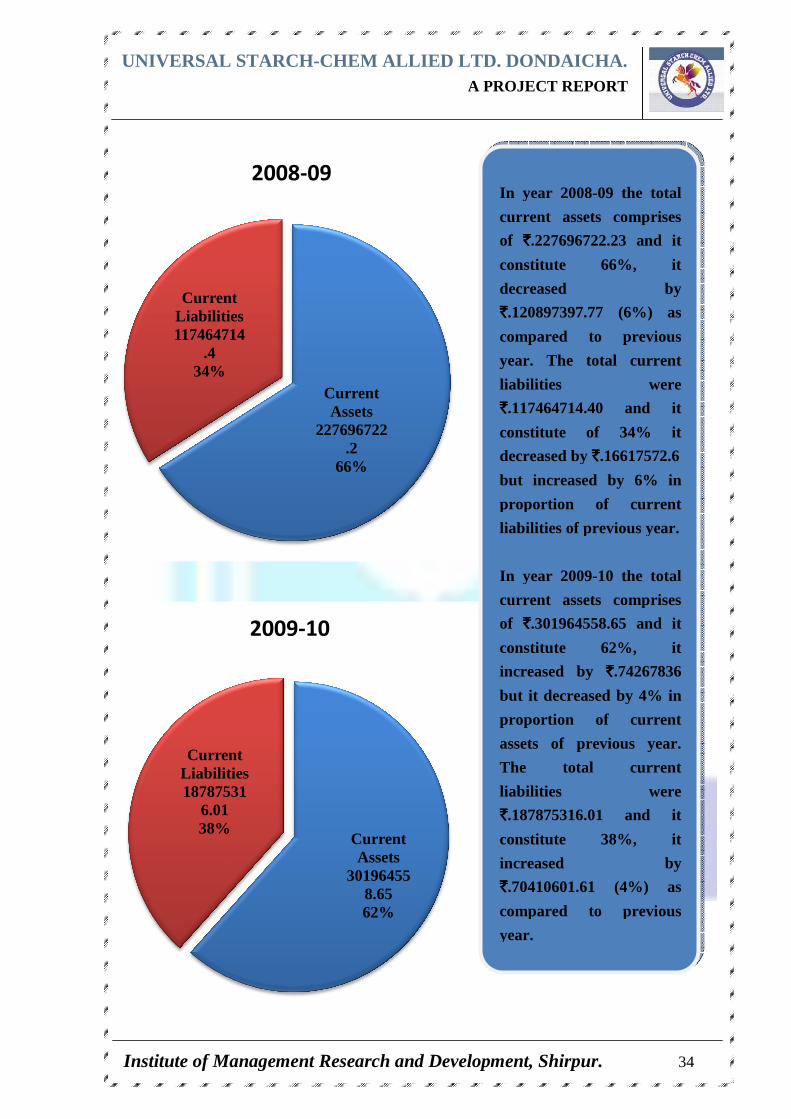
2008-09In year 2008
current assets comprises
of `̀̀̀.227696722.23 and it
constitute 66%, it
decreased by
`̀̀̀.120897397.77 (6%) as
compared to previous
year. The total current
liabilities were
`̀̀̀.117464714.40 and it
constitute of 34% it
decreased by
but increased by 6% in
proportion of current
liabilities of previous year.
In year 2009
current assets comprises
of `̀̀̀.301964558.65 and it
constitute 62%, it
increased by
but it decreased by 4% in
proportion of current
assets of previous year.
The total current
liabilities were
`̀̀̀.187875316.01 and it
constitute 38%, it
increased by
`̀̀̀.70410601.61 (4%) as
compared to previous
year.
DONDAICHA . A PROJECT REPORT
Institute of Management Research and Development, Shirpur. 34
In year 2008-09 the total
current assets comprises
.227696722.23 and it
constitute 66%, it
decreased by
.120897397.77 (6%) as
compared to previous
year. The total current
liabilities were
.117464714.40 and it
constitute of 34% it
decreased by ̀̀̀̀.16617572.6
but increased by 6% in
proportion of current
liabilities of previous year.
In year 2009-10 the total
current assets comprises
.301964558.65 and it
constitute 62%, it
increased by `̀̀̀.74267836
but it decreased by 4% in
proportion of current
assets of previous year.
The total current
liabilities were
.187875316.01 and it
ute 38%, it
increased by
.70410601.61 (4%) as
compared to previous
UNIVERSAL STARCH
Institute of Management Research and Development, Shirpur.
Sundry Debtors
25%
Cash & Bank
Balances15%
Loans & Advances
17%
2007
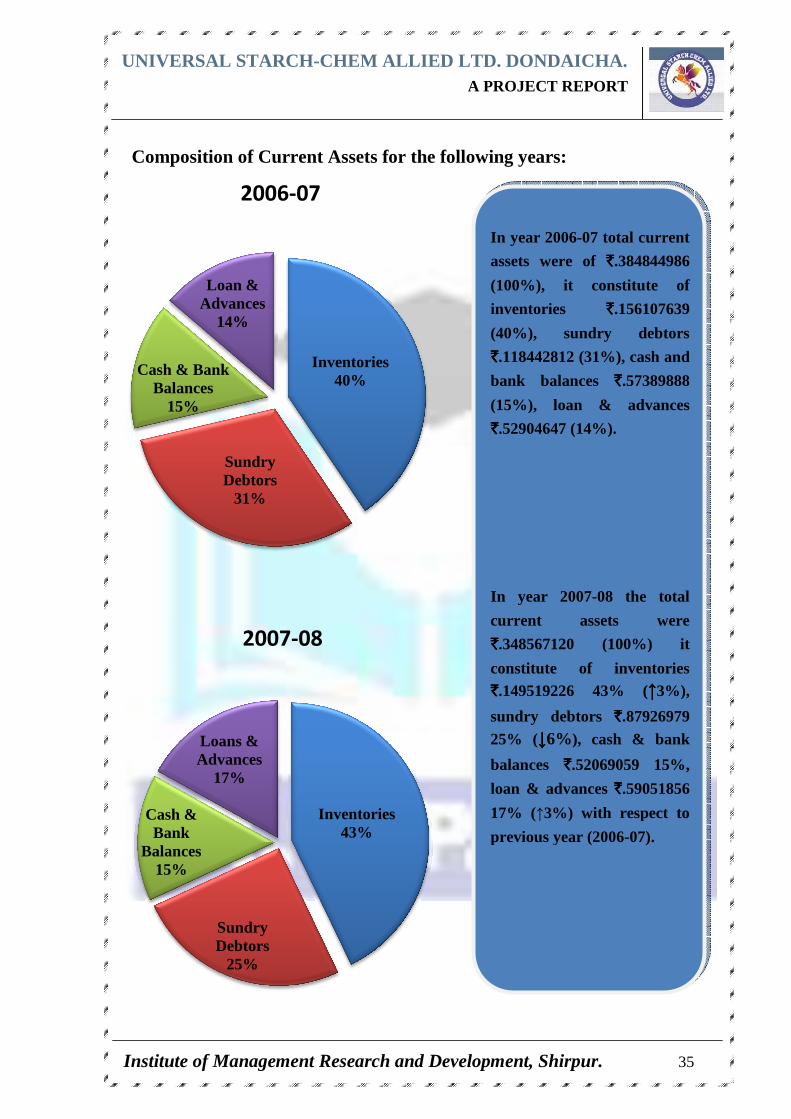
Composition of Current Assets for the following years:
Sundry Debtors
31%
Cash & Bank Balances
15%
Loan & Advances
14%
2006
NIVERSAL STARCH -CHEM ALLIED LTD. DONDAICHA A PROJECT REPORT
Institute of Management Research and Development, Shirpur.
Inventories43%
2007-08
Composition of Current Assets for the following years:
Inventories40%
2006-07
In year 2006
assets were of
(100%), it constitute of
inventories
(40%), sundry debtors
`̀̀̀.118442812 (31%), cash and
bank balances
(15%), loan & advances
`̀̀̀.52904647 (14%).
In year 2007
current assets were
`̀̀̀.348567120 (100%) it
constitute of inventories `̀̀̀.149519226 43% (
sundry debtors 25% (↓↓↓↓6%), cash & bank
balances `̀̀̀.52069059 15%,
loan & advances
17% (↑3%) with respect to
previous year (2006
DONDAICHA . A PROJECT REPORT
Institute of Management Research and Development, Shirpur. 35
In year 2006-07 total current
assets were of ̀̀̀̀ .384844986
(100%), it constitute of
inventories `̀̀̀.156107639
(40%), sundry debtors
.118442812 (31%), cash and
bank balances `̀̀̀.57389888
(15%), loan & advances
.52904647 (14%).
In year 2007-08 the total
current assets were
.348567120 (100%) it
constitute of inventories .149519226 43% (↑↑↑↑3%),
sundry debtors `̀̀̀.87926979 ), cash & bank
.52069059 15%,
& advances ̀̀̀̀ .59051856
3%) with respect to
previous year (2006-07).
UNIVERSAL STARCH
Institute of Management Research and Development, Shirpur.
Sundry Debtors
Cash & Bank Balance
9%
Loans & Advances
24%
2009
Cash & Bank Balance
16%
Loans & Advances
26%
2008
NIVERSAL STARCH -CHEM ALLIED LTD. DONDAICHA A PROJECT REPORT
Institute of Management Research and Development, Shirpur.
Inventories32%
Sundry Debtors
35%
2009-10
Inventories26%
Sundry Debtors
32%
2008-09
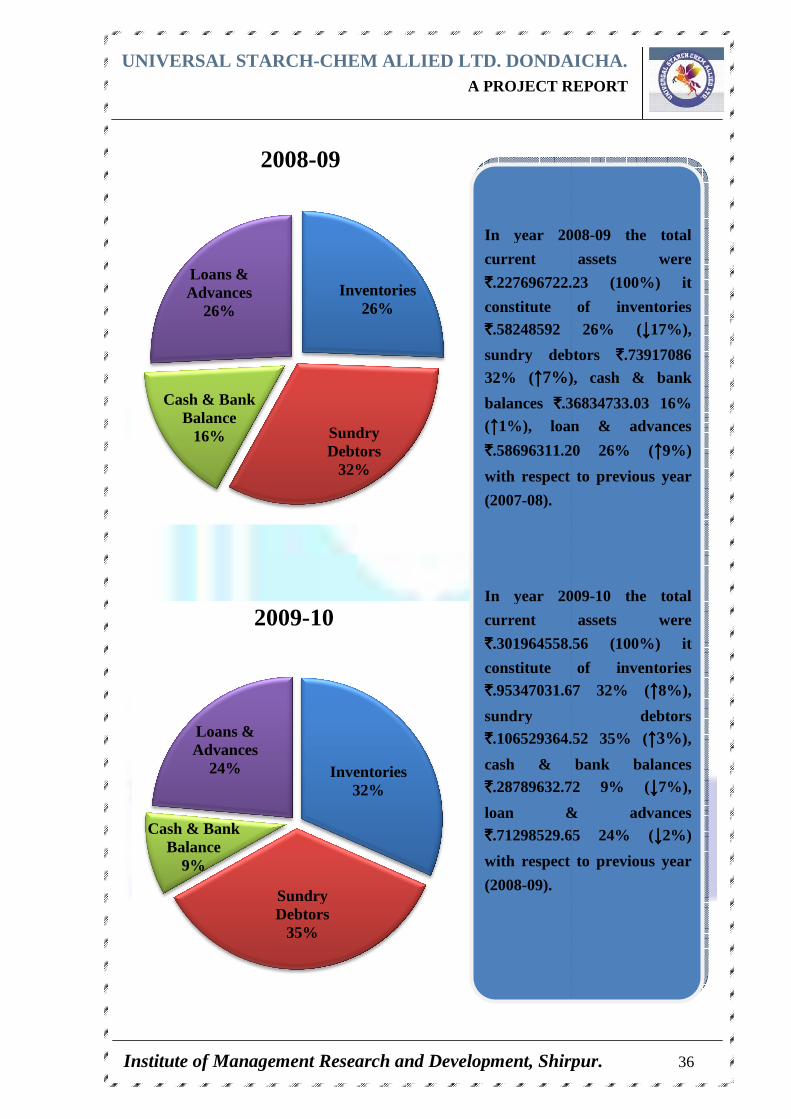
In year 2008
current assets were
`̀̀̀.227696722.23 (100%) it
constitute of inventories `̀̀̀.58248592 26% (
sundry debtors 32% (↑↑↑↑7%), cash & bank
balances `̀̀̀.36834733.03 16% (↑↑↑↑1%), loan & advances
`̀̀̀.58696311.20 26% (
with respect to previous year
(2007-08).
In year 2009
current assets were
`̀̀̀.301964558.56 (100%) it
constitute o`̀̀̀.95347031.67 32% (
sundry debtors `̀̀̀.106529364.52 35% (
cash & bank balances `̀̀̀.28789632.72 9% (
loan & advances `̀̀̀.71298529.65 24% (
with respect to previous year
(2008-09).
DONDAICHA . A PROJECT REPORT
Institute of Management Research and Development, Shirpur. 36
In year 2008-09 the total
current assets were
.227696722.23 (100%) it
constitute of inventories .58248592 26% (↓↓↓↓17%),
sundry debtors `̀̀̀.73917086 ), cash & bank
.36834733.03 16% 1%), loan & advances
.58696311.20 26% (↑↑↑↑9%)
with respect to previous year
In year 2009-10 the total
current assets were
.301964558.56 (100%) it
constitute of inventories .95347031.67 32% (↑↑↑↑8%),
sundry debtors .106529364.52 35% (↑↑↑↑3%),
cash & bank balances .28789632.72 9% (↓↓↓↓7%),
loan & advances .71298529.65 24% (↓↓↓↓2%)
with respect to previous year
UNIVERSAL STARCH
Institute of Management Research and Development, Shirpur.
Composition of Current Liabilities
Provisions19%
2006
Provisions8%
2007-
NIVERSAL STARCH -CHEM ALLIED LTD. DONDAICHA A PROJECT REPORT
Institute of Management Research and Development, Shirpur.
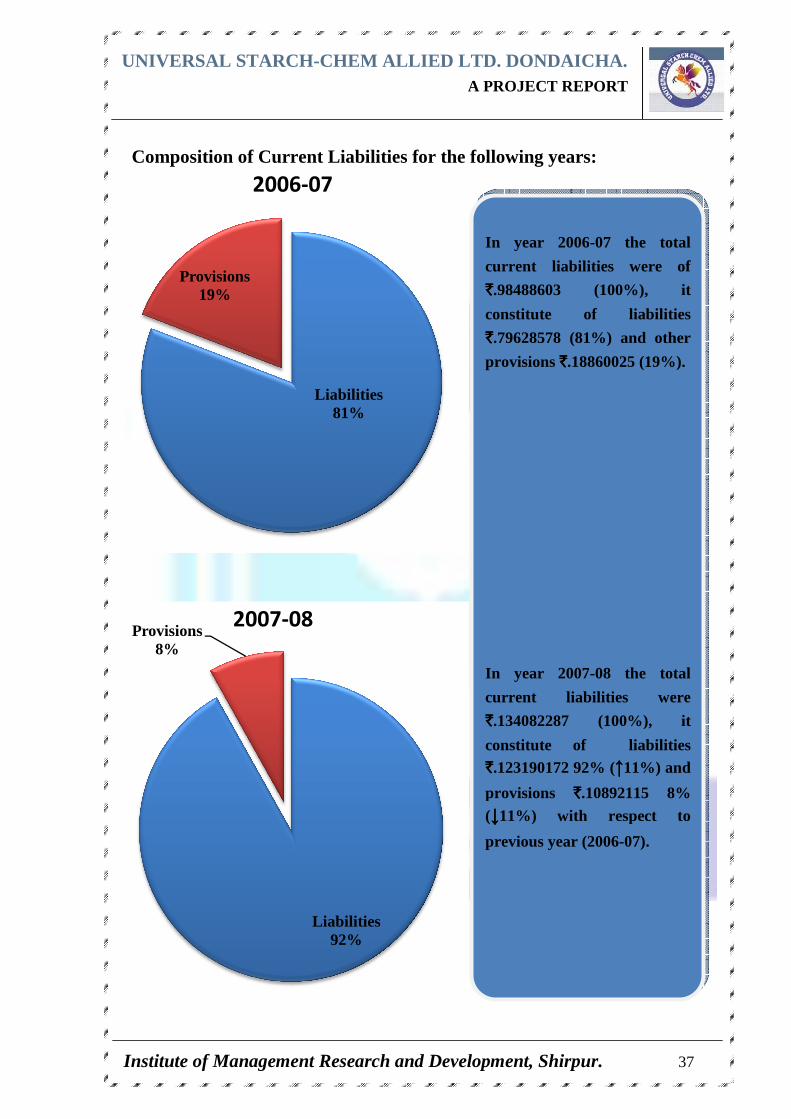
Composition of Current Liabilities for the following years:
Liabilities81%
2006-07
Liabilities92%
-08
In year 2006
current liabilities were of
`̀̀̀.98488603 (100%), it
constitute of liabilities
`̀̀̀.79628578 (81%) and other
provisions ̀̀̀̀ .18860025 (19%).
In year 2007
current liabilities were
`̀̀̀.134082287 (100%), it
constitute of liabilities `̀̀̀.123190172 92% (
provisions (↓↓↓↓11%) with respect to
previous year (2006
DONDAICHA . A PROJECT REPORT
Institute of Management Research and Development, Shirpur. 37
for the following years:
In year 2006-07 the total
current liabilities were of
.98488603 (100%), it
constitute of liabilities
.79628578 (81%) and other
.18860025 (19%).
In year 2007-08 the total
current liabilities were
82287 (100%), it
constitute of liabilities .123190172 92% (↑↑↑↑11%) and
provisions `̀̀̀.10892115 8% 11%) with respect to
previous year (2006-07).
UNIVERSAL STARCH
Institute of Management Research and Development, Shirpur.
Provisions4%
2008
Provisions9%
2009
NIVERSAL STARCH -CHEM ALLIED LTD. DONDAICHA A PROJECT REPORT
Institute of Management Research and Development, Shirpur.
Liabilities96%
2008-09
Liabilities91%
2009-10
In year 2008
current liabilities were
`̀̀̀.117464714.40 (100%), it
constitute of liabilities `̀̀̀.108108338.40 96% (
and provisions 4% (↓↓↓↓4%) with respect to
previous year (2007
In year 2009
current liabilities were
`̀̀̀.187875316.01 (100%), it
constitute of liabilities `̀̀̀.170798911.25 91% (
and provisions 9% (↑↑↑↑5%) with respect to
previous year (2007
DONDAICHA . A PROJECT REPORT
Institute of Management Research and Development, Shirpur. 38
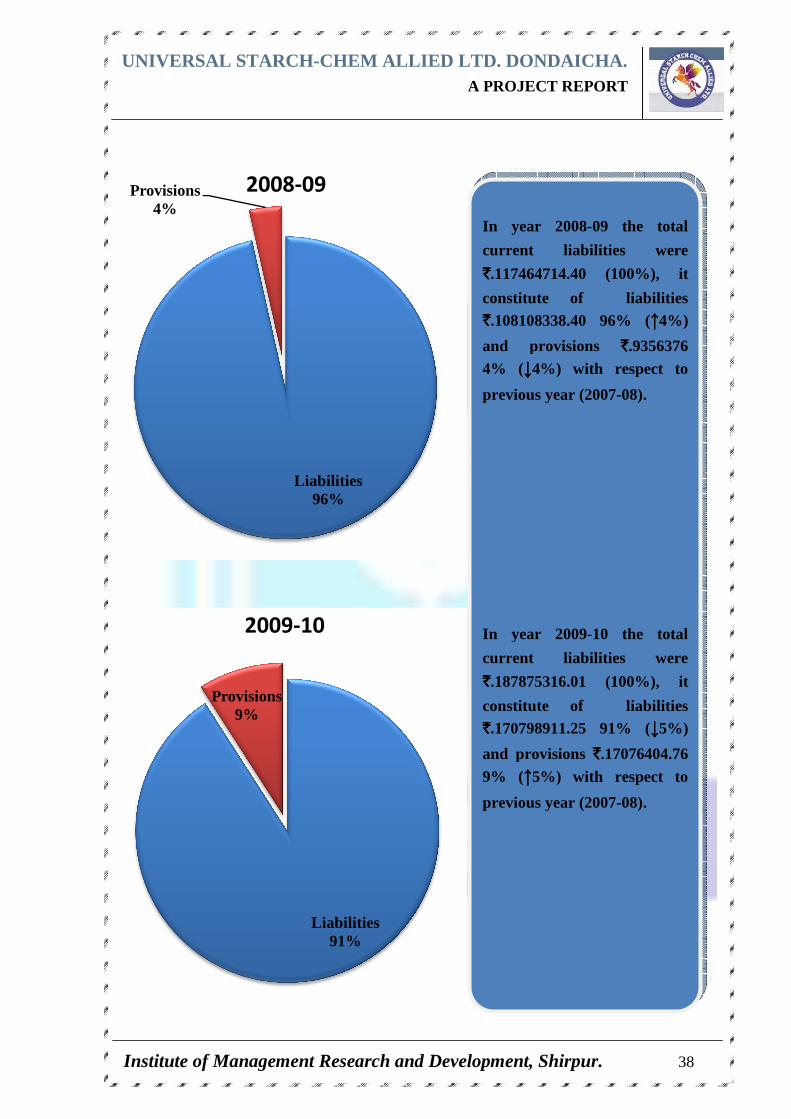
In year 2008-09 the total
current liabilities were
.117464714.40 (100%), it
constitute of liabilities .108108338.40 96% (↑↑↑↑4%)
and provisions `̀̀̀.9356376 4%) with respect to
previous year (2007-08).
In year 2009-10 the total
current liabilities were
.187875316.01 (100%), it
titute of liabilities .170798911.25 91% (↓↓↓↓5%)
and provisions `̀̀̀.17076404.76 5%) with respect to
previous year (2007-08).
UNIVERSAL STARCH
Institute of Management Research and Development, Shirpur.
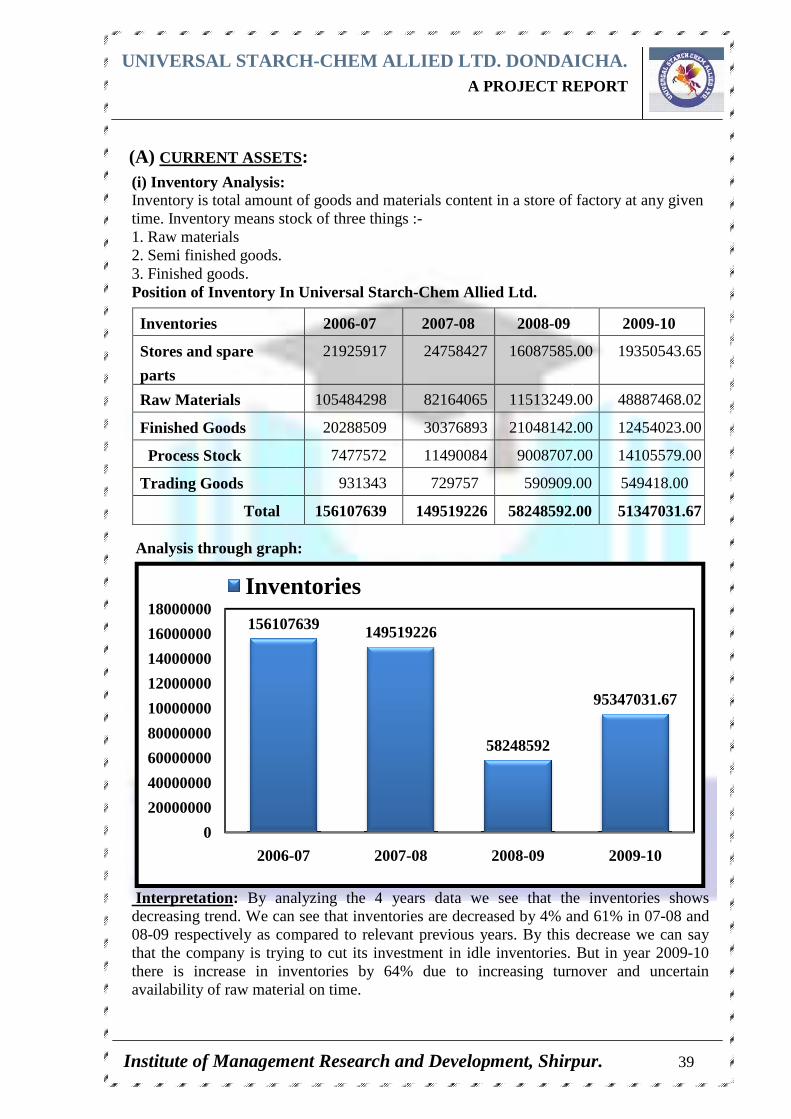
(A) CURRENT ASSETS
(i) Inventory Analysis: Inventory is total amount of goods and materials content in a store of factory at any given time. Inventory means stock of three things :1. Raw materials 2. Semi finished goods. 3. Finished goods. Position of Inventory In Universal Starch
Analysis through graph
Interpretation : By analyzing the 4decreasing trend. We ca08-09 respectively as compared to relevant previous yearthat the company is tryingthere is increase in inventories byavailability of raw material on time.
Inventories
Stores and spare
parts
Raw Materials
Finished Goods
Process Stock
Trading Goods
Total
156107639
0
20000000
40000000
60000000
80000000
10000000
12000000
14000000
16000000
18000000
2006
Inventories
NIVERSAL STARCH -CHEM ALLIED LTD. DONDAICHA A PROJECT REPORT
Institute of Management Research and Development, Shirpur.
CURRENT ASSETS:
Inventory is total amount of goods and materials content in a store of factory at any given Inventory means stock of three things :-
Position of Inventory In Universal Starch-Chem Allied Ltd.
Analysis through graph:
By analyzing the 4 years data we see that the inventories shows We can see that inventories are decreased by 4% and
respectively as compared to relevant previous years. By this decreasetrying to cut its investment in idle inventories. But in year 2009
there is increase in inventories by 64% due to increasing turnover and uncertain availability of raw material on time.
2006-07 2007-08 2008-09
21925917 24758427 16087585.00
105484298 82164065 11513249.00
20288509 30376893 21048142.00
7477572 11490084 9008707.00
931343 729757 590909.00
156107639 149519226 58248592.00
156107639 149519226
58248592
2006-07 2007-08 2008-09
Inventories
DONDAICHA . A PROJECT REPORT
Institute of Management Research and Development, Shirpur. 39
Inventory is total amount of goods and materials content in a store of factory at any given
we see that the inventories shows % and 61% in 07-08 and
. By this decrease we can say cut its investment in idle inventories. But in year 2009-10
due to increasing turnover and uncertain
2009-10
16087585.00 19350543.65
11513249.00 48887468.02
21048142.00 12454023.00
9008707.00 14105579.00
590909.00 549418.00
58248592.00 51347031.67
95347031.67
2009-10
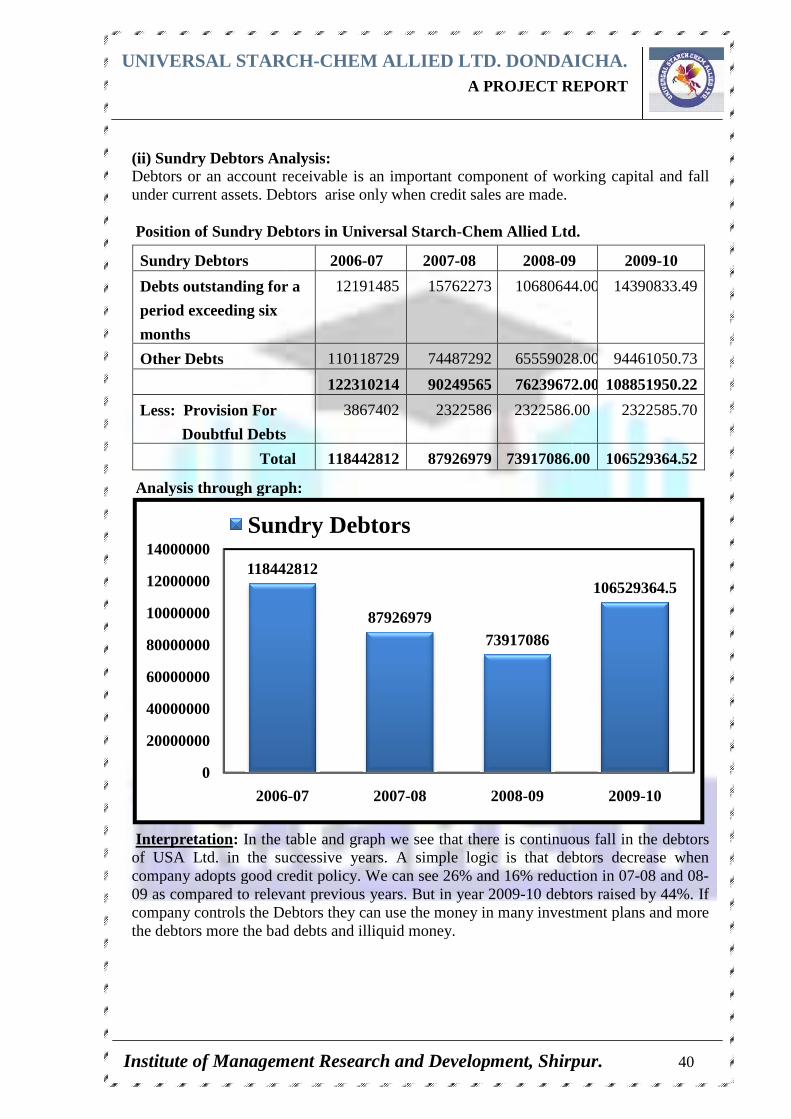
UNIVERSAL STARCH
Institute of Management Research and Development, Shirpur.
(ii) Sundry Debtors AnalysisDebtors or an account receivable is an important componunder current assets. Debtors Position of Sundry Debtors in Universal Starch
Analysis through graph
Interpretation : In the table and graphof USA Ltd. in the successive years. company adopts good credit policy. We can see 26% and 16% 09 as compared to relevantcompany controls the Debtors they can use thethe debtors more the bad debts and illiquid money.
Sundry Debtors
Debts outstanding for a
period exceeding six
months
Other Debts
Less: Provision For
Doubtful Debts
Total
118442812
0
20000000
40000000
60000000
80000000
10000000
12000000
14000000
2006
Sundry Debtors
NIVERSAL STARCH -CHEM ALLIED LTD. DONDAICHA A PROJECT REPORT
Institute of Management Research and Development, Shirpur.
Sundry Debtors Analysis: account receivable is an important component of working capital and fall
current assets. Debtors arise only when credit sales are made.
Position of Sundry Debtors in Universal Starch-Chem Allied Ltd.
Analysis through graph:
In the table and graph we see that there is continuous fallin the successive years. A simple logic is that debtors decrease when
company adopts good credit policy. We can see 26% and 16% reduction in 0709 as compared to relevant previous years. But in year 2009-10 debtors
Debtors they can use the money in many investment plans and more the debtors more the bad debts and illiquid money.
2006-07 2007-08 2008-09
Debts outstanding for a 12191485 15762273 10680644.00
110118729 74487292 65559028.00
122310214 90249565 76239672.00
Less: Provision For
3867402 2322586 2322586.00
Total 118442812 87926979 73917086.00
118442812
8792697973917086
2006-07 2007-08 2008-09
Sundry Debtors
DONDAICHA . A PROJECT REPORT
Institute of Management Research and Development, Shirpur. 40
ent of working capital and fall
Allied Ltd.
ee that there is continuous fall in the debtors A simple logic is that debtors decrease when
reduction in 07-08 and 08-10 debtors raised by 44%. If
money in many investment plans and more
09 2009-10
10680644.00 14390833.49
65559028.00 94461050.73
76239672.00108851950.22
2322586.00 2322585.70
73917086.00 106529364.52
106529364.5
2009-10
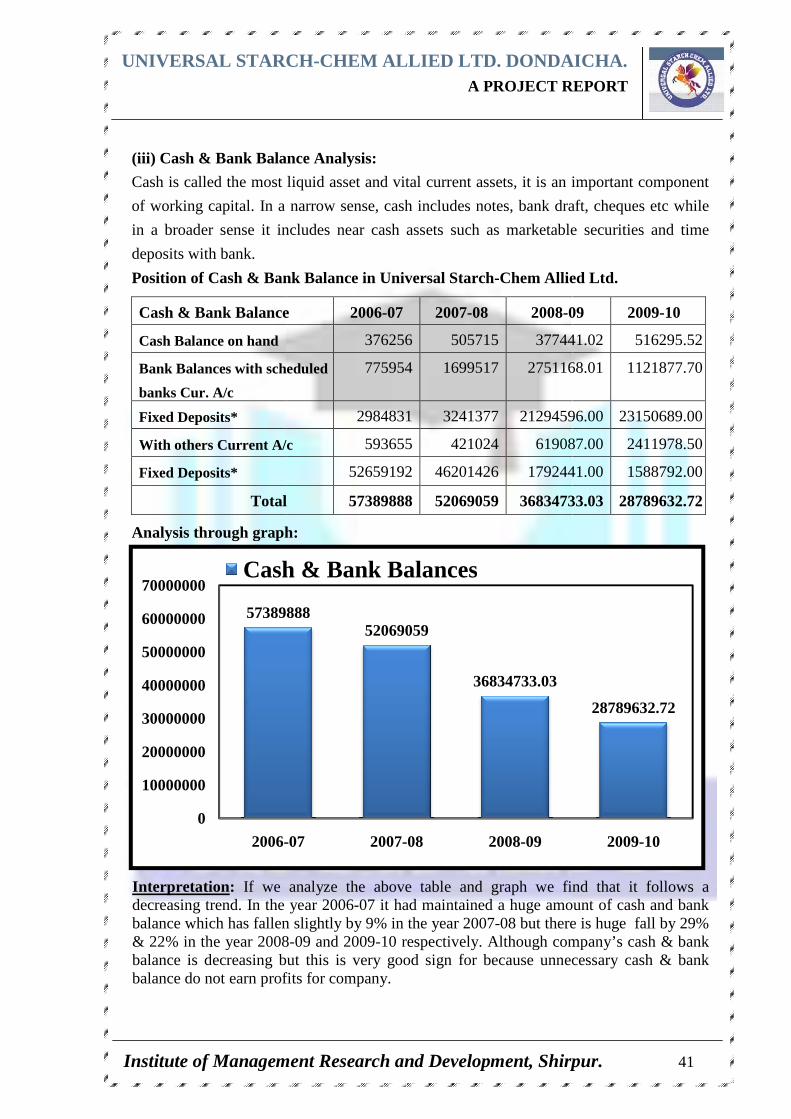
UNIVERSAL STARCH
Institute of Management Research and Development, Shirpur.
(iii) Cash & Bank Balance Analysis:
Cash is called the most liquid asset and vital current assets,
of working capital. In a narrow sense, cash includes notes, bank draft, cheque
in a broader sense it includes near cash assets such as marketable securities and time
deposits with bank.
Position of Cash & Bank Bala
Analysis through graph
Interpretation : If we adecreasing trend. In the year 2006balance which has fallen slightly by 9%& 22% in the year 2008balance is decreasing but thibalance do not earn profits for company.
Cash & Bank Balance
Cash Balance on hand
Bank Balances with scheduled
banks Cur. A/c
Fixed Deposits*
With others Current A/c
Fixed Deposits*
Total
57389888
0
10000000
20000000
30000000
40000000
50000000
60000000
70000000
2006-
Cash & Bank Balances
NIVERSAL STARCH -CHEM ALLIED LTD. DONDAICHA A PROJECT REPORT
Institute of Management Research and Development, Shirpur.
(iii) Cash & Bank Balance Analysis:
Cash is called the most liquid asset and vital current assets, it is an important component
working capital. In a narrow sense, cash includes notes, bank draft, cheque
sense it includes near cash assets such as marketable securities and time
Position of Cash & Bank Balance in Universal Starch-Chem Allied Ltd.
graph:
If we analyze the above table and graph we find that it follows a decreasing trend. In the year 2006-07 it had maintained a huge amount of cash and bank
n slightly by 9% in the year 2007-08 but there is huge& 22% in the year 2008-09 and 2009-10 respectively. Although company’s cash
decreasing but this is very good sign for because unnecessary cash & bank do not earn profits for company.
Cash & Bank Balance 2006-07 2007-08 2008-09
376256 505715 377441.02
ces with scheduled 775954 1699517 2751168.01
2984831 3241377 21294596.00
With others Current A/c 593655 421024 619087.00
52659192 46201426 1792441.00
otal 57389888 52069059 36834733.03
5738988852069059
36834733.03
-07 2007-08 2008-09
Cash & Bank Balances
DONDAICHA . A PROJECT REPORT
Institute of Management Research and Development, Shirpur. 41
it is an important component
working capital. In a narrow sense, cash includes notes, bank draft, cheques etc while
sense it includes near cash assets such as marketable securities and time
Chem Allied Ltd.
we find that it follows a it had maintained a huge amount of cash and bank
08 but there is huge fall by 29% . Although company’s cash & bank
s is very good sign for because unnecessary cash & bank
09 2009-10
377441.02 516295.52
2751168.01 1121877.70
21294596.00 23150689.00
619087.00 2411978.50
1792441.00 1588792.00
36834733.03 28789632.72
28789632.72
2009-10
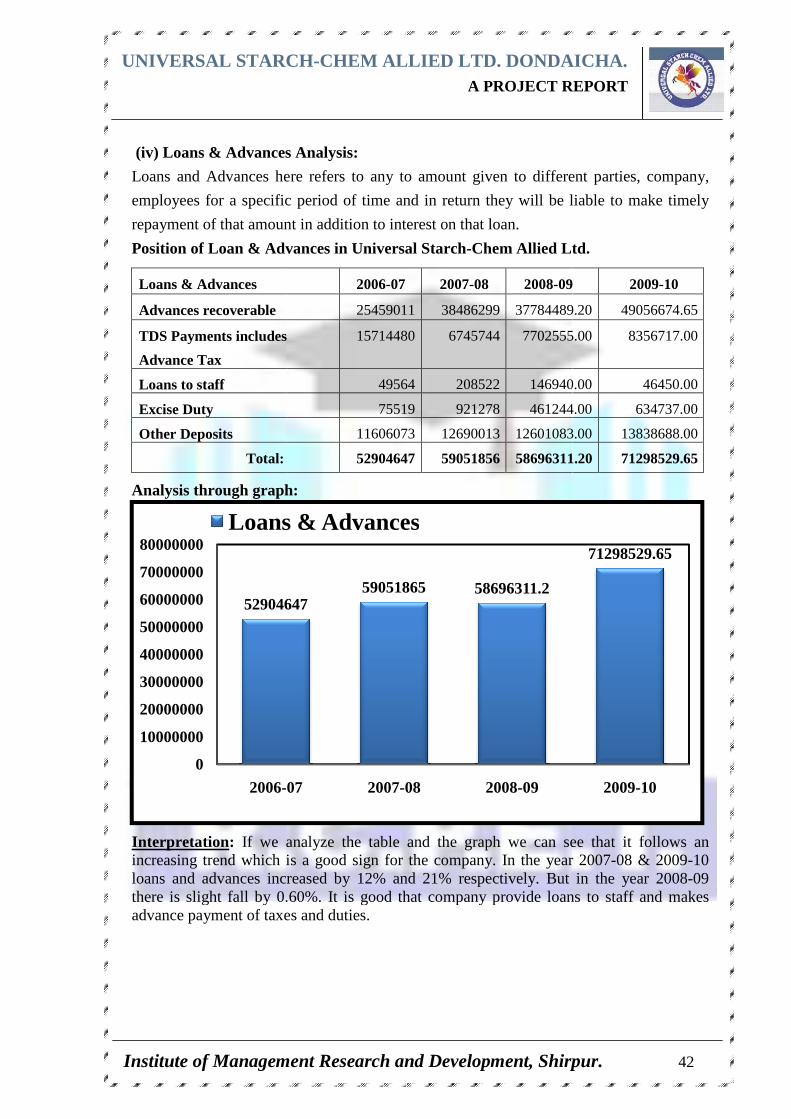
UNIVERSAL STARCH
Institute of Management Research and Development, Shirpur.
(iv) Loans & Advances Analysis:
Loans and Advances here refers to any to amount given to different parties, company,
employees for a specific period of time and in return they will be liable to make timely
repayment of that amount in addition to interest on that loan.
Position of Loan & Advances in Universal Starch
Analysis through graph
Interpretation : If we analyze the table andincreasing trend which is a goodloans and advances increased by 12% and 21% respectively.there is slight fall by 0.60%. It is good that company provide loans to staff and makes advance payment of taxes and duties.
Loans & Advances
Advances recoverable
TDS Payments includes
Advance Tax
Loans to staff
Excise Duty
Other Deposits
Total:
52904647
0
10000000
20000000
30000000
40000000
50000000
60000000
70000000
80000000
2006-
Loans & Advances
NIVERSAL STARCH -CHEM ALLIED LTD. DONDAICHA A PROJECT REPORT
Institute of Management Research and Development, Shirpur.
Advances Analysis:
Loans and Advances here refers to any to amount given to different parties, company,
for a specific period of time and in return they will be liable to make timely
amount in addition to interest on that loan.
Position of Loan & Advances in Universal Starch-Chem Allied Ltd.
Analysis through graph:
If we analyze the table and the graph we can see that it follows an increasing trend which is a good sign for the company. In the year 2007loans and advances increased by 12% and 21% respectively. But in the year 2008
is slight fall by 0.60%. It is good that company provide loans to staff and makes advance payment of taxes and duties.
2006-07 2007-08 2008-09
25459011 38486299 37784489.20
TDS Payments includes 15714480 6745744 7702555.00
49564 208522 146940.00
75519 921278 461244.00
11606073 12690013 12601083.00
52904647 59051856 58696311.20
5290464759051865 58696311.2
-07 2007-08 2008-09
Loans & Advances
DONDAICHA . A PROJECT REPORT
Institute of Management Research and Development, Shirpur. 42
Loans and Advances here refers to any to amount given to different parties, company,
for a specific period of time and in return they will be liable to make timely
Chem Allied Ltd.
we can see that it follows an In the year 2007-08 & 2009-10
But in the year 2008-09 is slight fall by 0.60%. It is good that company provide loans to staff and makes
09 2009-10
37784489.20 49056674.65
7702555.00 8356717.00
146940.00 46450.00
461244.00 634737.00
12601083.00 13838688.00
58696311.20 71298529.65
71298529.65
2009-10
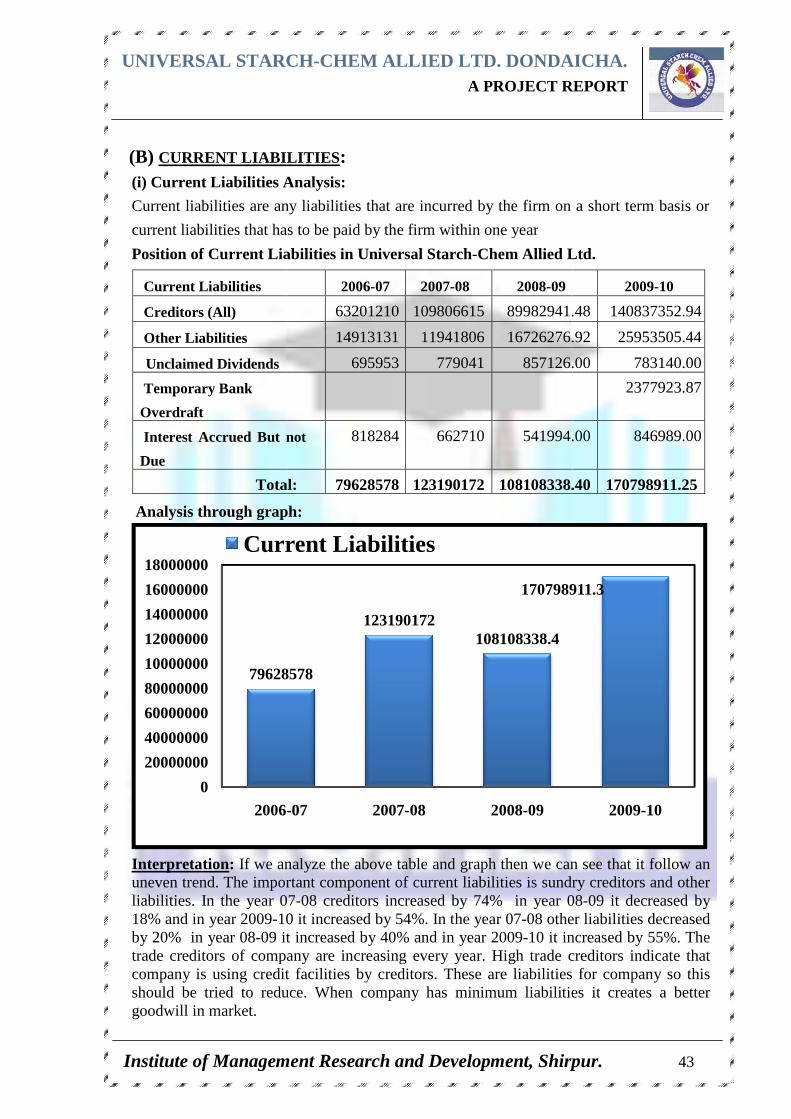
UNIVERSAL STARCH
Institute of Management Research and Development, Shirpur.
(B) CURRENT L IABILITIES
(i) Current Liabilities Analysis:
Current liabilities are any liabilities that are incurred by the
current liabilities that has to be paid by the firm within one year
Position of Current Liabilities in Universal Starch
Analysis through graph
Interpretation : If we analyze the above tableuneven trend. The importantliabilities. In the year 0718% and in year 2009-10 it increased by 54%. by 20% in year 08-09 it increased by 40trade creditors of company are increasing every year. company is using creditshould be tried to reducegoodwill in market.
Current Liabilities
Creditors (All)
Other Liabilities
Unclaimed Dividends
Temporary Bank
Overdraft
Interest Accrued But not
Due
Total:
79628578
0
20000000
40000000
60000000
80000000
10000000
12000000
14000000
16000000
18000000
2006
Current Liabilities
NIVERSAL STARCH -CHEM ALLIED LTD. DONDAICHA A PROJECT REPORT
Institute of Management Research and Development, Shirpur.
IABILITIES : (i) Current Liabilities Analysis:
Current liabilities are any liabilities that are incurred by the firm on a short term basis or
liabilities that has to be paid by the firm within one year
Position of Current Liabilities in Universal Starch-Chem Allied Ltd.
Analysis through graph:
If we analyze the above table and graph then we can see that it follow an uneven trend. The important component of current liabilities is sundry creditliabilities. In the year 07-08 creditors increased by 74% in year 08
10 it increased by 54%. In the year 07-08 other liabilities09 it increased by 40% and in year 2009-10 it increased by 55%.
trade creditors of company are increasing every year. High trade creditorscompany is using credit facilities by creditors. These are liabilitiesshould be tried to reduce. When company has minimum liabilities it
2006-07 2007-08 2008-09
63201210 109806615 89982941.48
14913131 11941806 16726276.92
695953 779041 857126.00
Interest Accrued But not 818284 662710 541994.00
Total: 79628578 123190172 108108338.40
79628578
123190172108108338.4
170798911.3
2006-07 2007-08 2008-09
Current Liabilities
DONDAICHA . A PROJECT REPORT
Institute of Management Research and Development, Shirpur. 43
firm on a short term basis or
Chem Allied Ltd.
then we can see that it follow an current liabilities is sundry creditors and other
year 08-09 it decreased by 08 other liabilities decreased 10 it increased by 55%. The
gh trade creditors indicate that e are liabilities for company so this
minimum liabilities it creates a better
2009-10
89982941.48 140837352.94
16726276.92 25953505.44
857126.00 783140.00
2377923.87
541994.00 846989.00
108108338.40 170798911.25
170798911.3
2009-10
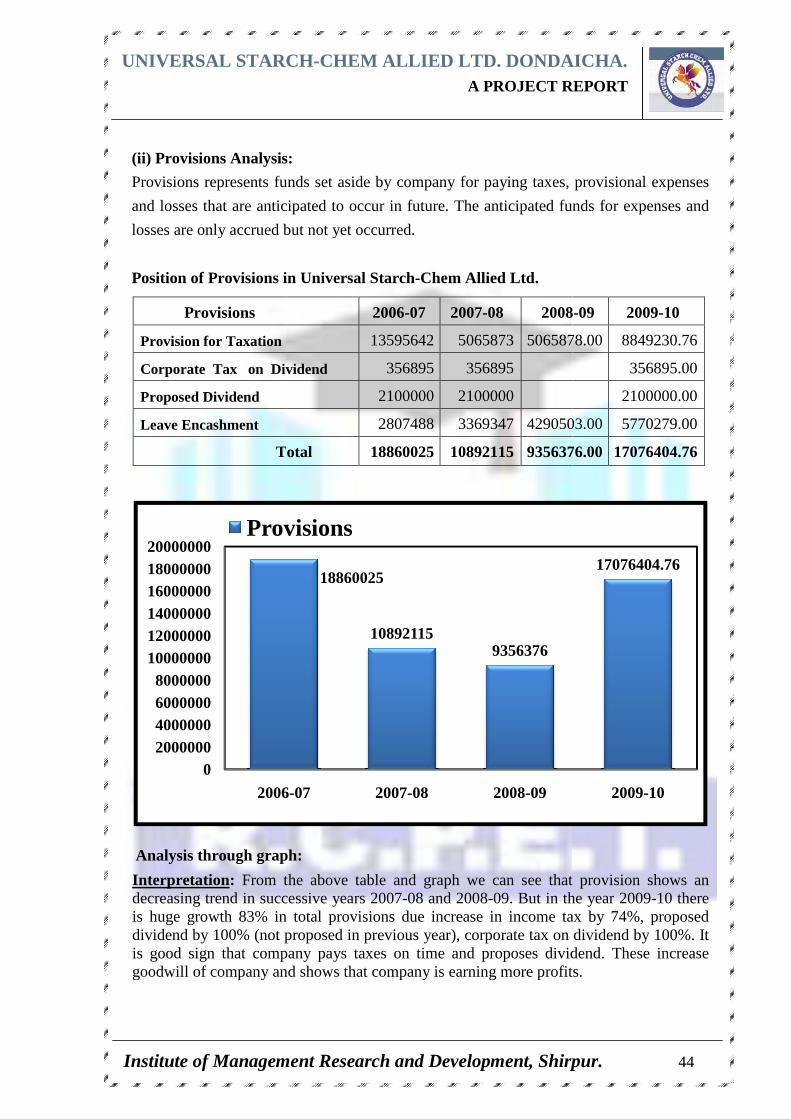
UNIVERSAL STARCH
Institute of Management Research and Development, Shirpur.
(ii) Provisions Analysis:
Provisions represents funds set aside by company for paying taxes, provisional expenses
and losses that are anticipated to
losses are only accrued but not yet occurred.
Position of Provisions in Universal Starch
Analysis through graph
Interpretation : From the above tabledecreasing trend in successive years 2007is huge growth 83% in total provisions due increase in income tax by 74%, proposed dividend by 100% (not proposed in previous year), corporate tax on dividend by 100%. It is good sign that company pays taxes on time and proposes dividendgoodwill of company and shows that company is earning more profits.
Provisions
Provision for Taxation
Corporate Tax on Dividend
Proposed Dividend
Leave Encashment
T
02000000400000060000008000000
100000001200000014000000160000001800000020000000
2006
Provisions
NIVERSAL STARCH -CHEM ALLIED LTD. DONDAICHA A PROJECT REPORT
Institute of Management Research and Development, Shirpur.
Provisions Analysis:
Provisions represents funds set aside by company for paying taxes, provisional expenses
and losses that are anticipated to occur in future. The anticipated funds for expenses and
losses are only accrued but not yet occurred.
Position of Provisions in Universal Starch-Chem Allied Ltd.
Analysis through graph:
From the above table and graph we can see that provision shows an in successive years 2007-08 and 2008-09. But in the year
is huge growth 83% in total provisions due increase in income tax by 74%, proposed dividend by 100% (not proposed in previous year), corporate tax on dividend by 100%. It is good sign that company pays taxes on time and proposes dividendgoodwill of company and shows that company is earning more profits.
2006-07 2007-08 2008
13595642 5065873 5065878.00
Tax on Dividend 356895 356895
2100000 2100000
2807488 3369347 4290503.00
Total 18860025 10892115 9356376.00
18860025
108921159356376
2006-07 2007-08 2008-09
Provisions
DONDAICHA . A PROJECT REPORT
Institute of Management Research and Development, Shirpur. 44
Provisions represents funds set aside by company for paying taxes, provisional expenses
occur in future. The anticipated funds for expenses and
at provision shows an . But in the year 2009-10 there
is huge growth 83% in total provisions due increase in income tax by 74%, proposed dividend by 100% (not proposed in previous year), corporate tax on dividend by 100%. It is good sign that company pays taxes on time and proposes dividend. These increase goodwill of company and shows that company is earning more profits.
2008-09 2009-10
5065878.00 8849230.76
356895.00
2100000.00
4290503.00 5770279.00
9356376.00 17076404.76
17076404.76
2009-10
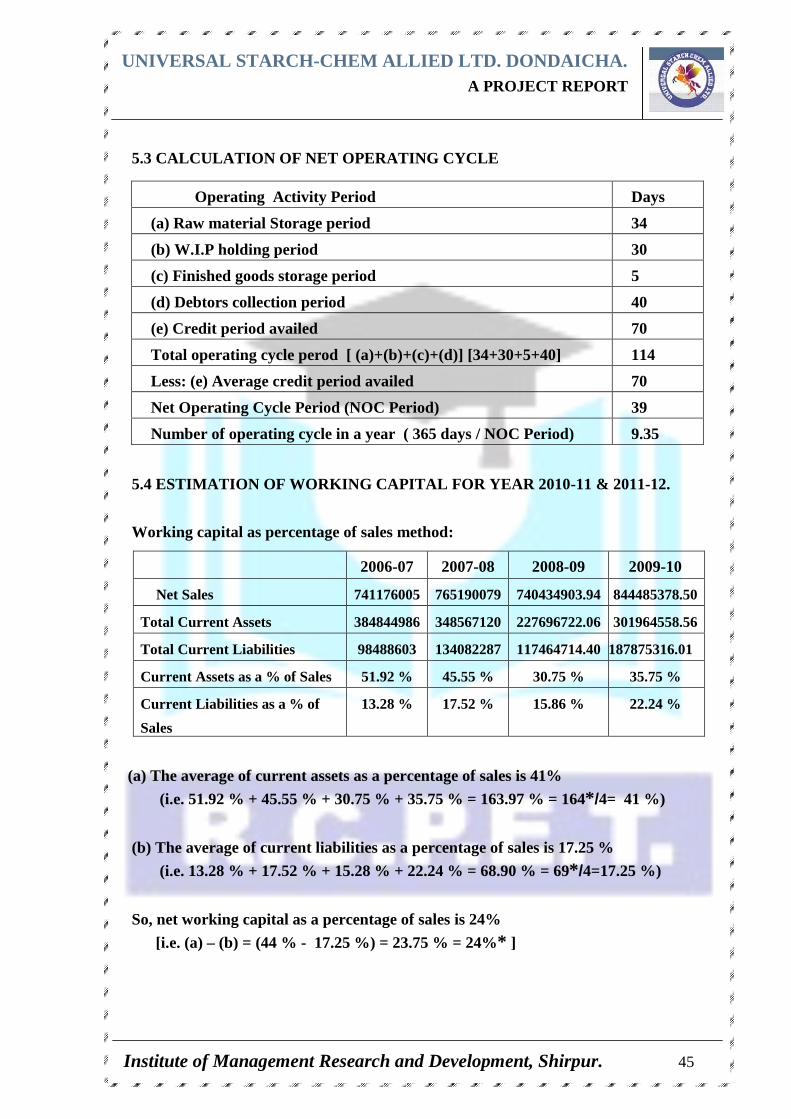
UNIVERSAL STARCH-CHEM ALLIED LTD. DONDAICHA. A PROJECT REPORT
Institute of Management Research and Development, Shirpur. 45
5.3 CALCULATION OF NET OPERATING CYCLE
5.4 ESTIMATION OF WORKING CAPITAL FOR YEAR 2010- 11 & 2011-12.
Working capital as percentage of sales method:
(a) The average of current assets as a percentage of sales is 41%
(i.e. 51.92 % + 45.55 % + 30.75 % + 35.75 % = 163.97 % = 164* /4= 41 %)
(b) The average of current liabilities as a percentage of sales is 17.25 %
(i.e. 13.28 % + 17.52 % + 15.28 % + 22.24 % = 68.90 % = 69* /4=17.25 %)
So, net working capital as a percentage of sales is 24%
[i.e. (a) – (b) = (44 % - 17.25 %) = 23.75 % = 24%* ]
Operating Activity Period Days
(a) Raw material Storage period 34
(b) W.I.P holding period 30
(c) Finished goods storage period 5
(d) Debtors collection period 40
(e) Credit period availed 70
Total operating cycle perod [ (a)+(b)+(c)+(d)] [34+30+5+40] 114
Less: (e) Average credit period availed 70
Net Operating Cycle Period (NOC Period) 39
Number of operating cycle in a year ( 365 days / NOC Period) 9.35
2006-07 2007-08 2008-09 2009-10
Net Sales 741176005 765190079 740434903.94 844485378.50
Total Current Assets 384844986 348567120 227696722.06 301964558.56
Total Current Liabilities 98488603 134082287 117464714.40 187875316.01
Current Assets as a % of Sales 51.92 % 45.55 % 30.75 % 35.75 %
Current Liabilities as a % of
Sales
13.28 % 17.52 % 15.86 % 22.24 %
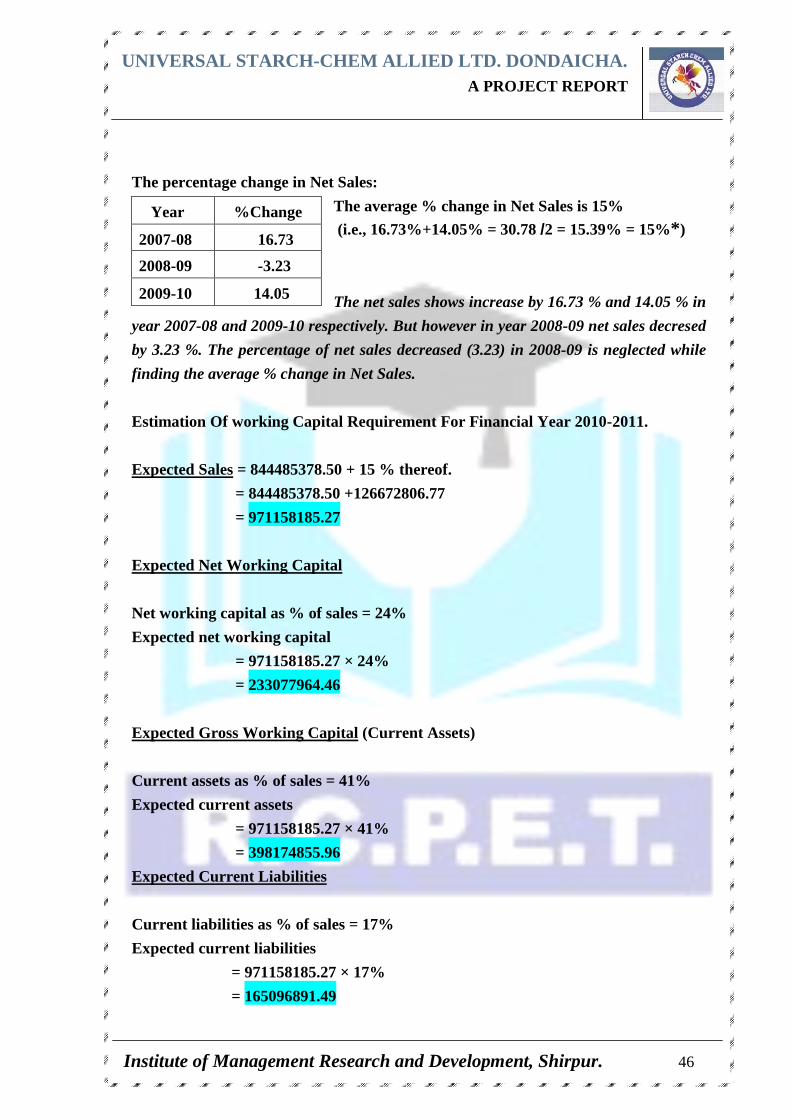
UNIVERSAL STARCH-CHEM ALLIED LTD. DONDAICHA. A PROJECT REPORT
Institute of Management Research and Development, Shirpur. 46
The percentage change in Net Sales:
The average % change in Net Sales is 15%
(i.e., 16.73%+14.05% = 30.78 /2 = 15.39% = 15%* )
The net sales shows increase by 16.73 % and 14.05 % in
year 2007-08 and 2009-10 respectively. But however in year 2008-09 net sales decresed
by 3.23 %. The percentage of net sales decreased (3.23) in 2008-09 is neglected while
finding the average % change in Net Sales.
Estimation Of working Capital Requirement For Financial Year 2010-2011.
Expected Sales = 844485378.50 + 15 % thereof.
= 844485378.50 +126672806.77
= 971158185.27
Expected Net Working Capital
Net working capital as % of sales = 24%
Expected net working capital
= 971158185.27 × 24%
= 233077964.46
Expected Gross Working Capital (Current Assets)
Current assets as % of sales = 41%
Expected current assets
= 971158185.27 × 41%
= 398174855.96
Expected Current Liabilities
Current liabilities as % of sales = 17%
Expected current liabilities
= 971158185.27 × 17%
= 165096891.49
Year %Change
2007-08 16.73
2008-09 -3.23
2009-10 14.05
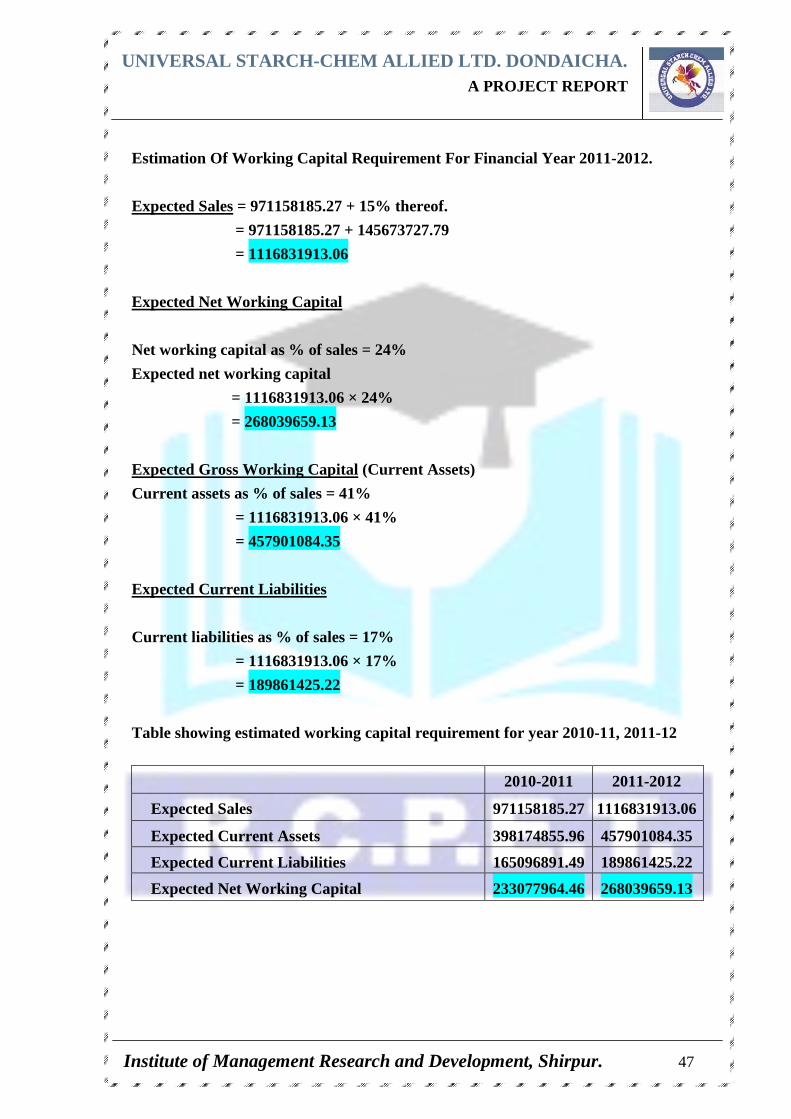
UNIVERSAL STARCH-CHEM ALLIED LTD. DONDAICHA. A PROJECT REPORT
Institute of Management Research and Development, Shirpur. 47
Estimation Of Working Capital Requirement For Financial Year 2011-2012.
Expected Sales = 971158185.27 + 15% thereof.
= 971158185.27 + 145673727.79
= 1116831913.06
Expected Net Working Capital
Net working capital as % of sales = 24%
Expected net working capital
= 1116831913.06 × 24%
= 268039659.13
Expected Gross Working Capital (Current Assets)
Current assets as % of sales = 41%
= 1116831913.06 × 41%
= 457901084.35
Expected Current Liabilities
Current liabilities as % of sales = 17%
= 1116831913.06 × 17%
= 189861425.22
Table showing estimated working capital requirement for year 2010-11, 2011-12
2010-2011 2011-2012
Expected Sales 971158185.27 1116831913.06
Expected Current Assets 398174855.96 457901084.35
Expected Current Liabilities 165096891.49 189861425.22
Expected Net Working Capital 233077964.46 268039659.13
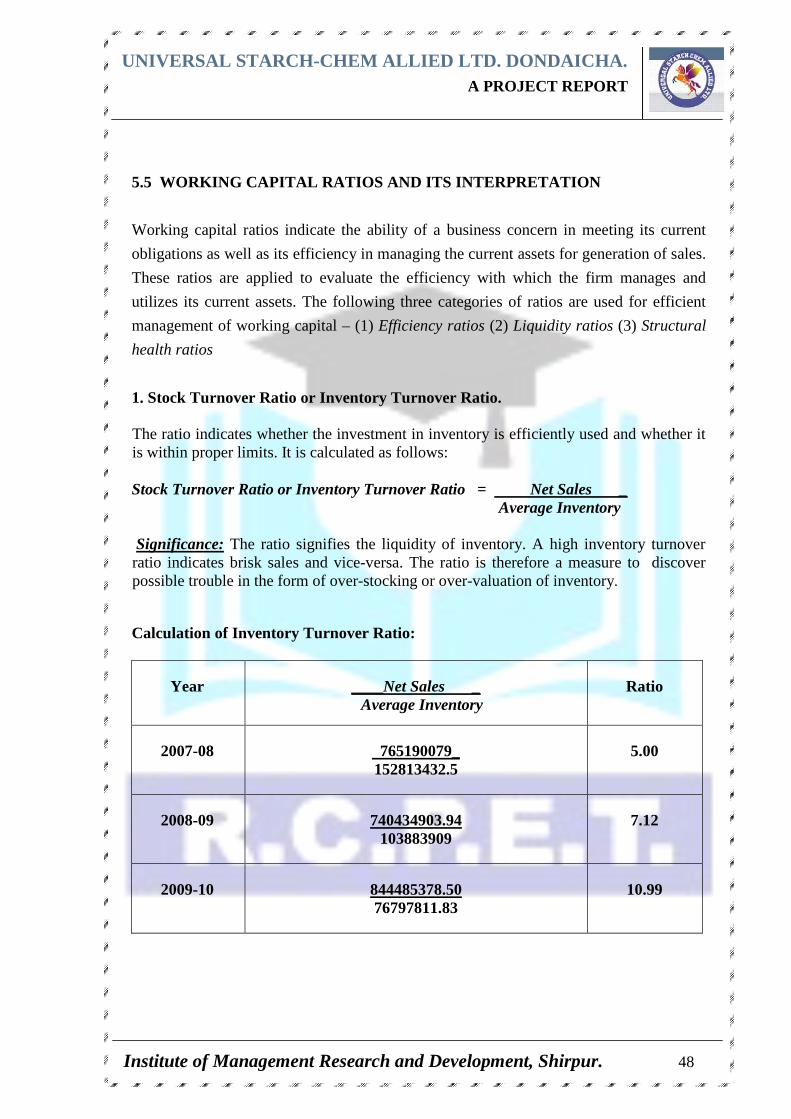
UNIVERSAL STARCH-CHEM ALLIED LTD. DONDAICHA. A PROJECT REPORT
Institute of Management Research and Development, Shirpur. 48
5.5 WORKING CAPITAL RATIOS AND ITS INTERPRETATI ON
Working capital ratios indicate the ability of a business concern in meeting its current
obligations as well as its efficiency in managing the current assets for generation of sales.
These ratios are applied to evaluate the efficiency with which the firm manages and
utilizes its current assets. The following three categories of ratios are used for efficient
management of working capital – (1) Efficiency ratios (2) Liquidity ratios (3) Structural
health ratios
1. Stock Turnover Ratio or Inventory Turnover Ratio. The ratio indicates whether the investment in inventory is efficiently used and whether it is within proper limits. It is calculated as follows:
Stock Turnover Ratio or Inventory Turnover Ratio = Net Sales _
Average Inventory Significance: The ratio signifies the liquidity of inventory. A high inventory turnover ratio indicates brisk sales and vice-versa. The ratio is therefore a measure to discover possible trouble in the form of over-stocking or over-valuation of inventory. Calculation of Inventory Turnover Ratio:
Year ____Net Sales _ Average Inventory
Ratio
2007-08 765190079_ 152813432.5
5.00
2008-09 740434903.94 103883909
7.12
2009-10 844485378.50 76797811.83
10.99
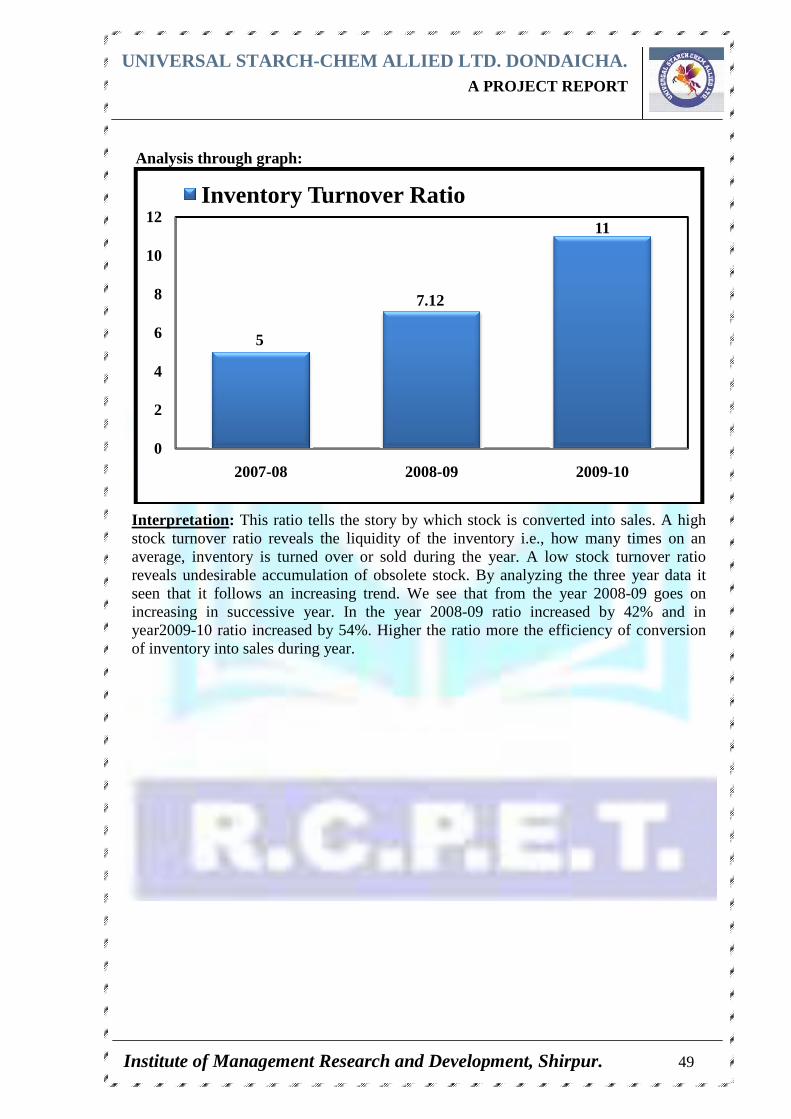
UNIVERSAL STARCH
Institute of Management Research and Development, Shirpur.
Analysis through graph:
Interpretation : This ratio tells the story by which stock isstock turnover ratio revealsaverage, inventory is turned over or soldreveals undesirable accumulation of obsolete stock.seen that it follows an increasing trend. We see that from theincreasing in successive year. In the year 2008year2009-10 ratio increased by 54%. Higher the ratio morof inventory into sales during year
5
0
2
4
6
8
10
12
2007-08
Inventory Turnover Ratio
NIVERSAL STARCH -CHEM ALLIED LTD. DONDAICHA A PROJECT REPORT
Institute of Management Research and Development, Shirpur.
Analysis through graph:
This ratio tells the story by which stock is converted into sales. stock turnover ratio reveals the liquidity of the inventory i.e., how many times on an average, inventory is turned over or sold during the year. A low stock reveals undesirable accumulation of obsolete stock. By analyzing the three year data it seen that it follows an increasing trend. We see that from the year 2008increasing in successive year. In the year 2008-09 ratio increased by 42%
10 ratio increased by 54%. Higher the ratio more the efficiency of conversion into sales during year.
7.12
08 2008-09
Inventory Turnover Ratio
DONDAICHA . A PROJECT REPORT
Institute of Management Research and Development, Shirpur. 49
converted into sales. A high
the liquidity of the inventory i.e., how many times on an A low stock turnover ratio
y analyzing the three year data it year 2008-09 goes on
09 ratio increased by 42% and in e the efficiency of conversion
11
2009-10
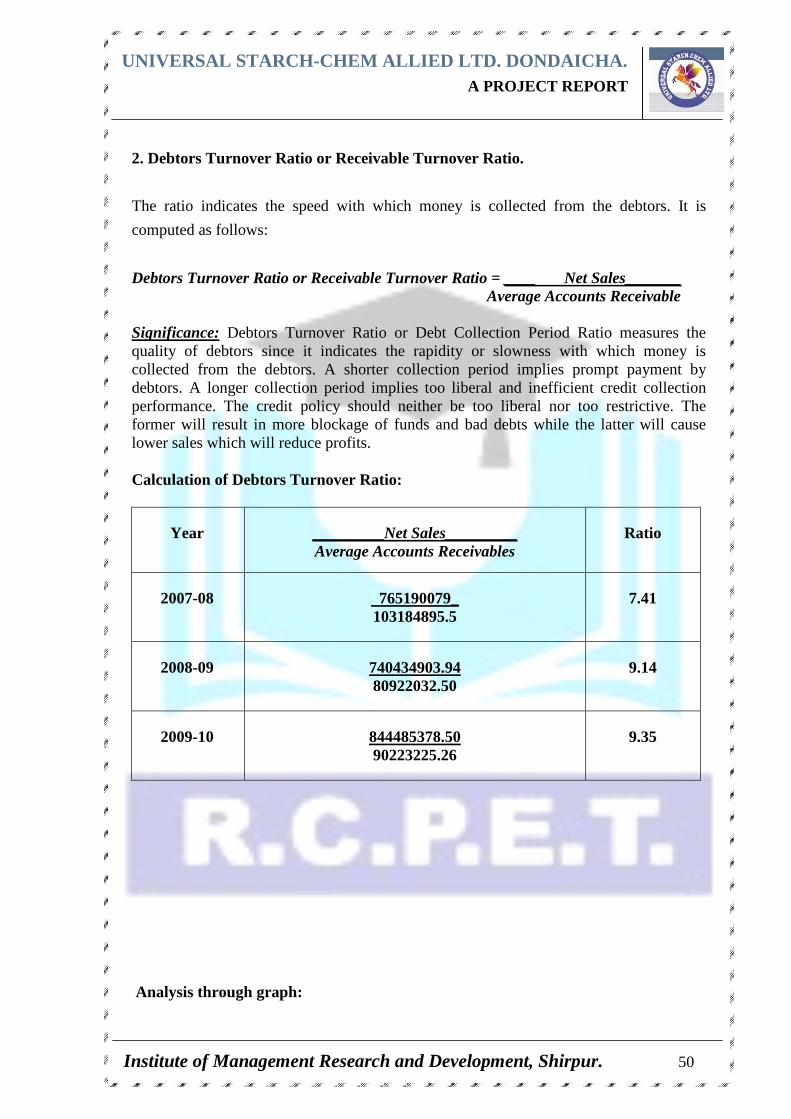
UNIVERSAL STARCH-CHEM ALLIED LTD. DONDAICHA. A PROJECT REPORT
Institute of Management Research and Development, Shirpur. 50
2. Debtors Turnover Ratio or Receivable Turnover Ratio.
The ratio indicates the speed with which money is collected from the debtors. It is
computed as follows:
Debtors Turnover Ratio or Receivable Turnover Ratio = ____ Net Sales_______ Average Accounts Receivable Significance: Debtors Turnover Ratio or Debt Collection Period Ratio measures the quality of debtors since it indicates the rapidity or slowness with which money is collected from the debtors. A shorter collection period implies prompt payment by debtors. A longer collection period implies too liberal and inefficient credit collection performance. The credit policy should neither be too liberal nor too restrictive. The former will result in more blockage of funds and bad debts while the latter will cause lower sales which will reduce profits. Calculation of Debtors Turnover Ratio:
Year _________Net Sales_________ Average Accounts Receivables
Ratio
2007-08 765190079_ 103184895.5
7.41
2008-09 740434903.94 80922032.50
9.14
2009-10 844485378.50 90223225.26
9.35
Analysis through graph:
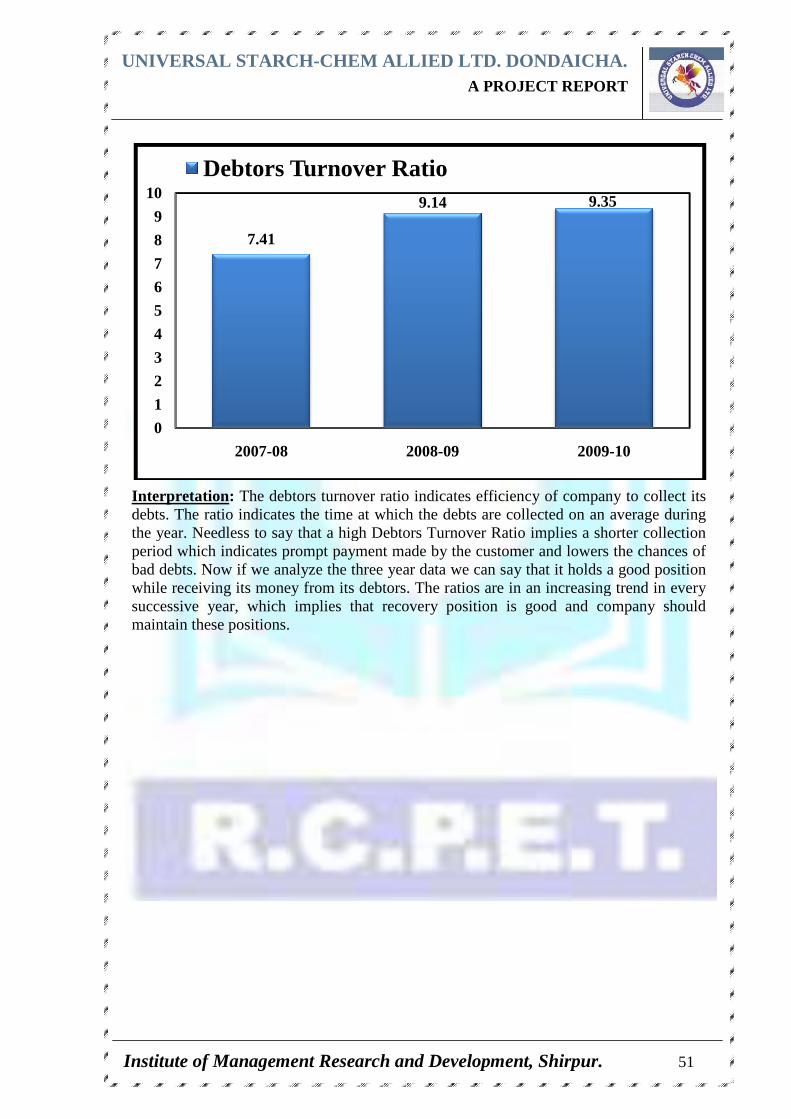
UNIVERSAL STARCH
Institute of Management Research and Development, Shirpur.
Interpretation : The debtorsdebts. The ratio indicates the time at which the debts are collected on anthe year. Needless to say that a high Debtors Turnover Ratio implies a shorterperiod which indicates prompt payment made by the customerbad debts. Now if we analyze the three year data we can say that it holds a good position while receiving its money from its debtors. The ratios are in an increasing trendsuccessive year, which implies that recovery positionmaintain these positions.
7.41
0
1
2
3
4
5
6
7
8
9
10
2007-08
Debtors Turnover Ratio
NIVERSAL STARCH -CHEM ALLIED LTD. DONDAICHA A PROJECT REPORT
Institute of Management Research and Development, Shirpur.
debtors turnover ratio indicates efficiency of company to collect its . The ratio indicates the time at which the debts are collected on an
the year. Needless to say that a high Debtors Turnover Ratio implies a shorterindicates prompt payment made by the customer and lowers the chances of
Now if we analyze the three year data we can say that it holds a good position money from its debtors. The ratios are in an increasing trend
, which implies that recovery position is good and company should maintain these positions.
9.14
08 2008-09
Debtors Turnover Ratio
DONDAICHA . A PROJECT REPORT
Institute of Management Research and Development, Shirpur. 51
turnover ratio indicates efficiency of company to collect its
. The ratio indicates the time at which the debts are collected on an average during the year. Needless to say that a high Debtors Turnover Ratio implies a shorter collection
and lowers the chances of Now if we analyze the three year data we can say that it holds a good position
money from its debtors. The ratios are in an increasing trend in every is good and company should
9.35
2009-10
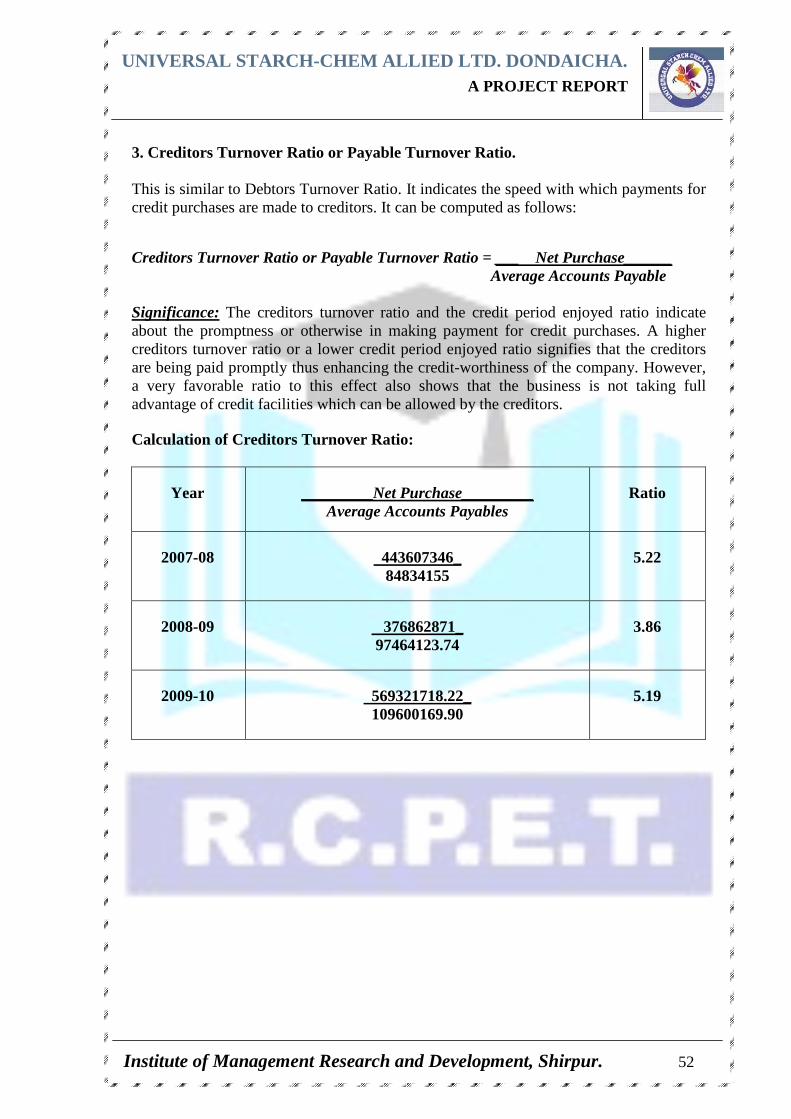
UNIVERSAL STARCH-CHEM ALLIED LTD. DONDAICHA. A PROJECT REPORT
Institute of Management Research and Development, Shirpur. 52
3. Creditors Turnover Ratio or Payable Turnover Ratio. This is similar to Debtors Turnover Ratio. It indicates the speed with which payments for credit purchases are made to creditors. It can be computed as follows:
Creditors Turnover Ratio or Payable Turnover Ratio = ___ Net Purchase______ Average Accounts Payable Significance: The creditors turnover ratio and the credit period enjoyed ratio indicate about the promptness or otherwise in making payment for credit purchases. A higher creditors turnover ratio or a lower credit period enjoyed ratio signifies that the creditors are being paid promptly thus enhancing the credit-worthiness of the company. However, a very favorable ratio to this effect also shows that the business is not taking full advantage of credit facilities which can be allowed by the creditors. Calculation of Creditors Turnover Ratio:
Year _________Net Purchase_________ Average Accounts Payables
Ratio
2007-08 443607346_ 84834155
5.22
2008-09 376862871_ 97464123.74
3.86
2009-10 569321718.22_ 109600169.90
5.19
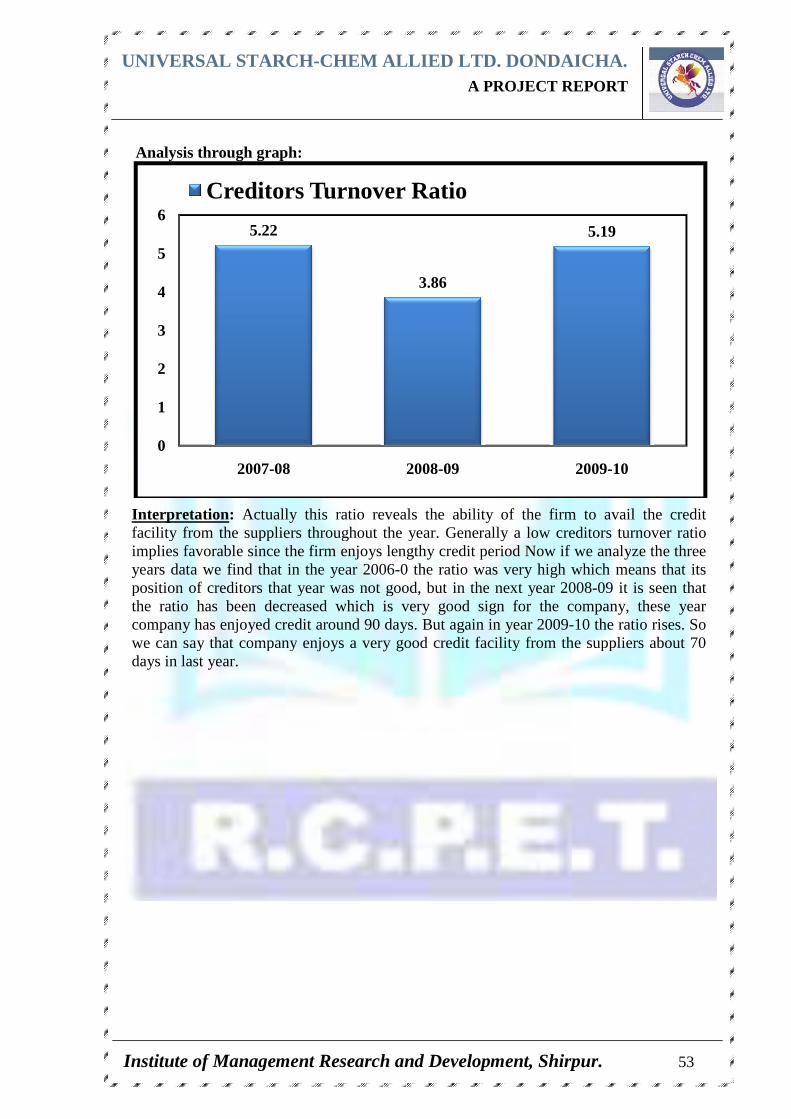
UNIVERSAL STARCH
Institute of Management Research and Development, Shirpur.
Analysis through graph:
Interpretation : Actually this ratio reveals the ability of the firm to avail the credit facility from the suppliersimplies favorable since the firm enjoysyears data we find that in the year 2006position of creditors that year wthe ratio has been decreased company has enjoyed credit around 90 dayswe can say that companydays in last year.
5.22
0
1
2
3
4
5
6
2007-08
Creditors Turnover Ratio
NIVERSAL STARCH -CHEM ALLIED LTD. DONDAICHA A PROJECT REPORT
Institute of Management Research and Development, Shirpur.
Analysis through graph:
Actually this ratio reveals the ability of the firm to avail the credit facility from the suppliers throughout the year. Generally a low creditors turnover ratio implies favorable since the firm enjoys lengthy credit period Now if we analy
ta we find that in the year 2006-0 the ratio was very high which means that its position of creditors that year was not good, but in the next year 2008the ratio has been decreased which is very good sign for the comcompany has enjoyed credit around 90 days. But again in year 2009-we can say that company enjoys a very good credit facility from the suppliers about 70
3.86
08 2008-09
Creditors Turnover Ratio
DONDAICHA . A PROJECT REPORT
Institute of Management Research and Development, Shirpur. 53
Actually this ratio reveals the ability of the firm to avail the credit
throughout the year. Generally a low creditors turnover ratio Now if we analyze the three
very high which means that its as not good, but in the next year 2008-09 it is seen that
which is very good sign for the company, these year -10 the ratio rises. So
ity from the suppliers about 70
5.19
2009-10
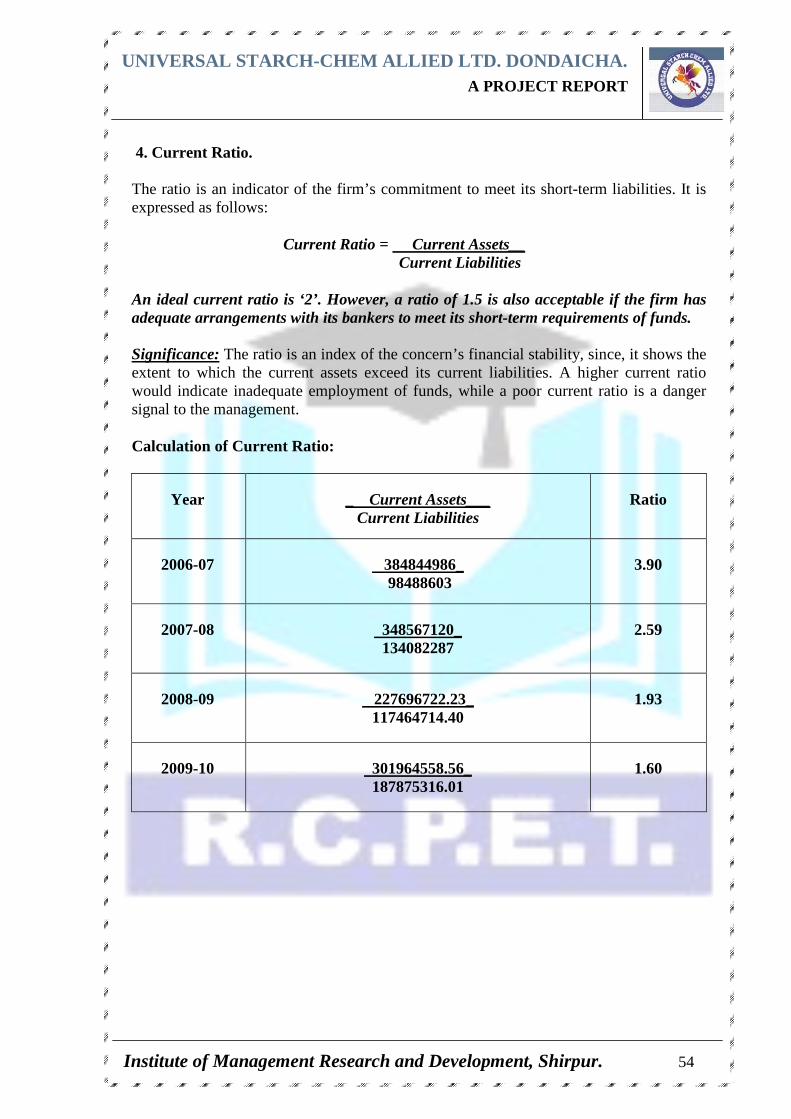
UNIVERSAL STARCH-CHEM ALLIED LTD. DONDAICHA. A PROJECT REPORT
Institute of Management Research and Development, Shirpur. 54
4. Current Ratio. The ratio is an indicator of the firm’s commitment to meet its short-term liabilities. It is expressed as follows: Current Ratio = Current Assets__ Current Liabilities An ideal current ratio is ‘2’. However, a ratio of 1.5 is also acceptable if the firm has adequate arrangements with its bankers to meet its short-term requirements of funds. Significance: The ratio is an index of the concern’s financial stability, since, it shows the extent to which the current assets exceed its current liabilities. A higher current ratio would indicate inadequate employment of funds, while a poor current ratio is a danger signal to the management. Calculation of Current Ratio:
Year _ Current Assets___ Current Liabilities
Ratio
2006-07 384844986_ 98488603
3.90
2007-08 348567120_ 134082287
2.59
2008-09 227696722.23_ 117464714.40
1.93
2009-10 301964558.56_ 187875316.01
1.60
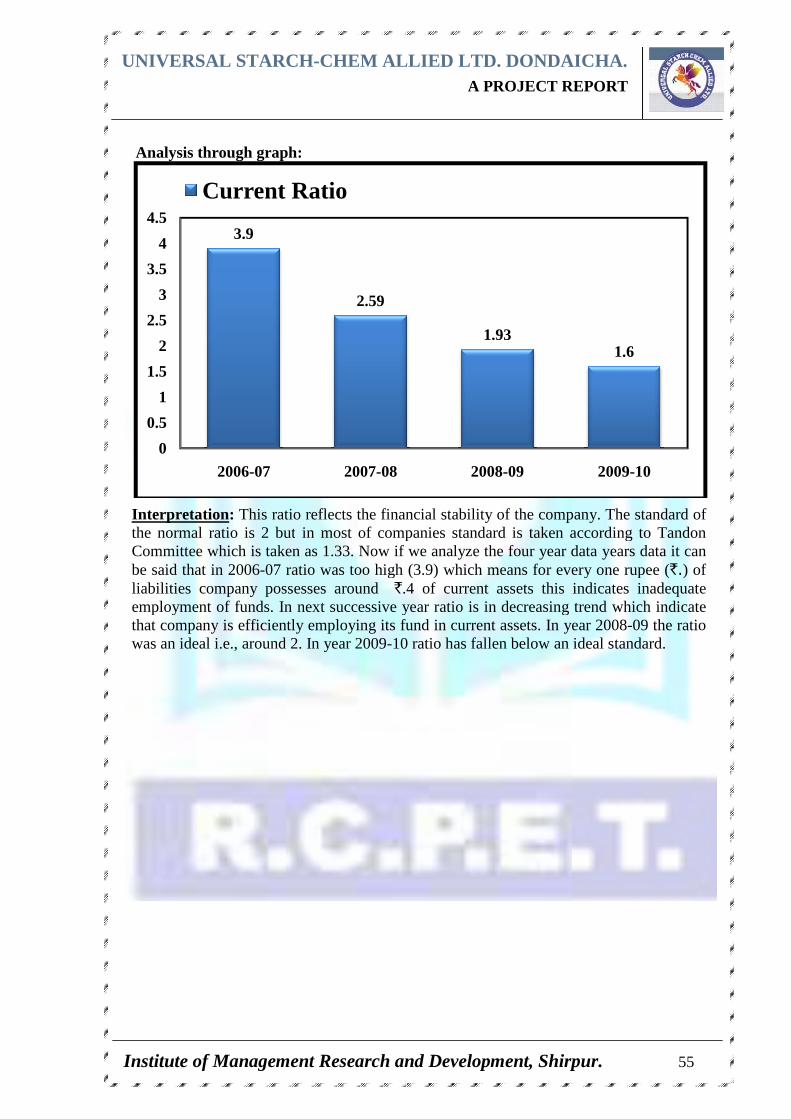
UNIVERSAL STARCH
Institute of Management Research and Development, Shirpur.
Analysis through graph:
Interpretation : This ratio reflects the finanthe normal ratio is 2 butCommittee which is taken as 1.33be said that in 2006-07 ratio was too high (3.9) which means for every one rupee (liabilities company possesses around employment of funds. In next successive year ratio is in decreasing trend which indicatethat company is efficiently employing its fund in current assets. In year 2008was an ideal i.e., around 2. In year 2009
3.9
0
0.5
1
1.5
2
2.5
3
3.5
4
4.5
2006-07
Current Ratio
NIVERSAL STARCH -CHEM ALLIED LTD. DONDAICHA A PROJECT REPORT
Institute of Management Research and Development, Shirpur.
Analysis through graph:
This ratio reflects the financial stability of the companybut in most of companies standard is taken according to
ommittee which is taken as 1.33. Now if we analyze the four year data07 ratio was too high (3.9) which means for every one rupee (
liabilities company possesses around `.4 of current assets this indicaemployment of funds. In next successive year ratio is in decreasing trend which indicate
efficiently employing its fund in current assets. In year 2008was an ideal i.e., around 2. In year 2009-10 ratio has fallen below an ideal standard.
2.59
1.93
2007-08 2008-09
Current Ratio
DONDAICHA . A PROJECT REPORT
Institute of Management Research and Development, Shirpur. 55
cial stability of the company. The standard of
in most of companies standard is taken according to Tandon the four year data years data it can
07 ratio was too high (3.9) which means for every one rupee (̀.) of .4 of current assets this indicates inadequate
employment of funds. In next successive year ratio is in decreasing trend which indicate efficiently employing its fund in current assets. In year 2008-09 the ratio
n below an ideal standard.
1.6
2009-10
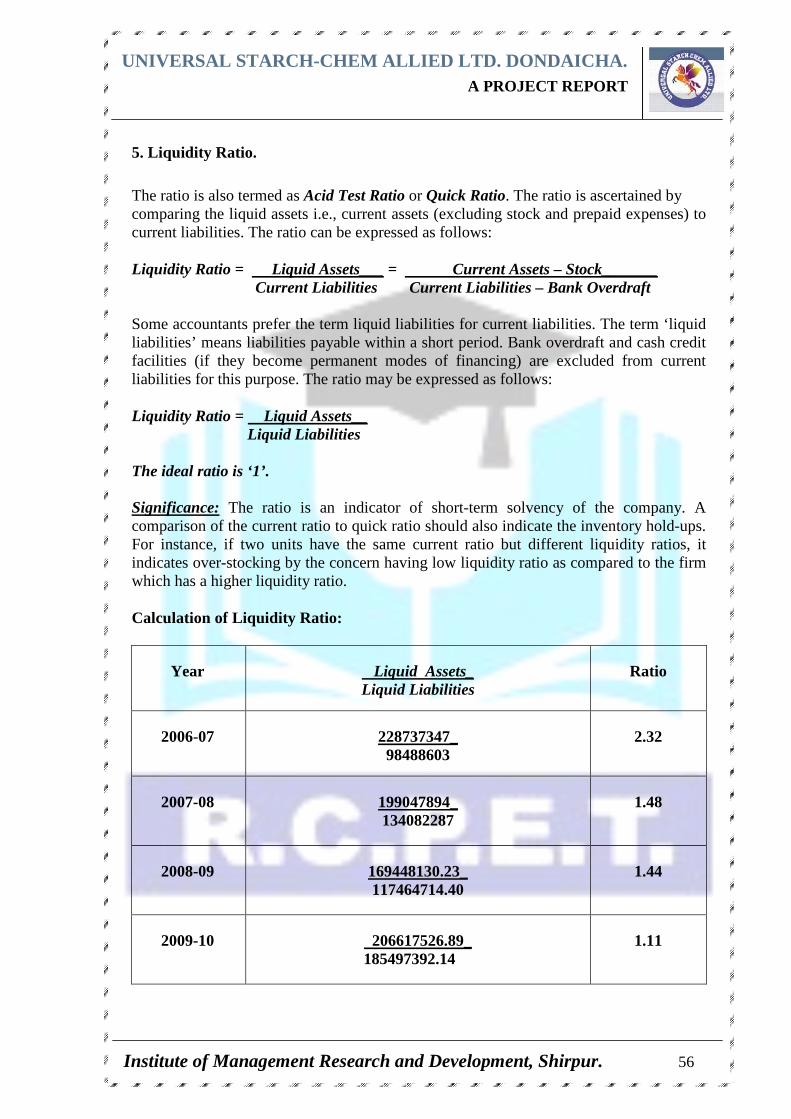
UNIVERSAL STARCH-CHEM ALLIED LTD. DONDAICHA. A PROJECT REPORT
Institute of Management Research and Development, Shirpur. 56
5. Liquidity Ratio.
The ratio is also termed as Acid Test Ratio or Quick Ratio. The ratio is ascertained by comparing the liquid assets i.e., current assets (excluding stock and prepaid expenses) to current liabilities. The ratio can be expressed as follows: Liquidity Ratio = Liquid Assets___ = Current Assets – Stock_______ Current Liabilities Current Liabilities – Bank Overdraft Some accountants prefer the term liquid liabilities for current liabilities. The term ‘liquid liabilities’ means liabilities payable within a short period. Bank overdraft and cash credit facilities (if they become permanent modes of financing) are excluded from current liabilities for this purpose. The ratio may be expressed as follows: Liquidity Ratio = Liquid Assets__ Liquid Liabilities The ideal ratio is ‘1’. Significance: The ratio is an indicator of short-term solvency of the company. A comparison of the current ratio to quick ratio should also indicate the inventory hold-ups. For instance, if two units have the same current ratio but different liquidity ratios, it indicates over-stocking by the concern having low liquidity ratio as compared to the firm which has a higher liquidity ratio. Calculation of Liquidity Ratio:
Year Liquid Assets_ Liquid Liabilities
Ratio
2006-07 228737347_ 98488603
2.32
2007-08 199047894_ 134082287
1.48
2008-09 169448130.23_ 117464714.40
1.44
2009-10 206617526.89_ 185497392.14
1.11
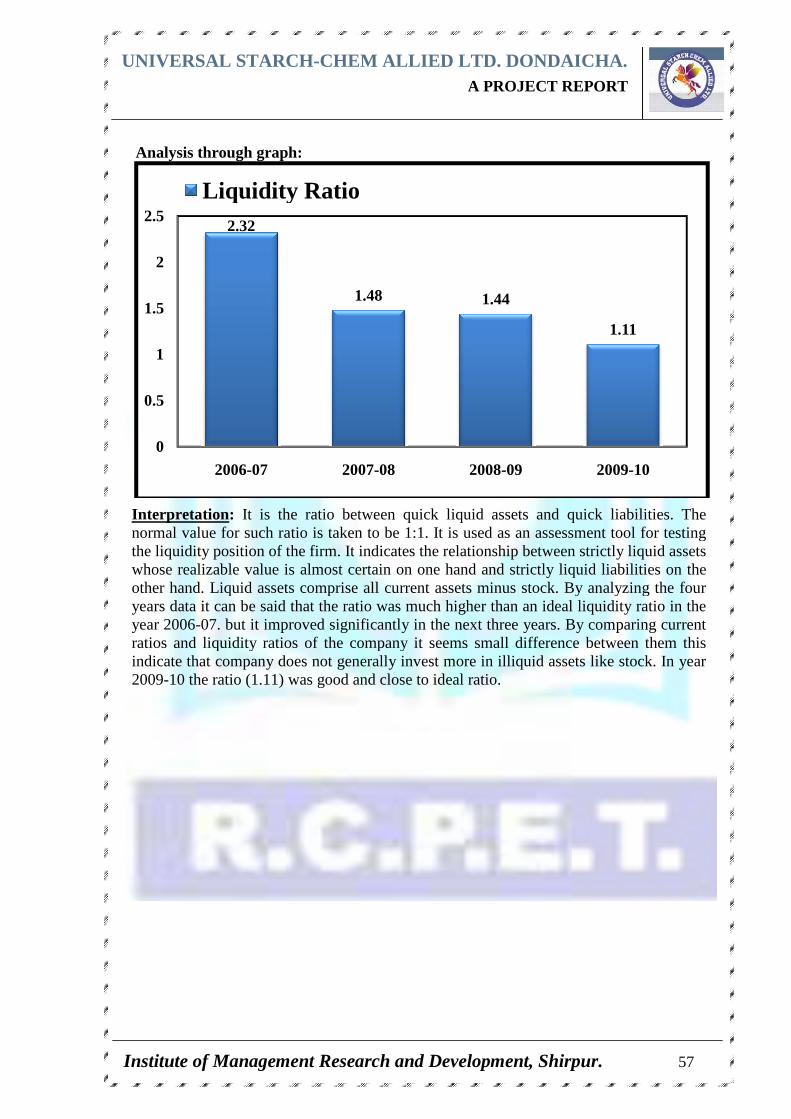
UNIVERSAL STARCH
Institute of Management Research and Development, Shirpur.
Analysis through graph:
Interpretation : It is the ratio between quick liquid assets anormal value for such ratio isthe liquidity position of the firm. Itwhose realizable value is almost certain onother hand. Liquid assets comprise all years data it can be said that the ratio was much higher than an ideal liquidity ratioyear 2006-07. but it improvratios and liquidity ratios of the company it seems small difference between them this indicate that company does not generally invest more in illiquid assets like stock. In year 2009-10 the ratio (1.11) was good and close to ideal ra
2.32
0
0.5
1
1.5
2
2.5
2006-07
Liquidity Ratio
NIVERSAL STARCH -CHEM ALLIED LTD. DONDAICHA A PROJECT REPORT
Institute of Management Research and Development, Shirpur.
Analysis through graph:
It is the ratio between quick liquid assets and quick liabilities. The value for such ratio is taken to be 1:1. It is used as an assessment tool for testing
the liquidity position of the firm. It indicates the relationship between strictly liquid assets whose realizable value is almost certain on one hand and strictly liquid liabilities on the other hand. Liquid assets comprise all current assets minus stock. By analyzing the four
n be said that the ratio was much higher than an ideal liquidity ratioimproved significantly in the next three years. By comparing current
ratios and liquidity ratios of the company it seems small difference between them this indicate that company does not generally invest more in illiquid assets like stock. In year
10 the ratio (1.11) was good and close to ideal ratio.
1.48 1.44
2007-08 2008-09
Liquidity Ratio
DONDAICHA . A PROJECT REPORT
Institute of Management Research and Development, Shirpur. 57
nd quick liabilities. The
assessment tool for testing indicates the relationship between strictly liquid assets
one hand and strictly liquid liabilities on the By analyzing the four
n be said that the ratio was much higher than an ideal liquidity ratio in the By comparing current
ratios and liquidity ratios of the company it seems small difference between them this indicate that company does not generally invest more in illiquid assets like stock. In year
1.11
2009-10
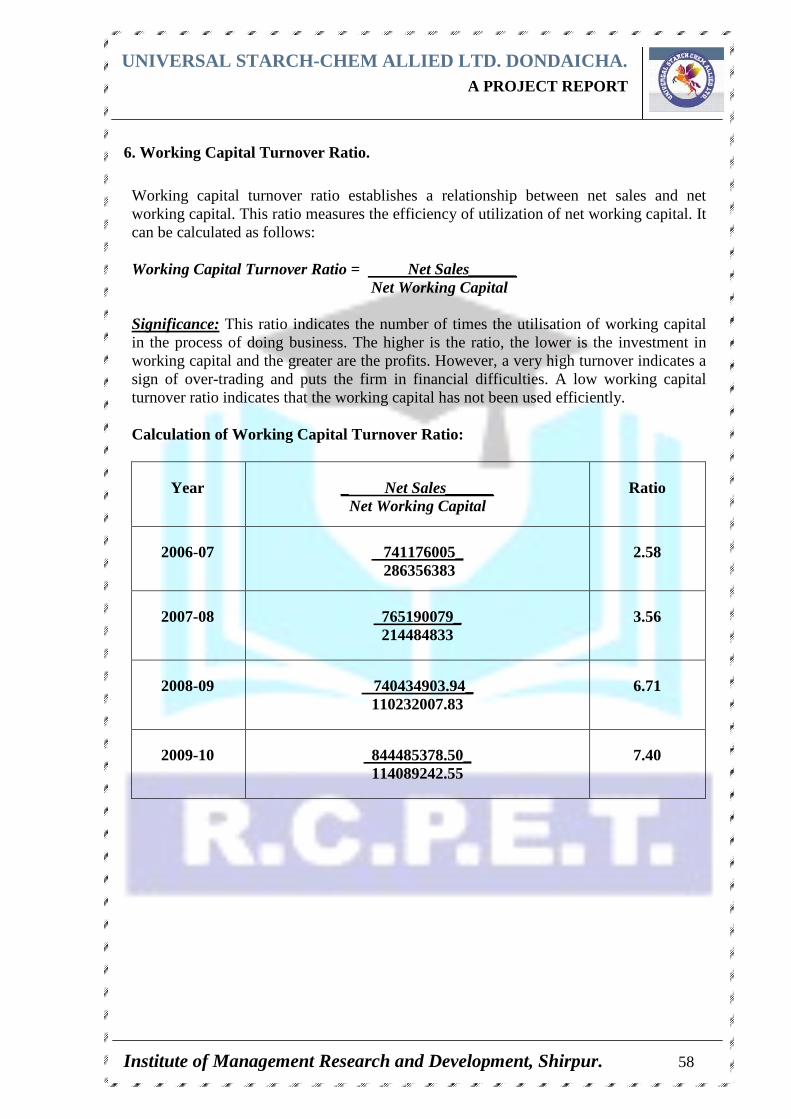
UNIVERSAL STARCH-CHEM ALLIED LTD. DONDAICHA. A PROJECT REPORT
Institute of Management Research and Development, Shirpur. 58
6. Working Capital Turnover Ratio.
Working capital turnover ratio establishes a relationship between net sales and net working capital. This ratio measures the efficiency of utilization of net working capital. It can be calculated as follows: Working Capital Turnover Ratio = Net Sales______ Net Working Capital Significance: This ratio indicates the number of times the utilisation of working capital in the process of doing business. The higher is the ratio, the lower is the investment in working capital and the greater are the profits. However, a very high turnover indicates a sign of over-trading and puts the firm in financial difficulties. A low working capital turnover ratio indicates that the working capital has not been used efficiently. Calculation of Working Capital Turnover Ratio:
Year _ Net Sales______ Net Working Capital
Ratio
2006-07 741176005_ 286356383
2.58
2007-08 765190079_ 214484833
3.56
2008-09 740434903.94_ 110232007.83
6.71
2009-10 844485378.50_ 114089242.55
7.40
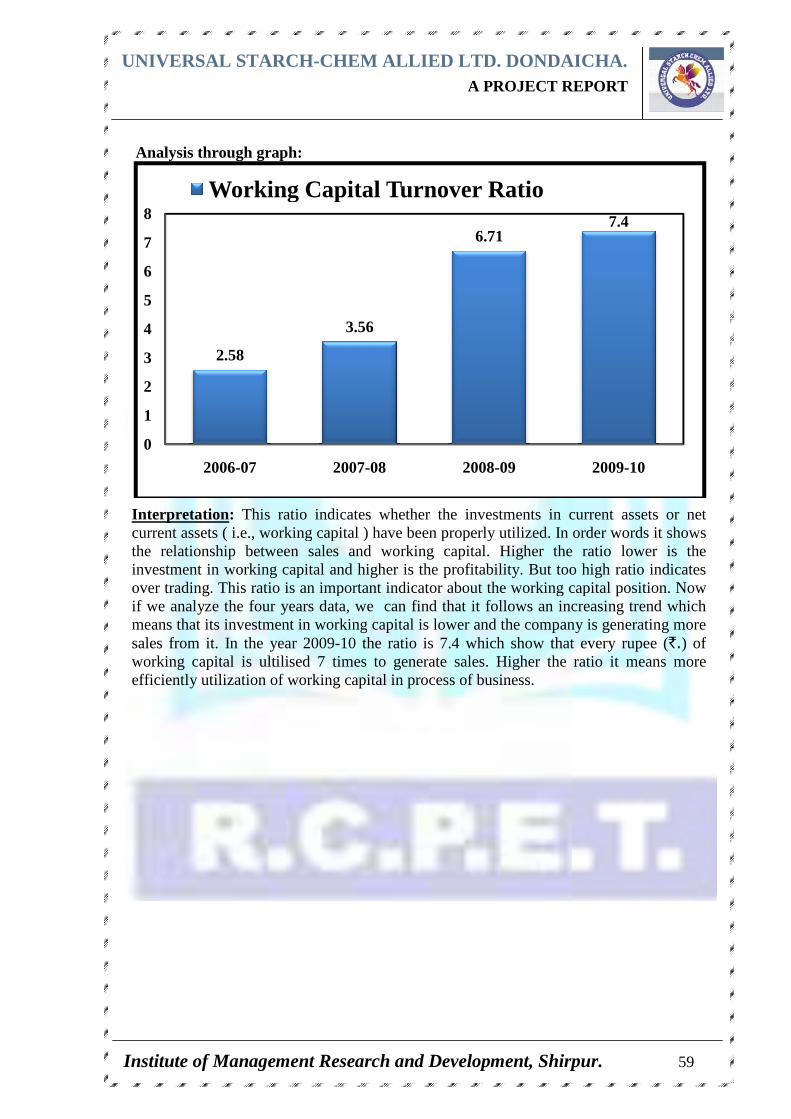
UNIVERSAL STARCH
Institute of Management Research and Development, Shirpur.
Analysis through graph:
Interpretation : This ratio indicates whether the investments in current assets or net current assets ( i.e., workingthe relationship between sales andinvestment in working capital and higher is theover trading. This ratio is an important indicator about the working capitalif we analyze the four years data, we means that its investment in workingsales from it. In the year 2009working capital is ultilised 7 times to generate sales. Higher the ratio it means more efficiently utilization of working capital in process of business.
2.58
0
1
2
3
4
5
6
7
8
2006-07
Working Capital Turnover Ratio
NIVERSAL STARCH -CHEM ALLIED LTD. DONDAICHA A PROJECT REPORT
Institute of Management Research and Development, Shirpur.
Analysis through graph:
This ratio indicates whether the investments in current assets or net current assets ( i.e., working capital ) have been properly utilized. In order words it the relationship between sales and working capital. Higher the ratio lower is the investment in working capital and higher is the profitability. But too high ratio indicates
This ratio is an important indicator about the working capitalyears data, we can find that it follows an increasing trend which
means that its investment in working capital is lower and the company is generating more sales from it. In the year 2009-10 the ratio is 7.4 which show that every rupee (working capital is ultilised 7 times to generate sales. Higher the ratio it means more efficiently utilization of working capital in process of business.
3.56
6.71
2007-08 2008-09
Working Capital Turnover Ratio
DONDAICHA . A PROJECT REPORT
Institute of Management Research and Development, Shirpur. 59
This ratio indicates whether the investments in current assets or net
capital ) have been properly utilized. In order words it shows working capital. Higher the ratio lower is the
profitability. But too high ratio indicates This ratio is an important indicator about the working capital position. Now
find that it follows an increasing trend which wer and the company is generating more
that every rupee (`.) of working capital is ultilised 7 times to generate sales. Higher the ratio it means more
7.4
2009-10
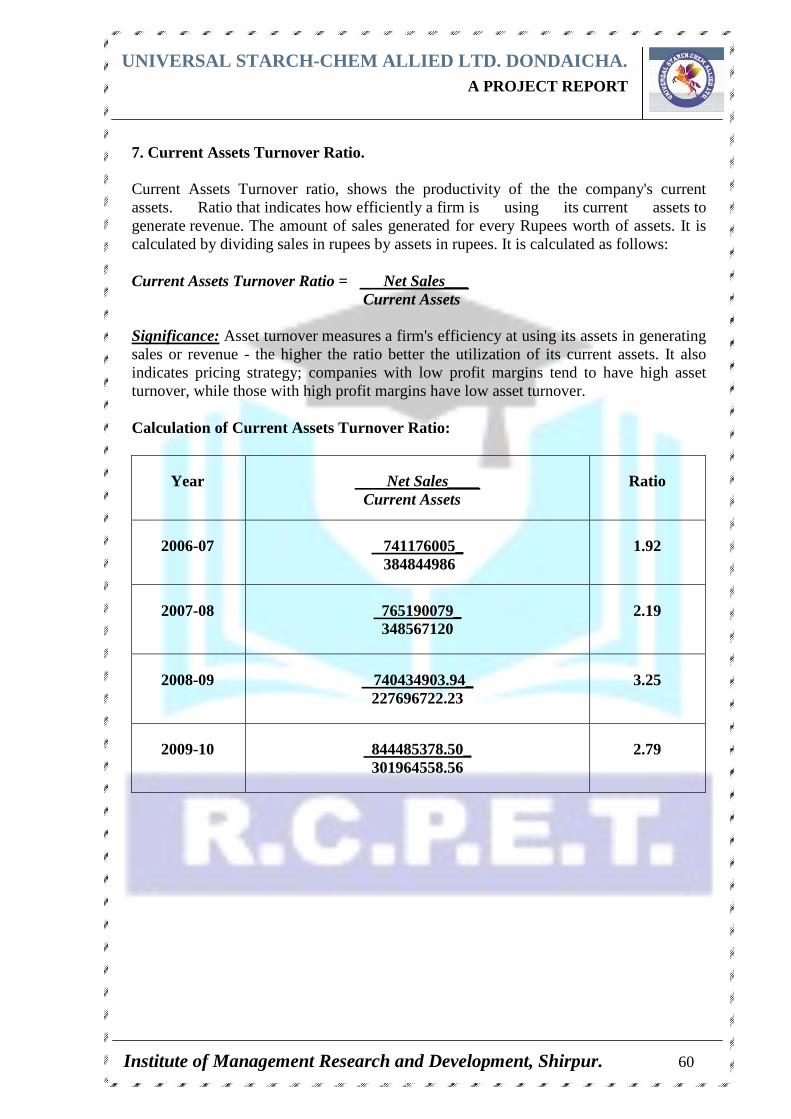
UNIVERSAL STARCH-CHEM ALLIED LTD. DONDAICHA. A PROJECT REPORT
Institute of Management Research and Development, Shirpur. 60
7. Current Assets Turnover Ratio. Current Assets Turnover ratio, shows the productivity of the the company's current assets. Ratio that indicates how efficiently a firm is using its current assets to generate revenue. The amount of sales generated for every Rupees worth of assets. It is calculated by dividing sales in rupees by assets in rupees. It is calculated as follows: Current Assets Turnover Ratio = Net Sales___ Current Assets Significance: Asset turnover measures a firm's efficiency at using its assets in generating sales or revenue - the higher the ratio better the utilization of its current assets. It also indicates pricing strategy; companies with low profit margins tend to have high asset turnover, while those with high profit margins have low asset turnover. Calculation of Current Assets Turnover Ratio:
Year Net Sales____ Current Assets
Ratio
2006-07 741176005_ 384844986
1.92
2007-08 765190079_ 348567120
2.19
2008-09 740434903.94_ 227696722.23
3.25
2009-10 844485378.50_ 301964558.56
2.79
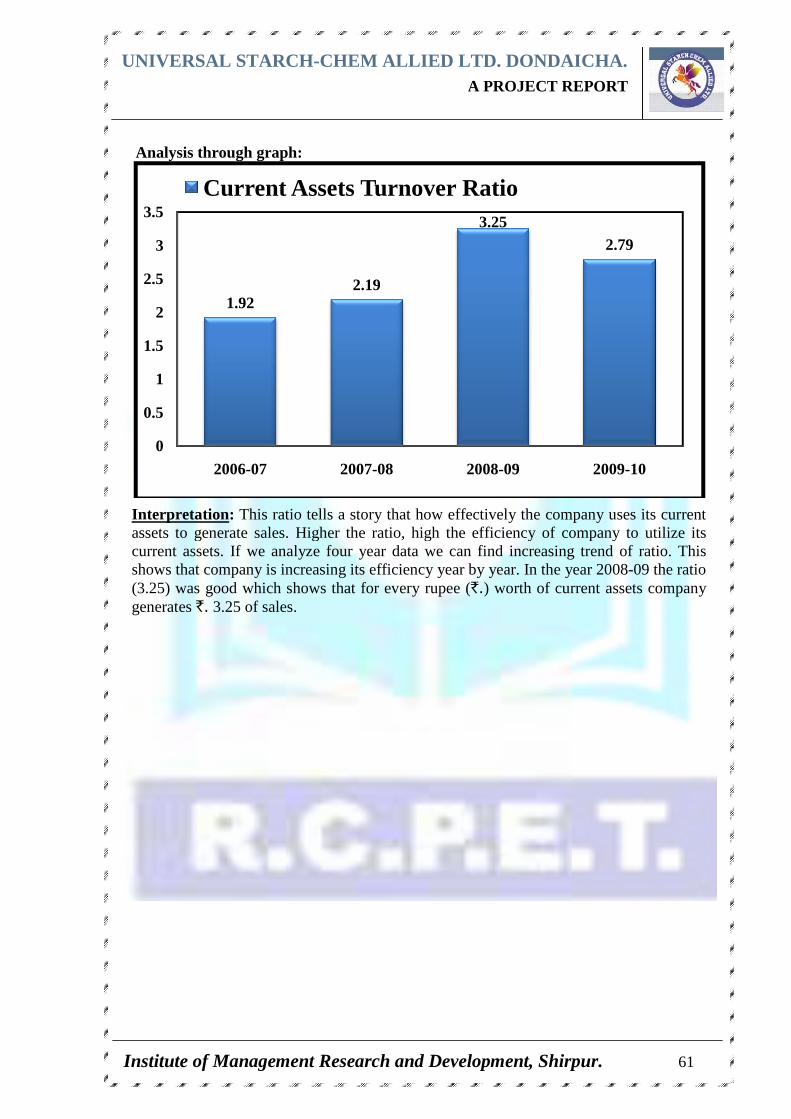
UNIVERSAL STARCH
Institute of Management Research and Development, Shirpur.
Analysis through graph:
Interpretation : This ratio tells a story that how effectively the company uses its current assets to generate sales. Higher the ratiocurrent assets. If we analyze four year data we can find increasing trend of ratio. This shows that company is increasing its efficiency year by year.(3.25) was good which shows that for every rupee (generates ̀. 3.25 of sales.
1.92
0
0.5
1
1.5
2
2.5
3
3.5
2006-07
Current Assets Turnover Ratio
NIVERSAL STARCH -CHEM ALLIED LTD. DONDAICHA A PROJECT REPORT
Institute of Management Research and Development, Shirpur.
Analysis through graph:
This ratio tells a story that how effectively the company uses its current assets to generate sales. Higher the ratio, high the efficiency of company to utilize its
If we analyze four year data we can find increasing trend of ratio. This shows that company is increasing its efficiency year by year. In the year 2008(3.25) was good which shows that for every rupee (`.) worth of current assets company
3.25 of sales.
2.19
3.25
2007-08 2008-09
Current Assets Turnover Ratio
DONDAICHA . A PROJECT REPORT
Institute of Management Research and Development, Shirpur. 61
This ratio tells a story that how effectively the company uses its current
high the efficiency of company to utilize its If we analyze four year data we can find increasing trend of ratio. This
In the year 2008-09 the ratio ) worth of current assets company
2.79
2009-10
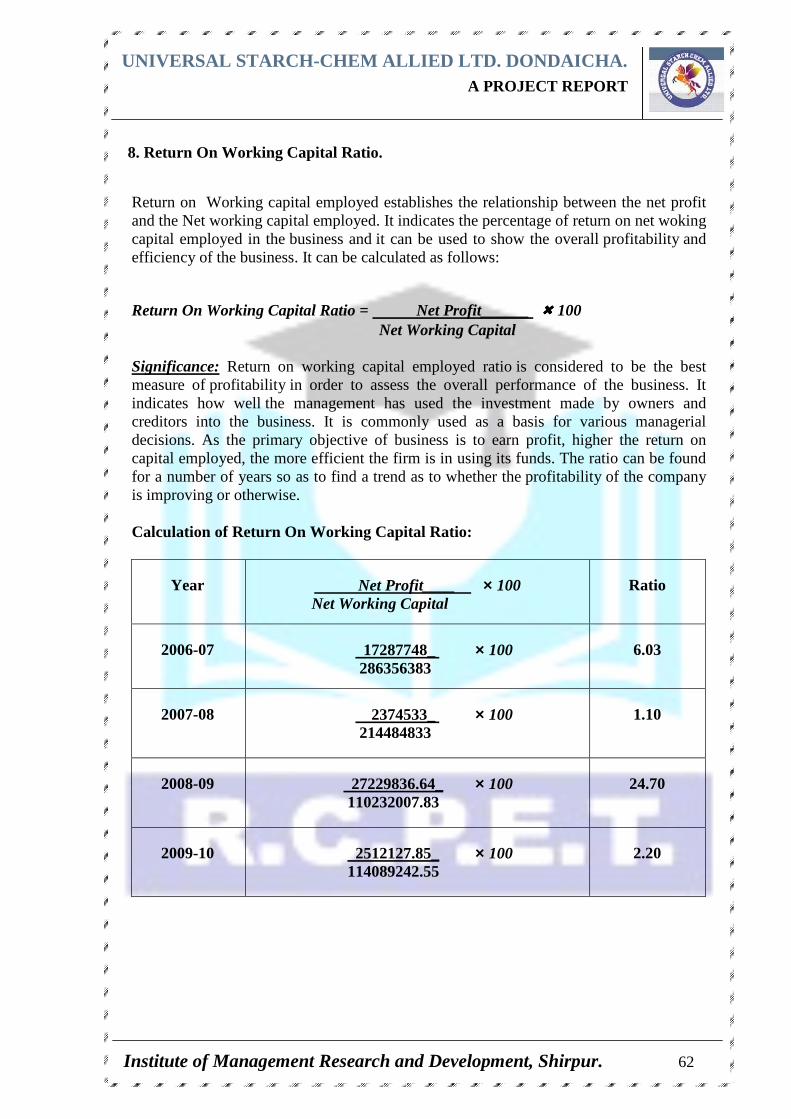
UNIVERSAL STARCH-CHEM ALLIED LTD. DONDAICHA. A PROJECT REPORT
Institute of Management Research and Development, Shirpur. 62
8. Return On Working Capital Ratio.
Return on Working capital employed establishes the relationship between the net profit and the Net working capital employed. It indicates the percentage of return on net woking capital employed in the business and it can be used to show the overall profitability and efficiency of the business. It can be calculated as follows:
Return On Working Capital Ratio = Net Profit______ ×××× 100 Net Working Capital Significance: Return on working capital employed ratio is considered to be the best measure of profitability in order to assess the overall performance of the business. It indicates how well the management has used the investment made by owners and creditors into the business. It is commonly used as a basis for various managerial decisions. As the primary objective of business is to earn profit, higher the return on capital employed, the more efficient the firm is in using its funds. The ratio can be found for a number of years so as to find a trend as to whether the profitability of the company is improving or otherwise. Calculation of Return On Working Capital Ratio:
Year Net Profit____ × 100 Net Working Capital
Ratio
2006-07 17287748_ × 100 286356383
6.03
2007-08 2374533_ × 100 214484833
1.10
2008-09 27229836.64_ × 100 110232007.83
24.70
2009-10 2512127.85_ × 100 114089242.55
2.20
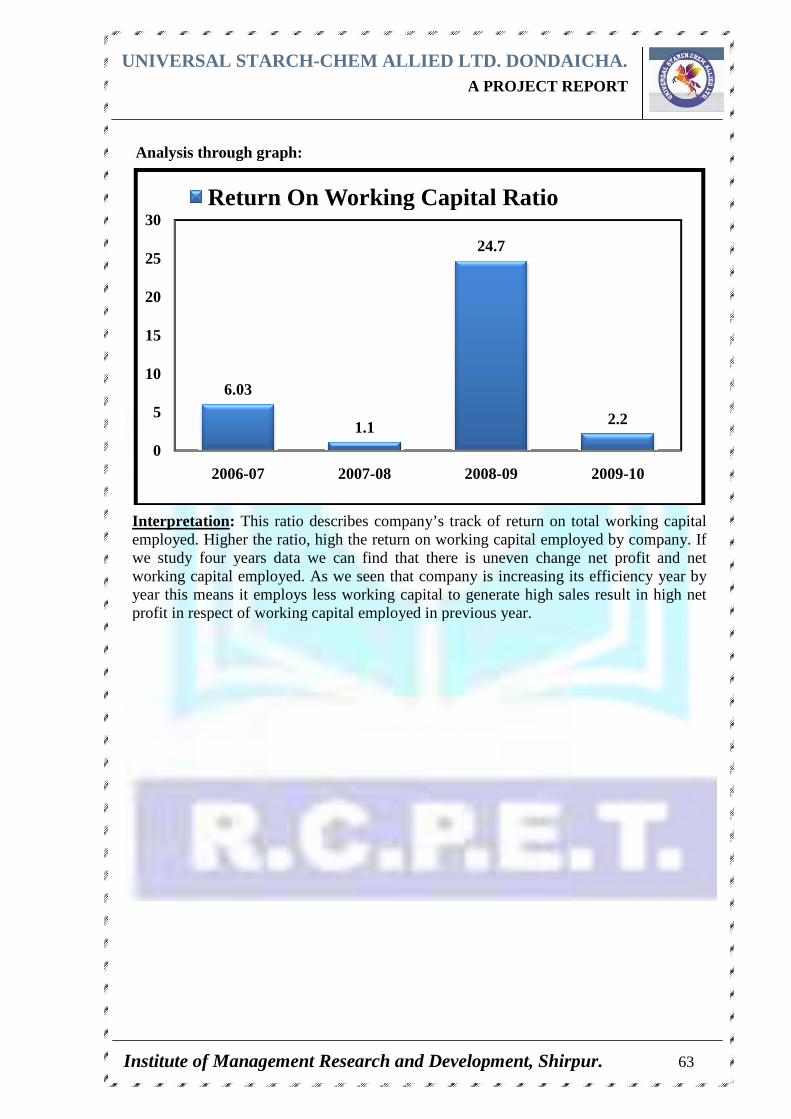
UNIVERSAL STARCH
Institute of Management Research and Development, Shirpur.
Analysis through graph:
Interpretation : This ratio describes company’s track of return on total working capital employed. Higher the ratio, high the return on working capital employed by company.we study four years data we can find that there is uneven change net profit and net working capital employed. As we seen that company is increasing its efficiency year by year this means it employs less working capital to generate high sales result in profit in respect of working capital employed in previous year.
6.03
0
5
10
15
20
25
30
2006-07
Return On Working Capital Ratio
NIVERSAL STARCH -CHEM ALLIED LTD. DONDAICHA A PROJECT REPORT
Institute of Management Research and Development, Shirpur.
Analysis through graph:
ratio describes company’s track of return on total working capital employed. Higher the ratio, high the return on working capital employed by company.we study four years data we can find that there is uneven change net profit and net working capital employed. As we seen that company is increasing its efficiency year by
employs less working capital to generate high sales result in profit in respect of working capital employed in previous year.
1.1
24.7
2007-08 2008-09
Return On Working Capital Ratio
DONDAICHA . A PROJECT REPORT
Institute of Management Research and Development, Shirpur. 63
ratio describes company’s track of return on total working capital
employed. Higher the ratio, high the return on working capital employed by company. If we study four years data we can find that there is uneven change net profit and net working capital employed. As we seen that company is increasing its efficiency year by
employs less working capital to generate high sales result in high net
2.2
2009-10
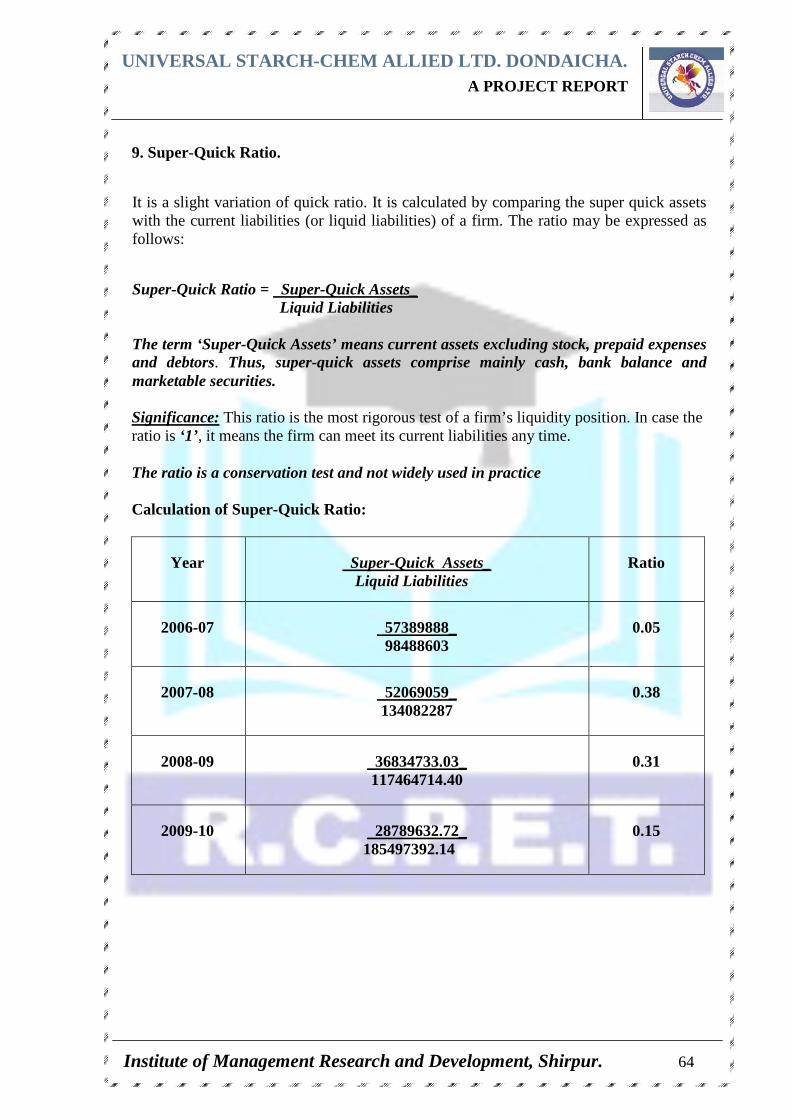
UNIVERSAL STARCH-CHEM ALLIED LTD. DONDAICHA. A PROJECT REPORT
Institute of Management Research and Development, Shirpur. 64
9. Super-Quick Ratio.
It is a slight variation of quick ratio. It is calculated by comparing the super quick assets with the current liabilities (or liquid liabilities) of a firm. The ratio may be expressed as follows:
Super-Quick Ratio = Super-Quick Assets_ Liquid Liabilities The term ‘Super-Quick Assets’ means current assets excluding stock, prepaid expenses and debtors. Thus, super-quick assets comprise mainly cash, bank balance and marketable securities. Significance: This ratio is the most rigorous test of a firm’s liquidity position. In case the ratio is ‘1’ , it means the firm can meet its current liabilities any time. The ratio is a conservation test and not widely used in practice Calculation of Super-Quick Ratio:
Year Super-Quick Assets_ Liquid Liabilities
Ratio
2006-07 57389888_ 98488603
0.05
2007-08 52069059_ 134082287
0.38
2008-09 36834733.03_ 117464714.40
0.31
2009-10 28789632.72_ 185497392.14
0.15
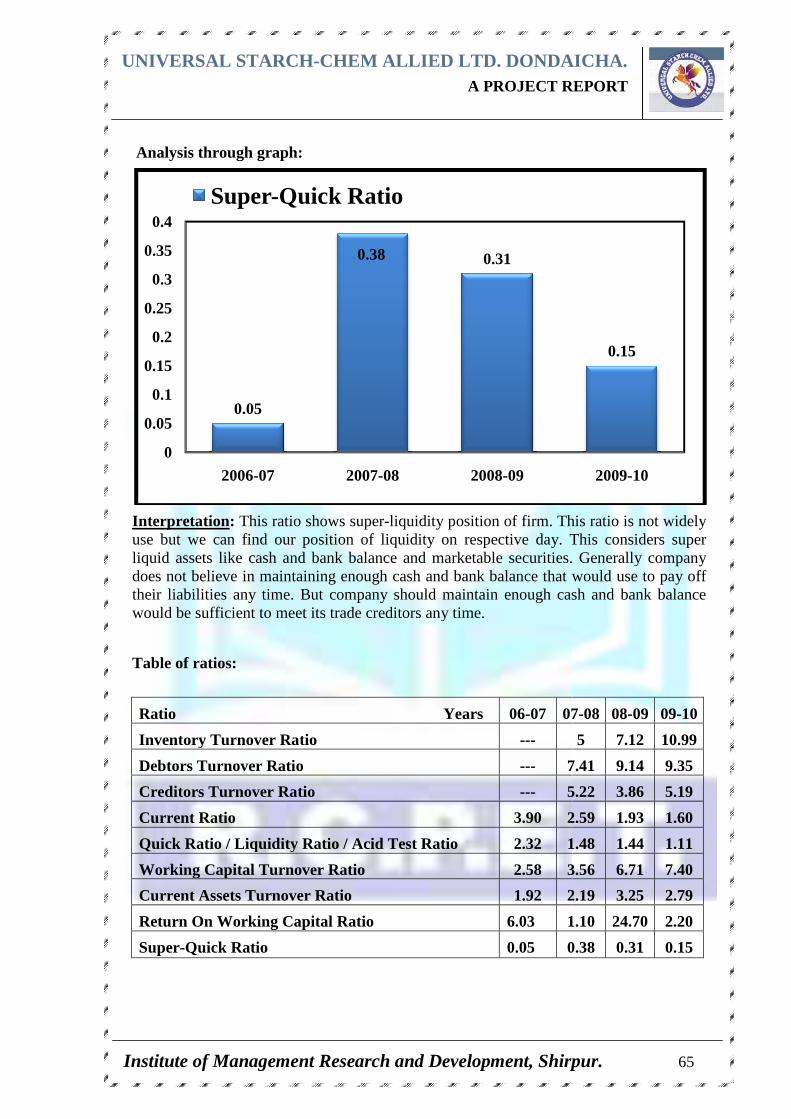
UNIVERSAL STARCH
Institute of Management Research and Development, Shirpur.
Analysis through graph:
Interpretation : This ratio showsuse but we can find our position of liquidity on respective day. liquid assets like cash and bank balance and marketable securities. Generallydoes not believe in maintheir liabilities any time. But company should maintain enough cash and bank balance would be sufficient to meet its trade creditors any time.
Table of ratios:
Ratio
Inventory Turnover Ratio
Debtors Turnover Ratio
Creditors Turnover Ratio
Current Ratio
Quick Ratio / Liquidity Ratio / Acid Test Ratio
Working Capital Turnover Ratio
Current Assets Turnover Ratio
Return On Working Capital Ratio
Super-Quick Ratio
0.05
0
0.05
0.1
0.15
0.2
0.25
0.3
0.35
0.4
2006-07
Super-Quick Ratio
NIVERSAL STARCH -CHEM ALLIED LTD. DONDAICHA A PROJECT REPORT
Institute of Management Research and Development, Shirpur.
through graph:
This ratio shows super-liquidity position of firm. This ratio is not widely use but we can find our position of liquidity on respective day. This considersliquid assets like cash and bank balance and marketable securities. Generallydoes not believe in maintaining enough cash and bank balance that would use to pay off their liabilities any time. But company should maintain enough cash and bank balance would be sufficient to meet its trade creditors any time.
Years 06-07 07
Inventory Turnover Ratio ---
Debtors Turnover Ratio --- 7.41
Creditors Turnover Ratio --- 5.22
3.90 2.59
Liquidity Ratio / Acid Test Ratio 2.32 1.48
Working Capital Turnover Ratio 2.58 3.56
Current Assets Turnover Ratio 1.92 2.19
Return On Working Capital Ratio 6.03 1.10
0.05 0.38
0.38 0.31
2007-08 2008-09
Quick Ratio
DONDAICHA . A PROJECT REPORT
Institute of Management Research and Development, Shirpur. 65
liquidity position of firm. This ratio is not widely
This considers super liquid assets like cash and bank balance and marketable securities. Generally company
aining enough cash and bank balance that would use to pay off their liabilities any time. But company should maintain enough cash and bank balance
07-08 08-09 09-10
5 7.12 10.99
7.41 9.14 9.35
5.22 3.86 5.19
2.59 1.93 1.60
1.48 1.44 1.11
3.56 6.71 7.40
2.19 3.25 2.79
1.10 24.70 2.20
0.38 0.31 0.15
0.15
2009-10
UNIVERSAL STARCH-CHEM ALLIED LTD. DONDAICHA. A PROJECT REPORT
Institute of Management Research and Development, Shirpur. 66
UNIVERSAL STARCH-CHEM ALLIED LTD. DONDAICHA. A PROJECT REPORT
Institute of Management Research and Development, Shirpur. 67
As the project was conducted to analyze the Working Capital Management of
“UNIVERSAL STARCH-CHEM ALLIED LTD. DONDAICHA, ” for the last four
years. During calculations, analysis and making project report I came to some major
finding that are as follows:
Working capital shows a constant decrease every year.
Current ratio is good of the company, which means the company has sufficient assets,
which can be converted into cash to pay the debts when required.
The acid test ratio is just above the standard ratio which is 1:1.
Trade creditors of company are increasing in high proportion with respect to other
liabilities.
The company enjoys good credit period from creditors as compares to credit period
they avail to their debtors.
The working capital turnover ratio is rapidly increasing which shows increase in
efficiency of production
Year by Year Company increasing its turnover in respect to low net working capital.
The debtor’s turnover ratio is found good.
The creditor’s turnover ratio is improving every year.
Cash and bank balances shows decrease every year.
Company is generating better profit on net working capital employed every year.

UNIVERSAL STARCH-CHEM ALLIED LTD. DONDAICHA. A PROJECT REPORT
Institute of Management Research and Development, Shirpur. 68
UNIVERSAL STARCH-CHEM ALLIED LTD. DONDAICHA. A PROJECT REPORT
Institute of Management Research and Development, Shirpur. 69
Working Capital Management, there are mainly three parts they are Cash Management,
Receivables Management and Inventory Management. For optimum use of working
capital, these three parts should be managed properly, for that I would like to give
suggestions to “UNIVERSAL STARCH-CHEM ALLIED LTD. DONDAICHA.”
they are as follows:
Considering the cash management the company should maintain a cash flow budget
every year, considering monthly or quarterly. During the preparation of the cash
budget the credit period should be below 30 days allowed to the customer and
company should held enough cash that it can meet its creditors any time.
Considering the receivables management, certain credit standards and policy should
be established, like:
� Establishment of policy in appointing sales recovery force.
� Cash discounts policy for cash purchases and early payment of debts balance by
customer to be established.
� Credit rating systems to be established.
Considering the inventory management, there should be a fast movement of
inventory, by taking efforts in increment of the sales and inventories should be
maintained considering bulk purchase discount and inflating price of raw material and
according to market forecast to make saving in cost of raw material.
Considering the creditors the management should set a price range for the creditors as
company enjoy good credit.
� The creditors who are paid early should be given a low price.
� The creditors who are waiting for a longer period should be paid more.
UNIVERSAL STARCH
Institute of Management Research and Development, Shirpur.
NIVERSAL STARCH -CHEM ALLIED LTD. DONDAICHA A PROJECT REPORT
Institute of Management Research and Development, Shirpur.
DONDAICHA . A PROJECT REPORT
Institute of Management Research and Development, Shirpur. 70
UNIVERSAL STARCH-CHEM ALLIED LTD. DONDAICHA. A PROJECT REPORT
Institute of Management Research and Development, Shirpur. 71
Bibliography:
� Financial Management: ICAI, (Course-II). � Finance Management & International Finance Management: ICWAI (Course-II). � Financial Management – By Dr.R.M.Srivastava, Pragati Prakashan Meerut. � Financial Management Principles And Practice – By G.Sudarsana Reddy,
Himalaya Publishing House � Financial Manage Management – By P.V.Kulkarni, Himalaya Publishing House. � The Indian Financial System – By Bharati V.Pathak, Dorling Kindersley (India)
Pvt. Ltd. � Advanced Cost And Management Accounting – By V.K.Saxena & C.D.Vashist,
Sultan Chand & Sons. � Investment Analysis And Portfolio Management – By Prasanna Chandra, Tata
Mcgraw Hill Publishing Co.Ltd Reference: � Mr. Ankush Agrawal Sir (9028677070) � Mr. Sachin Surana Sir (9763713291) � Mr. Amul Tamboli Sir (9763356722) Webliograghy: � www.finance.mapsof world.com � www.universalteacher4u.com � www.universalstarch.com � www.investorwords.com � www.investopedia.com � www.businessdictionary.com