Embed Size (px)
Citation preview

Optimized Design of Wood I-joists
Project No. UNB61
Value to Wood No. UNB61
Research Report 2007
by
Ghulam Pirzada Research Engineer
Wood Science and Technology Centre Faculty of Forestry and Environmental Management
and
Ying H. Chui
Director and Professor Wood Science and Technology Centre
Faculty of Forestry and Environmental Management
University of New Brunswick
July 2007
This report was produced as part of the Value to Wood Program, funded by Natural Resources Canada

Optimized Design of Wood I-joists
2
Notice This report was prepared with financial assistance from the Canadian Forest Service, Natural Resources Canada. No part of this report may be reproduced, stored in a retrieval system or transmitted, in any form or by any means, without the prior written consent of the University of New Brunswick If cited in whole or in part, acknowledgement of the source and the authors would be appreciated. Neither the University of New Brunswick nor the authors (or any other persons acting on their behalf) make any warranty, express or implied, or assume any legal responsibility or liability for the completeness of any information, apparatus, product or process disclosed, or represent that the use of the disclosed information would not infringe upon privately owned rights, or represent that the disclosed information is fit for a particular purpose. Any reference in this report to any specific commercial product, process or service by trade name, trade mark, manufacturer or otherwise does not constitute or imply its endorsement by the University of New Brunswick. This report is designed to provide accurate, authoritative information but it is not intended to provide professional advice. If such advice is sought, then services of University of New Brunswick professional could be retained. © 2007 University of New Brunswick All rights reserved.

Optimized Design of Wood I-joists
3
Executive Summary The wood I-joist industry is one of the fastest growing sectors in Canadian forestry in the past ten years. As in the case of any industry, continued product performance improvement and lowering of production cost is the key to maintain competitiveness and expand into new markets. The goal of this project is to generate technical information to assist the industry in addressing these challenges. Specific objectives of this project are:
1. To evaluate the component (flange and web) material specifications currently used by the industry and recommend possible changes leading to material cost saving without negative impacts on common design floor spans.
2. To develop an optimized flange-web joint profile that is less prone to producing manufacturing defects and able to maintain bearing design capacity.
3. To evaluate the technical feasibility of improving I-joist design properties by reinforcing flanges with selected reinforcement material.
To achieve the above objectives, three separate subsubjects were undertaken, each addressing one of the objectives. Through a mathematical modelling approach, Subproject 1 evaluates the theoretical influence of web and flange properties on allowable floor spans. Analysis of results leads to recommendations for potential material cost saving. In subproject 2, the impact of changing the flange-web joint profile to enhance bearing resistance on process efficiency was investigated. The outcome was an optimized flange-web joint profile that is process friendly and maintained the wood I-joist’s structural performance. A laboratory facility was established to fabricate wood I-joists with different flange-web joint profiles. Testing of the laboratory fabricated wood I-joists and numerical modeling work led to a recommended flange-web joint profile. Subproject 3 explores the potential of improving load-carrying capacities of wood I-joists through flange reinforcement so that the product can effectively compete in non-residential floor construction market. A comprehensive literature review led to the identification of fiberglass and selected natural fibers, including Manila hemp and jute, as potential materials to reinforce lumber flange of wood I-joists to increase their stiffness properties. Suitable resins to bond these fibers to wood were also identified. Testing of the fiber-resin composites led to the determination of their mechanical properties, from which the level of improvement in wood I-joist bending stiffness was estimated using a finite element beam model developed in UNB3. The key findings of this project are summarized below. Subproject 1

Optimized Design of Wood I-joists
4
• The only major I-joist design property that is affected by web properties appears to be shear strength. However shear strength of web has little impact on allowable floor spans. Web MOE and shear modulus affect deflection of I-joist, but their overall impact on allowable floor spans is relatively small.
• Using LVL in place of sawn lumber as flange material may be a viable option if the trend of increasing price for sawn lumber flange stock continues.
• For residential applications, allowable floor spans are governed by moment capacity (low grade joists) and stiffness (high grade joists) while bearing strength and stiffness are the critical design properties in commercial applications
Subproject 2
• A flange-web joint profile with a 15mm rout depth and 6° groove slope has the highest resistance against bearing failure, compared to 9mm and 12mm rout depths for the same groove slope degree.
• The current rout depth used by most I-joist manufacturers in Canada is about 12mm, and the industry is interested in reducing the rout depth so that less web material is used and a smaller amount of flange material is removed. Since it was observed in this study that the difference in bearing strengths for 9mm and 15mm rout depths is about 20%, it is possible that a smaller rout depth can be adopted without affecting the allowable floor spans in residential construction. This is possible because bearing capacity rarely governs residential floor designs. It is estimated that if this change is adopted the saving in web material for 9 ½ in deep wood I-joist is about 3%. However, it should be realized that the gripping of web by flange groove is lowered with a 9mm rout depth.
• Presence of pith in flange leads higher scatter in bearing strength values, but it did not lead to lower average bearing strength.
Subproject 3
• The modulus of elasticity of composites made with some relatively low cost fibers such as fiberglass and Manila hemp appears to have an upper bound value of about 35,000 MPa.
• Reinforcing flange of wood I-joist with fiberglass or natural fiber to improve its bending stiffness is feasible but a thickness of 6mm is likely required.
• If fiberglass is used as reinforcement fiber, polyurethane adhesive may provide adequate bond to wood, but not all polyurethanes are suitable.

Optimized Design of Wood I-joists
5
Acknowledgements The University of New Brunswick wishes to acknowledge the financial support of Natural Resources Canada to this research project. Thanks are also due to industry liaisons, Mr. Pierre Audet, Boise Cascade AllJoist and Mr Ken Koo of Jager Building Systems for their donation of test materials, support and technical advice.
Staff - Dr. Y. H. Chui, Project Leader - Dr. Ghulam Pirzada, Research Engineer - Michael Albright, Manager - Andrew Sutherland, Support Staff Supervisor - Dean McCarthy, Chief Technologist - Donny Johnson, Technician - Dave Doherty, Technician

Optimized Design of Wood I-joists
6
1. Introduction The wood I-joist industry is one of the fastest growing sectors in Canadian forestry in the past ten years. The production of wood I-joists in 2004 was estimated to be 1.28 billion lineal feet. Canada is a significant player in the North America wood I-joists industry, especially for joists with solid sawn lumber flanges (80% of market share in North America). Future expansion of the industry will likely hinge on its ability to penetrate into the non-residential floor construction market, for which design loads are generally higher. As in the case of any industry, continued product performance improvement and lowering of production cost is the key to maintain competitiveness and expand into new markets. The goal of this project is to generate technical information to assist the industry in addressing these challenges. Specific objectives of this project are:
1. To evaluate the component (flange and web) material specifications currently used by the industry and recommend possible changes leading to material cost saving without negative impacts on common design floor spans.
2. To develop an optimized flange-web joint profile that is less prone to producing manufacturing defects and able to maintain bearing design capacity.
3. To evaluate the technical feasibility of improving I-joist design properties by reinforcing flanges with selected reinforcement material.
To achieve the above objectives, three separate subprojects were undertaken, each addressing one of the objectives. Through a mathematical modelling approach, Subproject 1 evaluates the theoretical influence of web and flange properties on allowable floor spans. Analysis of results leads to recommendations for potential material cost saving. That subproject was essentially followed by another Value to Wood project UNB76 ‘Influence of OSB web stock properties on performance of wood I-joist’ which commenced in April 2006 and concluded in March 2007. UNB76 supplemented this project by providing a web stock material property data base. Subproject 2 was essentially an extension of an earlier Value to Wood project UNB3 ‘Enhancing shear and bearing strength of wood I-joists’ which was concluded in March 2005. In subproject 2, the impact of changing the flange-web joint profile to enhance bearing resistance on process efficiency was investigated. The outcome was an optimized flange-web joint profile that is process friendly and maintained the wood I-joist’s structural performance. Subproject 3 explores the potential of improving load-carrying capacities of wood I-joists through flange reinforcement so that the product can effectively compete in non-residential floor construction market. Each subproject is discussed separately in this report.

Optimized Design of Wood I-joists
7
2. Subproject 1 - Influence of flange and web properties
on design properties and allowable floor spans of
wood I-joists
2.1 Background
One of the objectives of this project is to evaluate the component (flange and web) material specifications currently used by the industry and recommend possible changes leading to material cost saving without any negative impacts on common allowable floor spans. I-joist producers are generally well aware of the influence of flange mechanical properties such as modulus of elasticity and tensile strength on major I-joist design properties, such as moment capacity and bending stiffness, and the sensitivity of floor spans to changes in flange properties. In contrast, the influence of mechanical properties of web material on design properties is not fully understood. As well, the recent sharp increase in price for common solid sawn flange stock lumber has prompted the industry to look at alternative flange materials such as laminated veneer lumber (LVL) or lumber from sources other than northern Quebec. This subproject focused on the following:
1. Influence of various I-joist design properties on allowable floor spans under residential and commercial loadings.
2. Economics of using commercial LVL grades as flange stock. 3. Influence of web modulus of elasticity (MOE) on bending stiffness (EI) of
joist and allowable floor spans. 4. Influence of web shear modulus on shear deflection factor (K) of joist and
allowable floor spans.
2.2 Results and Analyses

Optimized Design of Wood I-joists
8
2.2.1 Influence of I-joist design properties on allowable floor spans Using a computer program provided by an I-joist producer, an analysis was conducted to study how floor spans under residential and commercial loading are governed by various design properties, and how floor spans are increased by changing certain design properties. The design loadings and criteria are summarized in Table 1. Four cases were evaluated: Case 1 – Residential loading and current design properties of an I-joist producer in eastern Canada. Case 2 - Commercial loading and current design properties. Case 3 – Commercial loading with increased bearing strength (20%). Case 4 – Commercial loading with higher E for flange lumber (2.0E) and increased bearing strength (20%). Table 1 – I-joist characteristics and design criteria used in the analyses. Property / Criterion
Value
Joist : Low grade High grade
2x3 1.4E flange lumber, 241mm (9 ½”) and 302mm (11 7/8”) depths 2x4 1.8E flange lumber, 302mm (11 7/8“) and 457mm (18“) depths
Loading: Residential Commercial
1.9 kPa (L) and 0.73 kPa (D) 4.9 kPa (L) and 0.95 kPa (D)
Flooring 18.5mm thick OSB Joist spacing 305mm (12”), 481mm (19.2”) and 610mm (24”) Deflection limit Span / 360 for LL, span / 240 for DL and 25.4mm maximum (1 inch) Flooring-to-joist connection
Nailed-glued
Presented in Table 2 are the results of the analyses. The spans are rounded to the nearest foot. Results and implication of each case are summarized below.

Optimized Design of Wood I-joists
9
Table 2 – Influence of joist design properties on allowable floor spans under residential and commercial loadings.
Span @ joist spacing*Case Loading
Design property h
Joist grade
Joist depth 12" 19.2" 24" 9.5" 16' 14' 13' Low 11 7/8" 18' 17' 15' 11 7/8" 20' 18' 18'
1
Residential
Current High
18" 26' 23' 22' 11 7/8" 18' 15' 12' 2
Commercial
Current
High 18" 25' 21' 18' 11 7/8" 18' 16' 13' 3
Commercial
1.2 x bearing strength
High 18" 25' 21' 18' 11 7/8" 19' 16' 13' 4
Commercial
2.0E flange and 1.2 x bearing strength High
18" 26' 22' 21' *Colour key indicating property that governs floor span Moment Vibration Bearing Deflection
Case 1 It can be seen that under residential loading the floor spans are largely governed by moment capacity for low grade I-joists and by stiffness (vibration) for high grade I-joists. Bearing strength governs for deep, high grade joist at wide joist spacings. Case 2 When used in commercial applications and under current design properties, low grade I-joists are obviously not suitable since the floor spans are too short. Therefore the results for low grade joists are not shown for all commercial loading cases in Table 2. In general bearing strength or moment capacity governs floor span for high grade I-joists. Case 3 In view of the case 2 results which show that bearing strength becomes critical, in case 3 the bearing strength was increased by 20%. It is noted that with this increase the spans for the deep joist do not change. For the shallow joists the spans for higher joist spacing increase by about one foot. Case 4 In case 4 the flange was upgraded to 2400f-2.0E and the bearing strength was increased by 20%. It is noticed that with these increased properties the spans for close joist spacing is governed by deflection whereas for wider spacing the spans are governed by bearing

Optimized Design of Wood I-joists
10
strength. The longest span achievable with these enhanced design properties is about 26 ft for 18 inch deep joist. This is about one ft longer than case 3 using flange MOE of 1.8E. Based on these analyses the following conclusions can be drawn with respect to influence of current common joist properties on floor spans:
1. Shear strength has a negligible influence on floor design in residential and commercial applications.
2. For residential applications, floor spans are governed by moment capacity (low grade joists) and stiffness (high grade joists).
3. Bearing strength and stiffness are the critical design properties in non-residential applications. Therefore efforts should focus on improving these properties if the wood I-joist industry is to compete in non-residential construction.
2.2.2 Economics of using LVL in place of solid sawn lumber flanges With the increase in product price for dense solid sawn lumber flange material, it is of interest to investigate the economics of using laminated veneer lumber (LVL) in place of the commonly used dense black spruce. In this report the investigation is limited to the most common I-joist size of 302mm depth. The purpose of the investigation is to determine the size of LVL flanges that would provide the same bending stiffness as I-joists with solid sawn lumber flanges. A review of the common bending stiffness values of Canadian I-joist producers showed that bending stiffness of commercially available 302mm deep wood I-joist lies within the range of 800 to 1200 kNm2. Figure 1 shows the relationship between width of I-joist flanges and bending stiffness of I-joist for two grades of 44mm (1 ¾”) thick LVL (1.8E and 2.0E). Based on the relationships expressed in Figure 1, the material cost per unit length of LVL flange material for various bending stiffness values was estimated. The results are shown in Figures 2 and 3 respectively for the two grades of LVL for various LVL product prices, ranging from $14 to $18 per cubic foot. This price range was provided by an industry representative and was the price range for LVL in the last few years. Super-imposed on each figure are unit cost for sawn lumber flange for various finger-joined lumber prices ($/FBM). It should be noted that in order to provide a meaningful comparison the lumber price should incorporate the cost of making finger joints. Figures 2 and 3 can be used by producers to determine when it is economically feasible to replace sawn lumber with LVL flanges.

Optimized Design of Wood I-joists
The text box in Figure 2 illustrates how to interpret the results in Figures 2 and 3. Based on Figures 2 and 3 one can conclude that unless lumber price rises to over $600/FBM, it is uneconomical to replace it with LVL as flange stock for 11-7/8” deep I-joist. Conversely if LVL price rises above $18/ft3, it is not viable to use LVL in place of sawn lumber for the same depth. Similar analyses can be produced for other joist depths and flange sizes.
Width of flange required for a 1.75" (44mm) thick LVL - 11-7/8" deep joist
30
35
40
45
50
55
60
65
800 850 900 950 1000 1050 1100 1150 1200
EI (kNm^2)
Wid
th o
f fla
nge
(mm
)
2.0E1.8E
Figure 1 - Relationship between width of LVL flanges and bending stiffness of I-joist.
11

Optimized Design of Wood I-joists
Price comparison for 1.8E LVL flange
0.4
0.5
0.6
0.7
0.8
0.9
1
1.1
1.2
800 850 900 950 1000 1050 1100 1150 1200
EI (kNm^2)
Flan
ge c
ost p
er li
neal
ft ($
)
$14.0 $15.0 $16.0 $17.0 $18.0
2x3
lum
ber
$700/FBM
$600/FBM
$500/FBM
$800/FBM
Per cu ft
If EI of an I-joist less than 1000 kNm^2, it is cheaper to use LVL in place of sawn lumber if LVL price is $15/ft^3 and lumber price is $800/FBM.
Figure 2 - Flange cost for 1.8E LVL.
12
Price comparison for 2.0E LVL
0.4
0.5
0.6
0.7
0.8
0.9
1
1.1
800 850 900 950 1000 1050 1100 1150 1200
EI (kNm^2)
Flan
ge c
ost p
er ft
($)
$14.0 $15.0 $16.0 $17.0 $18.0
2x3
lum
ber
$700/FBM
$600/FBM
$500/FBM
$800/FBM
Per cu ft
Figure 3 - Flange cost for 2.0E LVL.

Optimized Design of Wood I-joists
2.2.3 Influence of web MOE on bending stiffness of joist Although the presence of web is ignored when using the analytical method to estimate I-joist stiffness property according to ASTM D5055 (2005), it is accepted that web MOE contributes to I-joist bending stiffness. Using an analytical model by Ozelton and Baird (1976), the influence of web MOE on bending stiffness of I-joist was evaluated. The results are summarized in Figure 4. Presented in Figure 4 are results for two joist depths and two joist grades. The web thickness is 9.5mm and its MOE is varied between 1000 MPa and 5000 MPa. The joist stiffness values presented in the y-axis are normalized to the stiffness value with a web MOE value of 1000 MPa for each joist depth and grade combination. Reviewing the results shown in Figure 4, one can conclude that the influence of web MOE on joist stiffness is relatively small. The maximum increase in joist stiffness is about 7%. This translates into a negligible change in allowable floor spans. This 7% increase was achieved with a high flange MOE of 2.0E. In general, as expected, deep joists and joists with flexible flanges benefit more from any increase in web MOE. Additional analyses were also conducted for 12.5mm thick web. It was shown that even with a 12.5mm thick web the improvement in joist stiffness remains small. Therefore it can be concluded that improving joist stiffness through use of larger web MOE is not effective. It also shows that it is possible to reduce specifications on MOE for web stock without negatively impacting on the stiffness properties of I-joist.
13
Increase in joist EI caused by change in web MOE
1
1.01
1.02
1.03
1.04
1.05
1.06
1.07
1.08
0 1000 2000 3000 4000 5000 6000
Web MOE (MPa)
Nor
mal
ized
EI (
1000
MP
a)
9-1/2" - 2.0E 14" - 2.0E
9-1/2" - 1.4E
14" - 1.4E
Figure 4 - Influence of web MOE on joist stiffness.

Optimized Design of Wood I-joists
2.2.4 Influence of web shear modulus on shear factor of I-joist The shear deflection factor (K) of an I-joist influences the deflection of the joist under design load. It is shown by Ozelton and Baird (1976) that K is primarily dependent on shear modulus of web material. It is of interest to estimate the influence of shear modulus on K and how the allowable floor spans are affected by shear modulus. The calculation is based on the procedure given by Ozelton and Baird (1976). The results for 9.5mm thick web are shown in Figure 5. In Figure 5 the calculated shear factor is plotted against web shear modulus for three joist depths. The web shear modulus is varied from 500 MPa to 3,000 MPa. Based on published values, the shear modulus of OSB appears to be between 500 MPa to 1,000 MPa. Also shown in Figure 5 are the K values claimed by most I-joist producers for the three joist depths. It can be noted that K is sensitive to changes in shear modulus, and that the claimed K values agree fairly well with the calculated values. Although shear factor is sensitive to changes in shear modulus, this high sensitivity does not translate into allowable floor span. Additional analyses show that doubling K only changes the floor span by about 1%. As in the case of web MOE, this result shows that it is possible to reduce specifications on shear modulus of web stock without any significant impact on joist deflection behaviour.
14
9.5mm thick web
0
10
20
30
40
50
60
70
80
0 500 1000 1500 2000 2500 3000 3500Web shear modulus (MPa)
Cal
cula
ted
shea
r fac
tor (
x10^
6 N
)
9-1/2"
11-7/8" 14"
Currently claimed K's
Figure 5 - Influence of web shear modulus on joist shear factor.

Optimized Design of Wood I-joists
15
2.3 Summary
1. The only major I-joist design property that is affected by web properties appears to
be shear strength. However shear strength of web has little impact on allowable floor spans. Web MOE and shear modulus affect deflection of I-joist, but their overall impact on allowable floor spans is relatively small.
2. Using LVL in place of sawn lumber as flange material may be a viable option if the trend of increasing price for sawn lumber flange stock continues.
3. For residential applications, allowable floor spans are governed by moment capacity (low grade joists) and stiffness (high grade joists).
4. Bearing strength and stiffness are the critical design properties in commercial applications. Therefore efforts should focus on improving these properties if the I-joist industry is to compete in commercial construction.
3. Subproject 2 - Identification of Optimal Flange-Web
Joint Profile
3.1 Background
It has been shown in UNB3 project that the so-called knife through failure under bearing load is affected by the flange-web joint profile. This flange-web joint profile is also considered to play a critical role in holding the flange and web together during manufacturing. The focus of the present study is on identifying a flange-web profile that optimizes bearing resistance of I-joist and process efficiency. This work is necessary because most wood I-joist producers in Canada use similar flange-web profiles, but contacts with the industry has revealed that the origin of the current profiles is unknown and the industry felt that further optimization taking into consideration these two factors is possible. In order to achieve this objective, a laboratory based facility was considered necessary for fabrication of various flange-web profiles. Following consultations with the industry and results from numerical modeling, apparatus for fabrication 4E - 8E groove slope was commissioned. Groove cutting knives and web profile shapers corresponding to these angles were manufactured by a reputable company.

Optimized Design of Wood I-joists
After some preliminary tests to evaluate the manufacturing facility, a comprehensive test program was conducted. Upon completion of this test program, a large data base for material properties which was used as input in numerical studies and information on bearing resistance and flange-web gripping characteristics of various flange-web joint profiles was established. Based on these tests and numerical modeling results using the model developed in UNB3 project, it was concluded that the 3/8” (9.5 mm) rout and 8E groove slope flange-web profiles be eliminated from any further consideration in this study. It also came to the fore that within the range of 4E - 6E angle and 1/2” (12.7 mm) - 5/8” (15.87 mm) rout depth, a flange-web profile of 6E groove angle and 5/8” (15.87 mm) rout depth was identified as the optimum profile. However, further consultations on this issue with the industry led to a need for fresh tests with regards to shorter rout depths than 5/8” (15.87 mm) from the point of view of reducing web material cost. Accordingly, a new set of tests was started with a 6E groove slope, and 9 mm and 12 mm as primary rout depths while 15 mm rout depth was added only for achieving modeling comparisons. A description of I-joist fabrication, test programs, and improved numerical model is presented below.
3.2 Laboratory I-joist manufacturing facility
The development of a laboratory wood I-joist manufacturing facility was considered necessary in order to provide direct test results for various geometries of flange-web profile and complement the numerical modeling efforts in achieving the goal of searching for an optimal flange-web joint profile. Accordingly high precision groove cutting knives and web shapers were acquired for the manufacturing of desired dimensions for the I-joist specimens. In the following pertinent parts used in manufacturing I-joists are presented.
16

Optimized Design of Wood I-joists
Figure 6 - Grooving knife (L) and web shaper (R) In Figure 6, grooving knife tool is shown on the left and the web shaper cutting tool is shown on the right. These are fitted to the operating machine separately to perform flange stock grooving and web panel shaping respectively.
Figure 7 - I-joist production - (L) Short length fabrication (0.3m) and (R) long length fabrication (2.4m). Shown above in Figure 7 are the assemblies for jointing the web and flange parts with glue and customized squashing pressure to create a 1mm gap between bottom flange groove and web profile bottom. For the first comprehensive test program both short and long clamping devices were used for manufacturing I-joist specimens. However in the case of second test program, only 8 ft (2.4m) long I-joists were manufactured. Some of these 8ft I-joists were cut into smaller length for testing. Every effort was made to ensure that the fabrication specifications (e.g. clamping pressure) in manufacturing laboratory wood I-joists were similar to those adopted by the industry.
17

Optimized Design of Wood I-joists
18
3.3 Test programs
3.3.1 Material Properties: Lumber and OSB The main purpose of establishing a database of material properties is for numerical modelling purposes. For this project it is required for predicting knife-through failure of flange-web joint and for predicting wood I-joist bending stiffness with and without reinforcement material attached to the flange.
Lumber properties In the previous project UNB3, lumber property evaluation was performed to determine mechanical properties in the radial (R) and tangential (T) directions for red pine specimens. In the present study black spruce was chosen for the determination of its mechanical properties in these directions. The main purpose of these tests was to evaluate the properties in R and T directions in concert with the likely direction so that the influence growth ring orientation can be characterized since in UNB3 it was found that knife-through failure load is dependent on growth ring orientation. The same lumber material was also used to fabricate I-joist specimens, which were tested to provide bearing strength data for model verification purposes. The lumber test program is shown in Table 3. The tests conducted were tension perpendicular to grain, compression perpendicular to grain with provision of measuring Poisson’s ratio and cleavage. The specimens for these lumber tests were prepared at the same time and they exhibited a moisture content of about 9%. The flange fracture tests were conducted to compare the properties of 4°, 6° and 8° flange groove slopes. The test results are presented in Tables 4 and 5. Statistical analyses were performed for 10000 simulations using Bootstrap method.

Optimized Design of Wood I-joists
Table 3 – Lumber property test program.
Properties Test method Size (mm) Number of specimens
Tension perpendicular to grain ASTM D143 50 x 64 x 50 17
Compression
perpendicular to grain ASTM D143 (Modified) 63 x 38 x65 10
Cleavage ASTM D143 50 x 50 x 95 11
Flange fracture strength Wedge Method 63 x 38 x 50
4 each for 4Eand 8E an 6 for 6E
Tension and cleavage test Tension and cleavage tests used ASTM D143 (ASTM 1994) test procedures. Results obtained from these tests were used to assess fracture characteristic of the same material. The test results are shown in Table 4. The set-ups for these tests are shown in Figure 8 and 9 respectively. Table 4 – Results for lumber tension perpendicular to grain and cleavage tests.
Property Strength Tensile strength perpendicular to grain 1.58 MPa (0.075)*
Cleavage 1256 N (75) * Value in parentheses is standard deviation.
Figure 8 - Perpendicular to grain tensile test setup.
19

Optimized Design of Wood I-joists
Figure 9 - Cleavage test setup. Compression perpendicular to grain test As far as compression perpendicular to grain test is concerned, some modifications to size specified in ASTM D143 (1994) were introduced. The new dimensions were 63mm x 65mm x 38mm. Also, arrangement was made to measure displacements in the direction of applied load and in a lateral direction. This information was used to estimate Poisson’s ratio. Strains along directions of interest were calculated corresponding to a maximum value of load in the linear range. Incremental displacements did not seem to appear in the range of lower threshold loads, and therefore, computation using existing ASTM guidelines in ASTM E132 (ASTM 2004) of Poisson’s ratios is difficult in this case. Test results are shown in Table 5. The results show a large coefficient of variation of about 43%. This suggests that the recording of displacements should be carried out at least at two different locations in each direction. Figure 10 shows the specimen under compression with clip displacement transducers. Table 5 – Lumber compression test results.
Property Poisson’s ratio MOE (MPa)
Compression perpendicular to grain 0.337 (0.146)* 130.34
(2.99)
* Value in parentheses is standard deviation.
20

Optimized Design of Wood I-joists
Figure 10 - Compression perpendicular to grain test setup. Wedge fracture strength Although part of the lumber test program, results of the wedge strength were used as one of the several tests on laboratory manufactured I-joists to identify an efficient flange web profile. This test will be discussed in the section on laboratory manufactured I-joists.
OSB properties An experimental program for the OSB material was also initiated similar to the lumber test program to expand upon OSB data obtained earlier as part of UNB3 project. The tests performed were as follows:
1. Tensile strength in the two principal axes. 2. Edgewise shear strength in the two principal axes. 3. Compressive strength in the stronger axis. 4. Fracture energy along I-joist span (longitudinal axis)
Representative moisture content obtained from the above specimens was estimated to be 8.2%. Statistical analyses were performed for 10000 simulations using Bootstrap method. Tension test Tension tests were conducted on two groups of OSB specimens obtained from an I-joist manufacturer to estimate the tensile strength of OSB parallel and perpendicular to the face strand directions. Two samples of OSB material were obtained from the industry. These OSB groups were marked A and B. For each sample specimens were prepared for parallel and perpendicular to face strand directions. The test set-up is illustrated in Figure
21

Optimized Design of Wood I-joists
22
11. The test procedure followed Type C of ASTM D3500 (2003). Specimen dimensions were 405 mm in overall length with dove ends measuring 48mm x 67mm, and sloping to 25.4mm at the centre of the length. Six replicates each were used for each face strand direction. Test results are shown in Table 6. It can be noted from Table 6 that the tensile strength parallel to face strand is actually slightly lower than the one for perpendicular to face strand.
Figure 11 – OSB tension test setup.
Table 6 – Summary results of OSB tension tests
Face strand orientation Tensile strength (MPa)
A 13.74 (0.71)* Parallel
B 12.56 (0.69)
A 14.28 (0.55) Perpendicular
B 14.30 (0.74)
*Values in parentheses are standard deviations. Compression test Compression tests were conducted to estimate the compressive strength of OSB parallel to the face strand direction. The test set-up is illustrated in Figure 12. Test specimens were fabricated by gluing three pieces of OSB pieces to form a specimen of dimensions 177mm x 46mm x 29mm in parallel to the face strands. This was done to avoid buckling of specimens during testing. Two LVDTs were attached to both sides of a test specimen to

Optimized Design of Wood I-joists
measure the deformation. Ten replicates were used for the longitudinal face strand direction. From the measured load and deformation data, the compressive strength and modulus of elasticity (MOE) in compression were calculated. Table 7 presents the test results. Table 7 – Results of OSB compression tests.
Face strand orientation
Compressive strength (MPa)
Compression MOE (MPa)
Parallel 19.62 (0.52)* 3071 (89.4)
* Values in parentheses are standard deviations
Figure 12 - OSB compression test set-up
Two-rail shear test Two-rail shear tests in accordance with ASTM D1037 (2006) were conducted to evaluate edgewise shear strengths of OSB parallel and perpendicular to the face strands. Figure 13 shows the shear test set-up. The test specimen size was 254mm x 89mm x 10mm for both face strand directions. Twelve specimens and six specimens were tested for parallel (longitudinal) and perpendicular (transverse) direction respectively. Test results are summarized in Table 8. Table 8 – Results of OSB two-rail shear tests.
Face strand orientation Shear strength (MPa)
23

Optimized Design of Wood I-joists
Parallel 11.91 (0.3)*
Perpendicular 13.68 (0.26)
*Values in parentheses are standard deviations.
Figure 13 - OSB two-rail shear test setup.
Fracture energy The fracture energy data, in evaluating the feasibility of using fracture mechanics approach to predict failure of wood I-joists with a web hole, was obtained for parallel, transverse and 45° directions in UNB3 project. The fracture energy tests conducted followed the same procedure used by Morris et al (1995). Inspection of test results indicated that in their setup the falling branch of the load-displacement response was discontinued immediately after reaching the peak value of loads. This necessitated designing a setup which would give distinct falling branch of the load-displacement curve for the realistic assessment of fracture energy. The test setup used is shown in Figure 14. Ten specimens were prepared following the procedure of Morris et al (1995) and tested. Specimen dimensions were 480mm x 80mm x 10mm with parallel to face strands. Test result is given in Table 9. Table 9 –Results of fracture energy tests.
Face strand orientation Fracture energy (J/m2)
Parallel 2856 (338)*
24 *Value in parentheses is standard deviation.

Optimized Design of Wood I-joists
Figure 14 - Fracture energy test set-up.
3.3.2 Laboratory manufactured wood I-joists – 4 to 8 degree groove slope with ½” and 5/8” route depths Some preliminary tests were conducted in an attempt to narrow down the range of variables in future investigation. To this end, tests were performed on 4° and 8° profiles for each of 1/2” and 5/8” web penetration. Non-glued and glued rolling (sliding) shear tests and wedge bearing tests were conducted. Figures for these test setups are illustrated in the next section where 4° and 6° web-flange profiles will be compared; the only difference lays in the length of specimens in the case of rolling shear tests. Rolling shear specimens for 4° and 8° web-flange profiles were 300mm in length, as compared to 100mm long for 4° and 6° web-flange profiles shown in the next section. The conclusions were:
• In dry rolling shear tests, the 4° profiles consistently showed higher strengths than their 8° counterparts.
• In glued rolling shear tests, the 8° - 5/8” profile showed complex failure mode including necking and tearing, and consequently making rolling shear comparison irrelevant. The 4° - 1/2” depth profile showed higher strength than 8° - 1/2” specimens.
• In bearing strength tests, the 4° - 5/8” depth profile showed about 20% higher capacity than 8° - 5/8” flange-web profile.
Based on the above test results, the 8° groove slope was eliminated from further consideration. Accordingly, a comprehensive test program was subsequently launched for identifying an efficient flange-web profile, focusing on the following variables: 4° and 6° angle of flange groove slope and 1/2” and 5/8” web penetration. Wood I-joist specimens were fabricated using the laboratory set-up developed for this project. The following tests
25

Optimized Design of Wood I-joists
were performed on these laboratory manufactured I-joists. • Glued and non-glued I-joist tensile test • Glued and non-glued rolling (sliding) I-joist shear test • Lumber wedge bearing strength test • Full section and partial section I-joist bearing test • I-joist shear capacity test
All wood I-joist test specimens were 11⅞” deep and 100 mm long. Lumber wedge bearing strength specimens were 50mm x 65mm x 38mm. All test specimens were manufactured in the laboratory. In order to duplicate the manufacturing practice of industry, a pressure of 20-30 psi was used for clamping flange to web and a 1mm bottom gap was maintained in the flange-web joint. Full section, partial section and shear capacity test specimens were cut from laboratory manufactured 8-feet long I-joists. Description of the above tests and discussion of the test results are presented below. Glued and non-glued tension tests The purpose of the tension tests was to obtain an indication of the gripping of the web by the flange groove wedge. This test was conducted both with and without glue. Specimens previously used were 300mm in length while in this case 100mm length was used. Test setup for both glued and non-glued tensile tests is shown in Figure 15. Loading rate for these tests was 0.5mm/min. In the case of non-glued tests, for the 4° flange groove slope, nine and eight tests were performed for 1/2” and 5/8” rout depth respectively. Similarly for the 6° flange groove slope, eight and five tests were conducted for 1/2” and 5/8” rout depth respectively. It was expected that in these dry tests larger angle would show lesser strength and smaller angle would show greater grip. However a review of results shown in Table 9 indicates that the difference in the test values is minimal. For glued tension tests, similar values were obtained for 4° - 1/2” and 5/8” rout depth, and for 6° - 1/2” rout depth. However, higher strength value was achieved for the 6° - 5/8” profile.
26

Optimized Design of Wood I-joists
Figure 15 - Glued and non-glued tensile test setup.
Glued and non-glued rolling shear tests The dry rolling shear test was intended to also provide an indication of the gripping of the web by the flange groove. In this case the force applied tended to slide the web away from the flange groove as shown in Figure 16. The glue shear test provided an indication of the resistance against shear along flange-web joint, which is a potential failure mode for I-joist shear capacity test. The specimen length was 100mm. A loading rate of 0.5mm/min was applied in these tests. In the case of non-glued rolling shear tests specimens, it was observed that the 100mm length specimens tended to fracture prematurely in the neck of the flange-web joint and consequently this part of the rolling shear tests was not pursued any further. In the case of glued rolling shear tests, although fracture at the neck of the flange-web joint did not occur, sliding failure of the web from the flange groove was also not observed either. Shearing resistance for this 100mm length was found to be around 10 kN, which is considered high. From these observations and the test result, it is concluded that most likely the shearing resistance of the studied flange-web profiles is adequate.
27

Optimized Design of Wood I-joists
Figure 16 - Glued rolling shear test setup.
Wedge bearing strength tests Wedge bearing test in an innovative test procedure designed to determine the fracture strength and fracture energy of the flange material in the presence of a flange groove. A 60E angle wedge with tapered edges covered with Teflon sheet was made to provide loading to the top part of the flange groove. A typical flange groove and wedge interaction is shown in Figure 17. Four tests were conducted for each of 4E - 1/2” and 5/8” profiles. Six tests were performed for each 6E - 1/2” and 5/8”. From an inspection of the test results shown in Table 9, the 6E profiles show higher wedge bearing strength values than the 4E profiles.
Figure 17 - Wedge bearing strength test setup.
28

Optimized Design of Wood I-joists
Full section and partial section I-joist bearing tests Full section and partial section I-joists bearing tests were performed in a universal test machine on 100mm long specimens. In order to prevent the unintended failure mode due to possible twisting and out-of-plane deformation two stiffeners one on each side of the test specimen were provided. On each end of the I-joist specimen, an LVDT was provided to record the displacement. In all, eleven tests each were performed for 4E - 1/2” and 5/8” profiles and fourteen tests each were performed for 6E - 1/2” and 5/8”. In addition to full section I-joist tests, partial section I-joist bearing tests were also conducted. Partial section bearing I-joist specimens were obtained by cross-cutting at a point approximately 6mm above the flange-web joint. These tests were included after the observation that during the testing of full depth bearing tests, slight sideway movement of the top flange relative to the bottom flange was observed despite the use of web stiffeners. The use of the partial section was intended to achieve truly knife-through failure load, instead it being influenced by the sideway action of the top flange. In all, five tests each were performed for 4E and 6E - 1/2” and 5/8” profiles. In both test set-ups the universal test machine applied a compressive load at a rate of 1mm/ min. The test set-ups for both test procedures are shown in Figures 18 and 19 below. A review of test results shown in Table 9 indicates that the test loads obtained from partial sections are generally higher than full section, indicating that the full section results were indeed influenced by the side sway of the top flange. The best flange-web joint profile as far as bearing resistance goes is the 6E - 5/8” profile. The other three profiles showed similar bearing strengths.
Figure 18 - Full section I-joist bearing test set-up.
29

Optimized Design of Wood I-joists
Figure 19 - Partial section I-joist bearing test set-up.
I-joist shear capacity test Shear capacity tests were conducted on full length laboratory manufactured I-joists comprising of 4E and 6E flange groove slopes with 1/2” and 5/8” rout depths. The tests were conducted in accordance with ASTM D5055 (ASTM 2005). A bearing length of 102mm (4”) was used and the overall length of I-joist test specimens was 1.32m (52”). Web stiffeners were provided at the loading point and at the supports. The shear capacity test set-up is shown in Figure 20. The testresults are shown in Table 10. From a review of test results it is evident that 6E - 5/8” and 6E - 1/2” profiles exhibited about 15% and 10% higher shear capacity values than 4E - 5/8” and 4E - 1/2” profiles respectively. Also the failure patterns for 6E and 4E
profiles were different. Typical failure patterns are shown in Figures 21 and 22 for 4° and 6° respectively. It was observed that for the 4° profile the first failure was along flange-web joint, leading to vertical fracture line in the web. For the 6° profile, the failure was a classical web shear failure with a diagonal crack. These observations indicate that the 4° groove slope is insufficient to suppress the premature horizontal flange-web joint shear failure.
30

Optimized Design of Wood I-joists
31
Figure 20 - Shear capacity test set-up.
Figure 21 - Failure pattern for 4E profile I-joist.
Figure 22 - Failure pattern for 6E profile I-joist.

Optimized Design of Wood I-joists
32
Table 10 – Summary results of all wood I-joist tests.
4E groove slope 6E groove slope Type of test
½” ⅝” ½” ⅝”
Non-glued 0.158 (0.03)
0.142 (0.017)
0.154 (0.043)
0.136 (0.012) Tensile Strength
(kN) Glued 3.47
(0.07) 3.24
(0.33) 3.32
(0.09) 4.55
(0.26)
Rolling Shear (kN) Glued 10.01 (0.63)
9.07 (0.38)
8.851 (0.48)
9.360 (0.30)
Wedge Bearing Strength (kN) 1.5562 (0.078)
1.245 (0.059)
1.758 (0.163)
1.767 (0.001)
Full section 14.84 (1.09)
13.54 (1.01)
14.01 (0.93)
17.21 (0.83) I-joist Bearing
(kN) Partial section
14.84 (1.24)
16.30 (0.48)
15.03 (1.22)
21.83 (1.24)
I-joist Shear Capacity (kN) 23.13 (0.84)
22.53 (1.06)
25.19 (0.5)
26.78 (0.78)
From an inspection of Table 10 it is clear that the 6° - 5/8” flange-web profile provides the highest bearing and shear strengths. Therefore pending confirmation through finite element modelling, the 6° - 5/8” profile can be regarded as an efficient flange-web profile from the bearing strength perspective. From a process efficiency perspective, it appears that the 4° - ½” profile may be most desirable based on the dry tensile strength (pull out) results, but this difference is not significant statistically. It is known from discussion with the industry that a higher groove angle is preferred for high speed production; therefore, it is believed that the 6° - 5/8” profile is also the most optimum profile from a process efficiency stand-point, compared with others evaluated in this study.
3.3.3 Laboratory manufactured I-joist – influence of growth ring orientation in flange lumber on bearing strength of wood I-joist Background Preliminary key finding, presented earlier for material tests and laboratory manufactured I-joist tests, illustrated that a flange-web profile of 6° groove slope and 5/8” rout depth was the most desirable, within the range of 4° - 6° groove angle and 1/2” - 5/8” rout

Optimized Design of Wood I-joists
depth. While performing lumber wedge tests for evaluation of fracture characteristics in the fourth quarter of UNB61 project, it was realized that presence of pith in a particular orientation with regard to position of bottom flange groove, posed a direct influence upon the angle of the crack emanating from the re-entrant corner of the bottom flange. Accordingly, a comprehensive plan of lumber sample selection was initiated. Four black spruce logs of about 8 feet in length and having diameter of about 16 inches were obtained. A cutting pattern plan was initiated to insure that the 2x3 flange lumber pieces were flat-sawn and evenly distributed over the cross section of a log. Figure 22 shown below displays the cutting pattern for log 1. Similar cutting patterns for the other three logs were used. Once these lumber pieces were sawn, they were first sorted to remove unsuitable sections. The required lengths needed for manufacturing of I-joists were cut. The manufacturing process was completed when 11-7/8” deep I-joists with a groove slope of 6E were fabricated. Three rout depths were included: 9mm, 12mm and 15mm. Figures 24 and 25 demonstrate the three grooved sections with different rout depth and fabricated I-joists respectively. Lumber samples were also selected for material tests.
33
1-J 1-k 1-L 1-M
1-N
1-R
1-Q
1-O
1-P
1-S
1-T
1-V
1-U
16 in.
2x3
1-A
1-F
1-C
1-H
1-G
1-B
1-D
1-E
1-I
Figure 23 - 2x3 sample cutting plan for log number 1.

Optimized Design of Wood I-joists
34
Figure 24 – End view of flange lumber with 9mm, 12mm and 15mm rout depths.
Figure 25 - Laboratory manufactured I-joists.
The fabricated I-joists were tested to identify an optimum flange-web joint profile. This exercise was also be assisted by finite element modeling. The lumber material tests described in this section and previously were performed to provide material property input into the finite element model. In addition the lumber material sampling strategy adopted would allow us to study the influence of presence of pith on bearing capacity of wood I-joists.

Optimized Design of Wood I-joists
35
Test program The test program undertaken for achieving the objective mentioned above includes wood I-joists and auxiliary tests. I-joist tests included glued and non-glued tension on flange-web joint, I-joist bearing and shear capacity tests. Auxiliary tests were lumber wedge fracture tests and compression perpendicular to grain. Tables 11 and 12 summarize the schedule of tests for I-joist and auxiliary test respectively. Table 11 –Wood I-joist bearing, shear and tension tests.
Test Cross-section Flange / Web
(mm)
Length (mm)
Target no. of specimens for each
rout depth Full section without
pith 38x63 / 300x9.5 100 6
Full section with pith 63x38 / 9.5x300 100 6
63x38 / 9x6 100 6 Partial section without pith 63x38 / 9x6 40 6
Bearing test
Partial section with pith 63x38 / 9x6 40 6
Flanges from industry 63x38 / 9.5x300 1321 8 for 9mm and
12mm rout depth only Shear
test Flanges from logs I to
IV 63x38 / 9.5x300 1321 5
Glued flanges 63x38 / 9.5x300 150 6 Flange tension
test Non-glued flanges 63x38 / 9.5x300 150 6
Table 12 - Flange material tests
Test Cross-section (mm) Length (mm) Target no. of
specimens Compression
perpendicular to grain 63x38 65
20
Wedge fracture test 63x38 50 12

Optimized Design of Wood I-joists
Material test results and discussion Compression test perpendicular to grain tests were conducted to determine modulus of elasticity in compression. Previous modelling of knife-through behaviour has revealed that the results are sensitive to this property. The results are summarized in Table 13. Table 13 – Compression MOE test result. Property Average Standard
deviation Modulus of elasticity (MPa)
300 96
Wedge test was an innovative test procedure designed to determine the fracture strength in the presence of a flange groove. A 60° angle steel wedge with tapered edges applies a normal load to the top flange groove edges, as shown in Figure 26. The surface of the wedge was covered with Teflon, a material with a low friction coefficient. Test was performed only for 12 mm deep flange-web profile. Load was applied in a universal test machine at a rate of 1 mm/min. LVDT’s were used for recording horizontal displacement at the top flange groove. The setup arrangement for this test is shown in Figure 26 and the failed specimen is shown in Figure 27. Tests were performed for wedges with and without thin razor cut in the middle of flange groove bottom. A typical load-displacement response is shown in Figure 28. Fracture energy of the material is calculated from the load-displacement response. The test results are shown in Table 14. Table 14 - Wedge fracture test results with an initial crack.
36
Property Average (J/m) Standard deviation (J/m)
No. of specimens
With an initial crack 1466 587 14 Without an initial crack 2816 1099 37
For specimens with an initial crack, it is noted that failure always initiated in the middle of the groove bottom (following the initial cut) and the crack propagated along the longitudinal direction. As expected, the average fracture energy for the group without an initial crack is higher than the group with an initial crack. The high standard deviation could be explained by the influence of orientation of the growth rings (the flanges are not always strictly manufactured in the radial direction) and the distance from the pith. In this wedge fracture energy test, failure began at the flange groove re-entrant corner and then propagated in a direction approximately 45º to the vertical. During the tests, distinct cracking noises were heard as crack line progressed from earlywood to latewood regions.

Optimized Design of Wood I-joists
37
These results were used in predicting the load causing knife-through failure. This test procedure for determining fracture energy was considered more appropriate than the standard tests because the failure mode in this case is similar to knife-through failure.
Figure 26 – Wedge fracture test set-up.
Figure 27 – Failed edge fracture test specimen.
Wedge-Initial-Crack
0
0.2
0.4
0.6
0.8
1
1.2
1.4
0 0.05 0.1 0.15 0.2 0.25 0.3
Displacement (mm)
Load
(kN
)
Wedge-Initial-Crack
Figure 28 - Load-displacement response of a wedge fracture test.

Optimized Design of Wood I-joists
Wood I-joist test results and discussion
Bearing tests Bearing strength assessment of wood I-joists was the major component of this test program. Three different specimen details and two types of flange categories were considered. The three specimen details were: 1. Full depth I-joist with stiffeners; 2. Partial depth consisting of one flange and a short web projection (100mm length); 3. Partial depth specimens consisted of one flange and a short web projection (40mm length). For specimen types 2 and 3 the load was applied on the web, whereas for specimen type 1 the load was applied to the top flange. Figure 29 illustrates the loading arrangements for the 3 groups of specimens. One group of I-joists had flanges that contained pith whereas the other did not. It should be noted that the bearing tests conducted in this project were different from that used by the industry to develop bearing capacity. However the trend observed in this study should still be applicable to bearing strengths determined using the industry method. Table 15 compares the bearing strengths for the two specimen lengths with a partial depth at three rout depths. The results for 40mm length were adjusted to 100mm length by multiplying the measured strength by 2.5. From the test results it appears that the length of specimen does not influence bearing strength since the results from the two lengths were similar. In general bearing strength increases with increasing rout depth.
Stiffener
Clip gauge location
6mm
(a) (b)
Figure 29 – Bearing test loading arrangement for (a) full depth specimen and (b) partial depth specimen.
38

Optimized Design of Wood I-joists
Table 15 - Comparison of bearing strengths (kN) of 100mm and 40mm long specimens without pith (partial depth).
9 mm rout depth 12 mm rout depth 15 mm rout depth Type of specimen Strength
(kN) No. of
specimensStrength
(kN) No. of
specimensStrength
(kN) No. of
specimens40 mm long specimens
10.82 (1.83)*
5 10.50 (1.03)
9 12.31 (2.07)
14
100 mm long specimens
10.33 (0.97)
10 11.30 (1.41)
10 13.04 (1.57)
10
*Values in parentheses are standard deviations Table 16 compares the bearing strengths between full depth and partial depth specimens. All lumber flanges did not contain pith. Table 16 indicates that there is a strong correlation between bearing strengths of full and partial depth wood I-joist. This suggests that the partial depth I-joist specimen is adequate for characterizing bearing strength. Table 16 - Comparison of bearing strength (kN) of full and partial depth specimens without pith (100mm length).
9 mm rout depth 12 mm rout depth 15 mm rout depth Type of specimen Strength
(kN) No. of
specimensStrength
(kN) No. of
specimensStrength
(kN) No. of
specimensPartial depth 100mm long
10.33 (0.97)*
10 11.30 (1.41)
10 13.04 (1.57)
10
Full-depth 100mm long
10.22 (0.97)
22 11.69 (1.30)
24 12.70 (1.61)
14
*Values in parentheses are standard deviations Table 17 compares bearing strengths of wood I-joists fabricated with flanges that contained and did not contain pith. Results in Table 17 include those from both the partial and full I-joist specimens. In both groups the length of specimen was 100mm. Based on the results in Table 17, it appears that the presence of pith did not affect bearing strength. Table 17 - Comparison of bearing strengths of 100 mm specimens with and without pith.
Type of specimens 9 mm rout depth
12 mm rout depth
15 mm rout depth
Without pith 10.26 (0.96)* 11.58 (1.32) 12.83 (1.57)
With pith 10.09 (1.99) 11.79 (1.72) 12.07 (1.98)
39

Optimized Design of Wood I-joists
*Values in parentheses are standard deviations Shear tests The test set-up used to determine the shear strength of wood I-joist was the same as that used by the industry to develop shear capacity. The test set-up is shown in Figure 30. Two groups of specimens were tested. One group was made with 2x3 lumber obtained from an I-joist producer. The second group was made with lumber sawn from logs 1 to 4 described above. The shear test results are shown in Table 18, which do not indicate a dependence of shear strength of wood I-joist on rout depth. The lack of dependence of shear strength on rout depth may be due to the small sample sizes used. Despite a lack of clear trend, it appears that the 9mm rout depth does have the lowest strength. This conclusion is supported by noting the failure modes. From the inspection of the failed specimens it was noticed that failure modes differed between small and large rout depths. Two different failure modes are shown in Figure 31. Essentially for small rout depths the failure mode was predominately along the flange-web joint, whereas for larger rout depths the failure was typically a diagonal crack i.e. the intended shear failure mode. If a rout depth smaller than 9mm was tested, the shear strength would have been lower than those reported in Table 18. These results suggest that the 9mm rout depth is probably the lower bound limit for shear strength for this joist depth.
Figure 30 – I-joist shear test set-up.
40

Optimized Design of Wood I-joists
41
Table 18 - Comparison of shear strengths of wood I-joists with different rout depths. 9 mm rout depth 12 mm rout depth 15 mm rout depth Type of
specimen Strength (kN)
No. of specimens
Strength (kN)
No. of specimens
Strength (kN)
No. of specimens
I-joist made with flanges from industry
11.49 (0.88)*
4 11.44 (0.82)
5 11.42 (0.74)
3
I-joist made with flanges from logs 1-4
11.69 (1.77)
6 13.20 (0.96)
5 12.70 (0.48)
5
*Values in parentheses are standard deviations
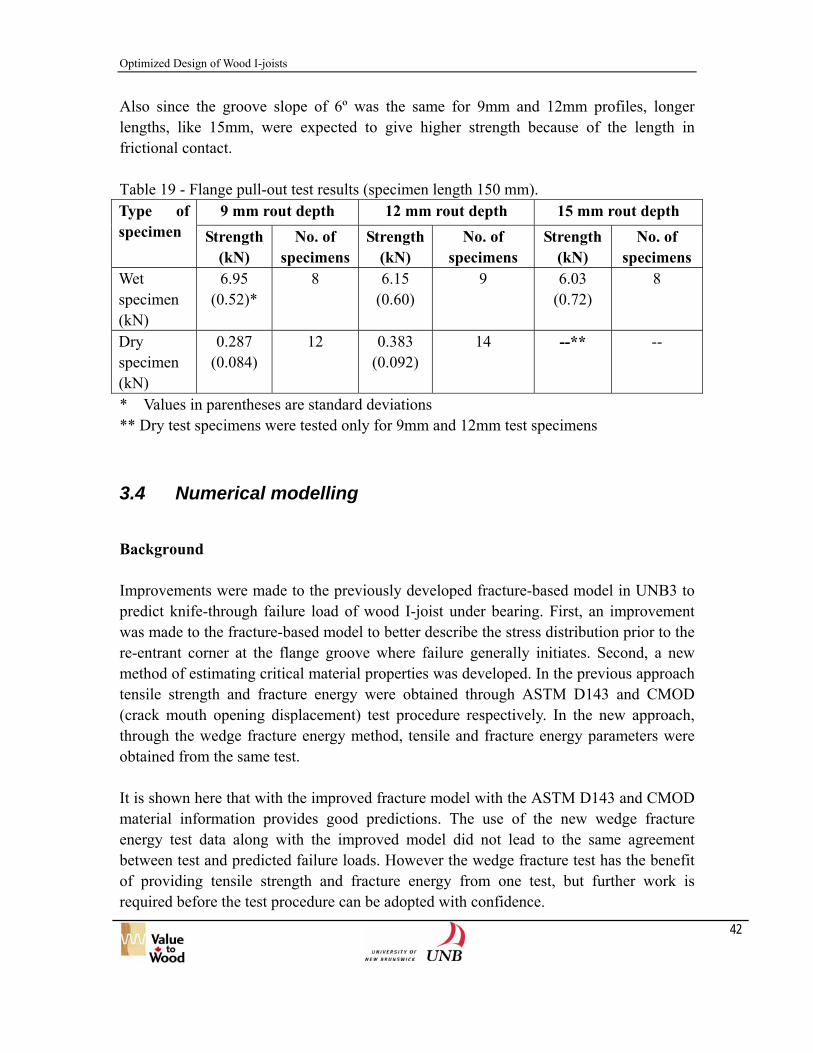
Figure 31 – Failure modes for I-joist shear test : (l) failure along flange-web joint, (r) shear failure in web. Flange pull-out test Flange pull-out tests were conducted with and without glue for the three rout depths. The wet test (with glue) was used to find out if there will be potential separation of flange and web in service. The dry (no glue) test was intended to provide an indication of the gripping of the web by the flange groove. This gripping has a large implication on processing efficiency. Low gripping force implies potential problems with respect to separation of flange and web during manufacturing at high speed before the glue is cured. Table 19 presents results of the flange pull-out tests. The pull-out strength is for a specimen length of 150mm. In Table 19 it can be seen that pull-out resistance decreases with any increase in rout depth. The difference was more pronounced when different flange-web joint profile slopes were analyzed in previous reports. From Table 19, it becomes clear that dry friction increases with any increase in rout depth and there appears a significant difference between 9mm and 12mm mean strengths. Only 9mm and 12mm were chosen for dry test because smaller rout depth is more desirable from material saving perspective.
Optimized Design of Wood I-joists
Also since the groove slope of 6º was the same for 9mm and 12mm profiles, longer lengths, like 15mm, were expected to give higher strength because of the length in frictional contact. Table 19 - Flange pull-out test results (specimen length 150 mm).
9 mm rout depth 12 mm rout depth 15 mm rout depth Type of specimen Strength
(kN) No. of
specimens Strength
(kN) No. of
specimens Strength
(kN) No. of
specimens Wet specimen (kN)
6.95 (0.52)*
8 6.15 (0.60)
9 6.03 (0.72)
8
Dry specimen (kN)
0.287 (0.084)
12 0.383 (0.092)
14 --** --
* Values in parentheses are standard deviations ** Dry test specimens were tested only for 9mm and 12mm test specimens
3.4 Numerical modelling
Background Improvements were made to the previously developed fracture-based model in UNB3 to predict knife-through failure load of wood I-joist under bearing. First, an improvement was made to the fracture-based model to better describe the stress distribution prior to the re-entrant corner at the flange groove where failure generally initiates. Second, a new method of estimating critical material properties was developed. In the previous approach tensile strength and fracture energy were obtained through ASTM D143 and CMOD (crack mouth opening displacement) test procedure respectively. In the new approach, through the wedge fracture energy method, tensile and fracture energy parameters were obtained from the same test. It is shown here that with the improved fracture model with the ASTM D143 and CMOD material information provides good predictions. The use of the new wedge fracture energy test data along with the improved model did not lead to the same agreement between test and predicted failure loads. However the wedge fracture test has the benefit of providing tensile strength and fracture energy from one test, but further work is required before the test procedure can be adopted with confidence.
42

Optimized Design of Wood I-joists
Application of improved fracture model to re-analyse UNB3 test data Fracture mechanics based models were developed in UNB3 to predict initial fracture load causing knife-through failure under bearing in engineered wood I-joists. The agreement between test loads and model predictions was not considered adequate for use in sensitivity analyses to derive an optimum flange-web joint profile. It was necessary to improve the model. A critical review of the model showed that the stress distribution ahead of re-entrant corner of the groove needed to be modeled properly in order to improve the accuracy of the model. A better model was needed to essentially fit an exponential function to the stress distribution generated by the finite element program. The improved stress distribution model has improved the accuracy of the failure load prediction of the model. The measured and predicted failure loads for both tangential and radial growth ring orientations are in good agreement. The validity of the new stress distribution model is assessed using data obtained in UNB3. In UNB3 tensile strength and fracture energy of red pine lumber were measured using ASTM D143 and CMOD methods respectively. Prediction models utilizing improved fracture expressions were applied to previously analyzed cases in UNB3. The expression presented in Equation (1) was used to predict failure loads. The improved stress
distribution model was applied to calculate the resultant force ),( 0xf tσ .
appliedtc
predicted PxfGExF ),(2
2 0
*0 σπ
=
( )
(1)
where
( )[ ] 1
00 )2(),(−
−= πσσ kpxkpxf tt
),( 0xf t
σ denotes resultant reactive force per unit width based on stress distribution over
length 2
*
02
t
c
fGE
xπ
= : is a length parameter representing characteristic material
properties σt = peak tensile stress in bottom flange groove re-entrant corner
ft = tensile strength
Gc = critical fracture energy E* = equivalent modulus of elasticity for an orthotropic material
43

Optimized Design of Wood I-joists
p = ratio of rout depth to flange groove width at top k = model modification factor In UNB3 project, bearing tests were conducted on red pine flange stock, in radial and tangential growth ring directions. Figures 32 and 33 show a comparison of the previously predicted, new predicted and measured failure loads for the radial and tangential specimens respectively. (Note: radial specimens refer to I-joist specimens that had the bearing load applied through the web in the radial direction. Similarly for tangential specimens the load was applied in the growth ring tangential direction.) As can be noted, the improved model provides predictions that are closer to the test failure loads than the previous model. Furthermore, from the inspection of Figures 32 and 33, it is revealed that the radial specimens display a higher load capacity in bearing than specimens with tangential growth rings.
Radial Load Analysis
7
8
9
0
1
2
3
4
5
6
0 0.5 1 1.5 2 2.5 3 3.5
Displacement (mm)
Load
(kN
)
44
RAD-1 RAD-2 RAD-3 RAD-4RAD-5 New-Load Test-Load Prev-Load
5.34 kN5.26 kN
4.47 kN
Figure 32 - Comparison of previously predicted, new predicted and measured bearing failure loads for I-joist made with red pine flanges in UNB3 – radial direction.

Optimized Design of Wood I-joists
45
Tangential Load Analysis
0
1
2
3
4
5
6
7
8
0 0.5 1 1.5 2 2.5 3 3.5 4
Displacement (mm)
Load
(kN
)
TG-1 TG-2 TG-3 TG-4TG-5 New-load Prev-Load Test
5.1 kN4.8 kN4.31 kN
-Load
Figure 33 - Comparison of previously predicted, new predicted and measured bearing
failure loads for I-joist made with red pine flanges in UNB3 – tangential direction. From Figure 32, it can be observed that the average of test crack initiation load, 5.26 kN, gives a very close agreement with the new predicted elastic fracture load of 5.34 kN for radial specimens. Similarly, for tangential test specimens, the average test load of 4.8 kN was close to the predicted load of 5.1 kN. Use of fracture model to identify optimum flange-web joint profile Based on material properties of red pine discussed above, 10mm, 15mm, 20mm and 25mm rout depth in wood I-joist with a web tip width of 3mm, were analyzed in the previous study, UNB3, for identifying a flange-web profile with optimum bearing strength. The wood I-joist model, 42 mm in length, contained 38mm x 63mm lumber flange and a 9.5mm OSB web. Such a study was conducted for both radial and tangential growth ring directions. Because of limitations in the previous model no categorical statement in a confident way could be made regarding identification of an optimal profile. However with the improved model presented above, the same wood I-joist was reanalysed for different rout depths. The analysis results, for radial growth ring direction, are presented in Figure 34.

Optimized Design of Wood I-joists
46
Sensitivity Analysis
4.55
4.6
4.65
4.7
4.75
4.8
4.85
4.9
4.95
5
5.05
5 10 15 20 25
Rout depth (mm)
Load
(kN
)
OPTIMAL
15mmOptimal
Figure 34 – Predicted bearing failure load versus rout depth for 42mm long wood I-joist
with a 38mm x 63mm flange lumber.
From Figure 34 it is clear that the 15mm rout deep wood I-joist section presents itself as an optimal among a group of 10, 15 and 20 mm rout depths. However to make further confirmation of this, an analysis for 25mm rout depth was also conducted. Since the predicted bearing strength for 25 mm rout depth was 4.90 kN, which is greater than the predicted bearing load for 20mm rout depth, an investigation on stress distribution was performed. The stress contours for both cases are presented in Figure 35.
20mm rout depth
25 mm rout depth
Figure 35 – Stress contours for I-joists with 20mm and 25mm rout depths.

Optimized Design of Wood I-joists
From study of stress contours of 10mm, 15mm and 20mm rout depths, it was noticed that the contours maintained the same pattern as that shown in Figure 35 for 20mm rout depth. Inspection and comparison of the results for 20mm and 25mm profiles reveals a marked difference in stress contour patterns. This change in stress pattern beyond 20mm depth appears to be the influence of boundary conditions; interface at bottom flange and the support. A comparative observation of peak tensile stresses occurring at flange groove re-entrant corners of 10mm, 15mm and 20mm rout depths, reveal peak tensile stress of 15.1 MPa, 15.3 MPa and 30.6 MPa respectively. This represents a rapid increase of stresses for deeper routs beyond 15mm deep rout. However, the trend is seen to reverse as rout depth is increased further from 20mm to 25mm. This discrepancy appears to be due to the influence of boundary conditions on modelling results. This is because the distance between flange groove bottom and bottom of the flange being 13mm only, the influence of reaction stresses (roller supports in finite element model) is clearly observable in this case. Based on the study of stress contours, it can be concluded that for 38mm x 63mm flange, rout depths beyond 20mm should not be included in stress analysis in this work. Even though the predicted bearing failure value of 25mm is higher than that of 20mm deep section, 15mm deep section still holds the highest value in resistance against bearing failure. From this perspective the 15mm deep flange-web profile can be regarded as an optimal one among this group. Similar conclusions are also observed for specimens with the tangential growth rings. Application of improved fracture model to analyse test data obtained In the fracture model considered above, two properties namely, tensile strength and fracture energy are required as input. A recently conceived idea, wedge fracture test was developed with a view to provide these two wood properties from a single test. A numerical model was used to calculate notch tensile stress from the peak load data and the load-displacement response provided the fracture energy value. The same fracture mechanics based expression shown in Equation (1) is used here to predict knife-through failure load. This approach was applied to 9mm, 12mm and 15mm rout depth flange-web joint profiles. The material data information for this analysis was obtained for black spruce as described above. As a first step the tensile strength perpendicular to grain was estimated through a combined stress analysis shown schematically in Figure 36. This figure represents a model of the wedge fracture test specimen, with razor thin crack (cut) about 1mm deep in the middle of the flange groove bottom. As for notations in Figure 36, h is the bottom-to-bottom distance between flange and the cut in the flange groove, y is distance from centroid of the shaded part of the flange to the point of load application,
47

Optimized Design of Wood I-joists
and F is a horizontal component of normal reaction due to vertically applied load on the wedge as shown.
48
y
h
F
Normal reaction
Thin razor cut
Figure 36 – Load applied to notched specimen in wedge fracture test.
The notch tensile stress, σnts, is given in Equation (2).
⎥⎦⎤
⎢⎣⎡ +=
hy
AF
stn61σ (2)
where area A = h x b; b is the length of the specimen Based on the wedge fracture tests performed on black spruce flange stock presented above, the following data was used in this analysis. (It should be noted that ft in Equation (1) was substituted by σnts.) Gc = 732 J-m-1, σnts = 5.4 MPa and E* = 246 MPa Based on the above data and other properties, the predicted bearing failure loads were found for 9mm, 12mm and 15mm flange-web joint profiles (6 degree slope). In Table 20, the test and predicted bearing failure loads for these sections are shown.

Optimized Design of Wood I-joists
49
Table 20 - Comparison of test and predicted failure loads under bearing.
Rout depth 9mm Number of tests 12mm Number
of tests 15mm Number of tests
Test strength (kN) 10.26 (0.96)* 32 11.58
(1.32) 34 12.83 (1.57) 24
Predicted strength (kN) 17.22 17.72 18.55
*Values in parentheses show standard deviations From Table 20, although 15mm emerges as the best profile, it is also observed that the predicted loads are much higher than the measured failure loads. This is a very recent idea of deriving tensile strength and fracture energy values by conducting wedge fracture tests and using them for calculating bearing fracture loads through Equation (1). In order to improve upon the value of the predicted results of bearing failure loads, further improvement appears necessary. In particular, attention should be directed to the following:
• A rational approach to empirically determine critical fracture energy from wedge fracture specimens with and without crack (thin razor cut) vis-à-vis with fracture energy from CMOD tests
• A translation from notch tensile strength values (they appear to be high values) to equivalent tensile strength values obtained through ASTM D143 test protocol.
Once these aspects are fully understood, wedge fracture test can be more efficiently used to generate material properties for fracture prediction than ASTM D143-CMOD approach.
3.5 Summary
1. A flange-web joint of 6E groove slope and 15mm rout depth was found to the optimum profile for bearing strength and process efficiency. From a material saving standpoint, a rout depth of 9mm with the same groove slope may be used, but there is a 20% reduction in bearing strength whereas shear capacity is not affected by this change in rout depth.
2. Bearing resistance of I-joist lumber flange increases with increased rout depth. 3. The developed fracture mechanics model can provide reliable estimates of
knife-through failure load, based on geometry of flange-web joint profiles and material properties of flange and web materials.

Optimized Design of Wood I-joists
50
4. Sub-project 3 - Reinforcement methods for enhancing
the structural performance of wood I-joist
4.1 Background
The use of wood I-joists in residential floor construction has reached a high level (estimated to be about 60%) and the industry gas estimated that this market share will reach saturation soon. This has prompted the industry to identify other potential markets. One of these potential markets is non-residential construction. In order for the product to compete adequately in this market, there is a need for the industry to improve the structural performance of the product. One approach is to reinforce wood I-joists with a stronger material. The use of artificial and natural fibers in various engineering applications as reinforcement materials is attracting the attention of researchers and engineers, including those in the wood engineering community. This sub-project is an initial attempt to investigate the use of reinforcement material to improve the stiffness and strength properties of wood I-joists. In order to achieve this objective, initially a focused effort was made to collect all the relevant information about various aspects of reinforcements in the form of a literature review. Potential reinforcement materials were then identified for investigation in this subproject. Preliminary tests were performed on reinforced tensile and shear specimens for strength enhancement determination. Both natural and man made fibers are studied. Details of this subproject are given below.
4.2 Literature Review
Information about engineered I-joists with traditional reinforcements like steel and aluminium, or any other non-traditional reinforcement is almost non-existent in the literature. A simple reason for this is that the manufactured I-joists are primarily used in residential floor systems and that their strength and stiffness are most often adequate to withstand lighter loads and consequently there appears to be no reason to reinforce these I-joists. With the expansion of I-joist product into non-residential construction necessitating the use of larger and deeper cross sections, the potential for previously less likely failure modes, such as shear and bearing, to govern floor design becomes more eminent. Efficient and innovative means of strengthening I-joists to improve upon their mechanical properties would eventually need to be explored to provide resistance against anticipated failure modes and excessive deflections. In the past, timber and glulam beams

Optimized Design of Wood I-joists
51
have been reinforced with traditional metal reinforcements, like steel and aluminium, for enhancing their structural strength. However, with decrease in FRP (Fiber Reinforced Polymers) prices it is expected that the application of FRP products in strengthening and upgrading structural wood products can be a viable option. Besides, with the introduction of NFC (natural fiber composites) a new dimension to the reinforced composites has been added. The terms FRP and NFC more commonly are attributed respectively to synthetic fibers and natural fibers in polymer matrices. Glass, aramid and carbon fibers are covered by FRP and a large class of natural fibers comes under the category of NFC. The use of FRP and NFC could enhance mechanical properties of wood by providing local bridging, confining local rupture and arresting crack opening. The following advantages of using FRP and NFC reinforcing materials are worth noting.
• Enhancement of mechanical properties • Reduction in product weight due to high strength to weight ratio of reinforcing
material • Allowing the use of lower grade of wood
Even though dramatic increases in stiffness and strength have been achieved by these reinforcing techniques, especially in case of FRP, nonetheless there is concern about the reliable performance of wood-reinforced composite interface bond. A weak bond may result in delamination and even premature failure between the adherend and the adhesive causing safety concerns. Therefore understanding the mechanism and modeling of the bond interface is essential in this study. Another issue is concerned with the effectiveness of adhesives in the natural fiber composites (NFC); certain surface treatments are required in advance for the resins to adhere satisfactorily to the fibers, and that this additional effort may pose adverse impact on NFC manufacturing. Since the aspect of strengthening of prefabricated wood I-joists with FRP and NFC is a relatively new concept, research carried out with regards to application of these composites particularly in relation to the wood will be described below. Synthetic fibers Glass fiber, aramid fiber and carbon fiber are the most used fibers in composites. About 90% of all man-made fiber composites produced are comprised of glass fiber. Glass fibers - a blend of sand and kaolin, have high tensile strength and good mechanical properties. Aramid fibers are an organic polymer product, obtained by blending and reaction of aromatic diamines and aromatic diacid chlorides. Aramid fibers have the lowest specific gravity and the highest strength to weight ratio of the main fiber types. Carbon fibers are made by oxidation, carbonization and graphitization at high

Optimized Design of Wood I-joists
52
temperature of high content carbon precursor materials. Carbon fibers have very high tensile strength, high elastic modulus and fatigue strength. Since carbon has superior mechanical properties compared to the other two, naturally it is a more expensive material. The costs in Europe for glass fiber, Aramid fiber (trade name Kevlar) and Carbon fibers are respectively, 2.14-4.28 CAD$/kg, 28.56-49.98 CAD$/kg and 28.56-85.69 CAD$/kg, Andre (2006). A range of CAD$ 6.38/kg to CAD$ 25.52/kg, respectively for glass-FRP and carbon-FRP exists in North America (Dagher 2006). Natural fibers Although a large spectrum of literature in regards to natural fibers exists in published journals around the world, two doctoral theses, Andre (2006) and Sparnins (2006), provide an excellent insight into use of natural fibers in composites. A recent study conducted by Andre (2006) has identified the alternative role of environmentally friendly natural fibers into structural application. These fibers include bamboo, flax, hemp, cotton, wool etc. In a recent study, Sparnins (2006) has concluded that flax fiber composites are the best in properties with the jute taking second place. He also concluded that NFC based on flax fibers can compete with E-glass based GFRP (Glass Fiber Reinforced Polymers) materials in stiffness critical structures. Cost of flax in international market is estimated at about CAD$1.62/kg. In addition, a wide variety of natural fibers including banana and palm tree fibers are also under investigation for use in composites. Due to their chemical nature, plant fibers are hydrophilic; mainly hemicellulose and pectin are very hydrophilic. Since several of the common matrix polymers in composites are hydrophobic in nature, selection of the right resins often is a key challenge in the development of a composite product. Adhesives FRP and NFC based materials consist of high to low modulus fibers embedded in a binder material called matrix. The matrix, a polymeric material, plays an important role of transmitting the applied loads to the fibers. These polymeric materials are organic in nature and can be classified either as thermosetting or thermoplastic. Thermoplastics generally are not as strong and stiff as wood but thermoset resin, a most often used matrix, usually matches the mechanical properties of wood. Polypropylene (PP) is the most popular thermoplastic matrix, also found to be the best for flax. Polyester, vinylester, and epoxy resins are classified as thermosets. Structural retention of bond strength between composites and wood had been frustrating for fabricators for quite a long time. However with the introduction of coupling agents for use as primers on the wood surface, it has to some extent solved this problem. Wood Handbook (Forest Products Laboratory 1999),

Optimized Design of Wood I-joists
53
Davalos (2005) and Lyons and Ahmed (2005) for example have reported that application of Hydroxyl Methylated Resorcinal (HMR) as a primer, used as a coupling agent, on wood surface significantly improved the bond performance. Davalos (2005) further describes resorcinol formaldehyde (RF) as a better coupling agent and can be used as primer on wood surface. Addition of hardeners in epoxies has also shown evidence of increase in bond strength between fibers and epoxy. Rajulu et al (2002) showed an increase in tensile properties of epoxy-glass-mat by adding a hardener and polycarbonate. In the same study, they showed an increase in tensile strength by adding hydroxyl terminated polyester (Rajulu et al 2002). Composite Modeling Specifically, the composites are a reinforcing fiber in polymer matrix. It is well known that fibers, once embedded into a matrix material to form a composite, will behave differently due to interaction between fibers and the matrix. More importantly the penetration of the resin into fiber voids and formation of composite under compression more generally will change the individual properties of constituents in the matrix. The strength and toughness of fiber composites are influenced to a large degree by the properties of the composite interface through which interaction between fibers is realized during composite fracture process. Since the individual properties get blended in a composite, therefore applying simple Rule of Mixtures cannot be validated to estimate tensile strength and modulus of elasticity of the composite. These parameters are often required for input into the model. One such model based on statistical analysis and surviving fiber ratio is addressed in Pan (1995) which provides more realistic appraisal of tensile strength and tensile modulus in a fiber reinforced composite. Details of the concept of surviving ratio, based on gradual breakage of fibers, and use of strength distribution in Weibull form are provided in that paper. Through this model it has been demonstrated that compared with simple Rule of Mixtures model, a much higher composite strength and a stress-strain curve much closer to real situations has been predicted by the proposed model. Besides, fiber volume ratio and length of fibers in a matrix play a very important role in characterizing the mechanical properties of a reinforced composite. Reinforced Composite Research in Structural Timber A number of authors have conducted research on the use FRP material as reinforcement in improving the structural properties of timber beams. A detailed description of the studies on various aspects of reinforcement is presented below. Since widespread use of natural fibers is not reported in regards to timber beam design, NFC’s are not considered

Optimized Design of Wood I-joists
54
in this section. Plevris and Triantafillou (1995) used FRP reinforced beams in a creep study. They used five element creep model for this purpose and reported that the creep behaviour of FRP reinforced wood is primarily dominated by the creep of the wood. They further recommended that among GFRP (Glass fiber reinforced polymer) and CFRP (Carbon fiber reinforced polymer), the latter was the best material for flexural reinforcement of wood. Dagher et al (1996) selected under-utilized eastern hemlock for evaluating influence of FRP reinforcement in tension zone. They observed an increase of up to 56% in strength and up to 37% in stiffness; however, no significant improvement of the flexural strength was reported with high grade glulam beams bonded with FRP. Galloway et al (1996) reinforced southern pine glue-laminated timber through the use of non-stressed and pre-stressed Kevlar (aramid) FRP layers. It was observed that although pre-stressing strengthened the beam in flexure, nevertheless the presence of knots and finger joints undermined this increase. It was also noted that as the pre-stress was increased, the shear strength of the Kevlar-bonded wood decreased. Triantafillou (1998) studied influence of shear reinforcement for wood beams which were reinforced with CFPR in their shear span. This work indicated that a longitudinal placement of fibers is useful as shear reinforcement. Johns and Lacroix (2000) used CFPR and GFPR sheets to reinforce the tension side of sawn timber beams. This experimental study indicated that an increase in strength in the range of 40% to 100% was observed for the weakest beams. These authors reported that the experimental increase in strength was greater than the one predicted by transformed section analysis. Gentile (2000) has proposed bending strength model which is used to estimate the effect of varying GFPR ratios for beams reinforced with GFPR reinforcement. Gentile et al (2002) provided near-surface-mounted, NMS, FRP reinforcement on creosote-treated Douglas fir timber beams. Reinforcement ratios were varied from 0% to 0.82%. An increase of 20% to 50% in flexural strength was observed in beams under investigation. Many types of reinforcement layouts were introduced in their work. Fiorelli et al. (2003) reinforced Pinus Carbea timber beams by using external bonding of FRP sheets on their tension sides. An increase of up to 30% in bending strength was observed in beams with 1% of glass fiber and with 0.4% of carbon fiber. Gifillan et al (2003) have used FRP pultruded strips to reinforce Irish sitka spruce. In their study it was concluded that this particular sitka spruce was suitable for reinforcement which resulted in ductile compressive mode of failure. A time dependent based investigation revealed that the creep deflection of beams was reduced by the addition of tension reinforcement. Svecova and Eden (2004) reinforced Douglas fir timber stringers from a bridge. Some 50 beams were tested with GFPR bars. This study found that by strengthening timber stringers with GFPR reinforcement, ultimate strength of stringers was increased. They also reported a doubling of bending strength when

Optimized Design of Wood I-joists
55
compared with the control beams. Borri et al (2005) have developed numerical models based on linear and nonlinear analyses to estimate failure loads for FRP reinforced wood. On the experimental side they bonded CFPR (epoxy) sheets with different density in the tension area of timber beams. A maximum of 60.3% of flexural strength increase and a maximum of 30% of stiffness increase is reported. Many reinforcement layouts have also been presented in their work. From the above analyses it is evident that the predicted values do not adequately match the experimental results. It is expected that if more realistic expressions presented by Pan (1995) are used in conjunction with above models, closer correlation between experimental and model predictions may be obtained. As far as FRP reinforcement is concerned, in the first instance it was hard to track any regularity of work done throughout the years, particularly in the perspective of the fabricated I-joists. Every researcher used different tools to use reinforcement in entirely different scenarios and also this information is spread over different applications. With the introduction of natural fibers recently, a large selection of reinforcement materials may be available in the future. A pilot test program can be a viable solution to ascertain the extent of influence of reinforcement on I-joist stiffness properties. The following guideline will be very useful for a successful experimental study.
• Thermoplastic matrix is more useful for use with natural fibers from a bonding perspective. For example, Polypropylene (PP) is seen to provide the best combination with flax. However the mechanical properties of thermoplastics are generally low rendering their use in engineering applications.
• Epoxy resin with hardeners, and coupling agent HMR, can be used as primer on the wood surface.
• All debris and dust must be removed from the wood surface and an average of 15 μm roughness height be allowed.
• Extra care must be made in ensuring that during pressing process between composite mix and wood, the resin must not be allowed to be squeezed out and thus weaken the composite. In general a penetration of resin into 3 cells deep is desirable.
4.3 Shear testing of reinforced wood: Natural fibers
Preliminary tests have been conducted to identify suitable natural fibers for reinforcing flange of wood I-joists with a view to improve its moment capacity and stiffness.

Optimized Design of Wood I-joists
Accordingly, three natural reinforcing materials, namely Manila hemp, Jute burlap and Canadian hemp mixed with polyester, were used in this initial test program. Two glues were used to bond these fiber-resin composites to black spruce lumber: phenol resorcinol formaldehyde (PRF) and polyurethane (PUR). Preliminary tests using shear block specimens were conducted to screen out the combinations of glue and fibers that were unsuitable and identify glue/fiber combinations that should be evaluated further. The next step was tension tests on the identified combinations, which will be presented in the next section. The dimensions of the shear block specimens with or without reinforcement are shown in Figure 37.
2 in.
0.75 in. 1.75 in.
2 . 5 in
Figure 37 – Shear block specimen details. The thick black line represents the glue line with or without reinforcement material. The number of replicates for the control solid wood and each glue/fiber combination was four. Six combinations of fiber (3) and resin (2) were tested. Control specimens were also tested in shear for comparison purpose. The shear specimens were prepared with a pressure of 125 psi and clamped for 3 hours in the press. The specimens were then kept in a conditioning chamber for about one week to gain full curing of the glue. Figure 38 shows the fabrication of reinforced and unreinforced specimens in the press. The tests were performed in shear apparatus and a continuous load was applied at a rate of 0.025 (0.6mm)/min.
56

Optimized Design of Wood I-joists
C o n tro l sp ec im en
C a n d ia n h em p + PJ u te
b u r la p M a n ila h em p
Figure 38 – Fabrication of reinforced shear specimen with natural fibers.
The test results are presented in Table 21 below. Results in Table 21 show that Canadian hemp with polyester does not provide any improvement in mechanical properties. Manila hemp and jute burlap seem to have better potential. Also the use of PUR resin leads to a larger improvement in mechanical properties. Further investigations on reinforced flange stock will concentrate on Manila hemp and jute burlap. Table 21 - Shear test results for control and reinforced wood specimens.
Property Control Manila hemp Jute burlap Canadian hemp
PUR glue (MPa) 8.46 (1.26)* 11.33 (0.492) 10.85(1.21) 9.39 (1.67)
PRF glue (MPa) 10.96 (0.43) 9.75 (1.13) 10.39 (0.338) 5.09 (2.02)
*Values in parentheses are standard deviations
4.4 Tension testing of reinforced wood: natural and synthetic
fibers
As described in the section above, from the shear test results suitability of resins was evaluated for further consideration. Further in this direction, as a first step, a program of tension tests was initiated. However, LVDT’s attached on each side, displayed anomalies
57

Optimized Design of Wood I-joists
in the recorded displacement data and therefore a second program of tension tests was performed with the use of an extensometer rather than LVDT’s. Three polyurethane adhesives, namely Purweld645, RUFT-1002 and UX-100 and one phenol resorcinol formaldehyde (PRF), were included in this series of tests. In order to avoid inaccurate extension deformation, thin sugar maple veneers were used as the wood substrate. Natural and fiberglass fibers were immersed in selected resins, spread and sandwiched between two sugar maple veneers, and pressed under recommended pressures and cured in a conditioning chamber for about a week to form tension test specimens. Figure 39 shows dimensions of the tension test specimens.
58
L = 206 mm, B = 56mm, W = 14mm, A = 94mm, C = 25mm
L
B A
B
C W
T
T depends upon total width of reinforcement + wood Figure 39 – Tension test specimen dimensions. Pictures of test specimen before and after trimming are shown in Figures 40 and Figure 41 respectively.
Figure 40 - Tensile test specimen during fabrication.

Optimized Design of Wood I-joists
59
Figure 41 - Shaped tension specimens. Tension tests were performed in a universal testing machine and the load was applied at a rate of 2.54mm/min. The values of modulus of elasticity (MOE) of the wood-fiber-resin composites for various combinations of resin and fiber are shown in Table 22. Table 22 - MOE values of reinforced matrix-wood composites.
Test specimen Number of tests Modulus of elasticity (MPa)
Isoset / Jute 9 11615 (905)*
PRF / Jute 5 11022 (1348)
PRF / Jute - 2 layers 5 10618 (925)
Isoset / Manila hemp 10 11719 (1014)
Isoset / Manila hemp - 2 layers 10 12968 (2036)
PRF / Manila hemp 5 12499 (1543)
PRF / Manila hemp - 2 layers 5 11847 (627)
Purweld 645 / Fiberglass 10 17318 (2799)
RUFT-1002 / Fiberglass 8 15194 (1617)
Isoset / Fiberglass 5 14581 (695)

Optimized Design of Wood I-joists
* Values in parentheses are standard deviations From the results shown in Table 22, it seems that the MOE of the wood-fiber-resin composite is only slightly better than the wood itself, which does not provide opportunity for large enhancement of mechanical properties. Examination of the failed specimens showed that the thermoset resin/natural fiber composite provided very poor bond performance. A possible reason for this, also pointed out in literature review, is that neither advance treatment of natural fiber was performed nor any primer coating was applied on the wood surface. It further appears that the thermoset resin Purweld645 in combination with the fiberglass provided the highest value of modulus of elasticity (MOE) for the wood-fiberglass composite specimen. Value of Purweld 645/fiberglass (without wood) composite tensile MOE obtained from simple Rule of Mixtures through back calculation was about 36,000 MPa. In the simple Rule of Mixtures it is assumed that the modulus of the components under axial load (fibers are assumed parallel) is related by the volume of the fraction of the constituent materials. The following equation is relevant: Ec = Ew Vw + Em Vm ------------------------------------- (3) where Ec, Ew and Em are MOE of combined wood and matrix (resin/fiber) composite, wood and matrix respectively. Vw and Vm are respectively the volume fraction of wood and matrix respectively. With Ec determined from tests and with the known quantities of Ew, Vw and Vm, value of Em can be back calculated. With regards to Purweld 645/Fiberglass-Wood composite, a relatively high value of coefficient of variation (COV) can be observed for MOE. This to a large extent can be attributed to the influence of significant variation in interface bond failures observed in failed specimens. To make a further study on this issue, the supplier, which had provided fiberglass fiber component for this project, was contacted for the supply of an appropriate epoxy resin that bonds well to this particular type of fiberglass. Six specimens were prepared for the new epoxy-fiberglass composite. The average MOE of this epoxy/fiberglass-wood composite was found to be 18093 MPa and a COV of about 5.8%; this average value was greater than the corresponding mean MOE value of the Purweld 645/fiberglass-wood composite. However through back calculation, using simple Rule of Mixtures, a smaller value of MOE for epoxy/fiberglass composite than the corresponding MOE value for the Purweld 645 composite was obtained. This was possible because the epoxy composite was thicker. A further check concluded that the peak failure loads for epoxy/fiberglass specimens were less than that of the corresponding peak loads of Purweld 645/fiberglass specimens. A closer inspection of the failed specimens of epoxy/fiberglass revealed that a cleavage separation had taken place between the
60

Optimized Design of Wood I-joists
reinforced composite and the sugar maple veneer, suggesting that the failure in epoxy/fiberglass composite was predominately wood failure. Typical failed Purweld 645 /fiberglass and epoxy/fiberglass specimens are shown in Figure 42.
Figure 42 - Failure of epoxy/fiberglass/wood specimen (l) and Purweld 645/fiberglass/wood specimen (r). The above results further strengthen the need for the use of an effective primer coating for wood surface to develop stronger interface between wood and the reinforced composite. More commonly and effectively used coupling agent HMR, quoted in literature review, may prove useful in this situation. This was explored along with an epoxy resin in this project and will be discussed below.
4.5 Shear testing of reinforced wood: synthetic fibers
After the tension tests, a program of shear tests was conducted on black spruce with the fiberglass composite made with the two stiffer PUR resins (Purweld 645 and RUFT-1002) identified in the tension test program. This series of shear tests was performed with a view to gain further insight into bond strength between softwood and the fiberglass composites. These tests will help to confirm the type of PUR used in the flexural tests on reinforced wood beams. Since local I-joist industry most often uses black spruce for their flange stock in wood I-joist fabrication, eventually the information gathered from shear and bending tests would be useful for possible use of composites in strengthening wood I-joists. The dimensions and procedure of tests were already discussed in 4.3. Test results are shown below in Table 23.
61

Optimized Design of Wood I-joists
Table 23 - Shear strength of different adhesive/fiberglass composites.
Shear specimen Shear strength (MPa)
RUFT-1002/Fiberglass 7.29 (1.0)
UX-100/Fiberglass 7.53 (0.44)
Purweld 645/Fiberglass 11.47 (1.01)
From these tests once again Purweld 645/Fiberglass is seen to dominate in terms of performance and it will be further evaluated using bending test arrangement as discussed in section 4.6.
4.6 Bending tests with Epoxy/Primer and Purweld 645 resin:
Fiberglass
With the experience gained through the shear and tension tests discussed above, bending tests were performed to evaluate the degree of property enhancement achieved through the use of reinforcement material. Two composites were tested: - Purweld 645/fiberglass - Epoxy/HMR primer/fiberglass. The HMR was composed of 90.43% H2O, 3.4% Resorcinol, 3.79% Formaldehyde (37% in water), and 2.44% NaOH. Bending test specimen dimensions are shown in Figure 43. Typical failure mode of a reinforced beam is shown in Figure 44.
62

Optimized Design of Wood I-joists
63
460 mm
A Mid span load
A
Section A-A
25.4mm
25.4mm
3mm
Fiber
Figure 43 - Bending test specimen dimensions.
Figure 44 - Typical failure mode of reinforced beam.
The load-deflection responses shown in Figure 45 clearly show the influence of adding

Optimized Design of Wood I-joists
64
the reinforcement for enhanced stiffness. From the study of the bending tests, it was possible to compare the slopes of the Purweld 645/Fiberglass, Epoxy/Primer/Fiberglass and bare wood specimens, and compute the stiffness quantitatively. The numerical results are presented in Table 24. It can be noted that the stiffnesses of both the Purweld 645 /Fiberglass and Epoxy/primer/Fiberglass specimens were about 9% higher than bare wood.
Bending-Comparison
0
500
1000
1500
2000
2500
0 2 4 6 8 10 12 14 16
Displacement (mm)
Load
(N) BEND-NAC
BEND-WOODBEND-EPOXY
Figure 45 - Comparison of load-displacement curves from three typical specimens.
Table 24 – Slope of load-deflection curve of test specimen under bending.
Bending specimen (No. of tests) Slope (N/mm)
Bare Wood (10) 194 (49.28)*
Purweld 645/Fiberglass (10) 212 (37.33)
Epoxy/ Primer/Fiberglass (10) 211 (32.5)
* Values in parentheses are standard deviations. Like all previous tests on reinforcement, Purweld 645/Fiberglass has once again been shown to have the best performance. In addition, tension tests were performed on the fiber composite materials. Based on tensile test results and using Equation (3), the fiber

Optimized Design of Wood I-joists
matrix MOE was found to be 34,800 MPa, which was about the same value obtained in previous tests in this project. From this study it has become clear that Purweld 645/Fiberglass has shown a better performance than all other cases studied herein. It was hoped the use HMR primer would significantly increase the stiffness but this has not happened in this case.
4.7 Numerical modeling – Influence of reinforcement MOE on
stiffness of wood I-joists
In this study the focus is on bending stiffness, as it is arguably the most critical structural property for floor application. The work described above indicated that the use of fiberglass-polyurethane composite can produce a composite MOE of about 34,000 MPa. Parallel work conducted by the second author recently in Japan has revealed that similar composite MOE can be achieved with Manila hemp-phenol formaldehyde composite. It appears that this MOE value may well be the upper limit achievable by these relatively low cost reinforcement materials. This study is regarded as a first step towards evaluating the potential and the likely technical issues of using reinforcement material to improve the structural performance of wood I-joists. Obviously it is impossible to examine lots of options for reinforcement in this project due to time constraint. Numerical modeling is used here to provide the industry with some indication as to how wood I-joist bending stiffness is influence by placing a reinforcement layer at the bottom flange. Some researchers have used simple close-form equation based on transformed section approach to estimate the change in bending stiffness. However literature review showed that this approach is too simplistic to estimate the increase in bending stiffness due to the inclusion of a reinforcement layer in the flange. To this end a finite element model, first developed in UNB3 and then refined in this project, is used here. Analyses were performed for two joist sizes (9.5” and 14”) and two reinforcement thicknesses (3mm and 6mm). The material inputs are shown below: Flange - MOE =12,970 MPa, Size = 38mm x 64mm Web - MOE = 10,000 MPa, Shear modulus = 1,000 MPa, thickness = 9.5mm, The physical system modeled is a simply supported beam with third point loading. The spans were fixed at 18 times joist depth i.e. for 9.5” deep joist span = 4.34m and for 14” deep joist span = 6.41m. In the analyses the reinforcement material MOE was varied
65

Optimized Design of Wood I-joists
66
from 10,000 MPa to 60,000 MPa. This MOE range is considered to be the practical range of common reinforcement materials. In the analyses, the deflection of the beam under a unit third point load was calculated. The increase in bending stiffness relative to the bare joist case was then calculated i.e. stiffness ratio. The results are plotted as stiffness ratio versus reinforcement MOE in Figure 46.
Reinforcement at bottom flange only
1.00
1.10
1.20
1.30
1.40
1.50
1.60
0 10000 20000 30000 40000 50000 60000 70000
MOE of reinforcement layer (MPa)
Stif
fnes
s ra
tio
9.5" depth - 3mm layer 9.5" depth - 6mm layer 14" depth - 3mm layer 14" depth - 6mm layer Figure 46 – Stiffness ratio versus MOE of reinforcement material.
It can be seen that the percent stiffness increase is higher for the deeper joist. Obviously a thicker layer performs better than a thinner layer, but the difference in joist bending stiffness is only significant at large reinforcement MOE values. For a company to add costs to reinforce wood I-joists, there needs to be a significant increase in bending stiffness to justify this cost. It will be difficult to provide a threshold value here as it is dependent on a number of factors. Nevertheless for discussion purposes here, a minimum increase of 20% for stiffness is probably a reasonable target to use. Based on this criterion and the results shown in Figure 46, the approximate required reinforcement MOE values for various combinations of joist depth and reinforcement layer thickness are as follows. For 3mm thick reinforcement, required MOE is 50,000 MPa and 23,000 MPa for 9.5” and 14” joist respectively. For 6mm thick reinforcement, required MOE is about 32,000 MPa and 18,000 MPa 9.5” and 14” joist respectively. This indicates that, for example, if the fiberglass-polyurethane composite is used for 9.5” deep joist, a 6mm thick reinforcement layer is required.

Optimized Design of Wood I-joists
67
4.8 Summary
1. The modulus of elasticity of composites made with some relatively low cost fibers such as fiberglass and Manila hemp appears to have an upper bound value of about 35,000 MPa.
2. Reinforcing flange of wood I-joist with fiberglass or natural fiber to improve its bending stiffness is feasible but a thickness of 6mm is likely required.
3. If fiberglass is used as reinforcement fiber, polyurethane adhesive may provide adequate bond to wood, but not all polyurethanes are suitable.
5. Conclusions and Key Findings The major conclusions and key findings from the three sub-projects are summarized below. Subproject 1
• The only major I-joist design property that is affected by web properties appears to be shear strength. However shear strength of web has little impact on allowable floor spans. Web MOE and shear modulus affect deflection of I-joist, but their overall impact on allowable floor spans is relatively small.
• Using LVL in place of sawn lumber as flange material may be a viable option if the trend of increasing price for sawn lumber flange stock continues.
• For residential applications, allowable floor spans are governed by moment capacity (low grade joists) and stiffness (high grade joists) while bearing strength and stiffness are the critical design properties in commercial applications
Subproject 2
• A flange-web joint profile with a 15mm rout depth and 6° groove slope has the highest resistance against bearing failure, compared to 9mm and 12mm rout depths for the same groove slope degree.
• The current rout depth used by most I-joist manufacturers in Canada is about 12mm, and the industry is interested in reducing the rout depth so that less web material is used and a smaller amount of flange material is removed. Since it was observed in this study that the difference in bearing strengths for 9mm and 15mm rout depths is about 20%, it is possible that a smaller rout depth can be adopted without affecting the allowable floor spans in residential construction. This is possible because bearing capacity rarely governs residential floor designs. It is estimated that if this change is adopted the saving in web material for 9 ½ in deep

Optimized Design of Wood I-joists
68
wood I-joist is about 3%. However, it should be realized that the gripping of web by flange groove is lowered with a 9mm rout depth.
• Presence of pith in flange leads higher scatter in bearing strength values, but it did not lead to lower average bearing strength.
Subproject 3
• The modulus of elasticity of composites made with some relatively low cost fibers such as fiberglass and Manila hemp appears to have an upper bound value of about 35,000 MPa.
• Reinforcing flange of wood I-joist with fiberglass or natural fiber to improve its bending stiffness is feasible but a thickness of 6mm is likely required.
• If fiberglass is used as reinforcement fiber, polyurethane adhesive may provide adequate bond to wood, but not all polyurethanes are suitable.
6. Recommendations for Future Work • Material test data obtained through this study can further be exploited for
important decision making in design of I-joists. • Given the random nature of the lumber and web stock properties, future solutions
of I-joist industry lie in use of application of fracture mechanics and probabilistic methods
• Adhesives are an integral part of I-joist manufacture and important component of future use in reinforced I-joist. Nonetheless, their properties are not well known in terms of their interaction with different materials. A great deal of information is needed for the selection of right adhesive for specific applications in the wood I-joist industry.
7. References Andre, A. 2006. Fibres for Strengthening of Timber Structures. Ph.D. Thesis, Department of Civil and Environmental Engineering, Lulea University, Sweden. ASTM. 1990. Standard test methods for structural panels in tension. Designation D3500. American Society for Testing and Materials, West Conshohocken, PA. ASTM 1994. Standard test methods for small clear specimens of timber. Designation

Optimized Design of Wood I-joists
69
D143. American Society for Testing and Materials, West Conshohocken, PA. ASTM. 2004. Standard test method for Poisson's ratio at room temperature. Designation E132. American Society for Testing and Materials, West Conshohocken, PA. ASTM. 2005. Standard specification for establishing and monitoring structural capacities of prefabricated wood I-joists. Designation D5055. American Society for Testing and Materials, West Conshohocken, PA. ASTM. 2006. Standard test methods for evaluating properties of wood-base fiber and particle panel materials. Designation D1037. American Society for Testing and Materials, West Conshohocken, PA. Borri, A., Corradi, M., and Grazini, A. 2005. A Method for Flexural Reinforcement of Old Wood Beams with CFPR Materials. Composites: Part B. 36, 143-153. Dagher, H. J. 2006. Private Communication. Dagher, H. J., Kimball, T.E., and Shaller, S.M. 1996. Effect of FRP Reinforcement on Low Grade Eastern Hemlock Glulams. Proceedings of National Conference on Wood Transportation Structures, Forest Products Laboratory, USDA Forest Service, Madison, WI. Davalos, J.F. 2005. Characterization of Bonded Interfaces for Wood-Fiber Reinforced Polymer Composites. Proceedings of 3rd International Conference on Advanced Engineered Composites, University of Maine, Orono, ME. Fiorelli, J. and Dias, A.A. 2003. Analysis of the Strength and Stiffness of Timber Beams Reinforced with Carbon Fibre and Glass Fibre. Material Research, Vol. 6, No.2, 193-202 Forest Products Laboratory. 1999. Wood Handbook. Forest Products Laboratory, US Department of Agriculture, Madison, WI. Galloway, T.L., Fostad, C., Dolan, C.W., and Puckett, J.A. 1996. Initial Tests of Kevlar Pre-stressed Timber Beams. Proceedings of National Conference on Wood Transportation Structures, Forest Products Laboratory, USDA Forest Service, Madison, WI. Gentile, C. 2000. Flexural Strengthening of Timber Bridge Beams Using FRP. MSc. Thesis, Department Civil Engineering, University of Manitoba, Winnipeg, Manitoba.

Optimized Design of Wood I-joists
70
Gentile, C., Svecova, D., and Rizkalla, S.H. 2002. Timber Beams Strengthened with GFPR Bars: Development and Application. Journal of Composite Construction, Vol. 6, No.1, 11-20. Gilfillang, J.R., Gilbert, S.G. and Patrick, G.H. 2003. The Use of FRP Composites in Enhancing the Structural Behavior of Timber Beams. Journal of Reinforced Plastics, Vol. 22, No.15, 1373-1387. Johns, K.C., and Lacroix, S. 2000. Composite Reinforcement of Timber in Bending. Canadian Journal of Civil Engineering, 27: 899-906. Morris, V., Gustafsson, P.J., and Serrano, E. 1995. The Shear Strength of Light-Weight Beams With and Without a Hole - A Preliminary Study, Wood Mechanics, COST, ISSN 1018-5593. Ozelton, E. C. and Baird, J. A. 1976. Timber Designers’ Manual. Granada Publishing Ltd, London, UK. Pan, N. 1995. A detailed Examination of the Translation Efficiency of Fiber Strength into Composite Strength. Journal of Reinforced Plastics and Composites, Vol. 14, No. Pleris, N., and Triantaflou, T.C. 1995. Creep Behaviour of FRP-Reinforced Wood Members.” Journal of Structural Engineering, Vol. 121, No. 2, 171-185 Rajulu, A. V., Rao, G.B., Reddy, R. L., Balaji, P. J. He, J. and Zhang, J. 2002. Tensile Properties of Glass-mat Reinforced Polycarbonate Toughened Epoxy Composite. Journal of Reinforced Plastics and Composites, 21(06), 577-582. Sparnins, E. 2006. Mechanical Properties of Flax Fibers and their Composites. Ph.D. Thesis, Department of Civil and Environmental Engineering, Lulea University, Sweden. Svecova, D., and Eden R. J. 2004. Flexural and Shear Strengthening of Timber Beams Using Glass Fibres Reinforced Polymer Bars - An Experimental Investigation. Canadian Journal of Civil Engineering, 31: 45-55. Triantaflou, T.C. 1998. Composites: A new possibility for the Shear Strengthening of Concrete, Masonry and Wood. Composite Science and Technology 58: 1285-1295