Embed Size (px)
Citation preview

Project Management Skills
PMI Certification
Jeff Hutchinson Instructor Notes
May 26, 2011


Project Management Skills Lesson Plan 2,3,4 Day Format
Table of Contents
Chapter 1 - Project Management Introduction (Day1, 9:00a) 13 1.1 History of PM ......................................................................................................... 13
Class Question A – PMI Certification .................................................................. 13 1.2 What is Project Management .................................................................................. 14 1.3 What is a Project? ................................................................................................... 14
Class/Group Project #1 – Identify Project ............................................................ 14 Class Question B – Most Important PM Skill (Reference JM2P14) .................. 15
1.4 The Team ................................................................................................................ 17 1.4-1 Sponsor ............................................................................................................ 17 1.4-2 Project Manager ............................................................................................... 18
Handout01-PMSkills (Future Development) ........................................................ 18 1.4-3 Core Team ....................................................................................................... 18 1.4-4 Extended Team Members ................................................................................ 19 1.4-5 Shareholders .................................................................................................... 19 1.4-6 Functional Managers ....................................................................................... 19 1.4-7 Matrix Organizations ....................................................................................... 20
Class Question C – How to run a meeting? .......................................................... 20 1.5 Project Management Initiation Decision Questions ............................................... 21
Handout04 – PM Initiation Decision Questions –Short Version.doc ................... 21 1.6 Project Management Framework ............................................................................ 21
Class Question D - Re-tooling of the mfg line assignment .................................. 22 Class Question E - How do you judge success? ................................................... 22 Handout02 - Issues related to a Project Manager.doc ........................................... 22 Class Question F - Public Works Projects ............................................................ 23 Handout03 - Major Causes of Overruns.xls ......................................................... 23
1.7 Project Management Processes Groups .................................................................. 23 1.7-1 Project Management Process Groups: ............................................................. 23 1.7-2 Process Group Effort ....................................................................................... 24
1.8 Knowledge Area Processes ..................................................................................... 24 Class Question G - Policy Statement No Red Markers ........................................ 25
Chapter 2 – Initiating the Project (Day1, 10:30a) 25 2.1. Develop Project Charter ......................................................................................... 25
2.1-1 The Project Charter Statement (EK26) ............................................................ 25 2.1-2 Feasibility Analysis ......................................................................................... 26 2.1-3 Cost benefit Analysis ....................................................................................... 26 2.1-4 Scoring and rating system (PMI20) ................................................................. 27
Class Question H – Using the Delphi technique to make a decision. ................... 27 Class Question I – Creating and Effective Charter ............................................... 27

2.1-5 Project Charter Guidelines PMI20/21 ......................................................... 27 2.2 Develop Preliminary Project Scope Statement ....................................................... 28
2.2-1 What is scope? ................................................................................................. 28 2.2-2 Preliminary Project Scope Statement (PMI28) ............................................... 28
Handout07 - Initiating Process Group.doc ............................................................ 28 Class/Group Project #2 – Creating a Project Charter ........................................... 28
2.3-3 Project Charter Example .................................................................................. 29 Handout – Project Charter Complete Description ................................................ 30 Computer Training #1 - Overview (approximately 40 min) ................................ 31
Chapter 3 - Develop Project Management Plan (Day2, 9:00a) 31 Class Question J – Faced with difficult team decisions ........................................ 31
3.1 Project Management Methodology ......................................................................... 32 EngHandout1-Levels of CMM.doc ...................................................................... 32
3.2 Project Management Life Cycle ............................................................................. 32 3.3 Project Portfolios .................................................................................................... 33 3.4 Project Governance ................................................................................................. 33 3.5 Product vs Project Management ............................................................................. 33 3.6 Project management Plan Guidelines : (Reference PMI35) .................................. 33
Class Question K – Elements in the Project Management Plan ........................... 33 Class/Group Project #4 – Creating the Project Management Plan ....................... 33 Computer Training #2 – Input and Organizing Tasks (approximately 50 min) ... 35
Chapter 4 – Project Scope Management36 4.1 Scope Planning....................................................................................................... 36
Class Question L – Scope Management Plan ....................................................... 37 4.2 Scope Definition .................................................................................................... 38
Figure 2 – Defining the external aspects of the Scope definition. ........................ 38 Class Question M – Scope Definition ................................................................... 39
4.2-2 Team Meeting to define scope ......................................................................... 39 Class Question N – Scope Definition Meeting ..................................................... 40
4.2-3 How to create a Scope Statement .................................................................... 40 Class/Group Project #3 – Creating the Scope Statement ...................................... 40 Class Question O – Creating an Effective Project Scope ..................................... 41
Chapter 5 – WBS/Activities................ 41 5.1. Activity (Task) Definition ...................................................................................... 43
5.1-1 Rolling Wave Estimate .................................................................................... 43 5.2 Duration Types........................................................................................................ 44 5.3 Steps to create an activity list .................................................................................. 44 5.4 Activity Duration Estimating ................................................................................. 45
5.4-1 Resource availability ....................................................................................... 45 5.4-2 Actual estimating technique ............................................................................ 45
Group Exercise #5A – ROM Estimates (ROM=Rough Order magnitude) ......... 45 Class/Group Project #6 – Add estimated durations and milestones ..................... 46
Chapter 6 – TIME Management ......... 47 6.1 Activity (Tasks) Sequencing .................................................................................. 47
6.1-1 Task Relationships ........................................................................................... 48 6.1-2 Lead and Lag Time .......................................................................................... 48

6.2 Dependency Diagrams ............................................................................................ 48 6.2-1 Activity of Node or Precedence Diagramming Method (PDM) ...................... 48 6.2-2 Hammock Activity .......................................................................................... 49 6.2-3 Conditional Diagramming method .................................................................. 49 6.2-4 Graphical evaluation Review Technique (GERT) ........................................... 49 6.2-5 Logic Diagram ................................................................................................. 51 6.2-6 Gantt Bar Chart ................................................................................................ 51
Class/Group Project #7 – Develop a Network Diagram ....................................... 51 6.3 Schedule Development - Critical Path Method ..................................................... 51
Class/Group Project #9 – Critical Path Method (CPM) ........................................ 52 Computer Training #4 – Linking, Lead, Lag, Constraints .................................... 52 Computer Training #5 – Pert Estimating .............................................................. 53 Computer Training #6 – Critical Path ................................................................... 53
Chapter 7 – Resource Assignments .... 53 7.1 Activity Resource estimating .................................................................................. 53
Handout09-Responsibility and Assignment Matrix (RAM) ................................. 54 7.2 Make Assignments .................................................................................................. 54
Class/Group Project #8 – Add resources .............................................................. 54 Computer Training #5 – Resources ...................................................................... 56
7.3 Leveling .................................................................................................................. 57 7.3-1 Leveling Strategies (Open House8) ................................................................. 58
7.3-1a Leveling ..................................................................................................... 58 7.3-1b Adding Hours Manually ............................................................................ 58 7.3-1c Add More Resources ................................................................................. 58 7.3-1d Change Relationship .................................................................................. 58 7.3-1e Lead/Lag .................................................................................................... 59 7.3-1f Lead/Lag ..................................................................................................... 59 7.3-1g Split Task ................................................................................................... 59 7.3-1h Reassign Resources ................................................................................... 59 7.3-1i Overtime Allocation ................................................................................... 59 7.3-1j Reassign Resources .................................................................................... 59
Chapter 8 – COST Management ......... 60 8.1 Cost Management Plan ........................................................................................... 60 8.2 Cost Estimating ....................................................................................................... 60
Computer Training #9 - Cost Estimating .............................................................. 63 8.3 Cost Budgeting (Combine w/12) ............................................................................ 63
Computer Training #10 – Cost Budgeting / Baseline ........................................... 64 Class/Group Project #?? – Budgeting ................................................................... 64
8.4 Cost Control ............................................................................................................ 64 Chapter 9 - QUALITY Management .. 65
9.1 Quality Management Plan ....................................................................................... 66 9.2 Quality Planning ..................................................................................................... 66 9.3 Quality Assurance ................................................................................................... 68 9.4 Quality Control ....................................................................................................... 69
Question Q – Web Development Project .............................................................. 71 Class/Group Project #10 – Add Quality Mgt to Schedule .................................... 71

Chapter 10 – Human Resource Management 72 10.1 Human Resource Planning .................................................................................... 72 10.2 Organization Structure .......................................................................................... 73 10.3 HR Involvement .................................................................................................... 75 10.4 Motivation Techniques ......................................................................................... 75
Instructor Question R – How do you Reward a Superstar on team? .................... 75 Handout16 – HR Matrix Organization (Optional) ................................................ 79 Instructor Question S – What information in contained in a status report? .......... 79
Chapter 11 – Communications Management 80 11.1 Communications Planning .................................................................................... 80 11.2 Information Distribution ....................................................................................... 80 11.3 Performance Reporting ......................................................................................... 80 11.4 Stake Holder communication ................................................................................ 80 11.1 Communications Planning (Reporting) ................................................................ 84
Class/Group Project #11 – Define types of reports needed .................................. 84 Handout - MS Project reports available (Need to generate) ................................. 84
Chapter 12 – Planning the Project RISK Management (Day4,9a) 85 12.1 Risk Management Planning .................................................................................. 85
Class/Group Project #12 - Risk Management ....................................................... 87 12.2 Risk Identification ................................................................................................ 87
Class Question P – You just took a new job in Chicago. ..................................... 88 Handout17 - Risk Management Plan .................................................................... 89
12.3 Qualitative Analysis .............................................................................................. 89 Handout17 – Risk Management.xls ...................................................................... 90
12.5 Quantitative Risk Analysis ................................................................................... 90 Handout17 - Risk Management Planv2 ................................................................ 91 Handout17 - Risk Management Planv2 Step 2 – Qualitative Risk Analysis ........ 92
12.5 Risk Response Planning ....................................................................................... 92 Handout17 - Risk Management Planv2 Plan Step 4 ............................................. 94
Class/Group Project #13 - Risk Management ............................................................... 94 EngHandout1-Levels of CMM.doc ...................................................................... 95 Question – Risk Management Planning Meeting ................................................. 95
12.6 Risk Monitoring and Control ................................................................................ 95 Computer Training #11 – Risk ............................................................................. 96
Chapter 13 - Procurement Management96 13.1 Purchases and Acquisitions ................................................................................... 96
Instructor Question – Organic Pasta Sauce Project Manager Read paragraph on PMI217 ................................................................................................................. 96
13.1-1 Buying Considerations .................................................................................. 97 13.1-2 Make or Buy .................................................................................................. 97 13.1-3 Contract Life Cycle Steps .............................................................................. 97
Class/Group Project #14 – Plan Purchases and Acquisitions ............................... 99 Instructor Question – Purchase acquisitions ......................................................... 99
13.2 Contract Management ........................................................................................... 99 13.2-1 Contract ......................................................................................................... 99 13.2-2 Procurement Documents ................................................................................ 99

13.2-3 Statement of Work (SOW) .......................................................................... 100 Handout19 – Statement of Work (SOW) Example ............................................. 100 Class/Group Project #15 – Acquisition and Outsourcing ................................... 100 Handout20 – Small Project Plan Template ......................................................... 100 This will conclude the Planning process Group or Summarize Concepts. ......... 100
Chapter 14 - Executing Process Group100 Executing Process Group ............................................................................................ 101 14.1 Direct and Manage Project Execution ................................................................ 101 14.2 Perform Quality Assurance (Brief Overview) .................................................... 102 14.3 Acquire Project Team (Brief Overview) ............................................................. 102 14.4 Develop Project Team (Go into Detail) .............................................................. 102
Instructor Question – Developing a Project Team .................................................. 104 14.5 Information Distribution(Brief Overview) ......................................................... 104 14.6 Request Seller Responses (Brief Overview) ....................................................... 104 14.7 Select Sellers(Brief Overview) ........................................................................... 104
Chapter 15 - Monitoring& Controlling Process Group 104 15.1 Monitor and Control Project Work (Brief Overview) ........................................ 105
Computer Training #12 – Tracking .................................................................... 106 15.2 Integrated Change Control .................................................................................. 106
4.2-1 Project Management Information System ..................................................... 106 4.2-2 Configuration Management System .............................................................. 106 4.2-3 Change Control System ................................................................................. 107
15.3 Scope Verification (Brief Overview) ................................................................. 107 Class Question Q – Scope Acceptance Criteria .................................................. 108
15.4 Scope Control (Brief Overview) ......................................................................... 108 15.5 Schedule Control ................................................................................................. 110
3.5-1 Earned Value - Calculation definition ........................................................... 110 15.5-2 Cost and Schedule Variance ........................................................................ 111 15.5-3 Index (CPI/SPI) ........................................................................................... 112 15.5-4 Completion Indicators ................................................................................. 112 15.5-5 Summary of Formulas ................................................................................. 113 Instructor Handout – Earned Value ........................................................................ 114
Computer Training #13 – Earned value (SV) ..................................................... 114 15.6 Cost Control ........................................................................................................ 115
Computer Training #14 – Earned value (CV) ......................................................... 115 15.7 Perform Quality Control (Brief Overview) ......................................................... 116 15.8 Manage Project Team (Brief Overview) ............................................................. 116
Instructor Question - Manage a Project Example ................................................... 116 15.9 Performance Reporting (Brief Overview) .......................................................... 116
Computer Training #15 – Printing and Reports ...................................................... 116 15.10 Manage Shareholders ........................................................................................ 117 15.11 Risk Monitoring and Control (Brief Overview) ............................................... 117 15.12 Contract Administration (Brief Overview) ....................................................... 117
Chapter 16 - Closing Process Group . 117 Closing Process Group ...................... 117
16.1 Close Project (Brief Overview) .......................................................................... 117

16.2 Contract Closure (Brief Overview) ..................................................................... 118 Computer Training #16 – Advanced Understanding Topics .................................. 118
Conclusion .................................................................................................................. 118 Appendix A – Integrative Requirements118
Benefits of multiple iterations of PM.......................................................................... 118 See Scope Definition section which refers to the requirements document. ................ 118

Class Preparation 1. Pre-write the Pool project steps without
answers on the flipchart. Put titles on each flipchart indicated on each Class/Group Project step.
2. Supplies Needed a. Flipcharts(Inst+1 per group project) b. Different Color Postits c. Flipchart Pins d. Computer with MS Project installed e. Tape for flipcharts f. Circular Item for game (Masking tape
size) g. Paper pads and pins to write with.
3. Class Structure – Project Management Process
a. Review Process on board b. Morning – PM Overview/Framework c. For each step we will have
i. Teach Concepts (Lecture/Book) ii. Class Project
iii. Group Project (Start thinking about a project)
iv. Implement on Computer 4. Exercises for Computer Training
Download Project2003-1 Exercises Project2003-1 PTS131, PTS123, PTS133
5. Book Reference Book Page Reference System PMI23 - Element K, PMI Cert Book,
Page 23, (EK-088163) CT23 - Course Technology Project
Management Basic (Second Edition) (ISDN 1-4188-6466-8) EK23 - Project Management Fundamentals, (EK 079160), Page 23
JM2P3 – Jim O’donell Book, Module 2, Page 3
PTS – Executrain PTS Box Only Class Questions, Handouts,
Class Flipchart examples Box Gray Shade – External Items, Student Flipchart, Computer Examples
6. Class Styles
2 Day Format – Lecture Only. 3 day Format – Day 1 is mostly lecture, Day 2,3 is more computer. 4 day format – Same a 3 day format except add more MS Project and Process group lecture.
7. Handouts for lecture to Print out
Handout01 – PM Skills (Future Dev) Handout02 - Issues related to a Project Mgr Handout03 - Major Causes of Overruns Handout04 - PM Initiation Decision QuestionsShort Version Handout05 - The Team Handout06 - ProjEss-Project Management FrameworkV2 Handout07 - Initiating Process Group Handout08 - Project Charter Example Handout09 - Microsoft Project 2007 Screen Shots Project2003-1 Development ProcessV2 Handout11 – Project Charter Complete Description Handout12 – Project Charter For Small Projects Project2003-1 Definitions Handout09 – Responsibility Assignment Matrix Project2003-1 Leveling ResourcesV9 Handout17 - Risk Management Planv2 Handout17 – MS Project Reports (future dev) Handout18 - Statement Of Work (SOW) Handout19-RFQ Example Earned Value Project2003-3 Earned Value
8. Outline 0n Board
Class name: Project Management Boot Camp Class Outline on board – Check off items as class progresses
Project Management Overview Initiating Process Group Planning Process Group Project Management Integration Project SCOPE Management Project TIME Management Project COST Management Project QUALITY Management Project Human Resource Mgt Project Communications Mgt Project RISK Management Project Procurement Management
Optional Agenda Items (4day format) Executing Process Group
Monitoring& Controlling Process Group Closing Process Group

Flip Chart Prep Used to define the Pool project during the class. FlipChart 1 – Name, Project Management Skills FlipChart 2 - Identify Project
Title: Overall Duration: # Resources: Major Activities:
FlipChart 3 – Time, Cost, Quality Chart
FlipChart 4 - Identify Project
FlipChart 5 -
Planning
Executing
Initiating
Closing
Monitor/Control
Risk
TimeCost
Quality
Scope

FlipChart 6 – Cross country trip
Operation of car, prearranged hotels, extra cash, weather status, car games for kids, emergency supplies, maps, food/water, extra warn cloths, planned activities, sun block lotion, and reading material.
FlipChart 7 – Project Charter Executive Summary Statement: Organizational Structure: Rough Order of Magnitude (ROM): Initiating Authority: Business Need/Opportunity: Required Outcome: Issues/Concerns:
FlipChart 8 - Project Management Plan Vision Statement: Priorities – Choose one high and one low Cost Time Quality Scope Risk High Med Low High level Activities: High Level Assignments: Risks/Constraints: Assumptions:
FlipChart 9 - Project Scope Project Objective: Project Requirements Business Need: Functional Requirements: Non-Functional Requirements Boundries: InScope Out of Scope Product Acceptance Criteria:
FlipChart 10 - WBS Detail Durations Owner Tot Effort Tot Dur
FlipChart 11- Develop a Network Diagram (No Prep)
Initiation
Planning
Time
Effort Execution
Closing Monitor/Control
Project Phase 1
Changes may occur shorter in the end, more in the middle

FlipChart 12 – Resources (No Prep use handout)R-Responsible for task A – Approval authority
C – Contributor I – Informed of the results
No Action Items Due Date
TimR JohnT JanetE
FlipChart 13 – Risks (No Prep)

Chapter 1 - Project Management Introduction (Day1, 9:00a) Overview of Chapter
History of PM What is Project Management What is a Project? Project Management Life Cycle Project Management Processes Groups Project Management Framework The Team Knowledge Area Processes
1.1 History of PM (Reference JM2P1)
Dramatic historical evidence of PM with the Pyramids in Egypt, South America ruins, roman empire. Some of the developments of some project management concepts emerged as a result of scheduling
problems encountered. Henry Morris Gantt invented the Gantt Chart in 1910, he was a Mechanical Engineer, used on the Hover Dam Project. During the Industrial Revolution they were trying to get workers to work faster and be more efficient. Gantt thought if you could visually see how things interrelate it would reduce transition between tasks and accomplish the goal. Gantt Charts are easy to read and they are available on most project management software packages today.
Surfaced after WWIII The RAND Corp embraced and used many of the WWIII Ideas and implemented them in new projects.
Developed projects such as Critical Path and Pert Chart PMI Emerged in 1969 and now has over 100,000 members
The organization became more recognized in the 80’s consisting of a professional society for people who lead projects and has chapters worldwide.
?Need statistics on education decline in America ?Need companies that are aggressively implementing PM Practices There are several terms we need to be aware of:
PMI - Project Management Institute (PMI) PMP - Project Management Professional (PMP) - PMBOK - PMI Publishes PM Body of Knowledge (PMBOK) guide This is the foundation of PMI Certification
Class Question A – PMI Certification
Which country is most aggressive in getting PMI certification?

Instructor Answer for Class Question 1.1 Which country is most aggressive in getting PMI certification? The largest country getting PMI is Asia. PMI Certification is top of the list for hiring Project managers. Colleges are now offering degrees in Project Management.
We will practice the abilities to manage a project, presentation skills, running a meeting, leadership skills, work with a team, manage a team, along with the technical skills to record an actual project.
1.2 What is Project Management The application of knowledge, skills, tools, and techniques to project activities to meet the project requirements.
Exercise Mini Project - Getting to work assume you are always late for work. Write the following on the board: 6:00 Alarm, 6:10 shower, 6:30 dressed, 6:45 breakfast, 7:00 walk dog, 7:15 leave the house, 7:25 stop to get your morning coffee, 8:15 get to work. What can we do to get to work on time at 8:00am? Ask the class “What can we do to modify the plan.” Some ideas to suggest are get up earlier, wake up when the alarm goes off. Eat a muffin while walking the dog, walk the dog at night, drive faster, or skip morning coffee.
1.3 What is a Project? (Reference JM2P2, EK2)
A project is a temporary endeavor with a clearly defined beginning and end resulting in a unique product or service. It requires resources and may be part of a bigger program. Temporary Endeavor – A temporary endeavor simply means the project is a one-time event. Tasks that are designed to be repeated over and over again are considered a procedure or maintenance plan. A project could be to develop the procedure of maintenance plan, but once the temporary endeavor is done the project closes. A Clearly defined beginning and end – This means the project must start at a specific date and finish /close at a specific date. The finish date may be extended due to slipping of the tasks, but it must finish. When finished you will have a product, procedure, guideline or service to use or implement. Resources – All projects will use resources to do the development and execute the project even if you have a project that only defines the tasks it will still require resources to compete. Program – Some projects are part of a larger group of projects called a program.
Class/Group Project #1 – Identify Project Group and Class Project Explanation Class Project - The instructor will choose a class project that will be developed by the entire class. This will be done prior to the group project to help explain the development process. Once the class project is finished the class will break up into smaller groups and work on a individual group project. Group Project Approach – Choose a project that everyone can agree upon. You will need to apply the concepts learned in the chapter towards the group project. Each member of the group will take turns acting as the project manager collecting criteria from the team. In a real project scenario the project manager will rely on the team for

input. The group project will allow each student to practice those leadership skills. After the requirements have been gathered the project manager will present the results to the entire class. Group Project Make sure there are sufficient activities and resources. If one person in the group is an expert on the subject and others have no knowledge, it doesn’t work out well. The purpose of this is to identify the group project and make sure it is the correct size to be completed in the class. The project can be work, personal or just an idea the group may come up with. Some examples projects are repairing a power unit, adding an addition to a house, starting a baby sitting business, restoring an antique car. The following requirements must be met: Title: (Provide a simple short name that describes the project) Overall Duration: (The project should be larger than one month start to finish, if the duration extends beyond one year you might want to do a small part of the overall project) # Resources: (Choose a least 3 resources and they must be billable resources. A one resource project does not allow you to adjust the characteristics between resources.) Major Activities: (Try to choose at lease 4 or more major activities. Again if you have too many activities use a subset of the activities for this group project.) Instructor notes for the Class project #1- You will need to choose a project that has at least 5 major activities, more than 2 resources, and the class can relate to. The Instructor notes will provide a suggestion (Backyard Pool), but any project can work for the example project. The following is a suggested project for the instructor to follow.
Title: Backyard Pool Overall Duration: 2-3 months # Resources: 5-8 different organizations Major Activities: Plan, Excavation, Electrical, Plumbing, Smoothing, Building shed.
Instructor notes for the Group project #1- You will need to divide the class up into 3-5 students per group. Preferably four per group. Two in a group does not allow the group to interact as a group.
Five or more per group will slow down the group’s ability to complete the project in a timely manor. Allow the students to gather into their own into groups, but if they don’t try to assist them. The group project must be approved by the instructor and presented to the class.
Have the group answer the above questions to initialize a project.
Class Question B – Most Important PM Skill (Reference JM2P14)
What is the most important skill needed for PM? Instructor Answer for Class Question B No specific answer for this questions. Discussion topic - you need to identify the Project Management skill that is lacking for you and your organization. Instructor Note: Pass out the following handouts
Handout01 – PM Skills (Future Dev)

Handout02 - Issues related to a Project Mgr Handout03 - Major Causes of Overruns Handout04 - PM Initiation Decision QuestionsShort Version Handout05 - The Team Handout06 - ProjEss-Project Management FrameworkV2
????Leadership Leadership is the capacity of a person to guide and inspire others to achieve results. The ability to lead can be characterized as learning from one’s mistakes, building relationships, taking initiatives, and inspiring others through positive influence. Characteristics of effective leadership include self-awareness, personal accountability, and personal integrity. These characteristics are important for a manager to establish rapport, enhance credibility, and gain others’ trust. Though the leadership capabilities of a manager are important throughout all the phases of a project, it is critical at the beginning of a project or phase where the emphasis will be to communicate the vision and motivate and inspire team members for higher project performance. Leadership Style Leadership style indicates how a person prefers to interact with others in various situations. They are based on low or high assertiveness and low or high responsiveness. An understanding of characteristics of leadership styles will help you, as a leader, to assess the behaviors, feelings, and tendencies that comprise self-awareness.
A four-quadrant approach best represents leadership styles. Many categorizations of leadership styles are based on the concepts of assertiveness and responsiveness. Of course, this is not an exact method of determining a leader’s personal style, but it is useful for generalizing how leaders make decisions and interact with other people. Variations may exist on a situational basis. No one style of leadership works for every situation, and no one person will always be using the same style in all interactions. However, knowledge of characteristics of these styles is helpful when considering your interactions with others. Assertiveness Assertiveness refers to the degree of effort that a person puts into influencing others and their surroundings. If you interact with others and your surroundings with the intention of influencing them, then you may be high in assertiveness. You would seek to understand, but not necessarily to be understood by others. Conversely, if you exhibit low assertiveness, then you are most likely not noticing your own influence on others and your surroundings. Generally, you may make decisions based on others’ analyses and perceptions, rather than your own. Responsiveness Responsiveness refers to the degree of effort that a person puts into responding to others and

their surroundings. If you put more energy into responding to others and your surroundings than on completing tasks, you are probably closer to high responsiveness. If you tend to focus more on tasks than ideas, then you are probably closer to low responsiveness.
1.4 The Team The team is the most important element of the entire project. You must regularly interact with different team members, depending on their level of involvement. Getting the team motivated at the right time and providing timely status to the upper management will allow the project to spiral forward in a positive manor. The following chart explains the level of involvement of the different team members. The chart may appear upside down but you want the project to run independent of the project manager. This can be done through clearly defined requirements and actions. The project manager is not the head of the organization, but he is a key to the success or failure of the overall project. Figure 1.1
Let’s look at each item in Figure 1.1 to determine their roll in this project plan. Identifying Sponsor and stakeholders
1.4-1 Sponsor This is probably one of the most important persons you will interact with. They have the power to start or shutdown the project. Without the proper sponsor supporting the project you will not get the necessary resources committed to the project and won’t get the management backing. The following are some characteristics related to the sponsor. Upper level management that backs your plan Could be Customer (pays for project)
Authorizes the Project and Makes key decisions

Appoints the project manager If you lack sponsorship find one If you lose sponsorship, find a new one The sponsor will ensure the project success
Provides adequate resources Build a relationship with sponsor Project Manager Mentor
1.4-2 Project Manager
Keep in mind that a project manager may delegate project management tasks to core team member and they may act as the project manager organizing, planning and executing the tasks. The project manager’s technical skills must be sufficiently high to understand technical issues and explain technical decisions to others. This includes understanding the technology the project is undertaking. The following are some additional skills the project manager must possess to be successful: (Reference EK8, EK15, JM2P9)
Handout01-PMSkills (Future Development)
1.4-2a Achieve the project objectives Appointed by Sponsor
` Have regular scheduled meeting with sponsor Keep the project importance alive
1.4-2b Establishes and leads the team Identifies, selects, and manages the project team
Clarify the roles and responsibilities Communicates effectively Maintains firmness while being flexible Willing to challenge barriers and obstacles Provides rewards, recognitions, and provides performance feedback
1.4-2c Manage the project management processes Manages the project management processes Committed to the project’s success and to achieve project goals Sees the big picture and pays attention to detail
Facilitates documentation of the work performed
1.4-3 Core Team The core team must remain fairly small in order to maintain the levels of communication paths between major tasks. Core team members will make ongoing decisions if you delegate the responsibilities appropriately. They are usually on the project on a full time basis. Involved in planning, managing and communicating Responsible for project activities Should consist of 3-10 people (the formula is N(N-1)/2 3 team members have 3(3-1)/2=3 communications paths (2 way communication)

5 team members have 5(5-1)/2= 10 communications paths (2 way communication) 10 team members have 10(10-1)/2= 45 communications paths (2 way communication) Make specific clear assignments Assign activities that they will take responsibility (Accountability)
1.4-4 Extended Team Members These are usually the people accomplishing the tasks to be done. They can be internal resources or external resources such as contractors. Team members have a variety of skills which are needed to get the complete the project. Internal/External Specific Skills
1.4-5 Shareholders A Shareholder is someone who has a business interest in the outcome of the project. They may not be directly involved in the day to day operations of the project, but they may have an interest in the successful outcome of the project. May not personally participate in the project Part time on the project Responsible for specific tasks Works on specific phases or problems Part of a matrix organization
1.4-6 Functional Managers A functional manager is a manager that that functions independent of the project. An example of a functional unit is IT department. They set computer standards and other computing policies taking in to account other department needs. The project manager has little control over the operation of functional organizations and often times the project will use the standards established. Functional managers are usually part of a matrix organization and their level of involvement may vary depending on their role. An individual within an organization will report to a single functional manger but will actually be loaned to a project to deliver the work. They will essentially report to both organizations but since they are owned by the functional organization they want to maintain their ties. Most functional organizations contain the overall organizations technical experts because focus on specific tasks to accomplish their charter.

Employees are owned” by the functional manager, but report both to the functional and project manager.
1.4-7 Matrix Organizations Example Matrix Organization: Competitors, Finance, Customers, Field Support, Management, Vendors, IT Sponsors, PM, Core team, extended team, Stake holders, Mfg, and Quality Assurance. The following chart shows the Project Managers ability to perform in a Matrix organization.
Organization Structure
Functional Matrix Projectized
Project Characteristics Weak Matrix
Balanced Matrix
Strong Matrix
Project Manager’s Authority
Little or None
Limited Low to Moderate
Moderate to High
High to Almost Total
Percent of performing Organization’s Personal Assigned Full Time to Project Work
Virtually None
0-25% 15-60% 50-95% 85-100%
Project Manager’s Role Part-Time Part-Time Full-Time Full-Time Full-Time
Common Titles for Project Manager’s Role
Project Coordinator /Project Leader
Project Coordinator /Project Leader
Project Mgr /Program Officer
Project Mgr /Program Mgr
Project Manager /Program Manager
Project Management Administrative Staff
Part-Time Part-Time Part-Time Full-Time Full-Time
Rewrite-Matrix org allow resources to be shifted from functional organizations to a shared or matrix pool. If a strong matrix organization the project manager has greater authority or power than the functional manager. How a weak Matrix organization comes about is when upper mgt shifts their thinking from a functional to a matrix structure. Sometimes functional managers are resistive to give up quality staff thus it is weak. A balanced matrix organization allows the PM to solicit resources from the functional manager and the functional manager decides who will be assigned.
Class Question C – How to run a meeting?
How will you run a Shareholder meeting compared to a Core Team meeting? Instructor Answer for Class Question 1.3 – How will you run the meeting? Let the students provide input to the questions to help them better understand the role. Don’t provide a lot of corrections to their statements, but guide them providing better answers, If they are not understanding

the roles then refer to the chapter 1.6. The purpose to this question is to get the students involved in the class. From a general prospective, a Shareholder meeting will be more focused on what we are going to do and a Core Team Meeting will be more focused on how we are going to do.
1.5 Project Management Initiation Decision Questions There are some common reasons why a project manager would take on a new project such as to meet a customer’s need, to gain a competitive advantage in the market, and meet regulatory requirements. Of course there are many other reasons, but when a new project is undertaken often times project managers do not know where to start. The following are a few questions you can ask to get the ball rolling. This should give a project manager a start at addressing the most important questions.
Handout04 – PM Initiation Decision Questions –Short Version.doc
Instructor Note for section 1.8 Review several of these and do not go through every item unless the class requests it. Tell the students that this is a good check list to be used in the beginning of a project to verify if you have forgotten anything. 1.6 Project Management Framework (Reference JM2P5, EK14) Figure 1.2 The Five Constraining factors - Risk (Cost, Quality, Time) Scope
Risk
Time Cost
Quality
Scope

There is a direct relationship to the cost, time and quality. If it takes longer to complete a task it will generally cost more. If it takes longer to complete a takes and you cannot increase the cost, the quality will suffer. And if you want to increase the quality of the product it will take additional time and cost. If you have a task that has a great amount of risk associated with it, such as unknown technology or undefined requirements, all aspects will increase or decrease depending on the issues generated from the risk. If the overall scope changes that again will affect all aspects of the Cost, Time, Quality and will introduce new risks. There are
Class Question D - Re-tooling of the mfg line assignment
Rebecca has just been assigned to manage the re-tooling of the mfg line. Her VP of Mfg wants the work completed in 6 months and will authorize payment of up to $500,000. What success criteria are missing?
Instructor Answer on Class Question D Re-tooling of the mfg line assignment What success criteria are missing? Quality Rebecca must back track and define clear success criteria before moving forward?
This is what PM is all about making sure you have a sound project that is properly funded. Is $500,000 enough to complete the project and is 6 months enough time. The end result if one of these elements is under estimated will affect the other elements. The reason why we need to verify if this is adequate is because roughly 70% of IT projects will be late, over budget or won’t meet user expectations. Some other related statistics are that 31% of projects will be canceled before they are completed and 57% will cost 180% of their original estimates. Rebecca needs to put a plan to ensure her success. See handout: “Major causes of project overruns” (if available open on the projector).
Class Question E - How do you judge success?
A school needed to build an overpass over a busy street. After a long budget battle it finally got approved (years). The project was done on time and under budget. In the mean time the school was shut down. Was the project successful? Instructor Answer for Question 1.4 - How do you judge success? (Reference JM2P11) The project was successful from a scheduling perspective but unsuccessful from a community funding perspective. Why and where was the failure?
Handout02 - Issues related to a Project Manager.doc

Class Question F - Public Works Projects In what conditions do you go forward with a project knowing that it is underfunded or under staffed? Instructor Answer for Class Question F If you submit a project that is underfunded you will need to seek the funding when needed. After a project has started it is a total loss if it gets canceled at a later time. Review one or all of the following examples.
Example 1 - Public Funding Projects San Jose Light rail costs 2-3 times the original estimate. The reason why they went with a light rail was because the Bay Area Rapid Transit (BART) system was too costly. Is it possible that if they submitted the actual potential cost, it may never get approved. The conclusion is we can’t ask for too much money or the project may never get approved, but if we ask for a small amount based on a smaller scope. As we see more success with the project the scope may change along with the budget.
Example 2 - The Boston tunnel project This project was call the “big dig” and was started in 1970. Goal is to put tunnels under the streets of Boston. The estimate original cost was $2.2 billion. They run into many obstacles such as natural water ways, super hard rock, etc. What do you think the final cost was? Answer: 25 billion. Question - Is that considered a successful project. I am sure the future generations may think it is a worth-while project. I am sure the generations that paid for the project in taxes thought it was not a successful project. Example 3 – GE Computer Deployment GE did a massive computer deployment plan for the entire company. The deployment took some time and once they finished the deployment they laid of 60% of their workforce.
Handout03 - Major Causes of Overruns.xls
1.7 Project Management Processes Groups These are the processes every large and small project must go through. Sometimes small projects don’t appear to use the process because the process completed in a very short interval. For example to close project that is process by a single individual, If you stop charging to the budget and send email to the manager concluding the project, that may all that is required to close the project. The following describes the process groups:
1.7-1 Project Management Process Groups: Initiating – happened by the PM team prior to project process Planning - happened by the PM team prior to project process Executing - analysis, design, development, implementation Monitoring and control Closing

1.7-2 Process Group Effort The definition of effort is “The number of person-hours required to complete an activity” and some process groups require more effort than others. Some of the processes require very little effort. The following chart describes the amount of effort required for each process group.
1.8 Knowledge Area Processes Within each process group 9 knowledge areas must be considered. Even small projects touch on all 9 knowledge areas.
1. Project Scope Management 2. Project Time Management 3. Project Cost Management 4. Project Quality Management 5. Project Human Resource Management 6. Project Communications Management 7. Project Risk Management 8. Project Procurement Management 9. Project Management Integration
Planning
Executing
Initiating
Closing
Monitor/Control
Initiation
Planning
Time
Effort Execution
Closing Monitor/Control
Project Phase 1
Changes may occur shorter in the end, more in the middle

Class Question G - Policy Statement No Red Markers
The company policy states that red markers are not dark enough for white board use. Therefore, all red markers will be removed from all conference rooms. All markers must be blue or black. Instructors Answer to Class Question G Hold up the red marker. What color is this? Keep the policy in mind before you make your answer. Answer: Red marker. A PM must think out of the box (beyond the company policies if necessary) and make quick and direct decisions.
Instructor Note: Day 1, 11:00pm First Break Instructor Note: Day 1, Lunch Break 1:00pm Try to start Project Charter by 10:30 because we need more time at the end of the day to spend with MS Project
Chapter 2 – Initiating the Project (Day1, 10:30a)
Overview of Chapter Project Charter Development Project Stakeholders Project Selection Criteria Project Selection Methods Project Selection Decision Models Develop Preliminary Project Scope Develop a Project Management Plan
2.1. Develop Project Charter Instructor Guide - (Reference JM3P1, PMI12, EK26) Objective: Designed to define the project need (Review PMI12-20) This indicates the relative importance and priority of the project within the organization. b) This provides authority for the project manager to cross functional boundaries when carrying out project plans and activities. c) This provides greater credibility with people outside of the project who may be asked to contribute resources or join the project team.
2.1-1 The Project Charter Statement (EK26) This is an official statement of the project goals and authorizing the project manager. It is extremely important that the project authorized, signed and published by the project sponsor because:

a) This indicates the relative importance and priority of the project within the organization. b) This provides authority for the project manager to cross functional boundaries when carrying out project plans and activities. c) This provides greater credibility with people outside of the project who may be asked to contribute resources or join the project team.
The actual project charter may be a short memo or a multi-page document. The primary purpose is to document the current understanding of the requirements and the result to fulfill the requirements. Often times, projects are chartered and authorized due to an external issue, problem encountered or opportunities discovered in the following areas:
Market demand Business need Customer request Technological advancement Legal requirement Social need
2.1-2 Feasibility Analysis The basic purpose of a feasibility study is to determine if the organization has the resources and capabilities required to do the project. In addition, it will determine if the project is possible to complete and gets a second expert opinion. It is done using mathematical or measurement analysis which is performed prior to developing a project charter. Expert judgment is often used to assess the inputs needed to develop the project charter. This expertise is provided by any group or individual with specialized knowledge within the organization, outside Consultants, stakeholders, customers, sponsors, professional organizations, technical associations and Industry groups. The feasibility analysis has little to do with defining the strategic goals or defining the tasks to be completed. It is just the initial stage to determine if we should take on such a project. A formal feasibility study is likely to contain an estimate of the time for each of a number of project alternatives. A feasibility study should include:
Description of problem Relevant Historical data Evaluation of available technologies Estimate of cost and time of the elements Assumptions and/or constraints Recommendations to the best alternative to pursue Statement of the project goals and major milestones
2.1-3 Cost benefit Analysis This is a rough estimate or forecast of what may happen. It compares the predicated costs and benefits of doing
the project. Read Cost Benefit Analysis Example PMI19 Rewrite - During the planning phase of a project, you need to estimate effort, time, and cost. The effort estimate is the total number of person-hours needed to complete a task. To arrive at an estimate of how long it will take to complete the entire project, you add the estimated person-hours required for each individual task involved in the project.

2.1-4 Scoring and rating system (PMI20) Another technique is to analyze issues or tasks using a rating system. After it is rated by importance then it can be totaled or scored up to see the important items. These analysis techniques can be used in a group setting to help prioritize establish focused goals. The following are a few techniques that can be used:
Decision Tree – Each criterion is evaluated and if acceptable will travel down the tree until from top to bottom priority.
Criteria Profiling – Similar to decision tree, but each item is decided one criterion at a time. Weighted Factor – 2 points for high criteria and 1 point for low criteria. This is a good way to evaluate
multiple proposals or comparing multiple items. Q-Sorting - 1st define the rating criteria, sp-lit up all tasks into high, med, low priority, High priority is sorted
into high and highest priority. Delphi Technique – Deciding individually then deciding and discussing as a group to determine a combined
answer.
Class Question H – Using the Delphi technique to make a decision.
Cross country trip (Card Game) Operation of car, prearranged hotels, extra cash, weather status, car games for kids, emergency supplies, maps, food/water, extra warn cloths, planned activities, sun block lotion, and reading material.
1. Organize cards to High=must have items for safety, medium=prearranged or pre-booked issues, low=convenience
2. Discuss with your group and re-prioritize 3. Record results on board Conclusion – Sometimes the decision we make have nothing to do with right or wrong. It has to do with the path the team will go down.
Class Question I – Creating and Effective Charter What specific benefits would creating an effective charter bring to your organization? What specific elements of a project charter does senior management want to hear? Instructor Answer for Class Question – Creating and Effective Charter What specific benefits would creating an effective charter bring to your organization? Getting the commitment from the upper management would allow resources to be redirected to your project and get the proper funding needed to complete the project successfully. What specific elements of a project charter does senior management want to hear? How much it will cost, whether it can be done on time and on budget. The feasibility analysis will be a great benefit in making this point.
2.1-5 Project Charter Guidelines PMI20/21 Each project charter could be different but could include the requirements that satisfy customer, business need, high-level project description, project purpose or justification, assigned project manager, authority level, summary of the milestone schedule, stakeholder interest, functional organizations and their participation, organizational, environmental and external assumptions, organizational, environmental, business case justifying the project, return on investment, and an estimated summary budget.

List guidelines from ET book
2.2 Develop Preliminary Project Scope Statement (Reference PMI26, EK22) The first step is to define the preliminary project scope so you have a basis to develop the scope management. Depending on the size of the project, the preliminary project scope statement will determine the level of the scope management plan. For example, if I plan to build a shed to store my lawn equipment, it depend how much equipment and how big the equipment is. If my lawn is a field then I may need equipment such as a tractor, this information may change the scope of my management plan. This will define the components needed to define the project or the boundaries of the project.
2.2-1 What is scope? Scope is a clear description of what needs to be delivered. You should be able to refer back to the original scope at any point in the project to determine if the project is diverging from its original purpose.
2.2-2 Preliminary Project Scope Statement (PMI28) The scope statement will document the characteristics and boundaries of the project in addition to the products and services they offer. A scope statement can include anything that could build a box around the requirements that explain what needs to be done. The following are a few ideas that may be include in the scope statement: Project/product objectives, product/service requirements, product acceptance criteria, project boundaries, project requirements, product deliverables, project constraints, project assumptions, initial project organization, and initial defined risks, schedule milestones, initial WBS, and the cost estimate.
Handout07 - Initiating Process Group.doc
Class/Group Project #2 – Creating a Project Charter You will now create a group charter for your project. Depending on the size of the project the Project Charter can be very extensive or a few statements. The charter is actually a document describing the characteristics of the proposed project to upper management. We will define a few key points needed to be addressed.
Executive Summary – Write a brief description written to audience of senior mgt Organizational Structure – Examples: Contractor, Existing Staff, or new org ROM – Rough Order of Magnitude, Cost/Time estimates Initiating Authority - Customer or Sponsor Business Need/Opportunity – Clear description of the need, opportunity, or threat that the project intends to address Required Outcome – End Result Issues/Concerns - Risks/Constraints/Assumptions, or any obvious concerns. Preliminary Scope – How big the project will be.

Instructor Class Project #2 – Define the Pool Project Charter
Executive Summary Statement: A gathering place for the family and friends. Organizational Structure: Contractors Rough Order of Magnitude: 3-4 Months Initiating Authority: Wife Business Need/Opportunity: Add Value to our home Required Outcome: Keep Kids home, family will be together more often Issues/Concerns: Permit, Safety during construction. Preliminary Scope – Small pool implementation
Group Project #2 – Define the Project Charter On a flip chart List the following categories and answer the questions based on your group project characteristics. Have one team member take the project Management role and gather the requirements by writing on a standing flip chart. Use the team input and answer the following questions.
Executive Summary: Organizational Structure: ROM: Initiating Authority: Business Need/Opportunity: Required Outcome: Issues/Concerns: Preliminary Scope:
2.3-3 Project Charter Example I. Project Name Generator Replacement Project
II. Authorities A. Initiating Authority Jackie Johnson, Vice President of Engineering B. Project Manager PMName is authorized as project manager for this project and will be the primary point of contact. PMName is responsible for meeting all key milestones within the time, cost, and performance constraints of this project. Furthermore, PMName has the authority to apply organizational resources to accomplish the goals of this project. III. Business Need the Project Addresses This project will help the company maintain a competitive advantage by continuing to providing low cost nuclear energy.
IV. Project Description A. Product/Service Characteristics Replace corroded steam generators 1 and 2 at Northshore Power's nuclear power station.
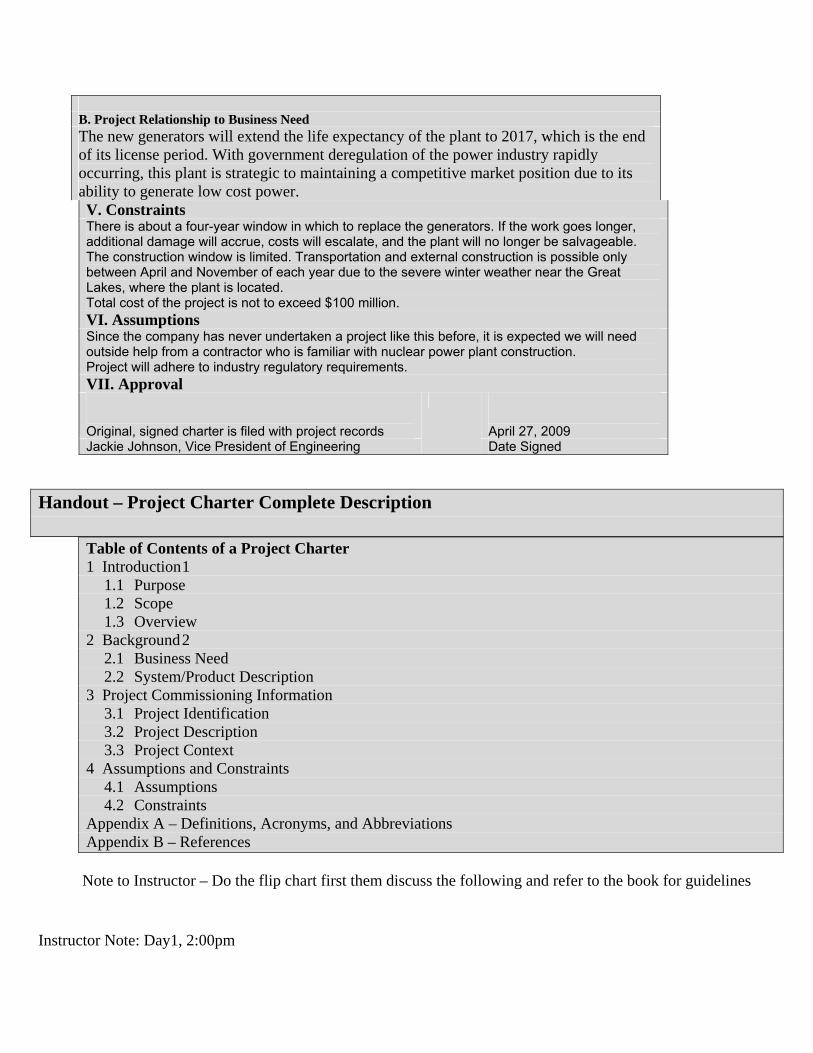
B. Project Relationship to Business Need The new generators will extend the life expectancy of the plant to 2017, which is the end of its license period. With government deregulation of the power industry rapidly occurring, this plant is strategic to maintaining a competitive market position due to its ability to generate low cost power. V. Constraints There is about a four-year window in which to replace the generators. If the work goes longer, additional damage will accrue, costs will escalate, and the plant will no longer be salvageable. The construction window is limited. Transportation and external construction is possible only between April and November of each year due to the severe winter weather near the Great Lakes, where the plant is located. Total cost of the project is not to exceed $100 million. VI. Assumptions Since the company has never undertaken a project like this before, it is expected we will need outside help from a contractor who is familiar with nuclear power plant construction. Project will adhere to industry regulatory requirements. VII. Approval Original, signed charter is filed with project records
April 27, 2009
Jackie Johnson, Vice President of Engineering Date Signed
Handout – Project Charter Complete Description
Table of Contents of a Project Charter 1 Introduction 1
1.1 Purpose 1.2 Scope 1.3 Overview
2 Background 2 2.1 Business Need 2.2 System/Product Description
3 Project Commissioning Information 3.1 Project Identification 3.2 Project Description 3.3 Project Context
4 Assumptions and Constraints 4.1 Assumptions 4.2 Constraints
Appendix A – Definitions, Acronyms, and Abbreviations Appendix B – References
Note to Instructor – Do the flip chart first them discuss the following and refer to the book for guidelines
Instructor Note: Day1, 2:00pm

Computer Training #1 - Overview (approximately 40 min) Open House15.mpp The following topics will be reviewed
Views (Gantt, Calendar, Network Diagram , Resource Sheet, Resource Usage, Tracking Gantt) Other Views (Resource Allocation, Split(Gantt/Task Form), Resource Graph) Tables (Cost, Entry, Summary, Variance) Format (Font, Bar, Timescale, Gridlines, Text Styles, Bar Styles) Project start (ProjectProject Information) Calendar basics (ToolsChange working time) Filter (Completed tasks, Incomplete tasks), Go to selected task Zoom in/out
Instructor Note on Computer Training #1 Finish the day reviewing Microsoft Project and if there is more time expand the training.
Instructor Note: if more time is available include the training of Computer Training #2 Instructor Note: Day 2, 9:00am (You might start the Project Management Plan if there is time)
Chapter 3 - Develop Project Management Plan (Day2, 9:00a) (Reference PMI34, JM4P1) At this point the project has been authorized and we need to describe how the project will unfold. The project plan is to manage the processes of executing and controlling during the project. There are several project management systems that need to be put in place such as ?????????. Planning a project is a process that develops products such as a schedule. This process produces the Activity definition, activity sequencing, and activity duration. Project integration management includes the project plan development process. Objective: Kick off project. Define details such as major tasks and durations Definition: a plan that details how a project will be expected to achieve its objectives.
Class Question J – Faced with difficult team decisions What will be the ultimate population of the world? Instructors Answer to Class Question J - Ultimate Population Have the students write their answers down prior to sharing it with their group. After they have written down some answer have then discuss it with their group to come up with a group answer. Then have each group share their answer with the class. Try to keep them off the internet looking for answers. One

hint you can give them is the answer is a number not 0. Zero indicates that the world will completely explode and no form of human life could exist on earth. After the class discussion revile the answer below. The answer to “What will be the ultimate population of the world?”
1. If the population of the earth evolves, what will the maximum population of the earth. The answer is not 0
2. Write your answer on a yellow stick note
3. Now break up into groups and discuss it and possibly adjust the number 4. Answer - The current population estimate from the UN is 6 billion
High birth estimate – if 2.5 children per woman it will grow to 12.5 billion by
2050 and continue to grow.
Low Estimate - 1.7 children per woman it will grow to 7.8 billion in 2050 before beginning to decline. Estimates of the Earth's human carrying capacity 1 trillion
The RAND corp. developed this group estimating technique to get closer to the actual number if completely unknown
Conclusion: Step 3 used the team to develop the activities. The “Ultimate Population” used the approach to make individual decisions and use the groups to qualify or fine tune the final decision. See PMI#5 Delphi Techniques to arrive at a solution.
3.1 Project Management Methodology The project management methodology defines a process, which aids a project management team in developing and controlling changes to the project management plan.
EngHandout1-Levels of CMM.doc 3.2 Project Management Life Cycle (Reference JM2P7)
Chart of Project Life cycle Start, Phase1, Phase2, pahse3, End
Projects can be broken up into phases to allow each successive phase build upon the previous phase. In some cases the phases are clearly defined, but often times each phase builds upon the previous phase to elaborate upon the previous phase or customized to suit project needs. The term often used is Progressive elaboration, which means as the project progressively moves along we may elaborate on deliverables/tasks. The result of phase one may cause us to elaborate on other phases of the project. As the project team develops a better and more complete understanding of the objectives and deliverables, additional details may be added. This not to be confused with scope creep we are not changing the scope but clarifying how the tasks will be delivered. Each phase has a beginning and ending and each phase provides an incremental benefit. Within each phase there must be project Management, Analysis, Design and delivery tasks and must undergo the all 5 process groups.

Starting a new phase will use the result of the previous phase to begin development of the new phase. These phases will provide better management control over the ongoing nature of the project. Add term into paragraph above: System development life cycle (SDLC) implementation belongs in the Controlling Phase.
3.3 Project Portfolios Collection of programs, Projects and operational work.
3.4 Project Governance Methodology to control project Life Cycle
3.5 Product vs Project Management
Product Management defines the end results and provides deliverables. This will include the Analysis, Design, Development and product implementation. Project Management is the process that governs the creation of a product or the sequence of activities designed to bring about a specific result.
3.6 Project management Plan Guidelines : (Reference PMI35) ??? Complete this
Class Question K – Elements in the Project Management Plan What are some elements that would typically be included in an effective project management plan? Instructor Answer for Class Question K – Elements in the project Management Plan Review some of the topics we just covered.
Class Example of a non-vision statement - Presidential Candidate – Restore integrity in Washington and eliminate special interest lobbying groups
Class/Group Project #4 – Creating the Project Management Plan You will now create a project management plan for your project. The project has been approved or the project needs to be further developed. We will define a few key points needed to be addressed. 1. Vision Statement: A vision is not an activity or action entered, but how you see the end result. Use words
like efficient, smooth, seamless, headache free. A. Classic Vision Statement – Example 1: On May 25, 1961, President John F Kennedy stated “I believe this nation should commit itself to achieving the goal, before this decade is out, of landing a man on the moon and returning him safely to the earth. By the end of the decade in 1969 it came true. His vision statement inspired engineers to make it come true. Example 2: Ronald Regan, “Tear down this wall” statement occurred 2 years befor it was actually torn down. This enspired those that were in opposition in order to accomplish this.

Example 3: Martin Luther King B. How to develop a vision statement A vision Statement can be 1 statement or 30 pages How do you determine how long it needs to be? How many organizations are there? If it is open ended, it may leave too much for interpretation If too short, it would be a waste time debating the results. How much depth of feedback do you want? How much strategic thinking do you want from the team? Are people likely to argue about issues?
2. Priorities – Choose one high and one low Develop Chart marking the priorities Time Cost Scope Risk Quality High x Med x x x Low x 3. High level Activities – High Level List Only 4. High Level Assignments: High Level List Only
5. Risks/Constraints – Factors that could limit the ability to achieve success (ex. Cost(budget), time(schedule), quality, scope creep, resources risks). 6. Assumptions –Things you know to be true today (parts cost, emergency cost, weather permitting, availability of resources, permits approved)
Instructor Class Project #4 – Backyard Pool Project Management Plan
1. Vision Statement: The pool that will provide relaxing environment to entertain guests, adequate space, and big enough for comfortable swimming.
2. Priorities – Choose one high and one low
Develop Chart marking the priorities
Priorities Cost Time Quality Scope Risk
High x Med x x x Low x 3. High level Activities - Rough Grading, Digging, Elect/Pluming, Cement, finishing/Leveling, Pump/shed 4. High Level Assignments: Pool Company, Heavy Machinery company, Electrician, Plummer
5. Risks/Constraints – Weather Problems, Funding, Season to build, Materials slow delivery 6. Assumptions –Permit approved
Group Project #4 – Project Management Plan On a flip chart List the following categories and answer the questions based on your group project characteristics. Have one team member take the project Management role and gather the requirements by writing on a standing flip chart. Use the team input and answer the following questions.
1. Vision Statement: 2. Priorities: Cost Time Quality Scope Risk

High Med Low 3. High level Activities: 4. High Level Assignments:
5. Risks/Constraints: 6. Assumptions:
4-Day Class (Day1 – 3:00pm) Try to start at or before 3:00 to provide time to cover MS project Some students do not know how to use MS project
Computer Training #2 – Input and Organizing Tasks (approximately 50 min) Open House3 prior to opening group projects - Enter tasks, organizing tasks, don’t focus on Durations, Outline Numbering, PTS Ch 3,4 Step 1 - Project Start
Blank Project ProjectProj InfoStart: 6/7/2010 ToolsChange Working Time Holidays: 7/5/2010, 9/6/2010 Optional: Create Union Calendar Holiday: 7/2/2010, 7/5/2010, 9/6/2010
Step 2 – Type in the following Tasks 1. Conduct Site Survey 2w? 2. Develop Plans 3d 3. Request Bids 2d 4. Draft proposal 1w 5. Get Bids 1w 6. Build Foundation 1d? 7. Dig Foundation 1w 8. Pour Cement 2d
Step 3 - Change the highlighted Tasks
2. Develop Blueprints 3d 3. Request Bids 1w 4. Develop RFQ 1w
5. Obtain Bids 1w Step 4 - Insert New Task before task Build Foundation Select Subcontractors 1w Step 5 - Adjustments to tasks Delete Activity 4 Undo Activity 4

Move 4 between 2 and 3 Add a note to 8 Step 6 – Indent Tasks Indent the following under Build Foundation Dig Foundation Pour Cement Step 7 - Save file
FileSave AsC:\Data\MyProject.mpp Step 8 – Add Outline Numbering and project summary ToolsOptionsView tabX Outline numbering ToolsOptionsView tabX Project Summary 4-Day Class (Day 1 – 4:00pm) – end of day End of Day 1 Review – Project Charter, Preliminary Scope, Project Management Plan, PMI Exam Questions: 20 PMI Exam Questions: 1-7, 65, 66, 146
Chapter 4 – Project Scope Management Overview of Chapter
Create a Scope Management Plan Create a Scope Statement Develop a Work Breakdown Structure
Project Scope Management includes the processes to ensure that the all the work required to will be completed successfully. Project Scope Management is primarily concerned with defining and controlling what is and is not included in the project. We also need to be concerned about what processes need to be implemented to identify changes in scope. The Project Scope Management processes include the planning, defining and verifying processes. Review “How to create a scope management plan” Guidelines PMI42 What level of quality assurance is needed to release product or service? Identify a process to verify that all deliverables have been completed. Develop a process to maintain the WBS. Develop a process to identify and control change. Define the approval process. Define the product acceptance process.
4.1 Scope Planning This is a piece of the project scope management plan that documents how the project scope will be defined,

verified, and controlled. Also it will determine how the work breakdown structure (WBS) and the processes defined in the Scope Management will be followed. The amount of detail required depends on the size of the project. A small simple project with one person and several months to complete will require little scope planning. A large project that requires 100’s of people to complete will be very extensive to develop. You want to develop your scope document based on the result and size of the scope plan. The development of the project scope management plan and the detailing of the project scope begin with the analysis of information contained in the project charter, the preliminary project scope statement. You need to identify some of the factors that could affect the scope trying to eliminate scope creep (changing Scope). Cover yourself from implied changes what would cause the scope to change. Defining and managing the project scope influences the project’s overall success. Scope planning for a project is fully described by developing a written scope statement that includes the project justification, the major deliverables, and the project objectives.
Class Question L – Scope Management Plan
You are a Project Manager of a large project and the customer requests some minor color changes. You accept the changes without adjusting the scope. Later the customer requests a major change that may impact the cost or schedule. The customer responds, “I assumed that was part of the contract”. Now you have a conflict. How do you resolve the conflict? What would you of done different. Instructor Answer to class question – Scope management plan How do you resolve the conflict? You need to clearly document the cost or schedule impact as a result of the change. Don’t assume the customer understands the difference in the two requests. What would you of done different? Identify all changes to the scope as a scope change. Have a mechanism in place so scope change require very little documentation and communication. Identify in your scope management plan the types of scope that may require approval or communication to the team.
Instructor end of 3.2 – Game Wad a piece of paper and find a hoop to toss the paper into. (Use Road Trip Flipchart)
1. You can’t hit a target that is too far away (move target far away so the student can’t hit the target.) 2. You can’t hit a moving target (move target as they throw towards the target.) 3. Let the person hit the target any way they want. Conclusion: Don’t target your scope too far away and it can’t be a moving target. If your scope does not clearly state what you are trying to accomplish, it’s too far away. If your target can change too easily, clearly define what changes constitute a moving target.
Instructor end of 3.2: PMI Exam Question 19, 147, 184
4.2 Scope Definition (Reference PMI44, JM5P1) This entails developing a detailed project scope statement as the basis for project decisions. Using the original Preliminary scope statement, Project management plan, and the scope planning it is important to redefine the scope. Stakeholder needs, wants, and expectations can be identified and converted into requirements. The project team, who has additional insight into the preliminary project scope statement, can contribute to this definition. The assumptions and constraints are analyzed for and considered to provide a clearer definition. Include what is in the scope and what is out of scope. Anything outside of the scope is not your problem and your focus is your defined scope. This will define the inputs and outputs of the overall project and determine what is required for you to be successful.
Scope definition is necessary to improve the accuracy of cost, time, resource estimates, define a baseline for progress measurement and control and facilitate clear responsibility assignments.
Scope definition is subdividing the major project deliverables into smaller, more manageable components.
Make sure there are no open issues or leave things for open interpretation. You can’t manage the project if you can’t define the scope definition. The formal input requirements and deliverables is not a simple list but a clearly explained paragraph for each item. The input requirement will clearly define what is required and the deliverable or output will clearly define what is expected with the end results such as Shipped invoices, returns or warranties. These formal deliverables help define the scope.
Figure 2 – Defining the external aspects of the Scope definition.

Class Question M – Scope Definition Define the scope to build a Bird Feeder?
Instructor Answer to class question – Scope definition 1. Define what is in scope and out of scope of a bread box.
2. In Scope - size, dimensions, etc. 3. Define the dimensions height, width, length,
4. Composition: metal/wood/alumina, 5. Out of scope – No automatic controls, no autofeeder.
Project Plan Table of Contents - Before you can create the budget, the project's schedule, or the executive summary of a comprehensive project plan, you must create an outline of the plan or a table of contents. Once the project sponsor and stakeholders sign off or give their approval of the outline or table of contents, then you can create the executive summary, schedule, and budget.
4.2-2 Team Meeting to define scope It may require gathering the core team together to discuss the issues and define the scope. The following techniques can be used to develop alternative approaches: Review PMI47 –
Scope Plan
- Outside of scope - - Not in your project
- Outside of scope – - Not your problem.
Inputs Needed
Outputs or deliverables
Define what you will deliver Your Problem Your Project

Lateral thinking – The team looks at a problem in a new way and generates a fresh solution. Review different plans, methods, and approaches to produce the same result. Brainstorming – Structured or unstructured random ideas, generate as many ideas as possible. Delphi Technique – Setting guidelines to arrive on a group decision (card game).
Class Question N – Scope Definition Meeting What are some techniques can we use to help team members to prepare for a Scope Definition meeting?
Instructor Answer to class question – Scope definition Meeting Require each individual to research specific topics prior to the meeting. Some topics cannot be researched and needs to group input.
4.2-3 How to create a Scope Statement Review “How to create a Scope statement” Guideline PMI48 – Refinement of the preliminary scope statement
Class/Group Project #3 – Creating the Scope Statement You will now create a group scope statement for your project. At this point in the project we need to define the core elements needed to determine how big the project will be. We are presenting this to upper management and that should be the primary focus. We will define a few key points needed to be addressed.
Project Objectives – Critical success criteria factors or goals for product or service, must be realistic and obtainable. Functional Requirements-describe the system or product which is one of several possible ways to accomplish
the business requirements. Non-Functional Requirements-describe the processes the developing organization must follow and the
constraints that they must obey. Project Boundaries – What is not included in the deliverables. In Scope: : Items that are included in project.
Out of Scope: Things that are not part of the plan that could be included. Product Acceptance Criteria – The criteria that define what the end result will look like. May include the quality desired.
Instructor Class Project #3 – Backyard Pool Scope
Project Objective: Build a pool for family and friends Functional Requirements: Oval shape, 10Ft deep, diving board, and steps in shallow end. Non-Functional Requirements: Energy efficient, maintainability, and reliable. Boundries: InScope Out of Scope Cement walkway Landscaping Shed Fence Product Acceptance Criteria – Relaxing and safe atmosphere.

Group Project #3 – Define the Project Scope On a flip chart List the following categories and answer the questions based on your group project characteristics. Have one team member take the project Management role and gather the requirements by writing on a standing flip chart. Use the team input and answer the following questions.
Project Objective: Product Description: Functional Requirements: Non-Functional Requirements: Deliverable: Boundries: InScope Out of Scope Product Acceptance Criteria:
Class Question O – Creating an Effective Project Scope What would you include in your preliminary project scope statement to ensure that the work of the project is adequately defined? Instructor Answer for Class Question O – Creating an Effective Project Scope What would you include in your preliminary project scope statement to ensure that the work environment will be adequate? We would include in the scope statement a brief statement concerning the work to be done. This may include computer hardware and network. It might include the personalities of the individuals needed. If the project was to be delivered at a college campus you might need different individual than if it was being delivered at a high tech profit based business. Instructor Note: Day 2, 11:30 Leave early to lunch or do fill-in co Computer Training#2 Instructor Note: Day 2, 1:00pm
Chapter 5 – WBS/Activities (Reference PMI51, EK46) Final step in the Scope definition Must be deliverable based. Review the system Interview users Understand the falts Undestand the needs First pass you will miss may items Use a template that help build a good solid WBS Go to web, PMI, other related organizations. Objective: To create a list of activities/Tasks by putting the team to work on the details.

Statement – I have never seen anyone save time by doing the work in the wrong order, or by skipping required steps. If there isn’t time to do it right, then certainly there isn’t time to do it wrong. Tom DeMarco, Structured Analysis & System Specifications, EK-P35. The reason why we create Work packages is to make the activities easier to manage, make the activities easier to track and to create activities that can be assigned to a single organizational unit. Decomposition of project deliverables involves identifying major elements of the project, Decide if adequate cost and duration estimates can be developed at this level of detail for each element, and identifying the constituent elements of the deliverables. Understand each deliverable and the overall system and break it down to a WBS that will fulfill the deliverables The following is the level of decomposition of the project tasks down to the work package which is the lowest level of a task. In most project software packages decomposition can break down further, the following is the suggested PMI decomposition: Activities Deliverable Sub-Deliverable Work Packages Review “How to develop a WBS” PMI54 Gathering Project Charter, scope, management plan Historical or WBS Template Organize Major product deliverable (Activity) Life cycle phases Organizational or functional responsibility Geographical Locations Activity Major categories Deliverable Determine if deliverable is the work package or needs sub deliverables Sub Deliverables Keep creating sub-deliverables until you reach the work package Work Package The task that will be completed and the resources assigned Bottom-Up approach
Start by estimating the costing at the lowest work package level and allow the cost to roll up to higher levels. Group up teams to define the low level tasks
Assign Codes Assign the necessary accounting codes to work packages

Characteristics of a code of accounts are it uniquely identifies each element of the WBS, it is a numbering system and it includes work packages. Milestone Charts – Milestones generally are a 0 length duration and are a single insistence in time. They show overall project schedule and performance to date.
Leave room on right for Durations and assignments Note: PMI recommends that you include PM Deliverables on WBS These 5 components can be done at the same time on smaller projects but these components will be contained in the time management piece.
5.1. Activity (Task) Definition (Reference PMI62, JM6P1) Now we will look into Estimated Durations to activities, tasks, and adding milestones. The goal is to document the work to be done and create the high level Work Breakdown Structure (WBS). Then we will further breakdown the WBS to define each task to be performed.
5.1-1 Rolling Wave Estimate The rolling wave estimate is a technique is we can use estimate the duration analysis phase, which is used to estimate the design and development phases. The analysis phase will define the actual tasks needed to determine what the task consists of. Based on the results we can then define the design phase and in turn define the development phase. The level of error will go up because the level of unknowns will increase. Although, management needs to know the total estimate of the entire project you can document the level of confidence of the accuracy of the design phase. You must clearly state that this estimate is based on the results of the analysis phase and provide the level of accuracy/confidence. The following table will describe how this level of accuracy is developed: Activity Deliverable Work order Effort(hrs) +-Error Analysis D1 Task1 10 0 Task2 11 0 Task3 13 0 D2 Task1 9 0 Design D1 Task1 27 +-10 Task2 22 +-5 Developemnt D1 Task1 29 +-20 D2 Task2 6 +-2 Task3 30 +-13 ----------------------------------------------------------------------------------------------------------

160 hrs As high as 210hrs As shown the effort is 160 hours and can be as high as 210 hrs. You can either submit the 210 hrs as the estimate or 160 with as statement concerning the level of error.
5.2 Duration Types Although duration is an estimate of time or effort required to complete a job, there are different terms that that effort can be identified by. Activity – an Activity is a major task or combines a group of tasks which has a specific output or deliverable. Task – Is a series of activities that make up an activity. In some cases, people refer to a task for all hierarchy, but the correct terminology is an activity. Work Package – The lowest level of a project hierarchy that actually performs the work to be done. The hierarchy is the activity then the task and then the work package. Show example of ActivityTaskWork Package Project Milestone (or Gate) – Point of a project phase or formal review time. This is usually an instant in time and does not require and duration. The milestone could take up some time such as an inspection may occur over a period of time, but there may be no billable work associated with it. Usually, a milestone indicates a completion of a group of work orders that make up and activity and will appear at the end of the activity work orders. If the milestone appears in the beginning of an activity it is considered a ground breaking event. A gate is another term that can be used to identify a milestone. Deliverable – This is similar to a milestone because it occurs at the end of an activity, but it is an actual or sometimes tangible result from the activities completion. The deliverable can be used as input to the next activity and is usually a requirement to kick off the new activity. Outputs – This the end result of an activity. It defines the what is required from the effort to be done in the activity. 8/80 rule –This is a rule to define how big an activity, task or work order should be. If a task grows beyond 80 hours it should be broken down to several smaller tasks in order to better manage it. If a task is less than 8 hours it should be combined with several tasks and the description of the task will include the combined work packages. Although, the 8/80 rule is acceptable for small projects it may be impractical for large lengthy projects.
5.3 Steps to create an activity list Review “How to create an activity list” Guideline PMI65 Gather input information- WBS, Template, Scope statement, historical, constraints and assumptions Decompose each work package Consult subject matter experts Evaluate constraints and assumptions related to activity Detailed actions to be performed. Specific descriptions, deliverable

5.4 Activity Duration Estimating (Reference PMI87, EK55) Activity duration estimating should be done by the work package owner. They can better apply the tools and the knowledge estimates to the task and they are closest to the task than anyone on the team. The project management team can verify the result but the task owner should be the one to perform the calculations and come up with the duration value. Effort not the duration. If you assume a 40 hr work week is needed and you assign it to two people it can be done in ½ week. The SW will figure this out as you make assignments.
5.4-1 Resource availability If the estimate effort is 40hrs assigning a resource that has other responsibilities or things to do may require more than 40 hrs. to complete. Sometime will be used for Vacation, sick, reading email, attending meetings. If the assignment is short assignment then 42hrs is the best estimate, If along assignment such as 200hr effort than 220 may be the best estimate based on Vacation and sick requirements. When you equate the effort to duration such as 42hrs effort it may equate to 5 days or 6days depending on the potential distractions. If this person is a project Lead managing aspects of the project you might estimate the durations on the high end.
5.4-2 Actual estimating technique Objective: Now that you have assigned resources you may need to adjust durations, Pert Analysis Estimates (Duration Estimate Techniques) Program Evaluation and Review Technique (PERT) Uses estimation techniques to determine the best guess duration
1. Single point estimate – Each person in the class will do their best guess at the durations. (Most Likely) 2. Modified Delphi (Multiple Estimators)– Discuss the duration as a group and come to an agreement.
Expert Judgment 3. Triangulation – Create optimistic, most likely and pessimistic guesses.
Formula – (O+M+P)/3 4. Pert Estimate (Sometimes called Three-Point Estimates)
Creates optimistic, most likely and pessimistic guesses. Optimistic = The shortest possible time. (No problems) Realistic = Best Guess Pessimistic = Worst possible time (even if things go wrong)
Formula – (O+4M+P)/6
Group Exercise #5A – ROM Estimates (ROM=Rough Order magnitude) Estimating Exercise 1 – Height of a person First ask the Realistic (actual distance), then ask for the Optimistic and Pessimistic.

Pert Analysis – Optimistic, Realistic, Pessimistic estimates Distance in inches from floor to my knees 15 18 28 Distance from head to shoulders 10 16 16 Distance from knees to belt 24 29 48 Distance from shoulder to belt 24 24 34 Total 73” 123” 6’1” 10’3” If I ask how tall I am would you say 10’3”
Class/Group Project #6 – Add estimated durations and milestones You will now create a Work Breakdown Structure (WBS) to define the activities, tasks, and work packages needed to develop your project. We will define the WBS detail as shown in the example below, leave a space for the owner of the task to be added at a later time, the total effort which is the actual hours required to complete the task, and the total duration which is a approximation in days or weeks from the hours required to complete the task. ???I think there was something else needed after the tot dur.
WBS Detail Durations Owner Tot Effort Tot Dur 1. Activity
1.1 Task 1 ----------------- Hrs Days 1.2 Task 2 ----------------- Hrs Days
Instructor Class Project #6 – Estimated hours for the Backyard Pool Project
WBS Detail Durations Owner Tot Effort Tot Dur 1. Rough Grading
1.1 Heavy Equip ----------------- 8h 1d 1.2 Dumpster Digging ----------------- 8h 1d
2. Elect/Pluming 2.1 deep digger ----------------- 8h 1d 2.2 shoring edges ----------------- 8h 1d 3. Electrical/Pluming 3.1 Drain ----------------- 24h 3d 3.2 Other drain ----------------- 32h 4d 3.3 Lighting ----------------- 40h 1w 4. Cement 4.1 Cementing ----------------- 40h 1w 5. Leveling ----------------- 32h 4d 6. Pump/shed 6.1 Carpenter ----------------- 32h 4d 6.2 piping ----------------- 24h 3d 6.3 Electrical ----------------- 24h 3d
7. Project management Tasks 7.1 Kickoff Meeting 7.2 Post Project Review 7.3 Quality Assurance Audit

7.4 Information Distribution (Where, who, what) 8. Finishing
Group Project #6 – Estimated duration and milestones On a flip chart put the WBS and leave room for the Owner, Total Effort and Total duration. Have one team member take the project Management role and gather the requirements by writing on a standing flip chart. Use the team input to develop the WBS.
WBS Detail Durations Owner Tot Effort Tot Dur
PMI Exam Questions: 42, 63 PMI Exam Questions: 18, 21, 30, 51, 122, 180, 181, 183 PMI Exam Questions: 179
Chapter 6 – TIME Management Overview of Chapter
Instructor Guide – Try to hold back on discussing resources at this time until you get to chapter 5. 2-Day Class (Day 1 4:00pm)
6.1 Activity (Tasks) Sequencing Sequencing is used to establish relationships between activities, tasks or work packages. Several techniques will be discussed to establish relationships and view the results.
Rewrite
Dependencies can be categorized as mandatory, discretionary, and external. Mandatory dependencies are those that are required as part of the work and are sometimes called hard dependencies the walls of a house cannot be built until the foundation is completed. Discretionary dependencies are those that are defined by management. These are preferred ways of doing things and may be determined by past experiences. External dependencies are those that are external to the project. These are all of the inputs that are supplied by anyone or anything outside the project. and can be restricted by constraints and assumptions. Instructor notes (Reference PMI69, EK49)

6.1-1 Task Relationships Task Dependencies – Your looking for the mandatorily or external dependences as they relate to primary tasks. Low priority tasks (Discretionary – Optional) need to be included but try to reduce complexity. FF, SS, FS, FF Predecessor – Relationships of FS, FF, SS, SF Finish-To-Start (FS) – The successor starts when the predecessor finishes. Example 1: Software is installed after the shipment is received. Example 2: Software development starts after requirements finish. Example 3: Paint fence can’t start until construct fence finishes. Example 3: Level concrete can’t begin until Pour foundation finishes. Start-To-Start (SS) – The successor starts when the predecessor starts. Example 1: Software and hardware purchase occur at the same time. Example 2: Develop software requirements and hiring engineers occur at the same time. Finish-To-Finish (FF) – The successor finishes when the predecessor finishes. Example 1: Inspect electrical can’t finish until add wiring finishes. Start-To-Finish (SF) – The successor finishes when the predecessor starts. Example 1: Groundbreaking will occur when obtaining permits finishes. Example 2: When a bus arrives (start) is when waiting for a bus finishes. Example 3: You start paying your bills when you receive your pay check..
6.1-2 Lead and Lag Time A lead is used to accelerate a successor task and a lag is used to delay the predecessor task. Lead (-1d or -50%) – Allocate delay to allow tasks to overlap Example 1: When you pave and stripe a street, you do not have to complete the paving before starting the striping. Lag (1d or 50%) – Allocate sometime between tasks to provide distance. Example 1: Cement must dry x days before building starts. The precedent activity is the task that comes first and the subsequent activity comes after. In a finish-to-start precedence relationship with a one-day lead the subsequent activity can start one day before the precedent activity is completed. Instructor Note: Day 3, 9:00am
6.2 Dependency Diagrams Both ADM and PDM charts PERT and CPM show the critical path. 6.2-1 Activity of Node or Precedence Diagramming Method (PDM) Precedence Diagramming Method (PDM) [Technique]. A schedule network diagramming

Technique which schedules activities represented by boxes. Activities are graphically linked by one or more logical relationships to show the sequence in which the activities are performed. Network Diagram is another name for the PDM and is usually generated automatically by Project Management software. There is no strict rule what information can be in the box and software vendors have a great deal of flexibility in this area. Although, the box should contain the name of activity, ID, start date, finish date, duration, and resource is available. The arrows should contain labels that describe how they are connected such as lead and lag information. Reading the diagram indicates the successor and predecessor relationships. Keep in mind that they may have more than one relationship.
Provide an example of activity on node Capture a picture of MS Project Network Diagram The activity number will appear on the arrow not the node Start--FS--1Activity--FS--2Activiry-SS-A 6.2-2 Hammock Activity A Hammock is a summary activity (which is a series of related activities is shown as one group and reported at a summary level.) It may cross between milestones or across multiple interdependent work packages. It is usually displayed in bar chart reports.
6.2-3 Conditional Diagramming method – Flow chart p78 6.2-4 Graphical evaluation Review Technique (GERT) – PMI79 Graphical evaluation and review technique (GERT)—allows for probabilistic treatment of both network logic and activity duration estimates A network analysis technique that allows for conditional and probabilistic treatment of logical relationships is know as:
Graphical Evaluation and Review Technique (GERT).


6.2-5 Logic Diagram EK50
6.2-6 Gantt Bar Chart Typically a Gantt bar chart is a Gantt chart without the interrelationships or just the bars displayed. Using computer generated Gantt charts it is just as easy to display the interrelationships along with the Bars which makes this type of chart not as used. It is basically the same as Precedence Diagramming Method (PDM).
Class/Group Project #7 – Develop a Network Diagram Draw a network diagram similar to the following.
PMI Exam Questions: 28, 33, 36, 38, 39, 52, 74, 75, 76, 77, 113 4-Day Class(Day 2 – 12 noon) 4-Day Class(Day 2 – 1:00pm)
6.3 Schedule Development - Critical Path Method (Reference PMI93) Objective: To identify the activities that when changed will affect the end date of the project.

Near-Critical Activity. A schedule activity that has low total float. The concept of near critical is equally applicable to a schedule activity or schedule network path. The limit below which total float is considered near critical is subject to expert judgment and varies from project to project. If the total float is less than 0 then it is not near critical but Free Float (FF). The amount of time that a schedule activity can be delayed without delaying the early start of any immediately following schedule activities. Sometimes called Slack or Slip of a project task. Total Float (TF). The total amount of time that a schedule activity may be delayed from its early start date without delaying the project finish date, or violating a schedule constraint. Calculated using the critical path method technique and determining the difference between the early finish dates and late finish dates. See also free float. Start----- Task1(3hrs)-------Task2(4hrs)---Task5(3hrs)-----Task6(2hrs)------end | | | 3+4+3+2=12 CP ---Task3(6hrs)--------------------- | 3+6+2=11 NearCP | | 3+4=7 ---Task4(4hrs)---------------------------------------- Slack Backward Pass. The calculation of late finish dates and late start dates for the uncompleted portions of all schedule activities. Determined by working backwards through the schedule network logic from the project’s end date. The end date may be calculated in a forward pass or set by the customer or sponsor. See also schedule network analysis.
Class/Group Project #9 – Critical Path Method (CPM) Refer to Network Diagram outline and identify where slack in needed. Do you have critical junction in your project? Explain Slack using Early Start, EF, LS, LF, Slack, Slack Total (EK57)
Computer Training #4 – Linking, Lead, Lag, Constraints PTS Ch5. Continue with House3.mpp or house4: add deadline, Format Bar styles, review the Task info Dialog Box Instructor Handout – Parameters for creating a project
Relationships, Lead, Lag, Constraints Instructor Handout – Project2003-1 Definitions.doc Link all Activities, look at the Network Diagram

Computer Training #5 – Pert Estimating ViewToolbarPert Analysis (Project 2003, not in 2002) Discuss Calendars, New cal, ProjectProj Info, Format Timescale, Base cal, union cal
Computer Training #6 – Critical Path
(Reference PTSCH11) Open House10 or rooms10 1. Identify tasks with possible Risks 2. Add slack to the task 3. Show how to add negative slack
PMI Exam Questions: 34, 40, 44, 79, 139 PMI Exam Questions: 37,131,198 Instructor Guide – Day 2 End of day, Don’t do any resource work until this chapter.
Chapter 7 – Resource Assignments
Overview of Chapter
Develop a Project Schedule 11a. Leveling 11b. Schedule Develop,
7.1 Activity Resource estimating (Reference PMI82, JM7P1) Objective: Identifying and describing all the resources required to complete the scheduled activities. The responsibility matrix is a good way to define the responsibilities of the team. This is not only helpful for the Project Manager to define the responsibilities but for the team members to take responsibility when the going gets tough. The responsibility assignment matrix is very useful in defining the relationships between the roles of individuals on the project team and their responsibilities. There may be a different responsibility matrix for different parts of the project such as design, development and implementation.
Responsibility and Assignment Matrix Project: Name of Project

Date:
R – Responsible for performing some or all of the work. A – Accountable for the activity (Only one per task) C – Consulted during the task before finalizing. I – Informed of the results. One-way communication. S – Sign off responsibility Date
LoggedDue Date Done Action Item
1 2 3 4 5 6 7 8 9 10
Review “How to estimate activity resources” Guidelines PMI84 Resources needed and number Alternatives to resources Organizational policies Expert Judgment resources
Handout09-Responsibility and Assignment Matrix (RAM)
7.2 Make Assignments
Class/Group Project #8 – Add resources Test out resource Graph Determine the resource requirements Assign resources to complete the activity ?Identify the level of quality? Make Assignments – List the tasks, specify the hours to work, specify the responsibility, total the effort for each task. Owner tot effort tot dur 1. Rough Grading
1.1 Heavy Equip ABC Construction 8h 1d 1.2 dumpsterDigging ABC “ 8h 1d

2. Elect/Pluming 2.1 deep digger ABC “ 8h 1d 2.2 shoring edges ABC “ 8h 1d 3. Electrical/Pluming 3.1 Drain Testy Pluming 24h 3d 3.2 Other drain Testy Pluming 32h 4d 3.3 Lighting Testy Pluming 40h 1w 4. Cement 4.1 Cementing All Cement 40h 1w 5. Leveling Pool Company 32h 4d 6. Pump/shed 6.1 Carpenter Mr Carpenter (2carp) 32h 4d 6.2 piping Testy Pluming + asst 24h 3d 6.3 electrical Testy Pluming 24h 3d 7. Finishing Pool Co (2 people) 40h 1w Jim’s structure
O=Owner I=Implementer A=Approval Jim Dan Denise Kids Total Duration
Start Effort Buy 6 O 6h Clear 3 I 9 O 12h Design 6 O 3 I 3 I 12h Dig 3 I 6 O 9h
b. Plot on Gantt Chart
Start 0 Design 2 ____ Buy 2 |____/// Clear 3 |_3_3_3 Kickoff 1 |_3///////| Dig 2 |_3_3 Pour 2 +1d lag |____ Frame Sides 2 |____ Frame Roof 2 |____ Sliding 2 |____ Roofing 2 |____| Primer 2 |_3_3 Stain 2 | |_3_3 Paint Trim 2 |_3_3///////| Post Project 1 |_3 Finish 0

Resource Loading Kids Work -- -- 6 3 3 3 3 -- -- -- -- -- -- -- -- -- -- -- 6 6 3 3 3 Create Histogram 7 ______ ______ 6 | | | | | | | | 5 | | | | | | | | 4 | | Max Loading | | Max Loading | |____________ | | ___________ 3 | | | | | | | | 2 | | | | | | | | 1 | | | | --------------------------------------------------------------------------------------------------------
Computer Training #5 – Resources (Reference PTSCh7) 1. Work- People Resource, Work Scheduled Equipment, Material Resource
Group, Max Units, Standard Rate, Overtime Rate, Cost per use 2. Open HOUSE6
Resource Material Label Initials Group Max Units Backhoe Operator
BO UNION 200%
Superintendent SP MANAGER 100% Phone Technician
PT CONTRACTOR 100%
Cable Specialist CA CONTRACTOR 100% Backhoe B EQUIPMENT 200% Concrete Yards CO Insulation Sq Ft I Drywall Sheets DW Title Sq Ft T
3. 3 ways to assign resources
Task1- Assign Surveyor at 200% Task 2 – Assign Architect at 100% Task 12 – Assign backhoe Operator at 100% Task 13 – Assign Smooth Foundation

Task 27 assign Cable Specialist 4. Graph 5. Task form 6. Exercise Open rooms6 (PTS131, PTS132, PTS133)
PMI Exam Questions: 46 4-Day Class(Day 2 – 3:00pm)
7.3 Leveling (Reference PMI104) Objective: Determine techniques to adjust resources to avoid conflicts or over-allocations Cocomo Model – Small project with a big team is not efficient. (training will be large) Large project with small team is not efficient. Full utilization of the staff If staff is not utilized (not assigned to a task) it is not efficient If staff is over utilized that means he is working overtime. Average team effort Team 40hrs per week Effort Time If some staff is not working somedays and overworking some days it is not good utilization of team. Get you staff on or close to the bar as possible Schedule Compression – Fast tracking FSSS or add Lead Crashing – Shorten duration by adding resources Focus on true mandatory dependences and critical path tasks otherwise you will have no impact on the overall schedule Change the environment Can I add more productivity tools to get things done faster.(?learning curve) Change estimates ??Check to see if crashing includes adding resources. Fast tracking – Overlap durations (Leads) Focus on true mandatory dependances and critical path tasks otherwise you will have no impact on the overall schedule What can I do to make it finish faster.

Change true dependences, introduce lags, Add resources and reassign resources to tasks to reduce the duration of the task Is usually the first action to take to shorten the project duration on the critical path. Assigning Limited Overtime Implementing Shortcuts – Reduce time of a specific task, adjust specs, utilizing available resources to do understaffed tasks Simulation Monte Carlo Analysis – Plot 2 different vendors to compare the outcome What-If Analysis – Plot best and worst situations Resource leveling – Pushes schedule out, Under/Over Allocations
7.3-1 Leveling Strategies (Open House8)
7.3-1a Leveling Resource Usage ViewSelect Labor/Install Windows taskGo to selected task
ToolsLevel ResourcesLevel NowSelected Resources
7.3-1b Adding Hours Manually Resource Usage ViewSelect Labor/Install Windows taskGo to selected task Work T W T F M T W
The current leveled schedule looks like the following: Install Doors 48hrs 16h 16h 16h
Install Windows 64hrs 16h 16h 16h 16h Change to the following – The total work must be the same: Install Doors 48hrs 24h 24h
Install Windows 64hrs 24h 24h 16h
7.3-1c Add More Resources Resource Usage ViewSelect Painter/Painting taskGo to selected task Double click on Painting taskReview 400% Resource Sheet viewPainterChange to 400%
7.3-1d Change Relationship Resource Usage ViewSelect Contracting Specialist/Obtain Bids task
Go to selected task Gantt chart viewSelect Obtain BidsGo to selected task Select the link between Obtain Permits/Obtain Bids

Finish-To-Start relationship0d Resource usage view to review results
7.3-1e Lead/Lag Resource Usage ViewSelect Carpenter/Frame Garage taskGo to selected task Gantt Chart viewSelect Frame HouseGo to selected task Select relationship Frame House/Frame GarageLag=0d
7.3-1f Lead/Lag Resource Usage ViewSelect Backhoe Operator/Smooth Foundation task
Go to selected task Gantt Chart viewSelect Smooth Foundation Go to selected task Select relationship Backhoe Operator / Smooth Foundation Lag=0d
7.3-1g Split Task Gantt Chart ViewSelect Landscaping TaskGo to selected task
R-Click on the Landscaping barSplit Task Click just above the “Cement Work” task on the Landscaping task
7.3-1h Reassign Resources This technique uses ViewResource Graph and ToolsAssign ResourcesSelect several resourcesGraph button. Use this to find the remaining availability of existing workers.
7.3-1i Overtime Allocation Split (Gantt Chart view/Task Form view)
Select Initial Electricity taskGo to selected task Select just below the Predecessors box on the bottom FormatDetailsResource Work Add overtime and click OK until the Initial Plumbing and Initial Electricity tasks are the same duration.
7.3-1j Reassign Resources Reduce the Painter to 300% and add a Laborer who can help with the cleanup. In the Gantt Chart view open the Paint Task informationResources Tab
Make the following change: Assign Painter (300%), Laborer (100%) The result is 3.2 days.
To understand how this happened we need to look at the work. Open a split (Gantt Chart/Task form)

Select the Painting task and notice the work hours The painter is assigned 96 hrs which is 4 days (2.4 days)
You can also see the hours assigned per day in Resource Usage view WindowsNewResource Usage Page down to see the Labored and the Painters tasks
To fix the problem The Painter must work 76.8 hrs and Laborer must work 19.2hrs.
End of day - Day 2 – 4:00pm Day 3 – 9:00am Open House4.mpp or rooms4.mpp and review linking, Lag, Lead, constraints, and deadline concepts. PMI Exam Questions: 35, 41, 48, 73, 88, 135,170,171
Chapter 8 – COST Management Overview of Chapter
Estimate Project Costs Establish a Cost Baseline Cost Budgeting
8.1 Cost Management Plan Is a document that defines the estimating, Budgeting and controlling processes to manage cost. It can be formal, informal, detailed, or contain brief information. The end result is a document describing how cost will be managed.
8.2 Cost Estimating Cost estimate is a process of using techniques to determine the cost of resources, equipment and materials. The estimate is based on the information available for historic data, experience, bids, and intelligent guesses for project tasks. Cost Estimating Cost Aggregation or Bottom-Up estimating– Lowest Level first roll up to higher levels of WBS. Analogous Estimating – Use a similar project or historical date. Considered a top-down estimate technique because you are comparing with existing data (Bottom-up would be developing the numbers without anything as reference). Cost for the team, Equipment, materials and supplies Life cycle costing – trade off of spending more now and less later. If you spend more time upfront with the analysis and design phase will save time in the end.

Better req. more robust design so the development will go more smoothly. Cost Elements
Direct costs – every hour in the day Indirect costs –fringe benefits (Insurance , Vaca,), telephone, desk, etc. Fixed costs – could be a resource, equipment or material. Variable costs – for every unit used there will be a variable cost associated with it.
Order of magnitude estimates – This is an indicator of how wide or how far off the estimate can be. For example, an estimate can have an accuracy of -25 percent to +75 percent as the project progresses. Some estimates may be more predictable and have a smaller variance. Wider magnitudes may be an indication of potential risks due to the cost impact to the project. Providing a range of estimates such as bids is an alternative to using an order of magnitude estimate. Cost Variability – How much control do you have over the cost over time (inflation or deflation) The material may cost more in the future and reduce the overall budget. Another example is technology may cost more now and less in the future.
How much control over volume costing such as software Licensing. Estimating techniques Analogus approach - Last time we did a project like this it costs a specific amount. Unit cost – based on the effort (default costing) Parametric approach – For every dollar it costs a unit of area An example is drywall costing based on the square footage of the house. Vendor bids – Ask vendor to give a fixed price bid.
rewrite this section - Analogous duration estimating means using the actual duration of a previous, similar schedule activity as the basis for estimating the duration of a future schedule activity. It is frequently used to estimate project duration when there is a limited amount of detailed information about the project for example, in the early phases of a project. Analogous estimating uses historical information (Section 4.1.1.4) and expert judgment. Analogous duration estimating is most reliable when the previous activities are similar in fact and not just in appearance, and the project team members preparing the estimates have the needed expertise. Parametric Estimating – The parametric estimating technique involves using project characteristics (parameters) in a mathematical model to predict total project costs. and example of this is measuring the Footage of room and generating an estimated cost. rewrite this section - Parametric Estimating Estimating the basis for activity durations can be quantitatively determined by multiplying the quantity of work to be performed by the productivity rate. For example, productivity rates can be estimated on a design project by the number of drawings times labor hours per drawing, or a cable installation in meters of cable times labor hours per meter. The total resource quantities are multiplied by the labor hours per work period or the production capability per work period, and divided by the number of those resources being applied to determine activity

duration in work periods. rewrite this section - Three-Point Estimates The accuracy of the activity duration estimate can be improved by considering the amount of risk in the original estimate. Three-point estimates are based on determining three types of estimates: Most likely. The duration of the schedule activity, given the resources likely
to be assigned, their productivity, realistic expectations of availability for the schedule activity, dependencies on other participants, and interruptions. Optimistic. The activity duration is based on a best-case scenario of what is
described in the most likely estimate. Pessimistic. The activity duration is based on a worst-case scenario of what is
described in the most likely estimate. An activity duration estimate can be constructed by using an average of the three estimated durations. That average will often provide a more accurate activity duration estimate than the single point, most-likely estimate. rewrite this section - Expert Judgment Activity durations are often difficult to estimate because of the number of factors that can influence them, such as resource levels or resource productivity. Expert judgment, guided by historical information, can be used whenever possible. The individual project team members may also provide duration estimate information or recommended maximum activity durations from prior similar projects. If such expertise is not available, the duration estimates are more uncertain and risky.
Vendor Bid Analysis – Comparing multiple Bids Objective: To determine the cost of resources to determine the overall cost to the project. The process of projecting the cost of resources to complete a project. Bottom-up estimating – Cost of activities rolled up to higher levels. The disadvantages is it is not cost effective because it takes longer to complete the project and it is timeless because you have no idea how each task will effect the overall project. Analyze Estimating – Previous project with similar scope to estimate total cost Least accurate, quick technique Parametric Estimate – Based on footage of room modeled from history Vendor bid analysis – Comparing multiple bids Resource Analysis???? Cost estimate tools and techniques Determine resource cost rates – Per unit cost of each resource

Computer Training #9 - Cost Estimating Open House9 to practice - Change Resource hourly cost Resource Sheet ViewTableVariance ViewTableCost (Fixed Cost) Shorten carpet to be one day PMI Exam Questions: 43, 49, 53, 57, 56
8.3 Cost Budgeting (Combine w/12) The process of finalizing or documenting the values from the estimating process which establishes the cost baseline. To determine the overall cost to begin the project. Sometimes you already have the budget approved then this step is to verify there is enough money to complete the project. Instructor Reference - (PMI127, EK66) refer to JM7P7 Budget/Baseline factors Labor, supplies, equipment, overhead, contingency/Reserve, Travel, Opportunity cost, Inflation, Currency fluctuations, indirect and direct costs. Aggregating costs - All of the costs of the WBS (direct, indirect, fixed and variable costs) Cash flow management – Provide a month by month cash flow to the project and allows the financial analysis to obtain the cash as needed. Some ways to prevent cash flow problems is to keep project activities on schedule and make sure customers are financially stable. Cost baseline – It is usually an original cost of the project where future measurements will be compared against. But, due to the inaccuracies induced as the project progresses it could be an estimate of the most likely project costs, contingency cost, or an assumption for the estimates. How the baseline cost is used is dependent on the person intends to compare the baseline cost with the current schedule. Contingency – This is the reserve of the unknown issues that will provide the cost flexability to handle those unknown issues. How to create a contingency budget will be covered in the Risk management section. Degree of confidence – If your not sure how accurate your estimate is you might need to make a note describing the degree of precision such as +-10%. Accounting Processes – used by the accounting department while handling the cash. Present Value(PV) – Determine what the future value will be by investing for 2 years In a 6mo project the present value is no different from the value now and in 6 months. Applying the value of current rates compared to What is $1500 today be worth in 2 years. Future value is the opposite of PV Chart of accounts - Numbering system that identifies the specific accounting category for each element of project work.

Net Present Value (NPV)- present value minus the cost Rate of return(RoR) – Is this a good investment. When will this project pay back Payback period – When will the pay back occur. 2-4 year project these may affect the budgeted money PMP you need to be aware of these terms see nugget 09 end of presentation Develop Contingency Budget Dig Pool 4K Cement/Smooth 5k Plumbing (bill by the hour) 7K How will it impact the other tasks? Will anything get in the way of doing the job? Come up with an optimistic and pessimistic estimate
Computer Training #10 – Cost Budgeting / Baseline
(Reference PTSCh10) Use House9 to define Baseline - Establish Baseline (PMI P131) , Statistics, Summary
Write on board: ToolsTrackingSave baseline, ViewTableVariance, ViewTracking Gantt, ViewMore ViewsMultiple Baseline Gantt
Review if appropriate: Add baseline1 to new view (New View, FormatBar Styles) PMI Exam Questions: 55
Class/Group Project #?? – Budgeting Referring to the project management plan, ROM, WBS, and resource management, estimate the budget based on the new information provided. Write this budget value in the WBS budget column.
8.4 Cost Control The process of monitoring the cost and controlling changes to the budget. Cost control – The management processes are in place so the project gets delivered. Make sure all of the costs are used appropriately
Make sure the project delivers on budget Baseline can be compared to verify Approve all changes

Manage Changes Approve changes Bad Labor Estimates Bad Price estimates Earned Value Analysis On-time or On-Budget Ahead Over Ahead Under Behind Over Behind Under Variences There will be times then things will cost more and you are taking
Some times materials will be higher than planed Need to take the appropriate action to as needed World wide shortage of this material what do we do now.
Do we cancel the project or do we spend the $ necessary to complete the project. Value Engineering – is a creative approach used to optimize project life cycle costs, save time, increase profits, improve quality, expand market share, solve problems, and/or use resources more effectively.
Chapter 9 - QUALITY Management Overview of Chapter
Create a Quality Management Plan Overview The purpose of a project is to meet the requirements of the stake holders. The complex nature of modern projects usually have multiple stake holders finance companies, primary customers, and others that have a strong interest in the success of the project. The goal is to meet the expectations not exceed the expectations because although exceeding can be better it may be perceived as a waste of time and money. Also, having a product that has a failure rate of 0% may cost too much to achieve that goal.
Quality should not be confused with grade. Low grade is not necessarily a bad thing as long it is part of the project plan. The product may be designed to appeal to a low cost market and grade may be low to reduce the cost. The quality is based on the intended result of the product and accidental low grade is a factor of poor quality.
There are 3 quality categories we will explore. First is the planning, we must define what level of quality is desired. Second is assurance, we must put standards in place to give a baseline to follow. Third control, we must put certain controls in place to verify the quality.

9.1 Quality Management Plan This is the overall quality document describing how the team will implement the quality policy. It can be formal, informal, detailed, or contain brief information. The end result is a document describing how quality plan will be managed.
9.2 Quality Planning This is a process identifying which quality standards are relevant to the project and determining how to satisfy them. Instructor Guide - (Reference PMI140) Quality is the conformance to requirements and fitness for use. It is not necessarily a 100% quality product. The Quality Plan will determine what level of quality is needed so it will not impact the overall success of the project. Some projects require a higher quality plan than others. The Plan will establish guidelines and use the guidelines as a measurement tool. Keep in mind that time and cost is a key factor in determining the plan. Instructor Example – Some projects require higher quality than others Develop a project to develop a satellite requires a very strict quality. Double booking a conference room is not as critical as a satellite. Cost and time impact is one factor in determining quality. Feel free to add to this list based on your experience. Let us define some quality terms to help you determine the level of quality desired. Fitness for use = The product must usable or deliverable.
Customer Satisfaction - It must meet the customers expectations. Prevention vs Inspection – Implement prevention into the plan rather than the production cost of failure. Continuous improvement - Learning from our mistakes.
80/20 rule - The 80/20 rule means that you apply 80% of your quality to 20% of the most critical tasks. In other words you identify the process that is most prone to failure and you apply 80% of your effort. Time is money so we may need to compromise once in a while and the 20% is a smaller yet focused sample. The following chart shows the cost to the project in the early stage compared to the later stages. Prevention vs inspection (walkthroughs) 1000 100 10 Req Analysis Design Development Implementation Cost is lowest at requirements and analysis stage. If the quality is found at the development stage is very costly to fix. If you find the problem in the requirements stage it will be very little cost to fix.

The following chart shows the cost of inspection vs. the cost of defects. If you do too many inspections the cost will go up compared to the number of defects found. As you increase the number of inspections you will find fewer defects. If I inspect 10 times I may get 10 defects. If I were to inspect 20 time I will less than 20 defects. Number of defects vs the cost of inspection 100 Cost of inspection Cost 50 Cost of defects 0 Level of increasing inspections Instr Note – Verify if the following is in the PMBOK book and consider removing if it is not. Deming’s fourteen points – Deming is best known for his 14 points he developed in conjunction with the Japanese industries which serves as a guideline for practice of practical quality Management. Constancy of purpose, adopt new philosophy, eliminate need for inspection, only consider total cost (not price), improve constantly, initiate OJT, initiate leadership, drive out fear, break down barriers, eliminate slogans/targets, eliminate management by standards/quotas, remove barriers to pride of workmanship, institute education /self improvement, and get everyone involved.
Verify the 14 points are listed above Quality Plan Guideline The plan is not what we are going to do but what level of quality is needed. ??? refer to the EK book to see if they have a guideline to create a Quality Plan
1. Add a task to the project plan that will verify the quality level of the scope reqirement 2. Budget??? 3. Schedule???

9.3 Quality Assurance Quality assurance is a pattern of activities which achieve a state of confidence that the product meets quality requirements. It is a measurement of Time, Cost, and Quality in your project. You will need to ensure the quality process are being followed and ensure we are doing the right things. Project performance measurement baselines - A management control, prone to change only intermittently and generally only in response to an approved scope change. Reducing waste Non-Value activities are not in the plan, but the right quality elements are there. Continuous Improvements There is an element of Audit, walk through are necessary Root cause analysis – Why are discoveries happening Cost of quality - Is sometimes categorized as the cost of conformance. To be cost effective we must ensure the most effective proportion among prevention, inspection, and repair. Build Quality into the project plan Knowing that it is better to plan for quality in the early stages then you will need to build quality tasks into your project. Quality Assurance Guidelines The quality assurance is what are we going to do to ensure the quality plan will be fulfilled.
1. What audits will be in the project plan to ensure the quality will be adheared. 2. What continuous improvement plans are in the project plan to ensure adhearance. 3.
Instructor Guide - Build a home - Expand this example Does every single aspect be 100% done or do you need to move in as soon as possible If you move in can the few issues be fixed after move in. Do they need to fixed before you move in such as a front door not installed. Quality guru - associated with “breakthrough improvement” is Joseph Juran. He is well known for his "fitness for use" concept, which means that a manufacturer should first understand and then meet its customer's definition of quality (which may be different from that of the manufacturer). Philip Crosby advocated prevention over rework. He is well known for the slogan "doing it right the first time," which means that prevention is less costly for a manufacturer than rework. Consequently, a manufacturer should ideally aim for zero defects as its performance standard.

Many consider Edwards Deming to be the founder of Total Quality Management (TQM). The focus of TQM is on the use of statistics in quality management. Deming advocated a proactive (as opposed to reactive) attitude towards quality management. Deming suggested that quality management standards should be established and promoted by top management, not a quality assurance manager many levels down in the corporate hierarchy. Kaizen is a quality management technique used primarily in Japan. Kaizen means continuous improvement, which means that team members watch constantly for opportunities to improve the quality of the product or service produced.
9.4 Quality Control The monitoring specific project results to determine whether they comply with relevant quality standards and identifying ways to eliminate causes of unsatisfactory performance. The following topics shouls be understood Sampling Inspection
Acceptable Quality Level (AQL) Buyer's Risk and Seller's Risk Cause and Effect Diagrams or fishbone diagram. Pareto Charts Ranking of problems. Control Charts Checklists Kaizen Benchmarking The following are inspection techniques to be carried out and ensure quality control
Validation and reviewing the process Inspections and validating the processed Random sampling Inspection by observation checklists
Cause and effect diagram
Fishbone diagram – used to find problems Cause and effect understanding Look at each cause and try to determine a effect Cause a) lack of training, cause b)lack of expertise

Pareto chart (See Nuggets PMP12, See EKP341) 80/20 rule – 80% of the time will spent on 20% of the problems Plot all problems and rate them to find the bigger problems |----- | |---- | A | B | ------------------------------
Problem A cause X number of bad parts and B resulted in fewer defects. Control Chart(See nuggets pmp12) – Chart the high limit med and low limit |------------------------------------------------- High Limit of defects | | | ------------------------------------------------- Med Limit of defects | | ------------------------------------------------- Low Limit of defects If you have a high number of defects or items out of tolerance for a particular process you can measure if the number increases. Rule of 7= If we have 7 consistant out of tolerance values then corrective action needs to be taken. Six Sigma (See nuggets pmp12, review from the PMBOC book) One of the most common techniques to measure quality | | | | 1 | 2 | 3 | 6 ------------------------------------------------------------ The number of errors occur in the mid point of our bell curve. 1=68.26% errors or 2=95.46% errors or

3=99.73% defects or 27 defects per 10,000 samples 4=99.99% defects or 1 defects per 10,000 samples Your org must decide what level of quality you want to implement in your project Other Quality Control Techniques Run Charts Scatter Diagrams Sampling Inspection Defect Review
Question Q – Web Development Project On a web development project, what guidelines can be implemented to identify quality issues? If you put quality assurance procedures in place (Cost/Time) Total Quality management (TQM) – Quality is an integral and continuous system for obtaining quality improvements. The TQM empowers workers to focus on processes. Standards Organizations (ISO 9000) – Establishes the quality and safety of equipment and working environment. Does not guarantee quality products just any faulty equipment. Checklist – For employees to follow quality actions to ensure quality Process flowcharts – Benchmarking – Will help you determine what product or services to offer, what features to include, and the marketing costs associated with a specific product. This can be done by comparing competitors or products. Quality management Plan – See PMI147 Quality assurance Audits - Quality audits or inspections should take place at the end of every process cycle, at random intervals within a process cycle, and at random intervals over the course of the project.
Class/Group Project #10 – Add Quality Mgt to Schedule Add a task that provides actions for quality. Create a project management activity and put several quality management tasks to verify quality standards are being enforced. This could be an action item for someone on the team, it could be a meeting to verify/establish quality procedures, or an action for the PM to verify the quality. Refer to Guidelines on PMI223 and put one or more of the following tasks in your schedule:
1. Verify the quality of equipment 2. Implement quality checklists 3. Process improvement plan 4. Verify certain procedures are being followed 5. Identify areas of best practice to meet or exceed customer expectations.
PMI Exam Questions: 58, 59, 61, 85, 108, 158, 164, 166, 167 Day 3 – 12:00 Noon

Chapter 10 – Human Resource Management Instructor Guide – 45 min to discuss this section (Reference PMI150, EK23) Overview of Chapter
This chapter involves the ability to document the roles and responsibilities of everyone on the project team. It also involves the reporting relationships between the team members and establishing the management responsibilities. Of course this will be started when the project manager begins to acquire the project team. The extended team must also be defined even though they may not directly report to the project manager. Essentially the Project Manager is responsible for everything, but how well he defines the team responsibilities will determine how the project will be managed. It might be best to define what he will not do rather than what he will do because there may be unknown responsibilities that someone on the team will need to address.
Essentially the Project manager is the HR component, but he will work with the HR department when dealing with
many issues. This is where you develop a style of your own as to how you reach and interact with your team. You will also be dealing with Team motivation, conflict resolution, and support.
A document that shows the reporting structure within the project, as well as its relationship to the parent organization, is called the:
10.1 Human Resource Planning
Step 1 - Human Resource Plan Understanding the personal skills and expertise Understanding the skill on your team
Create an Organization chart. Everyone needs to know who is on the team and who is responsible Who reports to who described in an Org Chart Build a staffing plan and pass it on to the HR dept. Define the roll and responsibilities (who reports to who) Refer back to the handout roll and responsibilities how those rolls fit together. Describe how functional mgr fits, senior mgr, stakeholders, etc. Create staffing plan to be passed on to HR dept Who you need, skills, how long you need them Transition plan 2 or 3 year project, you may need a rotational plan. Include the resources, building access, desks, etc Be prepared to re-plan if you get unexpected resources due to staffing shortfalls The project may be delayed, re-plan and adjust the project as necessary. Develop the team using forming, storming, norming, etc
When the project manager can influence or direct staff assignments the following are a few consideration: pervious experience, personal interests, personal characteristics, and availability.
Step 2- Work with HR department You are going to have issues and conflicts between team members and you need to address these issues. People will trust you if you address these issues. If you do this well I will write a letter to your mgr,

If you don’t do it well I will . . . . Avoid using penalties “do this or else”
Project human resource management includes the processes required to do organizational planning, staff acquisition
and team development. Different personality types expect different reorganization Introverts do not want to public recognition, but privately recognized Extroverts need their names plastered of their success. If you motivate an introvert in a nonpublic manner, but it may de-motivate an extrovert. Managing the team Make sure the team is performing as planed You must be producing a performance reviews and they are placed in the individuals folders. 360 review – Revaluated by team leads, peers, mgt, etc. Virtual teams located around the world
Rules – update voicemail, respond to email, People around the world need answers and you prompt response will help the overall project. It’s easy if the desks were next to each other, remote location it is more difficult to communicate.
10.2 Organization Structure Objective: To determine the organizational structure of the project. Organizational Structures (Use Visio to do org charts) A few questions to consider relating to the organization structure are:
Who do you report to who does the project team report to What power and authority do you have? How do project get delivered What is the Matrix organization based on? Is the company a Profit based company? Does it value employee contributions? What is the overall company culture? If there are any incompatibilities you need a plan to cover them Need to know who reports to whom. Projectized Organization – Usually have the fastest response time to work on project tasks because the
project is their primary responsibility. Functional Organization – In this organization individuals are assigned to report to a single manager.
They usually contain highly technical staff (Specialization) because they can maintain the expertise on related projects. Usually parent and project organizations rely on functional organizations to maintain the high level of experts.
Matrix Organization - The Project manager needs to know the level of support he will get. Employees may be assigned 50% to project tasks and 50% of functional tasks.

Weak Matrix – staff spread out among multiple functional units. Strong matrix – More control over staff and full time dedication to project.
Other factors to be considered in organizational structure Logical Organization – which organization would be most successful? Culture – Identity – Does the organization see itself as a leader? Corp vs. individual Emphasis How do the Business units integrate – Do they share information or are they possessive Risk culture – will they take on risky projects Focus – Long/short term. Do we need to be profitable soon or do we have money. Company maturity – established, startup, etc.
Political framework or Organizational Culture Who drives the project success? Dress down of formal dress code Formal/informal
Level of risk Short term or long term plans Is PM a key element of the organization?
Logical vs. Functional Organization - May have a different agenda Some organizations provide logical services that are not part of their defined charter.
Organizational Chart - A document that shows the reporting structure within the project, as well as its
relationship to the parent organization. Each organization may have it’s own organizational chart but there should be one for the entire organization. The following is an example of an organizational chart.

10.3 HR Involvement Human Resources – In place procedures (work ethic 40hr, 45, 80hr, Overtime expected, training available,
politics (internal/External), symbolic (management involvement, dress code, friendly/pressure environment)
HR Factor How are employees treated? Organizational priorities come first Corporate vs. individual emphases Overtime, salary, hourly based Proactive Training or on the job mistakes are the norm Personnel and Personal Evaluations Functional managers and project team need to work together to evaluate an individual progress. Often times they are evaluated independent of the team working with them day to day. It is important for the project manager to set up progress meeting with the key individuals to discuss their progress and successes. When the person leaves the project progress notes can be forwarded to the functional manager. Another method of personal progress is to have their peers to rate and evaluate their progress. Although, this is not necessarily the Project managers responsibility if the employee works for a functional manager, but the evaluation style should be encouraged in order to a more true assessment of the employee progress and it relates to the relationships of the work being done. Staffing management plan- Project staffing attributes and personnel rates are necessary components for developing the schedule cost estimates.
10.4 Motivation Techniques
Instructor Question R – How do you Reward a Superstar on team? How do you reward a superstar on a team without effecting the motivation of other members of the team? Scientific Management In the earlier years of the industrial 20the century, workers were considered to be a machine and if they were not able to do the job effectively then they were replaced with someone else who was eager to do the job. There was no learning curve mentality and the jobs were short jobs done in a repetitive manor. The depression encouraged this methodology because of the abundance of people willing to work. Also, during the world war era people felt

motivated to work due to the need to support the war efforts. Henry Ford and Fredrick Taylor key developers of this type of method. Learning curve theory This allows people to become more valuable as their learning curve goes up. As the employee’s learning curve goes up the productivity goes up and this results in increase profits for the company. In other words, as if you do a job repetitively you can do the same job with 70% of the time. If they are always retraining employee due to employee turnover, then it is more costly for the company. This is where the idea of developing techniques to motivate people became useful to industry. Procedures to motivate Providing direction or procedures to help motivate employees found to be favorable. Companies that had little procedures were found to be less productive overall. Motivation techniques with no procedures did increase productivity, using procedures and motivation techniques were the most effective Expectancy Theory This is a reward system based on the positive outcome of the individual or groups work. By encouraging people to work in a positive manor motivated them to work harder. If you tell someone they are above average they will be motivated to perform at that level. In the opposite case if you tell someone they are a poor performer may not encourage them to excel. Maslow’s Hierarchy of needs theory Needs are categorized in a hierarchy such as food and clothing are the lowest basic need. Once the basic needs are satisfied other needs are addressed. This brings everyone to the same work ethic level. The general hierarchy of needs is food, shelter, clothing, security, safety, socialization, recognition, self motivation. From a company perspective it might be the salary that will satisfy the basic needs, having a safe environment to work in, getting along with the team might provide some social need, having a reward system will provide additional motivation, and finally when all basic needs are met they will be better self motivated. Herzberg’s Theory of Motivation – found that the job factors that affect people’s attitude about work do not relate to the opposite factors. In other words, if I am dissatisfied in my job because I dislike my boss that doesn’t mean I will be satisfied in my job if I like my boss. If someone is unhappy with their job they may request a raise, if the raise request is honored that does not mean that they will be happy with their job.
Hygiene factor – According to the theory, the absence of hygiene factors can create job dissatisfaction, but their presence does not motivate or create satisfaction. If the employee is dissatisfied with their jobs as a result of one of these, their presents won’t necessarily generate job satisfaction. The following items sometimes lack in the workplace. Company policies and administration Supervision Work conditions and interpersonal relationships Salary, status and security Motivation Factor – The components that end up being the underlining reason for a dissatisfied employee or the motivation aspects that motivate employees:

Achievement Recognition for advancement Interest in the task Responsibility for enlarged task Growth and achievement to higher level tasks
The things that satisfy people on the job are personal fulfillment of the tasks performed and if they are not interested in the work being done they will be dissatisfied. Other dissatisfies are the things related to the environment, situation or the things that must be in place in a worksite which allows the work to happen. Dissatisfied employees will not work to their fullest potential. Employees must be happy with their job in order to contribute to the outcome of the company. Companies that feel you are employed by the company therefore you will do what the company says; these employees will not work to their fullest potential. Another end result of employee dissatisfaction is boredom and this is a result of other factors not necessarily the job. Halo theory points to the misconception in the mind of many who naively assume that simply because a person excels in his or her current position, he or she must be a good project manager. However, note the significant differences between, for example, a SME and a project manager: * The project manager focuses on people, is a generalist, and succeeds through others. * The SME focuses on things, is a specialist, and succeeds on an individual level. In order to assess whether an excellent SME might make an excellent project manager, one needs to assess his or her people skills. In order to prepare a SME for his or her new role, project management training is essential. Job Enlargement/Enrichment Job enlargement is a technique to give the employee more to do in order to keep them from being board. Also, job enrichment will make the job more enjoyable by giving them more responsibility over the planning and control of the tasks they do. If the manager helps the employee to make decisions with some guidance the employee will try harder and do a better job. Another technique used by employees is quality circles. This is where employees get together to work on specific problems as a team independent of management, but they must have management backing to be successful. Power Giving people the power to solve problems is a motivation technique, but how power is exerted on others must be legitimate in order for it to be followed. Coercive power is based on the punishment is far worse that doing the task itself. Reward power will provide a reward if the task is done properly. Legitimate power is a legitimate form of power that must be followed. Referent power could be by someone who has the charisma to influence someone. Expert power is someone who has the expertise to make trustworthy or good decisions. Representative power is someone whose been chosen by the team to make specific decisions. Types of power of a leader: * Expert power - You are an expert in your field. * Reward power - You can reward team members for a job well-done.

* Legitimate/formal power - You hold legitimate or formal power by virtue of being named project manager. * Referent power - You are politically well-aligned within your firm. * Penalty power - You can fire team members. Theory X and Y managers McGreggor’s theory of X and Y Managers are different management techniques used to get the job done .Type X contends that everyone is basically lazy and unless they are forces to do their job it won’t get done. Under extreme difficulty such the military this style of management is most effective due to the urgency of the task. Type Y manager believe in sharing the responsibility and allowing others to make decisions. They are more open to problems and techniques to solve them. Fewer mistakes are made with Type Y managers because they are open to new ideas. Conflict Resolution Conflict usually occurs when one party is doing something that another party thinks is wrong. If requirements are unclear and open for multiple interruptions the two conflicts must merge to a single issue by compromising. The Project Managers job is to allow each party the freedom to explore their ideas without affecting others on the team. We are not competing to find out who has more power but who has the best idea for the best interest of the overall project. It is possible to settle these differences without causing frustration on the team. There are 5 ways to resolve these conflicts: Forcing –When a manager with authority forces a decision it is done to save time and stop any proliferation of frustration occurring with in the team Smoothing - This technique can be used to identify the common points and minimizing the differences. By smoothing the differences relationship may be restored. The conflict has not been resolved and once they realize their differences have been minimized the conflict may reappear. Compromise – Each party will find the common ground. Each party will give in to differences by dividing up tasks or giving up on their idea. The compromise must be documents and both parties must agree on the end result. The Project Manager will need to ensure the compromise is followed because if unchecked the parties, even after the agreement, will continue to implement their original ideas. Problem Solving – Set up a group of experts to reduce the direct conflict in order to uncover the facts and provide additional ideas. This is the best way to resolve the conflict which is the best strategy for the team. This could be a meeting or outside resource to study and determine the best direction. Withdrawal – This is probably the worst way to resolve a conflict. One of the two party’s withdrawals from the table and will eventually has a negative effect on the team. Managing Meetings Managers and project managers spend as much as 70% of their time in meetings. Ineffective meetings are a waste of time for everyone in attendance. The more people attend the meeting the effectiveness of the meeting goes down and the overall cost of the meeting goes up. In a large meeting you may have individual meeting going on at the same time. The optimum number of people in a problem solving meeting is between 5-10. If the meeting is an

information meeting then much more could be in attendance. It is extremely important to run an effective meeting to keep the team and the project moving in the right direction. Managing an Effective meeting To ensure attendance before the meeting, send out an email notification. Last minute notification causes in convince and brings a bad attitude to the meeting. It should contain the date, time, place, subject, a tentative agenda and a list of those invited. They should be personally informed if they are expected to provide or prepare a special topic for the meeting. When the meeting begins restate the agenda this will set the purpose and goal of the meeting. If you are concerned about the meeting getting off track due to the many external issues that need to be discussed, then get an acknowledgement from everyone in the room that they understand what will be accomplished in the meeting. If the agenda needs to change than do it and get everyone’s commitment. The agenda can be used to bring the discussion back on track. Have someone record any action items and record the minutes of the meeting. Distribute the minutes of the meeting with in one day of the meeting.
When negotiating for resources there are several techniques that can be used to obtain the resource. These are sometimes called a currency because you’re trading something to get something. The following can be used: Task-related currency. Inspiration-related currency. Position-related currency - the project manager “horse-traded” for the loan of a particular technical expert by implicitly promising to raise the functional manager’s visibility with executive stakeholders on the project. Relationship-related currency.
Setting Goals – Steps in effective goal setting are Definition, setting completion time, resource allotment, quality standards.
Handout16 – HR Matrix Organization (Optional) PMI Exam Questions: 10, 11, 12, 13, 14, 15, 87, 172
Instructor Question S – What information in contained in a status report? Sent to Sponsor, Shareholders, or Team Members? Answer to Question S – Sponsor – The status would be more budget, progress, and completion. . Shareholders – would be more informational. Team Members – Would be more motivational. Include a section on team building exercises P160 Mandatory prerequisite(s) for team building are Commitment from top level management.

Chapter 11 – Communications Management Instructor Guide – 30 min lecture
Overview: If good communication exists in a project the team will be more motivated and will succeed despite any unforeseen problem that may arise. Communication is the key to a successful project. Communications Management is the process required to ensure timely and appropriate generation, collection, dissemination, storage and ultimately disposition of project information. Rewrite-According to the PMBOK, communications management in projects is the process required to ensure timely and appropriate generation, collection, dissemination, storage, and ultimately disposition of project information. Class Exercise to reword - In my classes I usually do an exercise wherein five of six people are forced to communicate with written communications only. They are given a simple problem to work out that requires input from each of them. They are required to follow strict reporting procedures similar to procedures used in most companies. They are given ten minutes to solve the problem, and less than one-tenth of one percent ever solve it. The groups are then allowed to discuss the problem and do anything that they can to communicate. When they are allowed to use free and open communications without restriction, they all solve the problem in about sixty seconds.
The different types of communication is Virbal, written and electronic These can be formal or imformal style "tight matrix"=Where all team members are brought together in one location. Simular to co-location
11.1 Communications Planning – This will include information distribution, Performance reporting, and stake holder identification processes. The plan is a written document which can be formal, informal, detailed, or contain brief information. The end result is a document describing how the project will communicate.
11.2 Information Distribution
11.3 Performance Reporting
11.4 Stake Holder communication The steps to communication is thinking of the message you want to send, encoding the message into a
understandable form, transmitting the message to someone else, the receiver then perceives what was written, and then decodes the message before understanding it.
Planning – Put together a comm. Plan

Distribution – Sending emails, updates on phone, writing Performanance This is what you should be reporting to those who have a need Weekly status reports to project sponsors
Monthly ststus going to senior exec or critical individuals Managing the stake holders Ensuring they have the information that you need to allow them to participate in your project. Who - Determine Information requirements Who needs to know about the information. What the sponsers need detailed information along with team leads Management (LINE MGRS) need to know progress Need summary information Who need o know detailed information
Team and sponsor need detailed information Sinior Mgt need summary information What - What information people want to see level of detail or summary Status – is the Project On target and Team Performance (Tasks being completed) Is the project on budget Risks Problems or Issues – where is the project having problems How – How are you going to distribute the information
Formal (written report) Reports – grammer, spelling, content accurate Presentations – well formatted and has a flow. Stick to the agenda Project Websites – Harder to keep updated
Informal (email, phone calls, meetings) Meetings - In person need to be aware of your tone /body language
Need to start ontime and end on time, agenda(everyone needs to know the topics to be covered The right people attend the meeting Need followup/ action items. Don’t use the meeting to resolve issues Stop and assign action items Keep minutes of the meeting to review at next meeting. Publish the minutes within 24 hrs of the meeting
Phone – Make sure the spoken words are clear. VM – Hi it’s jeff I am calling about … please return call Email – used for quick status, not a good formal style Instant Messenger – Good way to keep intouch with people in remote locations. Some people find it to be more effective than email and telephone. Phone is interruptive to the workflow they can respond when it is appropriate.
When Weekly – Planned and unplanned work performed. Undone items. Probels issues and warning Monthly – Factual and detailed focused on results/progress. Fininicial status. Effert complete and undone issues. Problems, issues, warning Project Milestones – Simular to monthly but will go to more people than the normal monthly scheduled people

Availability – Post on websites shared directories, binders. Stakeholder Management Need to advocate or deliver your message What the project is doing Are you getting the info you need.
Followup/Issue log Everytime you make a promise to a stakeholder you need to follow up.
May create a special note book recording this information. Consistancy Get back to them if you are not able to deliver what was promised.
5 concepts that need to be understood with the sending process
1. Decoding translates the raw information into a format people can read. Must be clear and consise
2. Ensure the right message is getting across Different status for the appropriate person
3. Mediem to transfer the message, Formal or informal (Email, Phone, Meeting)
4. Noise Keep acronyms, slang out if dealing with people that may not understand.
Can also be bad grammer, misspelled words and bad righting problems. 5. receiver decoding/understanding
The receiver must interrupt the message and draw conclusions Diagram describing this process Sendert Mediem Receriver Encoding Noise Decode Culteral Typos Other issues that we need to be aware of when putting together the comm. plan Distance and time zones Mim points of comm. Channels
Communications Planning—determining the information and communications needs of the stakeholders; who needs what information, when will they need it, and how will it be given to them. Information Distribution—making needed information available to project stakeholders in a timely manner. Performance Reporting—collecting and disseminating performance information. This includes status reporting, progress measurement, and forecasting. Administrative Closure—generating, gathering, and disseminating information to formalize phase or project completion.
PMBOK - The project manager should consider the number of potential communication channels or paths as an indicator of the complexity of a project's communications. The total number of communication channels is n(n-1)/2, where n = number of stakeholders. Thus, a project with 10 stakeholders has 45 potential communication channels.
4 comm channels = 6 separate pathes

O 1 O 2 5,6 4 O 3 O Guidelines to develop an good comm. Process Create templates – use often so everyone knows where to find the information Standards –make sure everyone is doing the same thing, same steps, same info, same style. Procedures – establishing a easy flow or process. Conclusion – develop the formal Communications Management Plan (all above) Definition of stake holder requirements what type of info do they require.
Others in organization Information requirements Responsibilities – when is it due Who will do it. Methods Which will be formal and informal Frequencies How often Overview of Chapter
Create a Communications Management Plan Pmbok Book Communications Management Plan The communications management plan is contained in, or is a subsidiary plan of, the project management plan (Section 4.3). The communications management plan provides: �� Stakeholder communication requirements �� Information to be communicated, including format, content, and level of detail �� Person responsible for communicating the information �� Person or groups who will receive the information �� Methods or technologies used to convey the information, such as memoranda, e-mail, and/or press releases �� Frequency of the communication, such as weekly �� Escalation process-identifying time frames and the management chain (names) for escalation of issues that cannot be resolved at a lower staff level �� Method for updating and refining the communications management plan as the project progresses and develops �� Glossary of common terminology. The communications management plan can also include guidelines for project status meetings, project team meetings, e-meetings, and e-mail. The communications management plan can be formal or informal, highly detailed or broadly framed, and based on the needs of the project. The communications

management plan is contained in, or is a subsidiary plan of, the overall project management plan (Section 4.3). Sample attributes of a communications management plan can include: �� Communications item. The information that will be distributed to stakeholders. �� Purpose. The reason for the distribution of that information. �� Frequency. How often that information will be distributed. �� Start/end dates. The time frame for the distribution of the information. �� Format/medium. The layout of the information and the method of transmission. �� Responsibility. The team member charged with the distribution of information. Communication Planning often entails creation of additional deliverables that, in turn, require additional time and effort. Thus, the project’s work breakdown structure, project schedule, and project budget are updated accordingly.
11.1 Communications Planning (Reporting) Write on board
Communication Plan – Define who/what to report Pro-Active Communication
(Reference PMI164, EK23) Objective: To define a Reporting Mechanism between team members. Any company policy that would limit communication is a constraint to the communication plan, but shouldn’t prevent an alternative communication plan from being crated. If a company has a top secret department or policy limiting access to individuals is an example of a constraint. If you don’t want to read detailed status then only require bullets Define what you want and what your stake holders need. Communicate what is needed before it becomes an issue Part of job descriptions should be a communication method Review “How to create a communication management Plan” PMI167
Communications needs of stake holders (ask for sponsor input) Evaluate constraints and assumptions to determine input.
Class/Group Project #11 – Define types of reports needed
Handout - MS Project reports available (Need to generate) Add this to your project management activity. Define the types of reports you will need to send to upper management, middle management (peers), and to the troops? When should you send these reports? (Regular basis or at a specific point in project). PMI Exam Questions: 69, 71, 72, 114 2-Day Class(Day 2 – Noon) 4-Day class (Day 3 – 4:00) We need about 60 min to complete risk Anal

Chapter 12 – Planning the Project RISK Management (Day4,9a) Overview of Chapter
Analyzing Risks and Planning Risk Response Create a Risk Management Plan Identify Project Risks and Triggers Perform Qualitative Risk Analysis Perform Quantitative Risk Analysis Develop a Risk Response Plan
Project Risk Management includes the processes concerned with conducting risk management planning, identification, analysis, responses, and monitoring and control on a project. The objectives of Project Risk Management are to decrease the probability and impact of events adverse to the project. Careful planning enhances the possibility of success. Project risk is a specific occurrence that may impact the project in the future, either positively or negatively. The four areas that risk can effect are Time, Cost, Quality and scope. Residual risks are those that remain after risk responses have been taken. Write Outline on Board What is a risk? – Degree of uncertainty. Risk Identification Qualitative Analysis (Plot Probability/Impact) Quantitative Analysis (Calculate Probability/Impact) Risk Response Plan Contingency Plan/Reserve Do you have a risk management plan?
12.1 Risk Management Planning (Reference PMI174, JM8P1, EK39) Risk Management Planning is the process of deciding how much detail and how to go about conducting the risk management activities for a project. Planning of risk management processes is important to ensure that the level, type, and visibility of risk management are commensurate with both the risk and importance of the project to the organization, to provide sufficient resources and time for risk management activities, and to establish an agreed-upon basis for evaluating risks. The Risk Management Planning process should be completed early during project planning. Maturity of Organization You can take risks in industry, but as a project manager you need to be aware of the impact and probability of the risk occurring. The amount of time you spend analyzing this depends on the maturity of the organization. This maturity is expressed in terms of risk attitudes and tolerances. Predefined Risk Policies Risk policies may have to be defined in company policy statements. Organizations may have predefined categories, common definition of concepts and terms, standard templates, roles, responsibilities, and authority levels for decision-making. Having these mature policies will speed up the process.

Reporting format You will need to define a method of how you plan to include risk management into your reports. This may be a part of the communication plan, but risks may be unique to specific individuals not to the general reporting population. Summary progress may be more use full to all interested shareholders. Tracking This is another consideration which is keeping track of the progress and implementation of the risk. Auditing consideration need to me made and that can be a factor in the tracking methodology. Methods to plan for risks Risk Breakdown Structure (RBS) - Defines the sources of risk prioritized is one approach to providing such a structure. Delphi Technique analogy is often used during risk identification to Solicit ideas from experts as to potential risks. Class Exercise – Techniques to Categorize and list Risks Project Technical Risks Organizational Risks Environmental Risks 1. 1. 1. 2. 2. 2. 3. 3. 3. List of Potiential Risks - A simple list would suffice if the risks are not well known. 1. 2. 3. Class Exercise - Risk Management Plan Meeting The following should be considered when planning for risk.
1. Must have an agreed upon process to start addressing the risk issues. (Refer to card game) 2. Think of a plan to get more task level managers to Identify/address risk issues rather than
same level. 3. Get together and determine what could go wrong 4. Is there any thing we can do with this risk (alternatives) 5. Document the risk (Risk description, Cause, Probable Impact, Risk response plan) 6. Techniques to address the risk issues (Brainstorming, Delphi Technique, Interviews, Root
cause Analysis.) 7.
INSTRUCTOR Tell story in your own words PMI176 The unpredictability of weather is common to business. If company or organization was planning an outdoor festival will likely choose a location and day with the highest probability for agreeable weather. In this scenario, the threat of rain is a risk that could seriously impact attendance and profits.

Because the weather is known to be a possible risk, but its impact is yet unknown, this risk would be classified as known-Unknown.
Class/Group Project #12 - Risk Management Make a list of risks/concerns/Unknowns and prioritize them
1. Heavy Equipment (possible schedule problem) 2. Deep Digger (Possible scheduling problem) 3. Cement Truck (timing when Pluming completes, I don’t want the cement truck to
show up while the pluming and electrical is still being done) 4. Carpterner/Plumer Does the carpenter need to build a supported whole in the side of
the shed for the Plummer to run pipes. PMI Exam Questions: 22, 23
12.2 Risk Identification (Reference PMI182) Risk Identification defines the risk categories. Participants in risk identification activities can include the project manager, project team members, risk management team (if assigned), subject matter experts, customers, end users, other project managers, and stakeholders. While these personnel are often key participants for risk identification, all project personnel should be encouraged to identify risks. Make sure you establish a project structure that allows individuals working the projects at the lowest end of the spectrum to be able to identify risk problems. Risk Identification is an iterative process because new risks may become known as the project progresses through its life cycle or project phases. Flowcharting is used in risk identification to show the effect of a particular risk on a project. Flowcharting is not used to determine the root cause of a project risk. The following are categories that can be established Sources of Risk Technical, Scope, Business, Economy, Competition, Quality, performance,
PM risks (Poor time estimates/costing), Organization risk (Team, Conflicts, funding, lack of support), external risks (Unions, change of mgt, security)
Identify Risks and triggers Trigger – What event would cause a failure. Types of risk Business Risk – The initial hit of starting a new business or new project
Effect-Based risk – Effect of cost due to increase duration (Time, cost, quality, scope)
Source-Based risk – Effects of an unknown internal or external source. Other source based risks could come from a specific industry in trouble.
State or nature of risk – Certainty, Risk(normal risk), uncertainty
Scope Risk Uncertainty of new technology

Dynamic Customer requirement Tools/Techniques not available Large defects
High business impact Untested methods Schedule Risks Tasks durations > 2 weeks Critical Path throughout entire schedule Many predecessors driving a single task Task with minimal slack Too Optimistic(over estimate) scheduling of estimated tasks Tasks with external dependencies Too many major milestones Schedules without documented assumptions Resource Risks Loss of team members Loss of needed skills Task needing remote resources Outsourced tasks
Tasks defined as TBD (to be determined) Tasks with multiple defined Scarce resources Lack of sponsor support General Risks Communication/Language Reorganization Loss of Sponsor Natural Disasters/Threats
The following is a Risk log to record active risks:
Class Question P – You just took a new job in Chicago. List some risks of items of uncertainty/Risk that you might encounter?

Also, list some triggers or items that may initiate the event?
Handout17 - Risk Management Plan Step 1 – Identify Risk List each risk and triggers then prioritize it (sometimes your priorities don’t match your analysis) Priority Description Triggers 2 Item1 1 Item2 3 Item3 4 Item4 PMI Exam Questions: 25, 26, 27 8. The purpose of a qualitative risk analysis is to: a) Assess the impact and likelihood of the identified risks actually occurring.
12.3 Qualitative Analysis The purpose of the Qualitative Risk analysis is to access the impact and likelihood of the identified risk to actually occur. It includes methods for prioritizing the identified risks for further action. Organizations can exhibit great success by focusing on high-priority risks. Qualitative Risk Analyses the probability of the risk occurring and the impact to the project, if the risks do occurs. This Probability and Impact is in reference to the cost, schedule/time, scope, and quality. The time criticality of risk-related actions may magnify the importance of a risk. Qualitative Risk Analysis is a rapid and cost-effective means of establishing priorities for Risk Response Planning, and lays the foundation for Quantitative Risk Analysis, if this is required. Qualitative Risk Analysis should be revisited during the project’s life cycle to stay current with changes in the project risks. (Reference PMI188) Objective: To rank risk from low to high, Numerically alpha or high/med/low weighting system. Method 1 – Linear Probability |-------------------------------------------------------| Low Med High No Probability Certainty Method 2 – Linear Impact |-------------------------------------------------------| Low Med High Low Impact High Impact

Method 3 – Graph Probability and Impact High 2 4 3 Probability Med Low 1 Low Med High Impact PMI Exam Questions: 8
Handout17 – Risk Management.xls
INSTRUCTOR Class example When demonstrating these number apply the example of the impact to the project as a result of the lack of training or inadequate training. If you don’t do this risk what will the impact to the project. If you don’t do this how will it affect the cost. If people must learn on the job will it cost more to do the project. Will the lack of training impact the schedule. If it cost the project 1 day and there are 40 people on the project it will affect the project by 40 days. Will people be unable to fulfill the scope and will the quality be affected. Open the discussion to the class and get a consensus as to the values to apply the spreadsheet
12.5 Quantitative Risk Analysis Quantitative Risk Analysis is performed on risks that have been prioritized by the Qualitative Risk Analysis process. The Quantitative Risk Analysis process analyzes the effect of those risk events and assigns a numerical rating to those risks. It also presents a quantitative approach to making decisions in the presence of uncertainty. This process uses techniques such as Monte Carlo simulation (software analysis tool) and decision tree analysis to: Quantify the possible outcomes for the project and their probabilities Assess the probability of achieving specific project objectives Identify risks requiring the most attention by quantifying their relative contribution to overall project risk

Identify realistic and achievable cost, schedule, or scope targets, given the project risks Determine the best project management decision when some conditions or outcomes are uncertain. Method 3 – Numerical Qualitative Analysis
100 90 d 80 Higher Priority 70 f Items 60 50 Probability 40 30 e 20 10 c b a 10 20 30 40 50 60 70 80 90 100 Impact (Reference PMI195) Objective: To rank risk through a mathematical model or Numerical calculations The process of numerically assessing the probability and Impact of each risk.
Method 1 – Determine the level of risk (Sometimes called the Expected Value (EV) of risk event.
Multiply the Numerical Qualitative Analysis values: Priority Description Triggers Probability Impact Result 2 Item1 .7 x .2 = .14 1 Item2 .3 x .6 = .18 3 Item3 .8 x .9 = .72 4 Item4 .8 x .4 = .32
Method 2
1.0 .9 Probability .8 .32 .72 .7 .14 .6 .5 .4 .3 .18 .2 .1 .1 .2 .3 .4 .5 .6 .7 .8 .9 1.0 Impact Multiply Probability x Impact PMI Exam Questions: 132
Handout17 - Risk Management Planv2 List the risks above the threshold
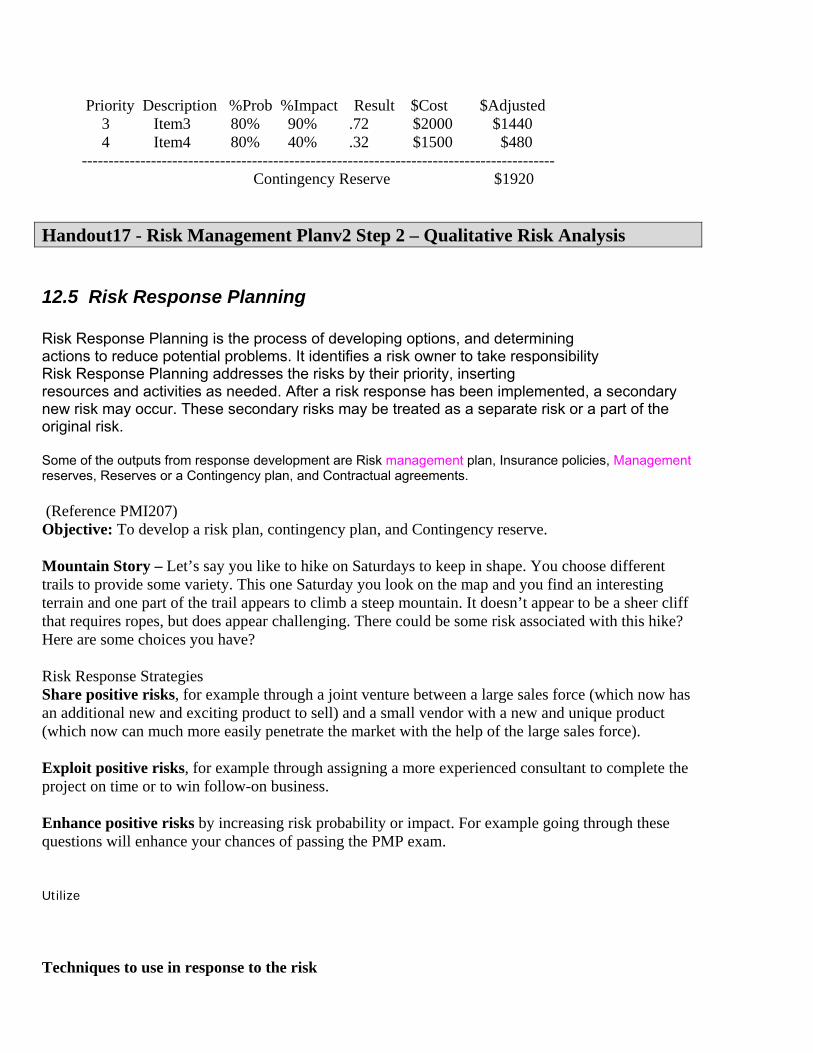
Priority Description %Prob %Impact Result $Cost $Adjusted 3 Item3 80% 90% .72 $2000 $1440 4 Item4 80% 40% .32 $1500 $480 ----------------------------------------------------------------------------------------- Contingency Reserve $1920
Handout17 - Risk Management Planv2 Step 2 – Qualitative Risk Analysis
12.5 Risk Response Planning Risk Response Planning is the process of developing options, and determining actions to reduce potential problems. It identifies a risk owner to take responsibility Risk Response Planning addresses the risks by their priority, inserting resources and activities as needed. After a risk response has been implemented, a secondary new risk may occur. These secondary risks may be treated as a separate risk or a part of the original risk. Some of the outputs from response development are Risk management plan, Insurance policies, Management reserves, Reserves or a Contingency plan, and Contractual agreements. (Reference PMI207) Objective: To develop a risk plan, contingency plan, and Contingency reserve. Mountain Story – Let’s say you like to hike on Saturdays to keep in shape. You choose different trails to provide some variety. This one Saturday you look on the map and you find an interesting terrain and one part of the trail appears to climb a steep mountain. It doesn’t appear to be a sheer cliff that requires ropes, but does appear challenging. There could be some risk associated with this hike? Here are some choices you have? Risk Response Strategies Share positive risks, for example through a joint venture between a large sales force (which now has an additional new and exciting product to sell) and a small vendor with a new and unique product (which now can much more easily penetrate the market with the help of the large sales force). Exploit positive risks, for example through assigning a more experienced consultant to complete the project on time or to win follow-on business. Enhance positive risks by increasing risk probability or impact. For example going through these questions will enhance your chances of passing the PMP exam.
Utilize
Techniques to use in response to the risk

14-5a Avoidance – Take a different trail or stay home (Contractor resp.) Rewrite this section Risk avoidance involves changing the project management plan to eliminate the threat posed by an adverse risk, to isolate the project objectives from the risk’s impact, or to relax the objective that is in jeopardy, such as extending the schedule or reducing scope. Some risks that arise early in the project can be avoided by clarifying requirements, obtaining information, improving communication, or acquiring expertise.
12.5b Mitigation – If you are traveling tell someone where you are going and when you will return, or Inform contractor that they must take care of the risk. Buying insurance is an example of mitigation.
Rewrite this section Risk mitigation implies a reduction in the probability and/or impact of an adverse risk event to an acceptable threshold. Taking early action to reduce the probability and/or impact of a risk occurring on the project is often more effective than trying to repair the damage after the risk has occurred. Adopting less complex processes, conducting more tests, or choosing a more stable supplier are examples of mitigation actions. Mitigation may require prototype development to reduce the risk of scaling up from a bench-scale model of a process or product. Where it is not possible to reduce probability, a mitigation response might address the risk impact by targeting linkages that determine the severity. For example, designing redundancy into a subsystem may reduce the impact from a failure of the original component.
12.5c Transference – Have someone else hike the trail with more experience and find out how dangerous it is.
Rewrite this section Risk transference requires shifting the negative impact of a threat, along with ownership of the response, to a third party. Transferring the risk simply gives another party responsibility for its management; it does not eliminate it. Transferring liability for risk is most effective in dealing with financial risk exposure. Risk transference nearly always involves payment of a risk premium to the party taking on the risk. Transference tools can be quite diverse and include, but are not limited to, the use of insurance, performance bonds, warranties, guarantees, etc. Contracts may be used to transfer liability for specified risks to another party. In many cases, use of a cost-type contract may transfer the cost risk to the buyer, while a fixed-price contract may transfer risk to the seller, if the project’s design is stable. 12.5d Acceptance Rewrite this new section A strategy that is adopted because it is seldom possible to eliminate all risk from a project. This strategy indicates that the project team has decided not to change the project management plan to deal with a risk, or is unable to identify any other suitable response strategy. It may be adopted for either threats or opportunities. This strategy can be either passive or active. Passive acceptance requires no action, leaving the project team to deal with the threats or opportunities as they occur. The most common active acceptance strategy is to establish a contingency reserve, including amounts of time, money, or resources to handle known—or even sometimes potential, unknown—threats or opportunities.

12.5e Contingency Plan – Rewrite this Contingency section Some responses are designed for use only if certain events occur. For some risks, it is appropriate for the project team to make a response plan that will only be executed under certain predefined conditions, if it is believed that there will be sufficient warning to implement the plan. Events that trigger the contingency response, such as missing intermediate milestones or gaining higher priority with a supplier, should be defined and tracked.
Trigger1 – If there is no clear trail I will turn around and go home Trigger2 – Watch backwards to verify if it is more dangerous going downhill so I will be able to turn around and go home. Trigger3 – If I see wild bears go home immediately.
Step 1 Prioritization of risks Priority Description Triggers Probability Impact Result 3 Item3 .8 x .9 = .72 4 Item4 .8 x .4 = .32 1 Item2 .3 x .6 = .18 2 Item1 .7 x .2 = .14 Step 2 - Contingency Plan/ Reserve Priority Description Result Item Cost Risk Cost 3 Item3 .72 $2000 $1440 4 Item4 .32 $3000 $960 Contingency Reserve = $2400 Step 3 Risk Response Plan 3. Permit – Call City before project 4. Tools – Borrow tools from Dan 2. Weather – Buy plastic tarp, Cover site if it rains Step 4 - Contingency Plan/ Reserve Priority Description Result Item Cost Risk Cost 3 Item3 .72 .4 $2000 $1440 $800 4 Item4 .32 .2 $3000 $960 $600 Adjusted Contingency Reserve = $2400 $1400
Handout17 - Risk Management Planv2 Plan Step 4
Class/Group Project #13 - Risk Management

EngHandout1-Levels of CMM.doc
Question – Risk Management Planning Meeting Define the ground rules you will set for you initial risk management meeting. Keep from getting off the subject, how you will identify the risks. How will you get others to take responsibility for them?
12.6 Risk Monitoring and Control Planned risk responses (Section 11.5) that are included in the project management plan are executed during the life cycle of the project, but the project work should be continuously monitored for new and changing risks. Risk Monitoring and Control is the process of identifying, analyzing, and planning for newly arising risks, keeping track of the identified risks, higher priority risks, monitoring trigger conditions. Risk Monitoring and Control can involve choosing alternative strategies, executing a contingency or fallback plan, taking corrective action, and modifying the project management plan. After the risk response has been implemented the risk may still be a concern. This is called a residual risk because it continues to be a risk. New Risk – Look for new risks. Need to rewrite this section Scope changes may cause new risks. As the schedule changes new risks. Environmental changes, Technical changes competition, Team input – They will be the first to discover new risks., Residual Risk. A risk that remains after risk responses have been implemented. Some techniques used to monitor and control risks are: Risk Reassessment Risk Monitoring and Control often requires identification of new risks and reassessment of risks. Project risk reassessment meetings should be regularly scheduled. Project Risk Management should be an agenda item at project team status meetings. The high priority risks could be the focused items at the meeting. Risk Audits Risk audits examine and document the effectiveness of risk responses in dealing with identified risks and their root causes, as well as the effectiveness of the risk management process. Technical Performance Measurement Technical performance measurement compares technical accomplishments during project execution to the project management plan’s schedule of technical achievement. Deviation, such as demonstrating more or less functionality than planned at a milestone, can help to forecast the degree of success in achieving the project’s scope. Reserve Analysis Reserve analysis compares the amount of the contingency reserves remaining to the amount of risk remaining at any time in the project, in order to determine if the remaining reserve is adequate. Status Meetings

Project risk management can be an agenda item at periodic status meetings. That item may take no time or a long time, depending on the risks that have been identified, their priority, and difficulty of response.
Computer Training #11 – Risk 1. Update risk cost in the fixed cost column 2. Document risk criteria in notes 3. Format/font to highlight important tasks. 4. Add tasks to project according to the risk plan. PMI Exam Questions: 9, 24, 176, 177 Day 4, 1:00pm
Chapter 13 - Procurement Management Overview of Chapter
Planning Project Procurement Prepare a Contract Statement of Work Prepare a Procurement Document
22. Plan Purchases & Acquisitions 23. Plan Contracting
“fait accompli” tactic = Claiming an issue has already been decided on and cannot be changed. Expressed warranty: Is a statement of the characteristics of the product.
Implied Warranty – Every product warranty is implied
13.1 Purchases and Acquisitions (Reference PMI217) Objective: To identify any potential problems with purchases and acquisitions
Instructor Question – Organic Pasta Sauce Project Manager Read paragraph on PMI217
You’re the project manager for a new brand of organic pasta sauce. In order to meet the product launch deadline, you purchase tomatoes from a wholesale distributor in South America. Unfortunately, the tomatoes that arrived are small, green, and hard. In a panic, you call your seller to let him know that you wanted large, red, juicy tomatoes to meet the recipe requirements. Your seller says “you ordered tomatoes and we sent you tomatoes”. Clearly describing the exact type and specifications of the product you want to buy from the supplier in a statement of work ensures you will avoid costly outsourcing errors. Identify which task is dependent on external goods

13.1-1 Buying Considerations Commodities – Products that are affected by the market quantities due to the abundance or lack of stock. Competition could drive the drives the price down or no competition could influence the price to go up. An example of commodities is corn, wheat, and soybean, but commodities could include many other products. Unique Products or Services – You will not be able to compare prices or competition. The end result is the going price may be high but you have very little choice in the purchasing. Forward Buying – You purchase the part before you need it. This will ensure the part will be available when needed. There may be stocking/storage costs associated this method. Blanket Orders – This is a form of forward buying, but you specify a large quantity order and purchase it when needed. You will get large discounts and will be buying leverage. Split Orders – This is where you would take a blanket order and split it between to vendors. You reduce your quantity leverage, but have options if product is in short supply one of the vendors. Three things to describe product requirement PMI220 Design – What is physically required? Performance – Operational or measurable characteristics Functionality – The end result or how it will work. This will allow vendor to provide alternate solutions knowing what is expected.
Contract Management contract is an "agreement."
contract must be "between competent parties." contract must be "for consideration."=something must be given for something else. contract must "accomplish some lawful purpose.
13.1-2 Make or Buy Make or Buy Goods or services that can’t be provided by the team. You need to decide how much, when do you buy it, and how you are going to purchase it. Some of the reasons to do this are Idle Capacity, Trade Secrets. If it requires unique skills if it is less costly to build it in-house.
13.1-3 Contract Life Cycle Steps In the contracting process, we consider the steps in a little more detail. The requirement of the contracting process can be considered equivalent to the initialization of the project. Make a chart with arrows Requirements Requisition Solicitation Award processes Close Out Requirement Process – One method to documenting requirements is the “Statement of work” as you will see in the next section.

Requisition Process – consists of reviewing requirements and specifications and identifying quality suppliers. Solicitation Process – involves getting the bids or proposals. Award Process – one vendor is selected from the list of candidates. Contract Process – The contract is actually carried out. Generally speaking, buyers prefer the fixed price contract, which places more risk on the seller. Sellers prefer cost contracts, which place more risk on the buyer. The following are types of contracts:
Redraw this chart Fixed Price Contract - There will be no negotiation after the sale and a fixed amount of money will be used. The seller takes full responsibility for inventory and stocking prior to the sale. An example of this is purchasing a product at a store at the posted price.
Firm Fixed Price Contract – This can be used for specific set of requirements and if the requirements change the price can be Re-negotiated. There will be no room for negotiation for the product after it is purchased. An example of this is if you purchase a large quantity or something on sale at a store. Fixed price with economic Adjustments – This is done for long term contracts and the price may change with economic conditions. A specific agreed upon formula will be used that was agreed upon. The contract price is adjusted according to some formula that depends on an agreed upon economic indicator. An example of this is blanket order over a long period of time. Also, getting a bank loan may change the contract if the interest rate changes. Fixed price with incentive contract – Provides an incentive fee for exceeding the performance of the set base requirements. Usually this is getting the project done sooner than expected. In many cases there is a loss as a result in the downtime which if done sooner everybody will benefit finically. There is an agreed upon fixed price for the project and an incentive fee for exceeding the performance of the contract. Instructor Example: In Oakland a truck delivering petroleum fuel exploded in an under-passing of the 508 Freeway (a major commuter freeway on the way to San Francisco). Traffic needed to be redirected which caused a major backup for the morning commute. A contract was issued by the state government with cash incentives for early completion. The overpass was completed within a month which could not have been done unless it was an incentive contract. Cost plus contract – This is usually done if there is a great deal of risk or uncertainty associated with the deliverable. Basically if you do a better job than expected by researching additional technology of inventing a part, there will be cost incentive. The seller agrees to perform the terms of the contract, but the buyer takes on the risk. The buyer agrees to reimburse the seller for any work that is done and for any money that is spent. Cost Plus Fixed Fee Contract - The seller is reimbursed for all of the money that is spent meeting the contract requirements and is also paid a fixed fee.

Cost Plus Award Fee Contract - An award system is set up to compensate the seller for completing parts of the contract.
Cost Plus Incentive Fee Contract - An incentive system is set up for the seller to perform in excess of the agreed upon terms and specifications of the contract.
Class/Group Project #14 – Plan Purchases and Acquisitions
Instructor Question – Purchase acquisitions List the methods you will use to identify sellers. If you are going to purchase something, list the standards you will establish to identify sellers. (Years of business, professional affiliation, price too high/low) PMI Exam Questions: 67, 95
13.2 Contract Management (Reference PMI226) Objective: Identify required product or services and identifying potential procurement sources Read Statement on PMI226
13.2-1 Contract An agreement between competent parties required to purchase goods or services. A related term is “For Consideration” which means the exchange of something for something else. It does not have to be of value to those outside of the transaction. It must have a lawful purpose or can not be an illegal transaction.
13.2-2 Procurement Documents Request for Bid (RFB) – The main factor is to provide clear specifications and price. Request for Quotation (RFQ) - The main factor is to provide clear specifications and price. Request for Proposal (RFP) – Used when specifications have not been clearly defined. More work for vendor. Invitations for Bid (IFB) – Large quantities or higher costs are at stake. Request for Information (RFI) – Used to develop a list of qualified vendors. Clear requirements – Clearly define what is needed Measurement – Don’t change requirements for next vendor based on what was learned on 1st vendor. Vendors often don’t read the requirements carefully. Keep it short, concise and to the point. Contracts PMI222 Fixed price - Commitment Cost-Reimbursable – Pays for expenses occurred incase project is canceled.
Time and Materials – The buyer pays the seller for time and expenses of project work. Purchase order – An agreement to purchase goods at a specified price.
Review “How to prepare a statement of work (SOW)”. (PMI223) An effective SOW describes the work being procured in sufficient detail so that potential sellers can evaluate their capacity to perform this work.

13.2-3 Statement of Work (SOW) Instructor SOW EK24
Handout19 – Statement of Work (SOW) Example Work Performed – Describe the work or business need that will be performed in the project Include the following Responsibility Matrix
Project Purpose Project Objectives Project Scope Sign-off and review hierarchy Communication and reporting plan Optional Items
Feasibility Study Cost Benefit Analysis Detailed Description of each task Risks, Assumptions, Constraints
Class/Group Project #15 – Acquisition and Outsourcing List your purchases and acquisitions? Do you see any potential problems with purchases? List the manpower you will or can outsource Identify any manpower issues?
Handout20 – Small Project Plan Template
This will conclude the Planning process Group or Summarize Concepts.
Chapter 14 - Executing Process Group
Overview of Chapter Executing Project Work Project Plan Execution Perform Quality Assurance Develop the Project Team Distribute Project Information

Request Seller Responses Select Sellers 24. Direct and Manage Project Execution 25. Perform Quality Assurance 26. Acquire Project Team 27. Develop Project Team 28. Information Distribution 29. Request Seller Responses 30. Select Sellers
Executing Process Group (Reference JM9P1) Description – The act of carrying out the project plan. PMI Exam Questions: 92
14.1 Direct and Manage Project Execution (Reference PMI238) Objective: Project Management Information System (PMIS) to track work progress and to compare the actual with the planned cost, quality, schedule, and scope. PMBOK PMIS Project Management Information System (PMIS) [Tool]. An information system consisting of the tools and techniques used to gather, integrate, and disseminate the outputs of project management processes. It is used to support all aspects of the project from initiating through closing, and can include both manual and automated systems. Exam question 97. A common problem with the use of an automated PMIS: all a) Is the tendency to over-rely on it to point out problems. b) Is the tendency to provide too much information. c) Is the tendency to use it in place of other forms of communication. This usually occurs on multiple systems and integration is a problem (a lag in time is the result. Work Authorization system – Tracks work completed based on the budgeted plan PMBOK Book - Work Authorization System [Tool]. A subsystem of the overall project management system. It is a collection of formal documented procedures that defines how project work will be authorized (committed) to ensure that the work is done by the identified organization, at the right time, and in the proper sequence. It includes the steps, documents, tracking system, and defined approval levels needed to issue work authorizations.

Work performance Information – A method of collecting status of completion PIMS – Most often the financial and planning systems are separate and don’t integrate well. Indicator Task Name Baseline
Work (orginal plan)
Work Actual Work Remaining Work
Resource Usage sheet – If you receive hours on a daily basis you could use this layout to enter the time. Indicator Resource
name Actual Work Remaining
Work Work
Remaining work – If the person tells us it will take longer to complete a task increase remaining work. PMI Exam Questions: 91, 93, 97, 98, 99, 101, 112
14.2 Perform Quality Assurance (Brief Overview) (Reference PMI244) Objective: Set Quality guidelines – Your actually defining poor quality in a positive way. Who should set the quality standards – Prefer ability the organization implementing the plan to ensure they will follow it, otherwise it must be clearly communicated. Format – A check list is preferred to avoid misinterpretation Audits – Regular checkpoints should be done. PMI Exam Questions: 107,111, 124, 127, 129, 130
14.3 Acquire Project Team (Brief Overview) (Reference PMI160) Objectives: Acquire a team that works well together, define roles and responsibilities. Acquire Project Team Roles, Relationships, reporting If you are assigned a team then figure out the best mode of communication Clearly define roles and responsibilities Review “Acquire Project Team Guidelines” PMI162 Keep in mine quality resources can get the job done faster as compared to a low quality resource which may take longer. PMI Exam Questions: None Found
14.4 Develop Project Team (Go into Detail) (Reference PMI250) Objective: Now that you acquired/assigned at team now it’s time to start building them. Team development stages

Project teams go through the stages of forming, storming, norming, and performing. Forming – refers to the initial stage of the team development life cycle, during which the team is formed. People tend to be less committed until the natural leadership emerges. The team is seeking leadership and direction. What new teams want to know? What am I suppose to do?– My goals, objectives and tasks?
Storming – Storming refers to the subsequent phase of the team development life cycle, during which conflicts between team members erupt about various issues such as leadership, choice of products used, and sequence of activities. Natural leadership emerges as they start to make decisions
At this point they know what to do but they need to know ways to work with the team? Better define the roles they will play. Norming – refers to the next phase of the team development life cycle, during which those conflicts are settled. They are focused on issues at hand to be completed.
When team members know how to work together but they are establishing their group norms (who will lead specific tasks, etc) Performing – refers to the subsequent phase of the team development life cycle, during which the team executes at its peak performance. Communication is freer and people will feel comfortable to provide solutions to problems. This is the most productive phase. Adjourning - refers to the next phase of the team development life cycle, in which team members leave the project.
Reward and Recognition System Reinforce performance or behavior
Intended to be a positive, but can be demoting Location of Staff
Co-Location – This can involve placing all, or almost all, of the key team members in the same physical location. This will enhance their ability to perform and communicate as a team. It could also mean to co-locate team members in to a “war room" to solve a dedicated problem.
Virtual Teams – Make an effort to acquaint team members Training – a good way to develop team work and get people motivated to tackle the problems
at hand Conflict management approaches – PMI255
Often time’s conflict arises from a lack of clear direction. Confrontation – As the project manager you must be willing to face confrontation when it arises.
Compromise – Find the middle ground to resolve issues. Smoothing – De-emphasize differences Forcing – If you have the creditability, integrity, and leadership image, this will work. Keep in mind that people won’t be willing to go the extra mile. Withdrawal – Avoiding or retreating from the conflict. The strategy would be to let the team members work things out on their own.

Instructor Question – Developing a Project Team You have just been assigned a team of employees that was underutilized in the company. What strategy will you use to build your new team? Note: They may need to be demoted to be effective on your team PMI Exam Questions: 89, 103, 109
14.5 Information Distribution(Brief Overview) (Reference PMI259, EK87) Is the process concerned with collecting information and getting it to the right stake holders. Objective: Getting information to the right people at the right time Communications skills
Public speaking, effective listening, writing, interpersonal skills. Information gathering and retrieval systems
Shared folders, websites Information distribution methods
Email, hard copy doc, video conferencing meetings, phone calls, netmeeting Document Format
Word, excel, PP, Project, PDF Project intranets and home pages - are an effective way to provide a lot of information to a variety of users.
Review “How to distribute Project Information” PMI261 PMI Exam Questions: 81, 117
14.6 Request Seller Responses (Brief Overview) (Reference PMI264) Objective: Obtain bids from prospective sellers Be consistent when sending bids with clear requirements to be able to compare (apples-to-apples) Check with the purchasing department for approved sellers list. Check with sales and marketing people for seller contacts. When choosing a new vendor compare their bid with at least 2 other competitors to see if they are too high/low. PMI Exam Questions: 120
14.7 Select Sellers(Brief Overview) (Reference PMI269) Objective: the selection process of the completed bids Weighted System – Qualifying qualitative (Numeric/high/low date) to minimize the effect of personal prejudice on source selection. Contract Negotiation – Introduction, probing, bargaining, closure, agreement Contract – A mutually binding agreement Reality Check – Often times you need to do due diligence, but you already know the vendor you trust. If there prices are way out of range you might try to negotiate the price down. I even see this in city/state contracts that by lay must do multiple bids.
Chapter 15 - Monitoring& Controlling Process Group Overview of Chapter

Monitoring and Controlling Project Work Control and Monitor Project Work Manage Changes to Performance Baselines Review Deliverables and Work Results Control Project Scope Project schedules may be required for all management parties to better understand how the
project will flow from department to department. Monitoring and Controlling Project Schedules and Costs Topic 9A: Control the Project Schedule Topic 9B: Control Project Costs Monitoring and Controlling Project Quality, Staffing, and Communications Perform Quality Control Manage Project Team Report Project Performance Manage Stakeholders Monitoring and Controlling Project Risk and Contracts Monitor and Control Project Risk Administer a Contract
31. Monitor and Control Project Work 32. Integrated Change Control 33. Scope Verification 34. Scope Control 35. Schedule Control 36. Cost Control
37. Perform Quality Control 38. Manage Project Team
39. Performance Reporting 40. Manage Shareholders 41. Risk Monitoring and Control 42. Contract Administration
Monitoring & Controlling Process group PMI Exam Questions: 68
15.1 Monitor and Control Project Work (Brief Overview) (Reference PMI282) Objective: By recording the actual completion dates you can determine if your schedule is on schedule by comparing with the baseline. Tools used to measure Project management software, PM info systems/Accounting You need weekly status on every task in order to track the project effectively. It is your job to track the project effectively by task Team members will complain but you must hold your ground.

Computer Training #12 – Tracking Write on board: Select Multiple Tasks check off tasks 100%, ViewTableSummary
ViewTableTracking FormatGuidelineStatus DateColor ToolsTrackingProgress lines
ViewToolbarsTracking PMI Exam Questions: 84
15.2 Integrated Change Control (Reference PMI286) Objective: Used to coordinate and track change requests. Changes such as cost, schedule, quality, scope, and risk. Someone in the organization should be responsible for this task. Any changes to cost, quality, time, scope or risk will span changes in the other processes. Change control system – Software product to track/doc changes. Make sure it’s accessible to others in the organization. Configuration Management System – a tool or process used to track changes. Parameters for change control Source of the problem Severity of the problem Compare with original project plan Record factors that may influence the corrective action Identify alternative options to correct the problem System available - NuMara – Web based application $50K initial purchase (includes servers) and $14K/year Tracket – Help Desk Tracking FootPrint – Workflow for approvals, Configuration Management System,
And Change Control capabilities. All changes need to be approved Change Control Board (CCB) - A formally constituted group of stakeholders or experts responsible for reviewing, evaluating, approving, delaying, or rejecting changes to the project, with all decisions and recommendations being recorded.
4.2-1 Project Management Information System The project management information system, an automated system, is used by the project management team to support generation of the project management plan, facilitate feedback as the document is developed, control changes to the project management plan, and release the approved document.
4.2-2 Configuration Management System The configuration management system is a subsystem of the overall project management information system. The system includes the process for submitting proposed changes, tracking systems for reviewing and approving proposed changes, defining approval levels for authorizing changes, and providing a method to validate approved changes.

Configuration management is any documented procedure used to apply technical administrative direction and surveillance to Identify and document physical characteristics of an item.
4.2-3 Change Control System The change control system is a collection of formal documented procedures that define how project deliverables and documentation are controlled, changed, and approved. The change control system is a subsystem of the configuration management system. The tools included in overall change control are Configuration management, Performance measurement and Project management information system.
formal change control process benefits the project because it It ensures that changes are beneficial, it facilitates coordination of changes across work teams, and it minimizes the risk of scope creep.
PMI Exam Questions: 115, 173, 175, 189
15.3 Scope Verification (Brief Overview) (Reference PMI294) Objective: Verify that the deliverables match the planned scope. You need to deliver what the stakeholders expect. Gather all scope documentation Prepare a check list to inspect the end result PMI Exam Questions: 80 Scope verification is the process of obtaining the stakeholders’ formal acceptance of the completed project scope and associated deliverables. Verifying the project scope includes reviewing deliverables to ensure that each is completed satisfactorily. Scope verification differs from quality control in that scope verification is primarily concerned with acceptance of the deliverables, while quality control is primarily concerned with meeting the quality requirements specified for the deliverables. The following is some criteria concerning Scope Verification:
Formal acceptance – Ensure the acceptance is done Need a time line – Here is the deliverable you have 2 weeks to accept the deliverable. If not Accepted then get a clear set of comments describing what is needed to obtain acceptance. We need to response to the information provided and consolidate and clarify what is needed. Non Acceptance - Resubmit correcting the information not accepted. Once accepted it is a closed issue. After accepted It now must go through change control to make changes. There will be some minor flaws in the end result but what will be acceptable. A missing deliverable is not a flaw but an unacceptable outcome. Measurement - Understand the measurement of acceptance the three aspects to understand is Who needs to accept the scope, How will they measure it and What is to be accepted. Measurement methods for selecting a project include comparative approaches, scoring models, benefit contribution and economic models.

Class Question Q – Scope Acceptance Criteria
What are acceptable criteria? You are doing your first walkthrough to inspect the results in your dream house you built. What are your acceptance criteria as you inspect the completed home. Is there chipped tile, paint spots around the floor, closets unpainted, etc. Now define what flaws are acceptable and how many are not acceptable. You are going to buy the home if there are a few flaws, but if there are 100s you may not accept it. Instructor Answer to class question – Scope Acceptance Criteria Provide additional input as you are discussing the walkthrough and mention possible problems that could occur.
15.4 Scope Control (Brief Overview) (Reference PMI299) Objective: The process of making sure the end result and the original scope match. Change must also be considered because one change aspect will affect other aspects (quality, cost). PMI Exam Questions: None Found Project scope control is concerned with triggers that create project scope changes and controlling the impact of those changes. Scope control assures all requested changes and recommended corrective actions are processed through the project Integrated Change Control process. Project scope control is also used to manage the actual changes when they occur and is integrated with the other control processes. Change is inevitable, thereby mandating some type of change control process. You must have a formal change process in place and you must document each change. Scope change control plan should include Paperwork, Tracking system, Approval levels, and Integration with the overall change control system. Scope change control is the process concerned with influencing factors which create scope change, determining that a scope change has occurred and managing actual changes when they occur. Project Change Request Form Request of change Project name Date of request Schdule impact Budget impact Project manager Business reason for the change Analysis of change Project Impact of change Scope impact, Schedule Impact, Budget Impact, Risk Impact, Other Project impact Acceptance Business Sponsor signature Project manager Signature

Not all change needs to go through a change request process. Only approved deliverable that change after it has been signed off. Ongoing daily routine changes is part of the development process and is handled within the development team. If a deliverable is defined in the requirements document and is no longer required to deliver the end project you can issue a change request. Don’t take verbal confirmation. Change to an approved documented requirement you must document the change in requirement. Change request log Change request Date Status Remove B from current requirement 2/2/2003 Initiated Pending Accepted Rejected Minor change log – You can include minor changes without submitting a formal request. The impact to the schedule and budget is none, You need to document the changes somewhere The following are a few definitions related to Scope change: Scope Change - This is any change to the project scope. A scope change almost always requires an adjustment to the project cost or schedule. Scope change needs management focus because if it is not defined as a change it will be funded in the existing project cost. Scope Control - The process of controlling changes to the project scope. Scope Creep - Adding features and functionality (project scope) without addressing the effects on time, costs, and resources, or without customer approval. Uncontrolled changes are often referred to as project scope creep. Scope baseline - The original plan plus or minus approved changes. Scope initiation - is the process which formally recognizes that a new project exists and that an existing project should continue into the next phase. Change Control System - The system includes the documentation, tracking systems, and approval levels necessary for authorizing changes. Variance Analysis - Project performance measurements are used to assess the magnitude of variation. Important aspects of project scope control include determining the cause of variance relative to the scope baseline and deciding whether corrective action is required. Statistical variance - is the standard deviation squared. Configuration Management System - A formal configuration management system provides procedures for the status of the deliverables, and assures that requested changes to the project scope and product scope are thoroughly considered and documented before being processed through the Integrated Change Control process. Day 4 - 12:00 noon

15.5 Schedule Control (Reference PMI308, EK74) Combines scope, time and budget to measure the projects total performance. Often times we will measure only schedule or just budget but not together. Being a ahead of time is a good thing but not if we are over budget. If we are ahead budget but not delivering the proposed scope is not a good thing. Version control - Required so that team members do not over-write one another’s work and to create a reliable record of the work that occurred in a project. Using the earned value reporting system the progress of the project in terms of cost is measured in dollars. The progress of the project in terms of schedule is also measured in dollars. This may sound confusing to people who are used to thinking of schedules in terms of days ahead or behind. In fact it is a more informational description of the condition of the project schedule. If a project activity is reported as being five days behind schedule, and there is one person working on the activity part time, it is very different than an activity that is behind five days that has twenty people working on it. Obviously, what is needed is a reporting system that combines performance, schedule, and budget. This is the purpose of the earned value reporting system. 3.5-1 Earned Value - Calculation definition Used to monitor schedule performance and controlling changes to the schedule baseline using the Earned value technique. The important thing to watch is the trend. If over time the values are getting worse then the project is not recovering. You need to make corrective action to get the project to do better. This can be done by getting a more qualified worker which could reduce overrun costs.
BCWS (Budgeted Cost of Work Scheduled) - This is the original baseline budget of the task up to the status date. It is not affected by the % complete because the % complete does not affect the baseline values. BCWS is also known as PV (Planned Value)
BCWP (Budgeted Cost of Work Performed) – Measures the progress of the schedule or what was actually done. It measures if the work is ahead of schedule or behind schedule. This returns the baseline cost affected by the % Complete and status date. This is also known as Earned Value or EV. At the 3mo point of the project it measures what work was actually done and how much would it cost if everything worked according to plan. At month 3 we planned to have these 6 tasks done. What have we actually completed at month 3 in the project. We’ve completed 5 of the 6 tasks of originally planned with a 10% overrun. The EV Value will be the 5 tasks at the original price it will not take into account the 10% overrun (This will be handled by AC).
ACWP(Actual Cost of Work Performed) – Measures what it actually cost on the active schedule. This returns the actual cost for the completed task through the status date. It is affected by the % complete and status date. It measures if the schedule is over cost or under cost. This is also known as the Actual Cost or AC.
Chart -----BCWS, BCWP, ACWP Everything is on schedule, and costing is right on target No schedule overrun or over cost

Chart -------BCWP - Ahead of schedule -------BCWS – Baseline schedule -------ACWP – Costing Less than the baseline schedule Possible Explanation
1. Things are going better than planned 2. Some of the work is not being done 3. Quality of the work is suffering
Chart ------BCWP, ACWP – Ahead of schedule/Over cost ------BCWS – Baseline Schedule Possible Explanation
1. Over cost but in sync with the ahead of schedule. 2. Could be considered a schedule over run.
Chart -------ACWP – Cost more than expected --------BCWP – Ahead of schedule -------BCWS – Baseline schedule Possible Explanation
1. Overtime
Chart ------BCWS – Baseline Schedule ------BCWP – Behind schedule ----ACWP – Cost less than what is being done Possible Explanation
1. Understaffed 2. Staff is performing better than normal
15.5-2 Cost and Schedule Variance CV (Cost Variance) and SV (Schedule Variance) measured in dollars and the result can not be taken literally. In a large cost project of $50million dollars a $50,000 variance is not too bad, but in a $200,000 project a $50,000 variance could be an issue. Also, in an early phase of the project a large variance could be a problem and in the later stages it may not be an issue.
Cost Variance (CV) - This is the difference between the work that is actually completed and the cost expended to accomplish the work. A positive variance is good, and a negative variance is bad or a (+) costing less and a (-) cost more. The formula for CV is:
CV=BCWP – ACWP (Sometimes written as CV=EV – AC) Example: CV=EV-AC=3800-5000= -1200
Schedule Variance (SV) - This is the difference between the work that is actually completed and the work that was expected to be completed at this time. A positive variance is good, and a negative variance is bad or a (+) is ahead of schedule and a (-) is behind schedule. The value is measured in dollars. The formula for SV is:
SV=BCWP – BCWS (Sometimes written as SV=EV – PV) Example: SV=EV-PV=3800-4500= -700

????? Where’s PV do I need it here
15.5-3 Index (CPI/SPI) Indexes are a constant number which correct some of the CV and SV problems. They are used when consistent numbers are required. Cost and schedule variance is measured in dollars. In a large project, say $ 100 million, a $ 100,000 cost or schedule variance might not be too significant, but in a small project, say $300,000, a $100,000 cost or schedule variance might be significant. Cost and schedule variances also vary depending on what phase the project is in. Early in the project small variances may be significant, and later in the project these same size variances may not be terribly significant. For this reason we use indexes. The values of indexes are the same for the same significance.
Cost Performance Index (CPI). This is the amount of work accomplished per dollar of actual cost spent. A Less than 1(<1) indicates the cost is over budget to date and a more than 1 (>1) indicates the task is under budget to date. If the value is less than 1 it is bad performance and if the value is greater than 1 it is good performance. The formula for CPI is:
CPI=BCWP / ACWP (Sometimes written as CPI = EV/AC ) Example: CPI=EV/AC=3800/5000= .76
Schedule Performance Index (SPI) - This is the amount of work accomplished per dollar of budgeted cost expected to be spent. A value less than 1.0 indicates the project is behind schedule. The formula for SPI is:
SPI = BCWP / BCWS (Sometimes written as SPI=EV/PV) Example: SPI=EV/PV=3800/4500= .84
15.5-4 Completion Indicators Earned Value forecasting techniques help to assess the cost or the amount of work to complete schedule activities, which is called the EAC. Forecasting techniques also help to determine the ETC, which is the estimate for completing the remaining work for a schedule activity, work package, or control account. While the earned value technique of determining EAC and ETC is quick and automatic, it is not as valuable or accurate as a manual forecasting of the remaining work to be done. These are comparing to the completion of the project.
EAC (Estimate At Completion) - The EAC is an estimate of the project cost at the completion of the project, the actual cost of the task, or your current forecast. Based on the information we now know the project won’t cost 50k to complete it will take 60K to complete. The formula for SPI is: EAC=BAC/CPI = 10000/.75=13137 Cost at completion Question - In order to determine the project's estimate at completion (EAC), which of the following information would be needed? The actuals to date or actual cost of work performed (ACWP) and the estimate to complete (ETC).

BAC field (Budgeted At Completion) - This is the baseline cost of the task. It is the total budget based on the project baseline. BAC is adjusted for current performance to date. It says that if the project continues along at its present level of performance to cost, the EAC will be the final project cost. This is a pessimistic value, since it says that the mistakes that have been made in the project are expected to continue for the remainder of the project. VAC field (Variance At Completion) - This is the difference between the baseline and actual cost. A negative value result is an over budget.
ETC – Estimate to Completion – This is the expected cost needed to complete all the remaining work for a schedule activity, work breakdown structure component, or the project. It is the difference between what our current forecast and what the done to date is or our remaining work. The ETC is the remaining budget required to complete the project if work continues at the present performance rate. The formula for ETC is: ETC=EAC-ACWP
15.5-5 Summary of Formulas Formulas to memorize BCWS=PV BCWP=EV ACWP=AC
CV=BCWP – ACWP (Sometimes written as CV=EV – AC) SV=BCWP – BCWS (Sometimes written as SV=EV – PV)
CPI=BCWP / ACWP (Sometimes written as CPI = EV/AC ) SPI = BCWP / BCWS (Sometimes written as SPI=EV/PV) Note: BCWP will always come first in the formula.
?EAC (Estimate At Completion) EAC=BAC/CPI = 10000/.75=13137 Cost at completion
?BAC field (Budgeted At Completion)
?VAC field (Variance At Completion) ?ETC – Estimate to Completion – ETC=EAC-ACWP
The following are tricks toi memorize the formulas
EV always comes first. EV is used to predict the future Variance is always EV-? Performance Indicators EV/? Cost always AC Schedule always PV At Completion Always /PI

Visual chart to describe how to use these values 10 x 10000 Budgeted completion cost Actual The Solid line is the Baseline or PV Cost 5000 x PV 4500 EV 3800 (Schedule)
1
1 10 Calculations Instructor Guide - Lecture Describe on board | 4 Days | - (On Schedule, On Budget) | 50% Complete | 6 Days | - (Over schedule by 1 day, budget off by 1 day) | 50% Complete
Instructor Handout – Earned Value
(Reference EK78)
Computer Training #13 – Earned value (SV) Complete the following to set up a test project
1. Start a blank project 2. Set the Project start date
ProjectProject InformationStart Date: 1/1/08 3. Change the status date
ProjectProject InformationStatus Date: 12/31/07 4. WindowsNew WindowResource SheetOK 5. WindowsArrange All 6. Go to the Resource Sheet and create Resource1 at $100/hr. 7. Create Task1 at 4 days duration and assign Resource1 at 100%. 8. Save the Baseline (ToolsTrackingSave baselineBaselineOK) 9. Insert the following fields in the Entry table
SV, SV%, SPI 10. Change the task using the information in the table below Record the results in the results column with the following:
A. Over Schedule B. Right on Schedule C. Under schedule
Duration Status Date % Complete SV% SV SPI Results 4 Days 1/2/07 30% 4 Days 1/3/07 60% 8 Days 1/2/07 30% 8 Days 1/3/07 60% 4 Days 1/4/07 100% 8 Days 1/4/07 100%

M T W Th |- 50% Complete M T W Th F One day Over Schedule |- 50% Complete Baseline M T W Th - 4 Days - 1 resource assigned |- 50% Complete M T W Th F 6 Days - One day Over Schedule |- 50% Complete PMI Exam Questions: 47, 62, 70, 140, 142, 144, 148, 151
15.6 Cost Control (Reference PMI320) Objective: used to monitor cost performance and controlling changes to the schedule baseline using the Earned value technique (CV). Read More
Computer Training #14 – Earned value (CV)
Complete the following to set up a test project
1. Start a blank project 2. Set the Project start date
ProjectProject InformationStart Date: 1/1/08 3. Change the status date
ProjectProject InformationStatus Date: 12/31/07 4. WindowsNew WindowResource SheetOK 5. WindowsArrange All 6. Go to the Resource Sheet and create Resource1 at $100/hr. 7. Create Task1 at 4 days duration and assign Resource1 at 100%. 8. Save the Baseline (ToolsTrackingSave baselineBaselineOK) Insert the following fields in the Entry table
CV, CV%, VAC 10. Change the task using the information in the table below Record the results in the results column with the following:
A. Over Budget

B. Right on Budget C. Under Budget
Duration Status Date % Complete SV% SV SPI Results 4 Days 1/2/07 30% 4 Days 1/3/07 60% 8 Days 1/2/07 30% 8 Days 1/3/07 60% 4 Days 1/4/07 100% 8 Days 1/4/07 100%
15.7 Perform Quality Control (Brief Overview) (Reference PMI334) Objective: the process of monitoring project work results to determine if they comply with quality standards and figuring out ways to identifying unacceptable standards. Read More PMI Exam Questions: 45, 110, 128, 157, 159, 160, 161, 165
15.8 Manage Project Team (Brief Overview) (Reference PMI345) Objective: the process of monitoring individual performance, gives feedback, solve issues, and organize change.
Instructor Question - Manage a Project Example (Reference PMI350) Work on a project is moving along. However, the instructional design lead, Holly Oliver, sends you an email detailing a recent argument between the two junior instructional designers assigned to the project. She is concerned that their recent inability to get along may jeopardize the project. PMI Exam Questions: None Found
15.9 Performance Reporting (Brief Overview) (Reference PMI351) Objective: the process of gathering and communicating information regarding the current status of project projections over time. Read more
Computer Training #15 – Printing and Reports
FilePrint, View Reports PMI Exam Questions: 141

15.10 Manage Shareholders (Reference PMI357) Objective: the process of communicating to adjust the shareholders needs. Read More PMI Exam Questions: None Found
15.11 Risk Monitoring and Control (Brief Overview) (Reference PMI366) Objectives: The process of responding to identify and unfold risks. Read More PMI Exam Questions: None Found
15.12 Contract Administration (Brief Overview) (Reference PMI373) Objective: the process of managing the relationship with the seller. PMI Exam Questions: 82, 94
Chapter 16 - Closing Process Group Overview of Project
Closing the Project Close a Project Contract Closure
43. Close Project 44. Contract Closure
Module 20 – Closing Process Group
Closing Process Group (Reference JM19P1, EK95)
16.1 Close Project (Brief Overview) (Reference PMI386) Objective: It is necessary to close out all activities and formally close the project. Legal Issues 1. Warranties and product commitments – Is there a plan in place. Implied Warranties 2. Wavers – Wavers occur before the warranty kicks in. Incomplete delivery, etc. 3. Contract Breaches Lessons learned should be documented throughout the project not just at the close of a project PMI Exam Questions: 50, 190, 191, 192, 186, 197, 199, 200

16.2 Contract Closure (Brief Overview) (Reference PMI390) Objective: process of ensuring that contractual obligations have been met on both sides. PMI Exam Questions: 89, 193, 194, 195
Computer Training #16 – Advanced Understanding Topics
Conclusion Microsoft Products PWA Multiple Projects Shared Resources Certification Strategies Project+ certification (Reasons to take Project+)
Demo Proficiency, Improve job opportunities, career advancement, stepping stone to PMP.
80 questions, 90 min, passing grade of 55%
Appendix A – Integrative Requirements
Benefits of multiple iterations of PM Revalidating the project (kill points) Replan the Project Introduce improvements
See Scope Definition section which refers to the requirements document.