Embed Size (px)
Citation preview

Project Management Lecture 22
• Readings Chapter 14
• Lecture 22 Short Project Management.XLSX
• Lecture 22 Project Management.XLSX
• Lecture 22 Event Management.XLSX
• Lecture 22 Have Some Fun.XLSX

Project Management • Project management involves estimating
the length of time to complete a project• Once a project has been undertaken then
a project manager is responsible for carrying out the project on the assigned time table
• How do the managers establish a time schedule– Generally based on average length of time for
each component– Average length of time based on past
experience• Length of time to complete each step is a
random variable

Project Management
• Who does project management?– Engineers, managers, accountants– They estimate number of days to
completion• Generally do not incorporate risk• Benefits of incorporating risk into
project management analysis– Assign a probability to number of days
until project is completed– Assign a probability to getting a project
done in a fixed timeframe; potential bonus

Project Management
• KOV for a project management problem is: How many days will it take?
• There is no final answer until project is completed
• Answer is an unknown PDF of days, weeks, or months to completion
• Simulation provides a methodology for estimating unknown PDFs
• Formulate the problem as a Monte Carlo simulation problem

Project Management
• Model formulation– KOV is “Number of Days” to completion– Identify each task (step) for project– Specify order of each task for the
project• Identify bottlenecks where tasks will wait
on precious stages– Determine the PDFs for number of days
(or weeks, months, etc.) to complete each task• Rely on experience from past jobs• Depend on experts or subcontractors for
the time to complete each task• PDF may be dependent on resources
available

Project Management• Critical to identify the order of the
tasks and their linkages (dependencies), for example:– Task 10 starts after Tasks 5 and 8 are
completed– Task 11 starts after Task 10 is
completed • Thus, Task 5 or 8 could hold up the
whole project– If analysis shows 5 is the bottleneck is
it worth investing more resources in Task 5 to get the project completed earlier?

Project Management• Create a simple Project Network Diagram
to summarize the order of tasks • Drawn it in Excel with simple arrows and
boxes• Network diagram shows potential
bottlenecks
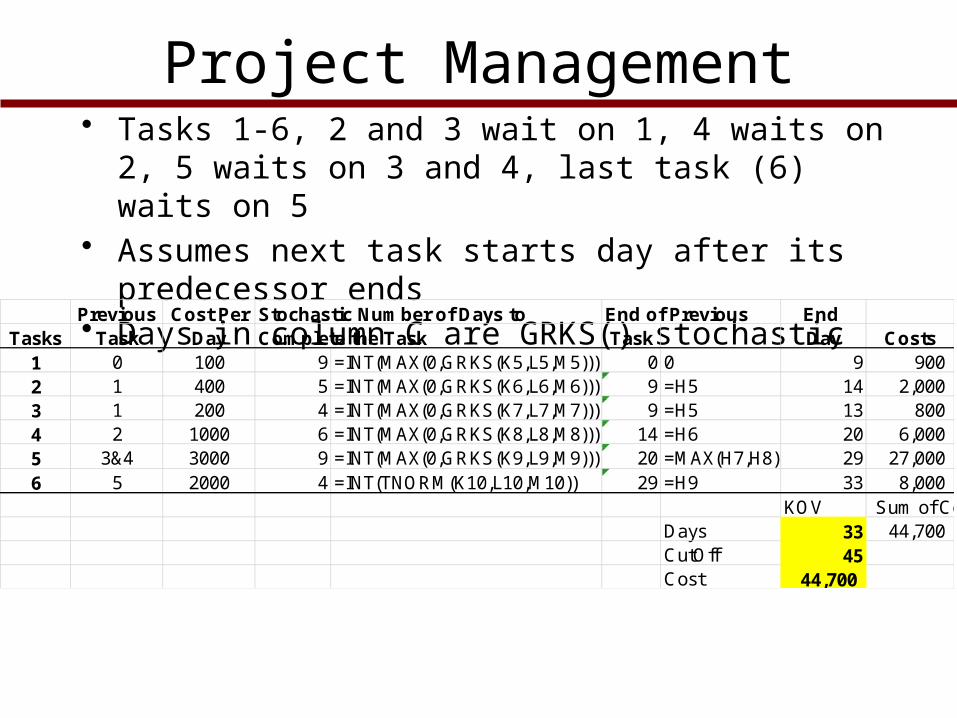
Project Management• Tasks 1-6, 2 and 3 wait on 1, 4 waits on 2, 5
waits on 3 and 4, last task (6) waits on 5• Assumes next task starts day after its
predecessor ends• Days in column C are GRKS() stochasticPrevious Cost Per Stochastic Number of Days to End of Previous End
Tasks Task Day Complete the Task Task Day Costs1 0 100 9 =INT(MAX(0,GRKS(K5,L5,M5))) 0 0 9 900 2 1 400 5 =INT(MAX(0,GRKS(K6,L6,M6))) 9 =H5 14 2,000 3 1 200 4 =INT(MAX(0,GRKS(K7,L7,M7))) 9 =H5 13 800 4 2 1000 6 =INT(MAX(0,GRKS(K8,L8,M8))) 14 =H6 20 6,000 5 3&4 3000 9 =INT(MAX(0,GRKS(K9,L9,M9))) 20 =MAX(H7,H8) 29 27,000 6 5 2000 4 =INT(TNORM(K10,L10,M10)) 29 =H9 33 8,000
KOV Sum of CostsDays 33 44,700 CutOff 45Cost 44,700

Project Management• Scheduled number of days to complete the
project is 45 days• P(Days>45)=?
0
0.1
0.2
0.3
0.4
0.5
0.6
0.7
0.8
0.9
1
0 10 20 30 40 50 60
Pro
b
CDF
Days CutOff

Spreadsheet of a Project Management Analysis
Stage Previous Start Stochastic End Cost per Total PDF for Time Expended Formula for No. Project Activities Stage Day Days Day Day Cost Minimum ExpectedMaximum Start Time
1 Develop Diagram of the System 0 0.0 17.0 17.0 100 1,700 10 20 30 02 Define the KOVs 1 17.0 1.0 18.0 100 100 1 2 4 =F83 Determine the Intermediate Outputs 1 17.0 1.0 18.0 100 100 1 2 5 =F84 Design Complete Output Format 2 & 3 18.0 8.0 26.0 100 800 3 5 10 =MAX(F9,F10)5 Validate Format on User 4 26.0 7.0 33.0 200 1,400 5 10 20 =F11
6 Define Input and Calculated Variables 4 26.0 3.0 29.0 100 300 2 3 6 =F117 Gather Primary Data 6 29.0 165.0 194.0 50 8,250 100 200 300 =F148 Gather Secondary Data 6 29.0 19.0 48.0 50 950 10 15 30 =F149 Estimate Econometric Relations 8 48.0 22.0 70.0 150 3,300 10 30 60 =F16
10 Identify Stochastic Variables 5 33.0 1.0 34.0 150 150 1 2 4 =F1211 Gather Data for Stochastic Variables 10 34.0 32.0 66.0 50 1,600 20 30 60 =F1912 Parameter Estimation for Stochastic Variables 11 66.0 23.0 89.0 150 3,450 5 10 20 =F2013 Distribution Testing 12 89.0 3.0 92.0 200 600 2 3 6 =F21
14 Assemble Model & Begin Testing 7, 9 & 13 194.0 75.0 269.0 250 18,750 50 100 200 =MAX(F15,F17,F22)15 Validation and Verification by: 14 269.0 0.0 269.0 0 0 0 =F2416 Personal 15 269.0 39.0 308.0 200 7,800 30 45 90 =F2417 Peers 15 269.0 190.0 459.0 100 19,000 60 100 200 =F2518 Producers 15 269.0 45.0 314.0 150 6,750 40 60 120 =F2519 Model Refinement Based on Validation 16, 17 & 18 459.0 20.0 479.0 250 5,000 10 25 50 =MAX(F26,F27,F28)20 Model Application & Report Preparation 19 479.0 9.0 488.0 200 1,800 5 10 20 =F29
Days CostKey Output Variables for Project ManagementTotal 488.0 Total 81,800

Project Management Expanded• I like to add a second KOV – Cost• We know cost of a project is stochastic• So project management model can simulate
PDFs for days and cost• In the example $/day costs for each task are
multiplied by stochastic days
Previous Cost Per Stochastic Number of Days to End of Previous End Tasks Task Day Complete the Task Task Day Costs
1 0 100 9 =INT(MAX(0,GRKS(K5,L5,M5))) 0 0 9 900 2 1 400 5 =INT(MAX(0,GRKS(K6,L6,M6))) 9 =H5 14 2,000 3 1 200 4 =INT(MAX(0,GRKS(K7,L7,M7))) 9 =H5 13 800 4 2 1000 6 =INT(MAX(0,GRKS(K8,L8,M8))) 14 =H6 20 6,000 5 3&4 3000 9 =INT(MAX(0,GRKS(K9,L9,M9))) 20 =MAX(H7,H8) 29 27,000 6 5 2000 4 =INT(TNORM(K10,L10,M10)) 29 =H9 33 8,000
KOV Sum of CostsDays 33 44,700 CutOff 45Cost 44,700

Bid Analysis• As a manager one job is to estimate
how much to bid a contract• We can use the project
management, cost analysis to estimate the best bid for a contract
• The costs are at risk and if we bid to low our profits are reduced or an actual loss is incurred
• Bid to high and your company does not get the job

Bid Analysis as a Stochastic Problem

Bid Analysis as a Stochastic Problem
0
0.1
0.2
0.3
0.4
0.5
0.6
0.7
0.8
0.9
1
390000 395000 400000 405000 410000 415000 420000 425000 430000
Pro
b
CDF of Total Costs (black line) and Bid Price (red line)
TC Bid
0
0.1
0.2
0.3
0.4
0.5
0.6
0.7
0.8
0.9
1
-6000 -4000 -2000 0 2000 4000 6000 8000 10000
Pro
b
CDF of Profits given a bid of 400000

Event Planner• Event planner KOVs
– Number of days ahead to start planning an event
– Cost of the event• Research application KOVs
– Time to complete a research project– Cost of a project
• Wedding planner– Probability of being ready on time– Cost of the event
• Banquet planner

Event Planner


![CS451 Lecture 5: Project Metrics and Estimation [Pressman, Cha pters 22, 23 ]](https://img.dokumen.tips/doc/110x75/568135d4550346895d9d3ee2/cs451-lecture-5-project-metrics-and-estimation-pressman-cha-pters-22-23.jpg)