Embed Size (px)
Citation preview

Harpur Hill, Buxton Derbyshire, SK17 9JN T: +44 (0)1298 218000 F: +44 (0)1298 218590 W: www.hsl.gov.uk
Correlation of noise emission of sanders and polishers with in use noise levels
HSL/2007/43
Project Leader: Emma Shanks BSc MIOA
Author(s): Emma Shanks BSc MIOA
Science Group: Human Factors
© Crown copyright 2007

ii
ACKNOWLEDGEMENTS
The author gratefully acknowledges those who assisted in this project, in particular the tool
manufacturers who supplied the tools, and the sites who generously provided their time and
staff for the field measurements.

iii
CONTENTS
1 INTRODUCTION......................................................................................... 11.1 Declaration of noise emission.................................................................. 11.2 Outline of work......................................................................................... 11.3 Terminology for emission data................................................................. 1
2 TOOLS TESTED......................................................................................... 2
3 LABORATORY MEASUREMENTS ........................................................... 33.1 Laboratory test codes .............................................................................. 33.2 Measured emission results .................................................................... 10
4 ADDITIONAL LABORATORY MEASUREMENTS .................................. 144.1 Testing electric tools to the pneumatic test code ................................... 144.2 Pneumatic polishers under load ............................................................ 154.3 Tool K with and without all accessories and attachments...................... 15
5 REAL USE MEASUREMENTS................................................................. 175.1 Measurement & results.......................................................................... 185.2 Declared emission, measured emission and in real use results ............ 195.3 Measurement at operator’s ear: Laboratory vs real use ........................ 22
6 EMISSION VALUES AS AN INDICATOR OF RISK................................. 24
7 SUMMARY................................................................................................ 25
8 APPENDIX A – EMISSION TEST RESULTS: SUMMARY ...................... 26
9 APPENDIX B – EMISSION TEST RESULTS: DETAIL ............................ 27
10 APPENDIX C – LPA AT OPERATOR’S EAR: DETAIL............................. 43
11 APPENDIX D – EQUIPMENT ................................................................... 45
12 REFERENCES.......................................................................................... 46

iv
EXECUTIVE SUMMARY
Objectives
The Control of Noise at Work Regulations 2005, which came into force in April 2006
implementing the EU Physical Agents (Noise) Directive (2003/10/EC), state that employers
may use manufacturers’ tool data to assess the risk to their employees from exposure to noise.
Until now, HSE has not investigated the use of manufacturers’ noise data for these purposes,
nor the correlation between the same family of tools e.g. sanders – electric & pneumatic
The objectives of this project were to:
Measure the noise emission of the tools supplied by the manufacturers and compare to the
manufacturers’ declared emission, if stated
Determine whether tools with a declared noise emission have been tested in accordance
with the most appropriate test code
Compare the noise emission of the electric tools when tested according to the pneumatic
standard (a fundamental difference in the test codes being that the pneumatic tools are tested
under load with an operator whereas the electric tools are free running)
Comment on the noise test codes for the family of tool under test e.g. should tools be tested
with all accessories attached
Investigate the link between the manufacturers’ declared emission and the workstation
emission
Main Findings
Airborne noise emission data, required by the Supply of Machinery (Safety) Regulations 1992
(SM(S)R) as amended, varied greatly between manufacturers and between different tools
supplied by the same manufacturer. While the regulations and related transposed standards for
the family of tools under consideration are clear about declaration requirements, the method of
declaration and the quality of data supplied is not always consistent or transparent, making it
difficult to compare machines.
Where the manufacturer had stated the test code used, this was also used for the laboratory
measurement. In the case of the electrically powered tools supplied, this meant using the
partially superseded EN 50144 series of standards. In the case of the pneumatic tools, historical
development of the standard from the (CAGI-)PNEUROP trade association publication to the
present BS EN ISO 15744 international standard led to a lack of clarity regarding inclusion or
otherwise of an uncertainty value associated with the declared emission.
Where declared sound pressure level (LpA) emission information was available, there was some
correlation between manufacturers’ declared emissions and the results from laboratory
measurement – emission data for 5 out of 13 tools were verified. Where declared sound power
level (LWA) information was available, an additional sixth tool was also verified. This anomaly
arose due to the differences in calculation of LWA for electric and pneumatic tools that require
the shape of the measurement surface to be taken into account. Although identical microphone
locations are used, a 2dB(A) difference in sound power level can be attributed to the calculation
of LWA alone and has nothing to do with the actual noise emission from the tool.
At the time of writing, the EN 50144 safety standard series had been partially superseded by the
EN 60745:2003 safety standard series (which mirrors the noise test code in ISO 15744), with a

v
2006 revision also due. It should be noted that comparison of LWA emission values obtained
from EN 50144 and ISO 15774 cannot be drawn on a like-for-like basis due to the 2dB(A)
difference obtained through calculation. LpA values are unaffected.
A fundamental difference in the testing of pneumatic and electric powered tools is that the
electric tool tests are free running whereas the pneumatic tool tests are under load and require an
operator, a defined work piece and work pattern; pneumatic polishers are an exception as they
are tested free running. Testing the electric tools to the pneumatic standard, i.e. under load and
with an operator, revealed an overall decrease in noise emission from the tool. This is not
reflective of the noise emission in the workplace. If the declared emissions for electric tools are
to be used in risk assessment then the free running test is more appropriate. The loaded test for
pneumatic tools is also appropriate.
Standard tests have the potential to put tools in correct order of relative risk. This enables
purchasers and users of machinery to identify low noise designs and make informed choices
regarding the safety of a potential purchase from a broad range of tools. In practice, standard
test results are only acceptable for relative risk if there is consistency in how the emission data
are declared. The standard test results are not acceptable for identifying absolute risk.
Comparison of real use (field) measurement data with the manufacturers’ declared workstation
emission (where available) revealed differences in LpA values ranging from -0.6 to 23.7 dB(A).
This indicates that use of the declared LpA emission values in exposure assessment is likely to
underestimate the real use workstation emission level. Real use emission was on average 8.7 ±
6.3 dB(A) higher than the declared emission.
Recommendations
Alert tool manufacturers to their duties under SM(S)R with regards to provision of airborne
noise emission data
Advise standards bodies and tool manufacturers that reproducibility of declared emissions is
not sufficiently high
Alert end-users of tools that the declared noise emissions may not sufficiently reflect the
risk to the worker
Recommend measurement location at the operator’s ear as a priority. SM(S)R require that if
the LpA at the operator’s ear is greater than 70dB(A) a statement is made to that effect; if the
level is greater than 85dB(A) then declare the LWA of the tool.

1
1 INTRODUCTION
1.1 DECLARATION OF NOISE EMISSION
The Supply of Machinery (Safety) Regulations 1992 as amended [3] place duties on machine
manufacturers and suppliers to design and construct machinery in such a way that noise
emissions are reduced to the lowest level taking account of technical progress and the
availability of techniques for reducing noise, particularly at source. There is also a requirement
that manufacturers and suppliers provide information on the airborne noise emissions of their
products. The purpose of declaring such information is to allow verification of a low noise tool
design. Additionally, purchasers and users of machinery are able to make informed choices
regarding the safety of a potential purchase.
Standards have been developed in support of the Machinery Directive that define how noise
emission values should be obtained for different machine types. Ideally these standard tests
should provide noise emission data that is representative of the expected noise generated in real
use, allow tools of the same type to be compared, and identify low-noise tools, highlighting
therefore successful low-noise designs. However in practice it can be difficult to design a
standard test that is both based on a realistic operation and which gives repeatable results. It is
common therefore for standard tests to be based on artificial operations. However in these
situations, there is concern that the resultant standard noise emission data may not reflect the
noise generated by the tool during normal use. There is a need therefore to evaluate noise
emission standards.
1.2 OUTLINE OF WORK
The aims of the work reported here were to:
Measure the noise emission of the tools supplied by the manufacturers and compare to the
manufacturers’ declared emission, if stated
Determine whether tools with a declared noise emission have been tested in accordance
with the most appropriate test code
Compare the noise emission of the electric tools when tested according to the pneumatic
standard (a fundamental difference in the test codes being that the pneumatic tools are tested
under load with an operator whereas the electric tools are free running)
Comment on the noise test codes for the family of tool under test e.g. should tools be tested
with all accessories attached
Investigate the link between the manufacturers’ declared emission and the workstation
emission
This project was carried out in conjunction with HSL project JR45.085, an investigation into the
correlation between vibration emission and vibration during real use on sanders and polishers as
reported in NV/06/18 [17].
1.3 TERMINOLOGY FOR EMISSION DATA
The noise emission data declared by the manufacturer and supplied with the sander or polisher
(where available) is referred to as the “declared emission”.
The noise emission measured by HSL in accordance with the requirements of the relevant
standard is referred to as the “measured emission”.

2
2 TOOLS TESTED
Thirteen new tools were obtained for testing. Details of the tools are given in Table 1.
Table 1. Tool details
Tool Tool type Motor Speed (rpm) Action
A Sander Pneumatic 9500 random orbital
B Sander Pneumatic 12000 random orbital
C Sander Pneumatic 12000 random orbital
D Sander Pneumatic 10000 orbital
E Sander Pneumatic 12000 random orbital
F Sander Pneumatic 10000 orbital
G Sander Electric 240V 4000 – 11000 random orbital
H Sander Electric 240V 11000 orbital
I Sander Pneumatic 10000 random orbital
J Polisher Pneumatic 10000 random orbital
K Polisher Electric 110V 2000 angle
L Polisher Pneumatic 2100 angle
M Sander Electric 110V 10000 orbital
All tools except Tools I and K were loaned by tool manufacturers and supplied with varying
degrees of declared emission information. Tools I and K were bought for the purposes of the
project. Table 2 shows the declared noise emission information available with the tools. The
information supplied with Tools I and K was not sufficiently clear to allow inclusion of the
values in any subsequent analysis.
Table 2. Tool declared emission data
*These values have been estimated in accordance with the relevant method quoted and assume a K value
has not already been included in the declared emission. +This value has been estimated based on the declared LWA-13dB. It assumes a measurement surface area
of 20m2.
Declared emission (dB) Tool Test method quoted
LpA KpA LWA KWA
A dB(A) SPL @ 1m PN8NTC1.2 79 3* - -
B dB(A) SPL/SWL @ 1m 78 3* 91 3*
C dB(A)SPL/SWL @ 1m 78 3* 91 3*
D dB(A) SPL/SWL @ 1m 80 3* 93 3*
E dB(A) CAGI-PNEUROP ISO 3744 72+ 2* 85 ± 2
F dB(A)EN ISO 15744 82 3* - -
G BS EN 50144-2-4:1999 84.6 2* 97.5 2*
H No data available - - - -
I 80dB(A) – numeric value is unqualified - - - -
J dB(A) SPL/SWL @ 1m 79 3* 92 3*
K 88.7dB EN 50144 – numeric value is unqualified - - - -
L dB(A) PN8NTC1.2 71 ± 3 - -
M dB(A) EN 50144 73.4 2* - -

3
3 LABORATORY MEASUREMENTS
3.1 LABORATORY TEST CODES
The measurement of the noise emission from sanders and polishers has as its basic measurement
standard BS EN ISO 3744:1995 “Acoustics, Determination of sound power levels of noise
sources using sound pressure – Engineering method in an essentially free field over a reflecting
plane” [4]. The choice of test code is, however, dependent on the tool type and how it is
powered. Of the 13 tools tested these can be split into four groups:
1. Pneumatic sanders (7 tools)
2. Pneumatic polishers (2 tools)
3. Electric sanders (3 tools)
4. Electric polishers (1 tool)
For all four groups sound pressure level measurements are required at five defined microphone
positions. These values are then used to calculate the sound power level of the tool. The tests for
pneumatic sanders are under load, require an operator, a defined work piece and a defined work
pattern, using a test methodology very similar to that used for vibration emission testing of the
pneumatic tools. Electric tools and pneumatic polishers are tested free running, without an
operator.
3.1.1 Pneumatic tools test codes
3.1.1.1 Noise emitted from the tool over a defined measurement surface
The specific test code for pneumatic tools, as referred to in the safety standard BS EN 792-
8:2001 [15], is:
BS EN ISO 15744:2002
Hand-held non-electric power tools. Noise measurement code. Engineering method (grade 2)
[5]
This standard requires the A-weighted sound pressure levels to be measured directly at five
defined microphone positions on a measurement surface of a hemisphere standing on a
cylindrical pedestal enveloping the tool (see Figure 1.). The five microphone positions are
located 1m from the geometric centre of the tool. Four of the positions are spaced at regular
intervals on a plane defined as passing through the geometric centre of the tool and parallel to
the reflecting plane. The fifth position is located at a distance of 1m above the geometric centre
of the tool. The A-weighted sound power level, LWA, is calculated from the following:
0
10S
SLL pfAWA log dB
with pfAL determined from:
AA
i
L
pfA KKL pAi
21
5
1
1010
5
110
'.log

4
where:
pfAL is the A-weighted surface sound pressure level, dB
L’pAi is the A-weighted sound pressure level at the i-th microphone position, dB
K1A is the A-weighted background noise correction
K2A is the A-weighted environmental correction
S is the measurement surface area, 4 m2
S0 1 m2
Key
1 to 5 Microphone position
6 Geometric centre of power tool
a Radius of hemisphere
Figure 1. Measurement surface for BS EN ISO 15744
For all the pneumatic tools tested at HSL no environmental correction was required as the
measurements were made in a semi-anechoic chamber (see Figure 2.). Background noise
corrections were also not necessary because the difference between the surface sound pressure
level with and without the tools in operation was greater than 15 dB; it was typically greater
than 40 dB.
Clause 9 of the standard requires the measurements to be made three times and the average
value to be retained as the measured emission
i.e. LWA of tool = (LWA 1st measurement + LWA 2nd measurement + LWA 3rd measurement)/3
For pneumatic orbital and random orbital sanders, the measurements are carried out during a
sanding operation performed by a trained operator. The sander, equipped with sanding paper of
grade 180 grit and operated on a horizontal rigid steel plate, has a 30 N ± 5 N feed force applied
vertically downwards whilst the trained operator moves the sander over the surface of the steel
plate in a figure-of-eight pattern, according to ISO 8662-8, each figure-of-eight pattern taking
approximately 4 s to complete.

5
Figure 2. Test rig for pneumatic sanders
For pneumatic polishers, measurements were carried out under no-load conditions. This was
achieved by suspending the tools from a frame fixed to loading bolts contained in the roof of the
semi-anechoic chamber (see Figure 4).
3.1.1.2 Emission sound pressure level at the workstation
The LWA value may also be used to calculate the A-weighted emission sound pressure level at
the workstation, LpA. This is done according to ISO 11203 [6] using the following equation:
QLL WApA
where Q = 11 dB. The evaluation for this is given in BS EN ISO 15744. It should be noted that
because no background or environmental corrections were applied in the calculation of the LWA,
the LpA equals the pfAL .
3.1.1.3 C-weighted peak emission sound pressure level at the workstation
The C-weighted peak emission sound pressure level, LpC,peak, at the workstation is the highest C-
weighted peak sound pressure level measured at any of the five microphone positions at any
point during a measurement series on a tool with no corrections applied.
3.1.1.4 Declarations
Each tool should have a declared noise emission value. The declaration of the noise emission
values are made as a dual number noise emission declaration in accordance with ISO 4871:1996
[16]. The LpA, LpC,peak and LWA are declared with their respective uncertainties KpA, KpC,peak and
KWA. The likely uncertainty value is 3 dB.

6
3.1.2 Electric tools test codes
At the time of writing, the standard series for the safety of hand-held electric power tools was
undergoing revision from the EN 50144 series [7] [8] [9] to the EN 60745 series [10] [11]. As
may be seen from Table 2 the electrically powered tools have been declared according to the EN
50144 series. Whilst there is no fundamental change in how noise measurements are made
under laboratory conditions there is a difference in how the declared sound power level is
calculated. In EN 50144, the measurement surface is shown to be a cube with five discrete
microphone locations. This gives a measurement surface area of 20 m2. In EN 60745 the same
five microphone locations are retained but the measurement surface is defined as a hemisphere
standing on a cylindrical pedestal. This gives a measurement surface of 4 m2 (12.56 m²). In
both cases the sound power level of the tool is calculated using the following equation:
0
10S
SLL pfAWA log dB
where:
pfAL is the surface sound pressure level
S is the measurement surface area
S0 1 m2
For EN 50144, with S = 20 m2, this equates to 13pfAWA LL
For EN 60745, with S = 12.56 m², this equates to 11pfAWA LL
This means a difference of 2 dB(A) in declared sound power emissions through calculation
alone. Whilst this difference in standards will not affect the findings of this report, it should be
noted that declared sound power emission values from the two different standards must not be
compared on a like-for-like basis.
3.1.2.1 Noise emitted from the tool over a defined measurement surface
For the purposes of this report, the specific test codes (and their EN status) employed for
electric hand-held tools are:
BS EN 50144-1:1996
Safety of hand-held electric motor operated tools. Part 1: General requirements
(current, revised, work in hand)
BS EN 50144-2-3:2002
Safety of hand-held electric motor operated tools. Part 2-3: Particular requirements for grinders,
disk type sanders and polishers
(current)
BS EN 50144-2-4:2000
Safety of hand-held electric motor operated tools. Part 2-4: Particular requirements for sanders
(superseded, withdrawn)

7
For clarity, the following standards are those current at time of writing:
BS EN 60745-1:2003
Hand-held motor-operated electric tools. Safety. Part 1: General requirements
(current, work in hand)
BS EN 60745-2-4:2003
Hand-held motor-operated electric tools. Safety. Part 2-4: Particular requirements for sanders
and polishers other than disk type
(current, work in hand)
EN 50144-1 requires the A-weighted sound pressure levels to be measured directly at five
defined microphone positions on a cube shaped measurement surface (see Figure 3.). The five
microphone positions are located 1 m from the geometric centre of the tool. Four of the
positions are spaced at regular intervals on a plane defined as passing through the geometric
centre of the tool and parallel to the reflecting plane. The fifth position is located at a distance of
1 m above the geometric centre of the tool. The A-weighted sound power level, LWA, is
calculated from the following:
0
10S
SLL pAWA log dB
with pAL determined from:
5
1
1010
5
110
i
L
pApAiL
.log
where:
pAL is the A-weighted surface sound pressure level, in dB re 20 Pa
LpAi is the A-weighted sound pressure level at the i-th microphone position, in dB re 20 Pa
S is the measurement surface area, 20 m2
S0 1 m2

8
Key
1 to 5 Microphone position
Figure 3. Measurement surface for BS EN 50144
The tool was positioned such that its main axis was at 45o between the microphone positions 1-4
and 2-3. Measurements were considered valid if the difference between the background noise
and the tool under test was at least 10 dB. The difference was typically greater than 40 dB.
Clause 13.2.4 of EN 50144-1 requires three consecutive tests to be carried out and the
arithmetic mean of the three, rounded to the nearest decibel, to be retained as the measured
emission, i.e.:
LWA of tool = (LWA 1st measurement + LWA 2nd measurement + LWA 3rd measurement)/3

9
Figure 4. Test rig for electric sanders & polishers (and pneumatic polishers)
3.1.2.2 Emission sound pressure level at the workstation
EN 50144 does not give any guidance regarding the measurement of the noise level at the
operator’s ear save for one note at the end of Clause 13.2.6 that reads:
“NOTE. The emission sound pressure level related to the workplace is assumed to be the
surface sound pressure level.”
Clause 7.13.1 requires that the:
“…continuous A-weighted equivalent sound pressure level at the operator’s ear” be included in
the instruction sheet for the tool “if over 70 dB(A) or a statement to the effect if it does not
exceed 70 dB(A)”.
Despite notes in standards not being normative, the inference is that the surface sound pressure
level should be taken as the emission sound pressure level related to the workplace. This has
been addressed to some degree in EN 60745 with the inclusion in Clause 6.1 of a definitive
calculation, identical to that of EN 15744. In both cases, the noise at the operator’s ear
declaration value is still equivalent to the surface sound pressure level at 1 m but with the option
in a further note to correct for a distance of less than or greater than 1 m.
A workstation location was defined by HSL as being at 0.65 m above the geometric centre of
the tool, i.e. 1.65 m above the ground at a position representative of the worker’s ear.
Measurements were taken at this location for the four electric tools provided. Three consecutive
measurements were made and the arithmetic average of the three retained as the measured
emission sound pressure level.

10
3.1.2.3 C-weighted peak emission sound pressure level at the workstation
Clause 7.13.1 of EN 50144 requires the “C-weighted instantaneous sound pressure level if over
63 Pa (130 dB in relation to 20 Pa)” to be included in the instruction manual for the tool. As
with the emission sound pressure level at the workstation the standard gives no guidance as to
how this value should be obtained. Guidance has therefore been taken from the pneumatic test
code. The highest C-weighted peak sound pressure level measured at any of the five
microphone positions at any point during a measurement series on a tool with no corrections
applied was taken as the C-weighted peak emission sound pressure level.
3.1.2.4 Declarations
In terms of noise information, Clause 7.13.1 of EN 50144 clearly states that the instruction sheet
for the tool shall include at least:
a) The continuous A-weighted equivalent sound pressure level at the operator’s ear if over
70 dB(A), or a statement to the effect if it does not exceed 70 dB(A)
b) The peak C-weighted instantaneous sound pressure level if over 63 Pa (130 dB in
relation to 20 Pa)
c) The sound power level emitted by the tool where the equivalent continuous sound
pressure level exceeds 85 dB(A)
d) When necessary, instructions concerning the use of ear protection.
3.1.2.5 EN 60745 requirements
The requirements of EN 60745, the successor of EN 50144, are identical to those of the
pneumatic test code, EN 15744.
3.2 MEASURED EMISSION RESULTS
A combination of measurement methods were used to obtain the sound pressure level readings
at the specified microphone positions. For Tools G, H, K and M (electric) a Brüel & Kjær type
2260 sound level meter was used. A 30 s Leq measurement was made sequentially at each of the
five microphone locations and then at the defined operator ear location of 0.65 m above the
geometric centre of the tool. For the remaining tools (pneumatic), microphones on tripods were
located at each of the measurement positions. These were connected to microphone power
supplies and the output routed to a Brüel & Kjær PULSE analysis system for real time analysis.
Simultaneous noise measurements were made at the five microphone positions during testing,
again using a 30 s linear averaging time.
For all tools, the sound pressure level values obtained at the microphone positions were used to
calculate the surface sound pressure level, the sound power level and where applicable the noise
level at the workstation. Table 3 shows the noise emission values from the tests carried out by
HSL against those values declared by the manufacturers of the tools. It may be seen that Tools
E, F and L have two measured emission values. This is because the tools were supplied with
different exhaust options or attachments. E.1 and F.1 refer to the attachment of a hose and dust
bag; E.2 and F.2 refer to the use of a silenced exhaust; L.1 is the use of the tool without the hose
sleeve over the airline and L.2 is with the hose sleeve over the airline. It was considered
appropriate to test the tools with all available options. A full summary of the emission test
results may be found in Appendix A whilst full result details may be found in Appendix B.

11
Figure 5 shows the declared sound pressure level against the measured surface sound pressure
level. Figure 6 shows the declared sound power level against the measured sound power level.
The result for Tool K is for the tool without its polishing pad and side handle.
Table 3. Declared emission vs measured emission & verification
Declared
emission
(dB)
Measured
emission
(dB)
Declared
emission
(dB)
Measured
emission
(dB)Tool
LpA KpA LpA KpA
Verified
LWA KWA LWA KWA
Verified
A 79 3* 81.7 3.0 Yes - - 92.7 3.0 -
B 78 3* 83.6 3.0 No 91 3* 94.5 3.0 No
C 78 3* 82.9 3.0 No 91 3* 93.8 3.0 Yes
D 80 3* 74.1 3.0 Yes 93 3* 85.0 3.0 Yes
E.1 88.9 3.0 No 3.0 No
E.272+
2*77.7 3.0 No
85 ± 2 99.9
88.7 3.0 No
F.1 81.1 3.0 Yes 3.0 -
F.282 3*
77.0 3.0 Yes - -
92.0
87.9 3.0 -
G 84.6 2* 87.4 2.0 No 97.5 2* 100.4 2.0 No
H - - 80.6 2.0 - - - 93.5 2.0 -
I - - 79.6 3.0 - - - 90.6 3.0 -
J 79 3* 79.3 3.0 Yes 92 3* 90.3 3.0 Yes
K - - 81.8 2.0 - - - 94.8 2.0
L.1 74.7 3.0 No 3.0
L.271 ± 3
68.4 3.0 Yes - -
85.7
79.4 3.0
M 73.4 2* 76.8 2.0 No - - 89.8 2.0
*These values have been estimated in accordance with the relevant method quoted and assume a K value
has not already been included in the declared emission. +This value has been estimated based on the declared LWA-13dB. It assumes a measurement surface area
of 20m2.

12
Declared emission vs HSL measured emission
65
75
85
95
105
A B C D E.1 E.2 F.1 F.2 G H I J K L.1 L.2 M
Tool
so
un
d p
ressu
re le
ve
l, L
pA (
dB
)
declared LpA (+K) measured LpA (+K)
Figure 5. Declared sound pressure level vs measured surface sound pressure level
Declared emission vs HSL measured emission
65
75
85
95
105
A B C D E.1 E.2 F.1 F.2 G H I J K L.1 L.2 M
Tool
so
un
d p
ow
er
leve
l, L
WA (
dB
)
declared LWA (+K) measured LWA (+K)
Figure 6. Declared sound power level vs measured sound power level
Table 3 also shows whether the manufacturer’s declared emissions have been verified.
Verification has been carried out in accordance with BS EN ISO 4871:1997 [16] wherein it is
stated that (laboratory) measured emission must be less than or equal to the declared emission
plus the uncertainty value i.e. Lmeasured Ldeclared + Kdeclared.

13
Considering only the LpA, tools A, D, F, J and L.2 have been verified. If LWA is considered, then
tool C is also verified. This anomaly arises due to the differences in calculation for LWA as
highlighted in Section 3.1.2. The LWA calculation is based on the LpA and a defined surface area.
Tools A, C, D, F, J and L are all pneumatic but as Table 2 shows they are not all declared to the
same standard. Tool F is the only one declared to the current BS EN ISO 15744:2002. This uses
the hemisphere on a cylindrical pedestal measurement surface (Figure 1). In calculation terms,
LWA = LpA +11dB. The remainder of this group either uses a selection of historic pneumatic tools
test codes or the test code is not referenced. From the declared values in Table 2, for tools C, D
and J, it can be seen that LWA - LpA = 13dB. This would indicate that a cube shaped measurement
surface has been used to calculate LWA (Figure 3). For tool C, this difference in calculation is the
difference between a verified and non-verified tool. Due to the ambiguous nature of the LWA
declarations, these will not be used in further analysis; only the LpA values will be considered.
This is consistent with the current Machinery Safety Regulations [3], which place emphasis on
knowing the level at the operator’s ear. For all tools, the LpA, declared or measured, is taken as
the level at the operator’s ear.
Figure 7 shows the measured LpA emission results against the standard deviation of the
measurement. Displaying the data in this way highlights the grouping of the tools.
0.00
0.20
0.40
0.60
0.80
1.00
1.20
1.40
65 70 75 80 85 90
LpA HSL measured emission (dB)
sta
nd
ard
de
via
tio
n (
dB
)
Figure 7. LpA HSL measured emission vs standard deviation
As Figure 7 shows, the majority of the tools lie between approximately 75dB and 85dB LpA.
Tool L.2 is identified as low noise while tools G and E.2 are identified as having higher
measured emission values. Tools E.2 and L.1 are identified for completeness.
L 2
G
E 1L 1
E 2

14
4 ADDITIONAL LABORATORY MEASUREMENTS
4.1 TESTING ELECTRIC TOOLS TO THE PNEUMATIC TEST CODE
Section 3.1 discussed the differences in test codes for electric and pneumatic tools. Further to
this discussion, the electric Tools G, H, K and M were tested according to the criteria laid out in
the pneumatic test code, EN 15744. Table 4 and Figure 8 show the results obtained.
Table 4. Electric tool noise emissions when tested according to the pneumatic tools test code
EN 50144 (free running) EN ISO 15744 (loaded)
Tool Type Measured
LpA
(dB)
Measured
LWA
(dB)
Measured
LpA
(dB)
Measured
LWA
(dB)
Feed force
N
G Sander 87.4 100.4 81.8 92.8 50 ± 5
H Sander 80.6 93.5 76.7 87.7 50 ± 5
K Polisher 81.8 94.8 82.6 93.6 30 ± 5
M Sander 76.8 89.9 72.9 83.9 50 ± 5
Note: For EN 50144, LWA – LpA = 13dB; this is due to the cube shaped measurement surface
used to calculate LWA. For EN ISO 15744, LWA – LpA = 11dB; this is due to the hemisphere on a
cylindrical pedestal measurement surface. For this reason, LWA is not plotted in Figure 7.
Electric Tools G, H, K & M tested to the pneumatic standard
70
75
80
85
90
G H K M
Tool
dB
(A)
LpA 50144 LpA 15744
Figure 8. Electric tools tested to pneumatic test standard
In the case of the three sanders, the application of a feed force by an operator using the standard
figure-of-eight pattern on a rigid steel plate resulted in a lower value of LpA. For Tool K, the LpA
was slightly increased. It was noted during testing that this tool had powerful exhaust ventilation

15
and that due to the nature of the test, one of the exhaust vents pointed directly at one of the
microphone locations. This exhaust vent was also a major source of motor noise for the tool.
4.2 PNEUMATIC POLISHERS UNDER LOAD
EN ISO 15744 requires that pneumatic polishers normally be tested free running. The results for
these tests are reported in Section 3.2. Additionally, the pneumatic polishers Tools J and L were
retested using the same criteria as for pneumatic sanders (a skilled operator, known feed force,
figure-of-eight sanding pattern etc). Table 5 and Figure 9 show the results obtained.
Table 5. Results for pneumatic polishers tested under load
Free running Loaded
Tool Type Measured
LpA
(dB)
Measured
LWA
(dB)
Measured
LpA
(dB)
Measured
LWA
(dB)
Feed force
N
J Polisher 79.3 90.3 78.6 89.6 30 ± 5
L Polisher 68.4 79.4 74.6 85.6 30 ± 5
Pneumatic tools J & L tested without & with feed force
60
70
80
90
100
J L
Tool
dB
(A)
LpA 15744 no FF LWA 15744 no FF LpA 15744 FF LWA 15744 FF
Figure 9. Results for pneumatic polishers tested under load
When tested under load, the results for Tool J remained largely unaffected. Tool L however
experienced an increase in both sound pressure and inherently the sound power levels.
4.3 TOOL K WITH AND WITHOUT ALL ACCESSORIES AND ATTACHMENTS
Tool K is a multiple application tool depending on which attachment is used. It has the option of
a side handle with guard and a large foam polishing pad. The measured emission as reported in
Section 3.2 was the noise emitted from the main body of the tool without the polishing pad and
side handle and guard attached. Table 6 shows the results obtained when the tool was tested

16
with its various attachments. It should be noted that the ‘no attachments’ condition was in full
conformance with EN 50144. The remaining three conditions had one test run each instead of
the standard three. (Note that Tool K is an electric tool and was therefore tested in a free-
running no load condition.)
Table 6. Results for Tool K under various conditions
Measured (lab) Attachment details
Measured LpA (dB) Measured LWA (dB)
No attachments 81.8 94.8
With polishing pad only 81.9 94.9
With handle & guard on LHS of tool only 82.1 95.1
With handle & guard on RHS of tool only 82.2 95.2
In the case of Tool K the addition of the polishing pad or handle and guard does not
significantly affect either the sound pressure or sound power levels. The standard deviation
across sound pressure and sound power levels for the four different free running conditions is
0.18dB (one test run). The standard deviation for the no attachments condition (measured
emission) is 0.04dB (three test runs).

17
5 REAL USE MEASUREMENTS
As part of the laboratory based emission tests, the sound pressure level at the operator’s ear was
either measured or calculated depending on the test code involved. An expansion to the original
aims of the project, this section reports the results of those measurements or calculations against
actual measurements made at operators’ ears during five site visits.
BS EN ISO 11202:1996 “Acoustics. Noise emitted by machinery and equipment. Measurement
of emission sound pressure levels at a workstation or other specified positions. Survey method
in situ” [12] was used as the test method for carrying out these measurements. The emission
sound pressure level, LpA, is given by:
AApApA KKLL 31' dB(A)
where:
L’pA is the A-weighted measured sound pressure level at the operator’s ear
K1A is the A-weighted correction for background noise
K3A is the A-weighted local environmental correction
K1A is calculated from:
L
AK 10
1 10110 .log dB(A)
where:
L is the difference between the sound pressure levels measured, at a specified position,
with the tool under test in operation and turned off, respectively
If L > 10 dB, K1A is assumed to equal 0; if L < 3 dB the measurement is invalid; if L
is between the two, the correction for background noise is applied.
K3A is calculated from:
A
SK A 41103 log dB(A)
where:
S is 2 a and a is the distance, in metres, from the specified position to the closest major
sound source of the tool
A is Sv; is the mean acoustic absorption coefficient of the test environment estimated
from table A.1 in Annex A of ISO 3746 [13]; Sv is the total area of the test environment
(walls, ceiling, floor), m2
Calculation of K3A has been shown to be less than 0.05 dB(A) for each of the five sites visited
and has therefore not been included (measurements on site were taken to one decimal place).
K1A has been applied where required according to the criteria given above.
At each site visited, a Brüel & Kjær type 2260 sound level meter was used to record a 30 second
linear average at the operator’s ear whilst a skilled operator sanded or polished a typical work
piece. This was done for all operators for each tool. In some cases only two operators, instead of
the preferred three, were available at a site due to restrictions on human resources. Whether two

18
or three operators were used, the logarithmic average of the measurements for each tool was
taken and this was retained as the L’pA for that tool at that site.
5.1 MEASUREMENT & RESULTS
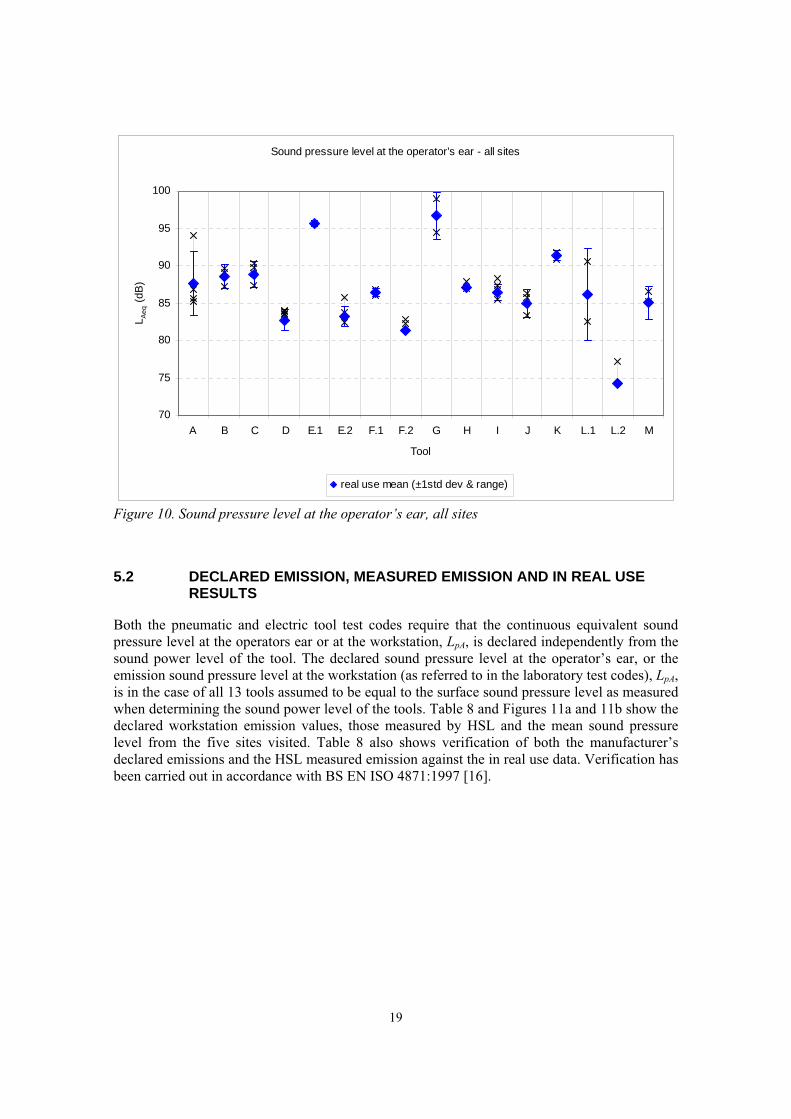
Table 7 and Figure 10 show the results from the five site visits. It should be noted that the
results for sites 2 and 3 have been combined to make one site as site 2 only had pneumatic
capability and site 3 had only electric capability. Full results from the field visit measurements
may be found in Appendix C.
Table 7. Sound pressure level at the operator’s ear; showing the L’pA, the value of the
background noise correction, K1A, the number of measurements made at each site for each tool
and the standard deviation across all sites
L’pA, sound pressure level at the operator’s ear (dB)
Site #1 Site #2 & #3 Site # 4 Site # 5 Tool
L’pA K1A No. L’pA K1A No. L’pA K1A No. L’pA K1A No.
Std
dev
A 85.6 1.2 3 85.7 0.0 3 85.2 0.0 3 94.0 0.0 3 4.27
B 86.2 1.0 3 89.6 0.0 2 89.1 0.0 3 89.1 0.0 3 1.58
C 86.3 1.0 3 89.7 0.0 3 89.0 0.0 3 90.3 0.0 3 1.77
D 80.7 2.9 3 82.7 0.7 3 83.5 0.5 3 83.9 0.0 3 1.43
E.1 - - - - - - - - - 95.7 0.0 3 n/a
E.2 84.1 1.6 3 83.8 0.0 3 81.6 0.8 3 - - - 1.37
F.1 - - - 86.0 0.0 3 - - - 86.7 0.0 3 0.52
F.2 n/a 3.9 3 - - - 81.4 0.8 3 - - - n/a
G 94.4 0.0 3 98.9 0.0 2 - - - - - - 3.18
H 87.1 0.8 3 87.0 0.0 2 - - - - - - 0.05
I 85.6 1.2 3 87.3 0.9 3 85.4 0.0 3 87.3 0.0 3 1.04
J 86.2 0.0 2 - - - 85.7 0.0 3 82.7 0.5 3 1.87
K 91.8 0.0 2 - - - - - - 90.9 0.0 3 0.66
L.1 90.5 0.0 2 - - - 81.9 0.7 3 - - - 6.12
L.2 - - - - - - - - - 74.3 2.9 3 n/a
M 83.5 1.7 3 86.6 0.0 2 - - - - - - 2.19
Reminder: E.1 and F.1 refer to the attachment of a hose and dust bag; E.2 and F.2 refer to the use of a
silenced exhaust; L.1 is the use of the tool without the hose sleeve over the airline and L.2 is with the hose
sleeve over the airline.
19
Sound pressure level at the operator's ear - all sites
70
75
80
85
90
95
100
A B C D E.1 E.2 F.1 F.2 G H I J K L.1 L.2 M
Tool
LA
eq (
dB
)
real use mean (±1std dev & range)
Figure 10. Sound pressure level at the operator’s ear, all sites
5.2 DECLARED EMISSION, MEASURED EMISSION AND IN REAL USE RESULTS
Both the pneumatic and electric tool test codes require that the continuous equivalent sound
pressure level at the operators ear or at the workstation, LpA, is declared independently from the
sound power level of the tool. The declared sound pressure level at the operator’s ear, or the
emission sound pressure level at the workstation (as referred to in the laboratory test codes), LpA,
is in the case of all 13 tools assumed to be equal to the surface sound pressure level as measured
when determining the sound power level of the tools. Table 8 and Figures 11a and 11b show the
declared workstation emission values, those measured by HSL and the mean sound pressure
level from the five sites visited. Table 8 also shows verification of both the manufacturer’s
declared emissions and the HSL measured emission against the in real use data. Verification has
been carried out in accordance with BS EN ISO 4871:1997 [16].

20
Table 8. Sound pressure levels at the operator’s ear: declared, laboratory, in real use
Declared
emission1
Measured
emission2
Real use emission
(sites mean)3 Verified
Tool
LpA KpA LpA KpA L’pA Std dev Real use to
declared
Real use to
measured
A 79 3* 81.7 3.0 87.6 4.27 No No
B 78 3* 83.6 3.0 88.5 1.58 No No
C 78 3* 82.9 3.0 88.8 1.77 No No
D 80 3* 74.1 3.0 82.7 1.43 Yes No
E.1 88.9 3.0 95.7 - No No
E.272+ 2*
77.7 3.0 83.2 1.37 No No
F.1 81.1 3.0 86.4 0.52 No No
F.282 3*
77.0 3.0 81.4 - Yes No
G 84.6 2* 87.4 2.0 96.7 3.18 No No
H - - 80.6 2.0 87.0 0.05 No No
I - - 79.6 3.0 86.4 1.04 No No
J 79 3* 79.3 3.0 84.9 1.87 No No
K - - 81.8 2.0 91.3 0.66 No No
L.1 74.7 3.0 86.2 6.12 No No
L.271 ± 3
68.4 3.0 74.3 - No No
M 73.4 2* 76.8 2.0 85.1 2.19 No No
Figure 11a shows that a strong relationship is apparent between the HSL measured emission and
the in real use emission data. The in real use data was on average 6.9 ± 2.0 dB(A) higher than
the HSL measured emission. The range was from 4.4 to 11.5 dB(A). This explains why,
although the relationship between the two data sets is strong, the measured emissions are not
verified against the in real use data. For the verification process, Lreal use Lmeasured + Kmeasured.
With the lower limit of the range at 4.4 dB(A), this is greater than the 3 dB(A) KpA so all
measured emissions will underestimate the in real use emission in this case.
The relationship between the declared emission and the in real use emission, shown in Figure
11b, is not as strong. The in real use data was on average 8.7 ± 6.3 dB(A) higher than the
declared emission. The range was from –0.6 to 23.7 dB(A). This explains why tools D and F.2
are verified; Lreal use Ldeclared + Kdeclared. In 14 out of 16 cases, the declared emission
underestimates the in real use data.
*These values have been estimated in accordance with the relevant method quoted and assume a K value
has not already been included in the declared emission. +This value has been estimated based on the declared LWA-13dB. It assumes a measurement surface area
of 20m2.1This value is an average of 5 measurements at 5 locations, 1m from the tool 2This value is an average of 5 measurements at 5 locations, 1m from the tool 3This value is an average measured at the operator’s ear.
Reminder: E.1 and F.1 refer to the attachment of a hose and dust bag; E.2 and F.2 refer to the use of a
silenced exhaust; L.1 is the use of the tool without the hose sleeve over the airline and L.2 is with the
hose sleeve over the airline.

21
Sound pressure level at the operator's ear - real use vs measured
70
75
80
85
90
95
70 80 90 100 110
L'pA
+ 1 std dev real use emission (dB)
Lp
A +
K m
ea
su
red
em
issio
n (
dB
)
Figure 11a. Sound pressure level at the operator’s ear – real use vs measured
Sound pressure level at the operator's ear - real use vs declared
70
75
80
85
90
95
70 80 90 100 110
L'pA
+ 1 std dev real use emission (dB)
Lp
A +
K d
ecla
red
em
issio
n (
dB
)
Figure 11b. Sound pressure level at the operator’s ear – real use vs declared
Figure 12 shows the real use L’pA emission results against the standard deviation of the
measurement. Displaying the data in this way highlights the grouping of the tools. The majority
of the tools lie between approximately 80dB and 90dB L’pA. Similar to Figure 7, tool L.2 is
identified as low noise while tools G and E.2 are identified as having higher real use emission

22
values. This confirms the strong relationship between the HSL measured emission and the real
use emission data.
0.00
1.00
2.00
3.00
4.00
5.00
6.00
7.00
70 75 80 85 90 95 100 105
L'pA real use emission (dB)
sta
nd
ard
de
via
tio
n (
dB
)
Figure 12. L’pA real use emission vs standard deviation
5.3 MEASUREMENT AT OPERATOR’S EAR: LABORATORY VS REAL USE
Further to Section 3.1.2.2 (Electric tools test codes, emission sound pressure levels), during
laboratory testing, additional measurements for the four electric tools were made at a distance of
0.65m above the geometric centre of the tool (1.65m above the reflecting plane). This distance
was chosen as representing the approximate location of the operator to the tool when using the
tool. The results for these measurements are shown in Table 9 and Figure 13 alongside the
declared and measured emissions, both of which are and average of 5 measurements at 5
locations, 1m from the tool, and the mean real use emission, measured at the operator’s ear.
Table 9. Additional LpA measurements for electric tools
Declared emission Measured
emission Real use emission
Measured
emission @ 0.65 m Tool
LpA KpA LpA KpA L’pA Std dev LpA Std dev
G 84.6 2* 87.4 2.0 96.7 3.18 91.5 0.55
H - - 80.6 2.0 87.0 0.05 83.5 0.32
K 81.8 2.0 91.3 0.66 83.6 0.00
M 73.4 2* 76.8 2.0 85.1 2.19 80.4 0.06
*These values have been estimated in accordance with the relevant method quoted and assume a K value
has not already been included in the declared emission.
L 2 E 1
G

23
70
75
80
85
90
95
100
G H K M
Tool
Lp
A (
dB
)
LpA declared (+K) LpA measured (+K) L'pA real use (±1std dev) LpA measured @ 0.65m (±1std dev)
Figure 13. Additional LpA measurements for electric tools
The trend indicates that measurement at the location of 0.65m above the geometric centre of the
tool is more representative of the operator’s exposure during real use compared with the
measured LpA. However, real use values are still underestimated by between 3.9dB and 8.9dB.

24
6 EMISSION VALUES AS AN INDICATOR OF RISK
As outlined in Section 1.1, manufacturers have a duty to declare airborne noise information
relating to their tools. The safety standards or test codes used to obtain such information instruct
manufacturers as to which information they must declare and how. In order that emission data
may be used in risk assessment, manufacturers need to adhere to these instructions, and those of
the Safety Regulations, and declare noise information in a consistent fashion. For example,
declaration of LpA for every tool will allow for verification of a low noise tool design and will
additionally enable purchasers and users of machinery to make informed choices regarding the
safety of a potential purchase. As has been demonstrated in Table 2, such consistency across all
tools is not always available.
The results from this study indicate that use of the manufacturer’s declared emissions in risk
assessment will allow the end user to identify low and high noise designs. However, as Figure
14 shows, the declared emission is not necessarily suitable for the estimation of exposure.
Figure 14 shows the difference between the real use emission (L’pA) and the declared emission
(LpA). Points below the value of 0 indicate where emission data over estimated field data. Points
above the value of 0 indicate where emission data under estimated field data.
-5
0
5
10
15
20
25
A B C D E.1 E.2 F.1 F.2 G H I J K L.1 L.2 M
Tool
Diffe
ren
ce
be
twe
en
re
al u
se
an
d d
ecla
red
em
issio
n a
+K
(dB
)
Figure 14. Difference between real use measurement and declared emission a+K (dB)
From Section 5.2, the real use measurement was shown to be on average 8.7 ± 6.3 dB(A) higher
than the declared emission, in the range of –0.6 to 23.7 dB(A) (tools F.2. and E.1. respectively).
Together with Figure 14, this shows that whilst the use of the manufacturer’s declared sound
pressure level as an indicator of exposure may not always be sufficient, it can indicate relative
risk between tools. This confirms the results in Table 8.

25
7 SUMMARY
Airborne noise emission data, required by the Supply of Machinery (Safety) Regulations 1992
[3] (SM(S)R) as amended, varied greatly between manufacturers and between different tools
supplied by the same manufacturer. While the regulations and related transposed standards for
the family of tools under consideration are clear about declaration requirements, the method of
declaration and the quality of data supplied is not always consistent or transparent, making it
difficult to compare machines.
Where the manufacturer had stated the test code used, this was also used for the laboratory
measurement. In the case of the electrically powered tools supplied, this meant using the
partially superseded EN 50144 series of standards [7] [8] [9]. In the case of the pneumatic tools,
historical development of the standard from the (CAGI-)PNEUROP trade association
publication [14] to the present BS EN ISO 15744 [5] international standard led to a lack of
clarity regarding inclusion or otherwise of an uncertainty value associated with the declared
emission.
Where declared sound pressure level (LpA) emission information was available, there was some
correlation between manufacturers’ declared emissions and the results from laboratory
measurement – emission data for 5 out of 13 tools were verified. Where declared sound power
level (LWA) information was available, an additional sixth tool was also verified. This anomaly
arose due to the differences in calculation of LWA for electric and pneumatic tools that require
the shape of the measurement surface to be taken into account. Although identical microphone
locations are used, a 2dB(A) difference in sound power level can be attributed to the calculation
of LWA alone and has nothing to do with the actual noise emission from the tool.
At the time of writing, the EN 50144 safety standard series had been partially superseded by the
EN 60745:2003 safety standard series [10] [11] (which mirrors the noise test code in ISO 15744
[5]), with a 2006 revision also due. It should be noted that comparison of LWA emission values
obtained from EN 50144 and ISO 15774 cannot be drawn on a like-for-like basis due to the
2dB(A) difference obtained through calculation. LpA values are unaffected.
A fundamental difference in the testing of pneumatic and electric powered tools is that the
electric tool tests are free running whereas the pneumatic tool tests are under load and require an
operator, a defined work piece and work pattern; pneumatic polishers are an exception as they
are tested free running. Testing the electric tools to the pneumatic standard, i.e. under load and
with an operator, revealed an overall decrease in noise emission from the tool. This is not
reflective of the noise emission in the workplace. If the declared emissions for electric tools are
to be used in risk assessment then the free running test is more appropriate. The loaded test for
pneumatic tools is also appropriate.
Standard tests have the potential to put tools in correct order of relative risk. This enables
purchasers and users of machinery to identify low noise designs and make informed choices
regarding the safety of a potential purchase from a broad range of tools. In practice, standard
test results are only acceptable for relative risk if there is consistency in how the emission data
are declared. The standard test results are not acceptable for identifying absolute risk.
Comparison of real use (field) measurement data with the manufacturers’ declared workstation
emission (where available) revealed differences in LpA values ranging from -0.6 to 23.7 dB(A).
This indicates that use of the declared LpA emission values in exposure assessment is likely to
underestimate the real use workstation emission level. Real use emission was on average 8.7 ±
6.3 dB(A) higher than the declared emission.

26
8
AP
PE
ND
IX A
– E
MIS
SIO
N T
ES
T R
ES
UL
TS
: S
UM
MA
RY
Dec
lare
dM
easu
red
In r
eal
use
T
oo
lT
yp
eA
ctio
nP
ow
erL
pA d
B
Kp
Ad
BL
WA d
BK
WA
dB
Sta
nd
ard
L
pA d
BK
pA
dB
LW
A d
BK
WA
dB
Sta
nd
ard
N
ote
s L
’ pA
dB
Std
Dev
A
san
der
ra
nd
om
orb
ital
pn
eum
atic
7
9
3*
-
- S
PL
@ 1
m P
N8
NT
C1
.2
81
.7
3.0
9
2.7
3
.0
BS
EN
IS
O
1574
4:2
002
H
ose
& b
ag8
7.6
4
.27
B
san
der
ra
nd
om
orb
ital
pn
eum
atic
7
8
3*
9
1
3*
S
PL
/SW
L @
1m
8
3.6
3
.0
94
.5
3.0
B
S E
N I
SO
1574
4:2
002
Sil
ence
d
exh
aust
8
8.5
1
.58
C
san
der
ra
nd
om
orb
ital
pn
eum
atic
7
8
3*
9
1
3*
S
PL
/SW
L @
1m
8
2.9
3
.0
93
.8
3.0
B
S E
N I
SO
1574
4:2
002
Sil
ence
d
exh
aust
8
8.8
1
.77
D
san
der
o
rbit
al
pn
eum
atic
8
0
3*
9
3
3*
S
PL
/SW
L @
1m
7
4.1
3
.0
85
.0
3.0
B
S E
N I
SO
1574
4:2
002
Sil
ence
d
exh
aust
8
2.7
1
.43
E.1
sa
nd
er
ran
do
m o
rbit
alp
neu
mat
ic
88
.9
3.0
9
9.9
3
.0
BS
EN
IS
O
1574
4:2
002
H
ose
& b
ag9
5.7
-
E.2
"
" "
72
+2
*
85
±
2
CA
GI-
PN
EU
RO
P I
SO
37
44
77
.7
3.0
8
8.7
3
.0
BS
EN
IS
O
1574
4:2
002
Sil
ence
d
exh
aust
8
3.2
1
.37
F.1
sa
nd
er
orb
ital
p
neu
mat
ic
81
.1
3.0
9
2.0
3
.0
BS
EN
IS
O
1574
4:2
002
H
ose
& b
ag8
6.4
0
.52
F.2
"
" "
82
3*
-
- E
N I
SO
15744
77
.0
3.0
8
7.9
3
.0
BS
EN
IS
O
1574
4:2
002
Sil
ence
d
exh
aust
8
1.4
-
G
san
der
ra
nd
om
orb
ital
elec
tric
8
4.6
2
*
97
.5
2*
B
S E
N I
SO
5014
4-2
-4:1
999
8
7.4
2
.0
10
0.4
2.0
B
S E
N 5
0144-
2-4
:200
0
Wit
h b
ag
96
.7
3.1
8
H
sander
orb
ital
el
ectr
ic
- -
- -
No d
ata
avai
lable
. 8
0.6
2
.0
93
.5
2.0
B
S E
N 5
0144-
2-4
:200
0
No
atta
chm
ents
87
.0
0.0
5
I sa
nd
er
ran
do
m o
rbit
alp
neu
mat
ic
- -
- -
80d
B(A
) g
iven
. U
nq
ual
ifie
d.
79
.6
3.0
9
0.6
3
.0
BS
EN
IS
O
1574
4:2
002
Sil
ence
d
exh
aust
8
6.4
1
.04
J p
oli
sher
ran
do
m o
rbit
alp
neu
mat
ic
79
3
*
92
3
*
SP
L/S
WL
@ 1
m
79
.3
3.0
9
0.3
3
.0
BS
EN
IS
O
1574
4:2
002
Sil
ence
d
exh
aust
8
4.9
1
.87
K
po
lish
er
ang
le
elec
tric
-
- -
- 8
8.7
dB
& E
N 5
01
44
giv
en.
Unqual
ifie
d.
81
.8
2.0
9
4.8
2
.0
BS
EN
50144-
2-3
:200
2
No
atta
chm
ents
91
.3
0.6
6
L.1
p
oli
sher
an
gle
p
neu
mat
ic
74
.7
3.0
8
5.7
3
.0
BS
EN
IS
O
1574
4:2
002
No
ho
se
slee
ve
86
.2
6.1
2
L.2
"
" "
71
± 3
-
- P
N8
NT
C1
.2
68
.4
3.0
7
9.4
3
.0
BS
EN
IS
O
1574
4:2
002
Wit
h h
ose
slee
ve
74
.3
-
M
sander
orb
ital
el
ectr
ic
73
.4
2*
-
- E
N 5
0144
76
.8
2.0
8
9.8
2
.0
BS
EN
50144-
2-4
:200
0
Wit
hou
t b
ag8
5.1
2
.19
*T
hes
e v
alu
es h
ave
bee
n e
stim
ated
in
acc
ord
ance
wit
h t
he
rele
van
t m
eth
od
qu
ote
d a
nd
ass
um
e a
K v
alu
e h
as n
ot
alre
ady
bee
n i
ncl
ud
ed i
n t
he
dec
lare
d e
mis
sio
n.
+T
his
val
ue
has
bee
n e
stim
ated
bas
ed o
n t
he
dec
lare
d L
WA-1
3d
B.
It a
ssu
mes
a m
easu
rem
ent
surf
ace
area
of
20
m2.

27
9 APPENDIX B – EMISSION TEST RESULTS: DETAIL
Tool A
LWA LpA LCpk(max)
1st run 93.0 82.0 85.7
2nd run 92.4 81.4 85.7
3rd run 92.8 81.8 85.6
92.7 81.7 85.7
surface SPL
30
40
50
60
70
80
90
50 80 125 200 315 500 800 1250 2000 3150 5000 8000
1/3OBCF (Hz)
SP
L (
dB
)
op#1 op#2 op#3

28
Tool B
LWA LpA LCpk(max)
1st run 94.1 83.1 86.2
2nd run 94.5 83.5 85.7
3rd run 95.0 84.0 88.3
94.5 83.6 88.3
surface SPL
30
40
50
60
70
80
90
50 80 125 200 315 500 800 1250 2000 3150 5000 8000
1/3OBCF (Hz)
SP
L (
dB
)
op#1 op#2 op#3

29
Tool C
LWA LpA LCpk(max)
1st run 93.5 82.5 86.6
2nd run 93.9 82.9 87.8
3rd run 94.1 83.1 87.5
93.8 82.9 87.8
surface SPL
30
40
50
60
70
80
90
50 80 125 200 315 500 800 1250 2000 3150 5000 8000
1/3OBCF (Hz)
SP
L (
dB
)
op#1 op#2 op#3

30
Tool D
LWA LpA LCpk(max)
1st run 84.2 73.2 75.9
2nd run 85.3 74.3 76.7
3rd run 85.5 74.5 78.0
85.0 74.1 78.0
surface SPL
30
40
50
60
70
80
90
50 80 125 200 315 500 800 1250 2000 3150 5000 8000
1/3OBCF (Hz)
SP
L (
dB
)
op#1 op#2 op#3

31
Tool E.1
LWA LpA LCpk(max)
1st run 99.4 88.4 91.4
2nd run 100.5 89.5 92.2
3rd run 99.9 88.9 93.1
99.9 88.9 93.1
surface SPL
30
40
50
60
70
80
90
50 80 125 200 315 500 800 1250 2000 3150 5000 8000
1/3OBCF (Hz)
SP
L (
dB
)
op#1 op#2 op#3

32
Tool E.2
LWA LpA LCpk(max)
1st run 88.3 77.3 79.9
2nd run 88.8 77.8 80.8
3rd run 89.0 78.0 82.2
88.7 77.7 82.2
surface SPL
30
40
50
60
70
80
90
50 80 125 200 315 500 800 1250 2000 3150 5000 8000
1/3OBCF (Hz)
SP
L (
dB
)
op#1 op#2 op#3

33
Tool F.1
LWA LpA LCpk(max)
1st run 92.7 81.7 85.2
2nd run 91.0 80.0 83.6
3rd run 92.2 81.2 86.4
92.0 81.1 86.4
surface SPL
30
40
50
60
70
80
90
50 80 125 200 315 500 800 1250 2000 3150 5000 8000
1/3OBCF (Hz)
SP
L (
dB
)
op#1 op#2 op#3

34
Tool F.2
LWA LpA LCpk(max)
1st run 89.3 78.3 81.0
2nd run 87.1 76.1 78.4
3rd run 87.3 76.3 78.9
87.9 77.0 81.0
surface SPL
30
40
50
60
70
80
90
50 80 125 200 315 500 800 1250 2000 3150 5000 8000
1/3OBCF (Hz)
SP
L (
dB
)
op#1 op#2 op#3

35
Tool G
LAeq
1st run 2nd run 3rd run
mic pos 1 84.5 85.3 85.9
mic pos 2 87.8 88.5 88.5
mic pos 3 87.2 87.4 87.6
mic pos 4 85.5 85.7 86.2
mic pos 5 88.4 89.1 89.7
oper.ear 91.2 91.1 92.1
Lp 86.9 87.5 87.8
bkg check valid valid valid
LW 99.9 100.5 100.8
LAeq bkg 17.3 dB(A)
LAeq tool 87.4 dB(A)
LAeq operator ear 91.5 dB(A)
LCpk(max) 102.3 dB(C)
LWA 100 dB(A)
surface SPL
30
40
50
60
70
80
90
50 80 125 200 315 500 800 1250 2000 3150 5000 8000
1/3OBCF (Hz)
SP
L (
dB
)
1st run 2nd run 3rd run
LCpk(max)
97.2 97.5 98.0
99.4 99.0 99.2
99.1 98.9 98.7
96.4 97.1 97.7
98.2 98.5 98.3
100.6 101.1 102.3

36
Tool H
LAeq
1st run 2nd run 3rd run
mic pos 1 83 80.4 80.5
mic pos 2 83.3 79.1 79.4
mic pos 3 80.3 79.9 80.0
mic pos 4 80.6 80.9 80.9
mic pos 5 79.2 79.1 79.3
oper.ear 83.9 83.4 83.3
Lp 81.6 79.9 80.1
bkg check valid valid valid
LW 94.6 92.9 93.1
LAeq bkg 17.6 dB(A)
LAeq tool 80.6 dB(A)
LAeq operator ear 83.5 dB(A)
LCpk(max) 96.4 dB(C)
LWA 94 dB(A)
surface SPL
30
40
50
60
70
80
90
50 80 125 200 315 500 800 1250 2000 3150 5000 8000
1/3OBCF (Hz)
SP
L (
dB
)
1st run 2nd run 3rd run
LCpk(max)
93.5 93.4 93.5
93.2 93.4 93.0
93.5 93.0 93.6
94.5 94.6 95.0
92.5 92.4 91.9
96.4 96.3 96.0

37
Tool I
LWA LpA LCpk(max)
1st run 89.9 78.9 82.2
2nd run 90.6 79.6 83.4
3rd run 91.3 80.3 84.1
90.6 79.6 84.1
surface SPL
30
40
50
60
70
80
90
50 80 125 200 315 500 800 1250 2000 3150 5000 8000
1/3OBCF (Hz)
SP
L (
dB
)
op#1 op#2 op#3

38
Tool J
LWA LpA LCpk(max)
1st run 90.3 79.3 89.7
2nd run 90.3 79.3 90.2
3rd run 90.3 79.3 90.5
90.3 79.3 90.5
surface SPL
30
40
50
60
70
80
90
50 80 125 200 315 500 800 1250 2000 3150 5000 8000
1/3OBCF (Hz)
SP
L (
dB
)
op#1 op#2 op#3

39
Tool K
LAeq
1st run 2nd run 3rd run
mic pos 1 81.0 80.9 81.0
mic pos 2 81.2 81.2 81.2
mic pos 3 82.7 82.7 82.6
mic pos 4 83.4 83.6 83.4
mic pos 5 79.8 79.9 79.9
oper.ear 83.6 83.6 83.6
Lp 81.8 81.9 81.8
bkg check valid valid valid
LW 94.8 94.9 94.8
LAeq bkg 17.9 dB(A)
LAeq tool 81.8 dB(A)
LAeq operator ear 83.6 dB(A)
LCpk(max) 97.2 dB(C)
LWA 95 dB(A)
surface SPL
30
40
50
60
70
80
90
50 80 125 200 315 500 800 1250 2000 3150 5000 8000
1/3OBCF (Hz)
SP
L (
dB
)
1st run 2nd run 3rd run
LCpk(max)
94.2 93.9 94.4
94.1 94.7 94.4
95.3 95.3 94.9
95.7 96.2 96.4
93.1 93.3 94.5
96.8 96.7 97.2

40
Tool L.1
LWA LpA LCpk(max)
1st run 86.0 75.0 76.7
2nd run 85.7 74.7 76.7
3rd run 85.5 74.5 75.8
85.7 74.7 76.7
surface SPL
30
40
50
60
70
80
90
50 80 125 200 315 500 800 1250 2000 3150 5000 8000
1/3OBCF (Hz)
SP
L (
dB
)
op#1 op#2 op#3

41
Tool L.2
LWA LpA LCpk(max)
1st run 79.4 68.4 69.8
2nd run 79.4 68.4 69.9
3rd run 79.5 68.5 70.1
79.4 68.4 70.1
surface SPL
30
40
50
60
70
80
90
50 80 125 200 315 500 800 1250 2000 3150 5000 8000
1/3OBCF (Hz)
SP
L (
dB
)
op#1 op#2 op#3

42
Tool M
LAeq
1st run 2nd run 3rd run
mic pos 1 74.1 75.5 75.6
mic pos 2 75.6 76.5 76.5
mic pos 3 77.6 78.0 78.3
mic pos 4 76.4 77.0 77.3
mic pos 5 77.1 77.2 77.4
oper.ear 80.5 80.4 80.4
Lp 76.3 76.9 77.1
bkg check valid valid valid
LW 89.3 89.9 90.1
LAeq bkg 19 dB(A)
LAeq tool 76.8 dB(A)
LAeq operator ear 80.4 dB(A)
LCpk(max) 93.2 dB(C)
LWA 90 dB(A)
surface SPL
30
40
50
60
70
80
90
50 80 125 200 315 500 800 1250 2000 3150 5000 8000
1/3OBCF (Hz)
SP
L (
dB
)
1st run 2nd run 3rd run
LCpk(max)
89.5 91.8 91.3
89.0 90.1 91.0
90.7 92.5 91.7
91.9 92.4 92.2
89.4 89.5 89.5
93.1 92.9 93.2

43
10 APPENDIX C – LPA AT OPERATOR’S EAR: DETAIL
Site #1
Tool OP#1 OP#2 OP#3 OP#5 OP#6 L Aeq op ear L Aeq bkg exceeds bkg by notes
dB(A) dB(A) dB(A) dB(A) dB(A) dB(A) dB(A) dB(A)
A 87.8 85.6 86.7 - - 86.8 80.5 6.3
B 87.3 87.3 86.9 - - 87.2 80.5 6.7
C 88.2 86.5 86.9 - - 87.3 80.5 6.8
D 84.2 83.9 82.4 - - 83.6 80.5 3.1
E 85.0 87.2 84.3 - - 85.7 80.5 5.2 silenced exhaust
F 83.4 80.5 83.7 - - 82.8 80.5 2.3 silenced exhaust
G 94.6 97.0 85.3 - - 94.4 80.3 14.1
H 85.2 87.3 89.9 - - 87.9 80.3 7.6
I 85.9 87.2 87.1 - - 86.8 80.5 6.3
J - - - 86.0 86.3 86.2 75.4 10.8
K - - - 92.9 90.2 91.8 75.4 16.4
L - - - 91.5 89.3 90.5 75.4 15.1 without sleeve
M 85.4 84.7 85.4 - - 85.2 80.3 4.9
Site #2
Tool OP#1 OP#2 OP#3 OP#1b OP#2b L Aeq op ear L Aeq bkg exceeds bkg by notes
dB(A) dB(A) dB(A) dB(A) dB(A) dB(A) dB(A) dB(A)
A 86.5 85.8 84.4 85.7 67.2 18.5
B 89.3 89.9 89.6 75.2 14.4
C 91.1 88.2 89.3 89.7 75.2 14.5 not connected to vac
D 84.1 81.9 84.0 83.4 75.2 8.2 close to carriage
E 84.7 82.6 83.8 83.8 67.2 16.6 bkg lower - no spray booth & no extraction
F 86.7 85.6 85.5 86.0 67.2 18.8
G 0.0 0.0
H 0.0 0.0
I 88.0 89.7 86.3 88.2 81 7.2 bkg with extract on
J 0.0 0.0
K 0.0 0.0
L 0.0 0.0
M 0.0 0.0
Site #3
Tool OP#1 OP#2 OP#3 OP#1b OP#2b L Aeq op ear L Aeq bkg exceeds bkg by notes
dB(A) dB(A) dB(A) dB(A) dB(A) dB(A) dB(A) dB(A)
A 0.0 0.0
B 0.0 0.0
C 0.0 0.0
D 0.0 0.0
E 0.0 0.0
F 0.0 0.0
G 101.4 99.8 98.9 40.3 58.6 180 grit
H 89.7 87.5 87.0 40.3 46.7 240 grit (no holes)
I 0.0 0.0
J 0.0 0.0
K 0.0 0.0
L 0.0 0.0
M 88.6 88.1 86.6 40.3 46.3 320 grit

44
Site #4
Tool OP#1 OP#2 OP#3 OP#1b OP#2b L Aeq op ear L Aeq bkg exceeds bkg by notes
dB(A) dB(A) dB(A) dB(A) dB(A) dB(A) dB(A) dB(A)
A 85.1 86.2 84.1 85.2 74.6 10.6 320 vac (running slow)
B 88.9 90.5 87.2 89.1 74.6 14.5 320 silenced
C 90.0 89.7 86.7 89.0 74.6 14.4 320 silenced & vac
D 86.3 83.9 79.3 84.0 74.6 9.4 320 silenced
E 80.4 84.0 81.9 82.4 74.6 7.8 320 silenced
F 82.7 82.6 81.2 82.2 74.6 7.6 180 silenced
G 0.0 0.0
H 0.0 0.0
I 85.3 86.0 84.9 85.4 74.6 10.8 400 silenced
J 88.5 84.4 81.3 85.7 74.6 11.1
K 0.0 0.0 our foam pad - not really suitable for task
L 83.1 82.4 82.3 82.6 74.6 8.0 lambswool bonnet
M 0.0 0.0
Site #5
Tool OP#1 OP#2 OP#3 L Aeq op ear L Aeq bkg exceeds bkg by notes
dB(A) dB(A) dB(A) dB(A) dB(A) dB(A)
A 95.3 93.7 92.7 94.0 72.6 21.4 OP1 & 2 @ 80 grit. OP3 @ 320 grit.
B 90.6 88.0 88.3 89.1 72.6 16.5 OP1 & 2 @ 120 grit. OP3 @ 320 grit.
C 88.7 91.3 90.5 90.3 72.6 17.7 OP1 & 2 @ 120 grit. OP3 @ 320 grit.
D 85.4 83.6 82.0 83.9 72.6 11.3 OP1 & 2 @ 80 grit. OP3 @ 320 grit.
E.1 94.1 94.9 97.3 95.7 72.6 23.1 OP1 & 2 @ 120 grit. OP3 @ 320 grit. Hose & bag!!!
E.2
F.1 87.5 85.0 87.3 86.7 72.6 14.1 All OP's @ 180 grit. Hose & bag!!!
F.2
G
H
I 88.2 87.0 86.7 87.3 72.6 14.7 OP1 & 2 @ 80 grit. OP3 @ 180 grit.
J 83.9 83.1 82.8 83.3 74 9.3 Our pad. Their liquid.
K 93.5 86.0 90.1 90.9 74 16.9 Our pad. Their liquid.
L.1
L.2 78.3 76.3 76.6 77.2 74 3.2 New compounding pad with G3 advanced liquid compound.
M
45
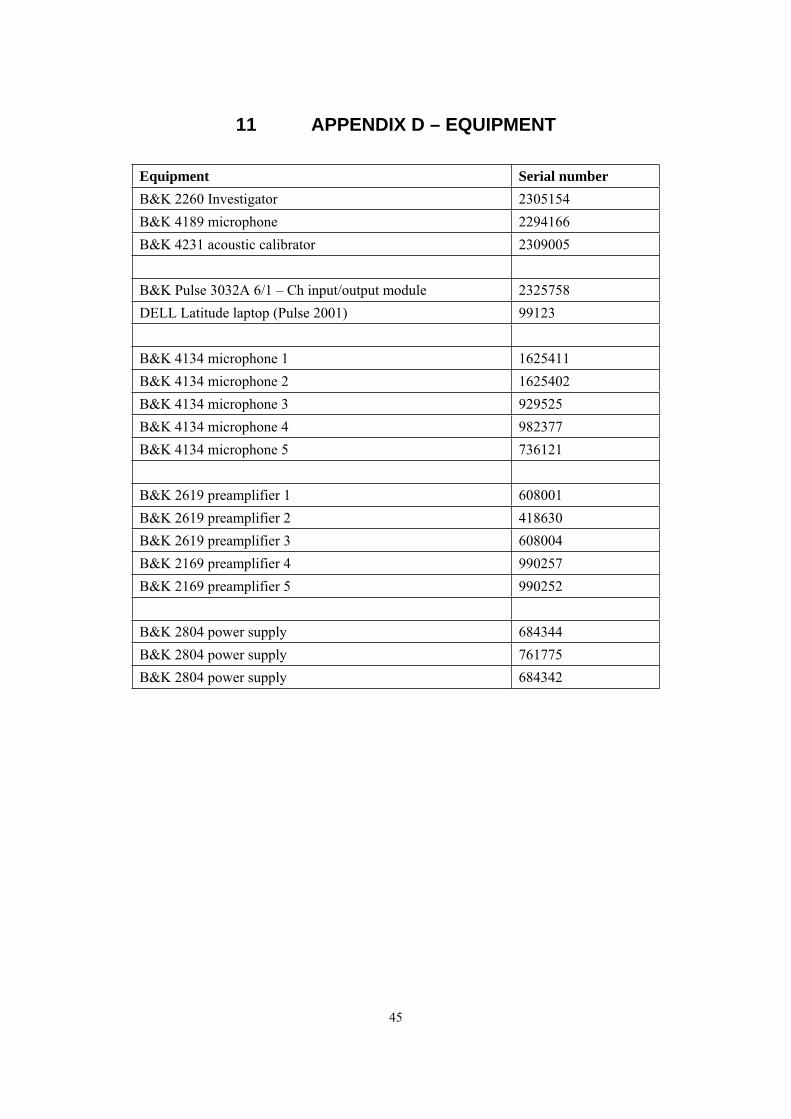
11 APPENDIX D – EQUIPMENT
Equipment Serial number
B&K 2260 Investigator 2305154
B&K 4189 microphone 2294166
B&K 4231 acoustic calibrator 2309005
B&K Pulse 3032A 6/1 – Ch input/output module 2325758
DELL Latitude laptop (Pulse 2001) 99123
B&K 4134 microphone 1 1625411
B&K 4134 microphone 2 1625402
B&K 4134 microphone 3 929525
B&K 4134 microphone 4 982377
B&K 4134 microphone 5 736121
B&K 2619 preamplifier 1 608001
B&K 2619 preamplifier 2 418630
B&K 2619 preamplifier 3 608004
B&K 2169 preamplifier 4 990257
B&K 2169 preamplifier 5 990252
B&K 2804 power supply 684344
B&K 2804 power supply 761775
B&K 2804 power supply 684342

46
12 REFERENCES
[1] Control of Noise at Work Regulations 2005
Statutory Instrument 2005 No. 1643
[2] EU Physical Agents (Noise) Directive (2003/10/EC)
[3] The Supply of Machinery (Safety) Regulations 1992 (as amended)
Statutory Instrument 1992 No. 3073
[4] BS EN ISO 3744:1995
Acoustics. Determination of sound power levels of noise sources using sound pressure.
Engineering method in an essentially free field over a reflecting plane.
(confirmed, current)
[5] BS EN ISO 15744:2002
Hand-held non-electric power tools. Noise measurement code. Engineering method
(grade 2)
(current)
[6] BS EN ISO 11203:1996
Acoustics. Noise emitted by machinery and equipment. Determination of emission sound
pressure levels at a work station and at other specified positions from the sound power
level
(confirmed, current)
[7] BS EN 50144-1:1996
Safety of hand-held electric motor operated tools. Part 1: General requirements
(current, revised, work in hand)
[8] BS EN 50144-2-3:2002
Safety of hand-held electric motor operated tools. Part 2-3: Particular requirements for
grinders, disk type sanders and polishers
(current)
[9] BS EN 50144-2-4:2000
Safety of hand-held electric motor operated tools. Part 2-4: Particular requirements for
sanders
(superseded, withdrawn)
[10] BS EN 60745-1:2003
Hand-held motor-operated electric tools. Safety. Part 1: General requirements
(current, work in hand)
[11] BS EN 60745-2-4:2003
Hand-held motor-operated electric tools. Safety. Part 2-4: Particular requirements for
sanders and polishers other than disk type
(current, work in hand)
[12] BS EN ISO 11202:1996
Acoustics. Noise emitted by machinery and equipment. Measurement of emission sound
pressure levels at a workstation or other specified positions. Survey method in situ
(confirmed, current)

47
[13] BS EN ISO 3746:1996
Acoustics. Determination of sound power levels of noise sources using sound pressure.
Survey method using an enveloping measurement surface over a reflecting plane
(confirmed, current, work in hand)
[14] PN8NTC1.2
Noise test code for measurement of noise from hand-held non-electric power tools 14.00
Pneurop
[15] BS EN 792-8:2001
Hand-held non-electric power tools. Safety requirements. Part 8: Sanders and polishers
[16] BS EN ISO 4871:1997
Acoustics. Declaration and verification of noise emission values of machinery and
equipment
[17] NV/06/18
Correlation between vibration emission and vibration during real use - Polishers and
sanders