Embed Size (px)
Citation preview

PROGRESSIVE COLLAPSE ANALYSIS OF AN EXISTING BUILDING
Halil Sezen (PI) and Kevin A. Giriunas (student researcher)
○○○○○○
The Ohio State University
May 2009
2
ABSTRACT
This research study investigates an actual structure’s potential to fail due to
progressive collapse. Progressive collapse in a structure occurs when major structural
load carrying members are removed suddenly, and the remaining structural elements
cannot support the weight of the building and fail. This failure usually occurs in a domino
effect and leads to a progressive collapse failure in the structure. The bombing of the
Murray Federal Building in Oklahoma City is a typical example of progressive collapse
failure. The initial bomb blast caused only 10% of the structure’s damage, and the
resulting progressive collapse failure lead to 90% of the structure’s damage.
This experiment involved testing of a steel building scheduled for demolition in
Northbrook, Illinois. The demolition team tore out four selected columns from the
building to simulate the sudden column removal that leads to progressive collapse. The
structure was instrumented with strain gauges that recorded the change in strain in
various structural members while the columns were removed. The author instrumented
the beams and columns in the building, managed the testing, and analyzed the recorded
data.
The strain values recorded in the field were compared with the results from a
computer model of the building. The model was created in a structural analysis program
(SAP2000). The research is still underway, and the strain values recorded in the field and

3
the computer model are being compared and analyzed. The percent error between the
calculated and measured strains in a selected column was 21%.
The SAP2000 analysis conducted in this research was based on linear material
properties. The numerical models and simulations will be expanded to include nonlinear
effects and dynamic analysis. The ultimate goal of this ongoing progressive collapse
research on real buildings is to develop better building evaluation and design guidelines
for structural engineers to use to prevent progressive collapse in new and existing
buildings. Future progressive collapse research recommendations are also presented. The
instrumentation of strain gauges for optimum results is discussed, and column removal
guidelines and linear displacement sensor instrumentation are also shown.
4
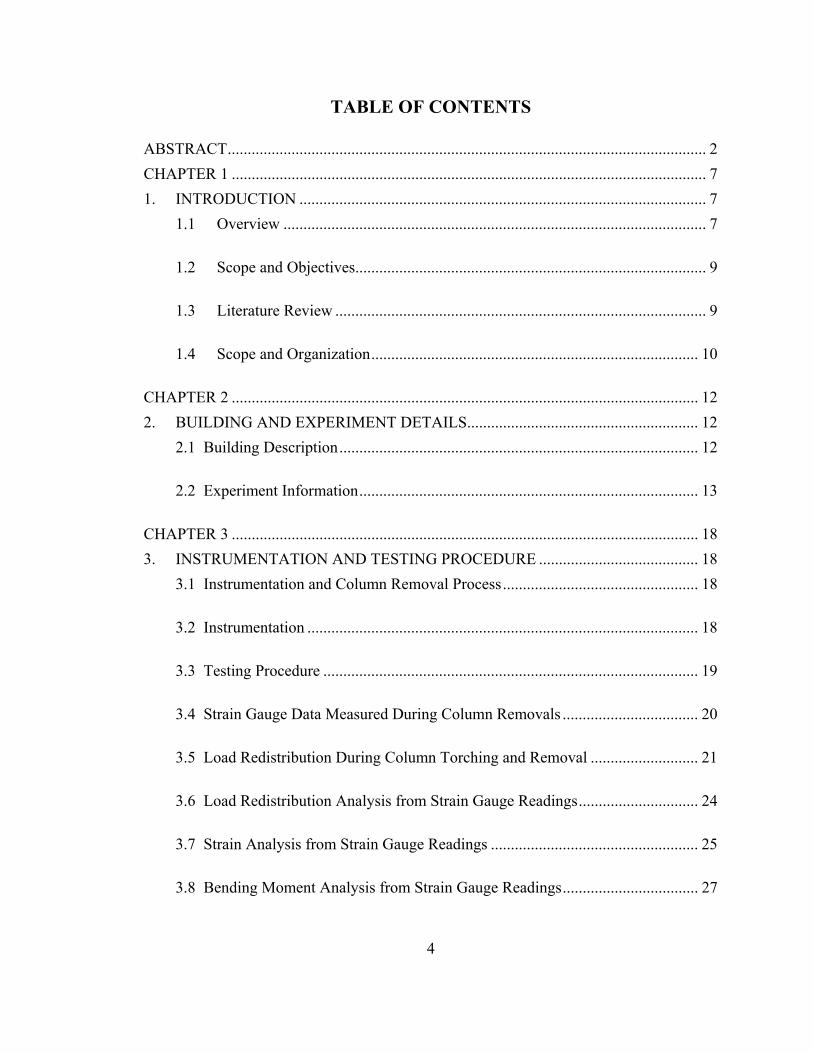
TABLE OF CONTENTS ABSTRACT ........................................................................................................................ 2
CHAPTER 1 ....................................................................................................................... 7
1. INTRODUCTION ...................................................................................................... 7
1.1 Overview .......................................................................................................... 7
1.2 Scope and Objectives........................................................................................ 9
1.3 Literature Review ............................................................................................. 9
1.4 Scope and Organization .................................................................................. 10
CHAPTER 2 ..................................................................................................................... 12
2. BUILDING AND EXPERIMENT DETAILS .......................................................... 12
2.1 Building Description .......................................................................................... 12
2.2 Experiment Information ..................................................................................... 13
CHAPTER 3 ..................................................................................................................... 18
3. INSTRUMENTATION AND TESTING PROCEDURE ........................................ 18
3.1 Instrumentation and Column Removal Process ................................................. 18
3.2 Instrumentation .................................................................................................. 18
3.3 Testing Procedure .............................................................................................. 19
3.4 Strain Gauge Data Measured During Column Removals .................................. 20
3.5 Load Redistribution During Column Torching and Removal ........................... 21
3.6 Load Redistribution Analysis from Strain Gauge Readings .............................. 24
3.7 Strain Analysis from Strain Gauge Readings .................................................... 25
3.8 Bending Moment Analysis from Strain Gauge Readings .................................. 27

5
3.9 Strain Relationship between Torching and Removal Phases ............................. 28
CHAPTER 4 ..................................................................................................................... 39
4. GSA GUIDELINES FOR PROGRESSIVE COLLAPSE ........................................ 39
4.1 Introduction ........................................................................................................ 39
4.2 General GSA (2003) Guidelines ........................................................................ 39
4.3 GSA Guidelines Used for Experiment ............................................................... 41
CHAPTER 5 ..................................................................................................................... 44
5. SAP2000 ANALYSIS .............................................................................................. 44
5.1 SAP2000 Analysis Introduction ..................................................................... 44
5.2 SAP2000 Information, Assumptions, and Loading Conditions ..................... 44
5.3 SAP2000 DCR Computer Simulation ............................................................ 45
5.4 SAP2000 Analysis ε Clarifications ................................................................ 47
5.5 SAP2000 Analysis Comparison with Recorded Data .................................... 47
CHAPTER 6 ..................................................................................................................... 54
6. GENERAL GUIDELINES FOR INSTRUMENTATION AND COLUMN REMOVAL PROCEDURE .............................................................................................. 54
6.1 Introduction ........................................................................................................ 54
6.2 Strain Gauge Theory .......................................................................................... 54
6.3 Strain Gauge Instrumentation Theory on Columns ........................................ 55
6.4 Strain Gauge Theory on Beams ...................................................................... 57
6.5 Strain Gauge Locations for Columns and Beams ........................................... 58
6.6 Linear Displacement Sensor Instrumentation and Placement ........................ 61
6.7 Column Removal Guidelines.......................................................................... 62

6
CHAPTER 7 ..................................................................................................................... 71
7. SUMMARY AND CONCLUSION ......................................................................... 71
7.1 Summary ............................................................................................................ 71
7.2 Conclusion ......................................................................................................... 71
APPENDIX A ................................................................................................................... 73
A. STRUCTURAL NOTES AND BUILDING PLANS ............................................... 73
APPENDIX B ................................................................................................................... 81
B. STRAIN GAUGE CHARTS AND LOAD DISTRIBUTION VALUES DURING COLUMN REMOVAL .................................................................................................... 81
LIST OF REFERENCES .................................................................................................. 87

7
CHAPTER 1
1. INTRODUCTION
1.1 Overview
The progressive collapse of building structures is initiated when one or more
vertical load carrying members (typically columns) is removed. Once a column is
removed due to a vehicle impact, fire, earthquake, or other man-made or natural hazards,
the building’s weight (gravity load) transfers to neighboring columns in the structure. If
these columns are not properly designed to resist and redistribute the additional gravity
load, that part of the structure fails. The vertical load carrying elements of the structure
continue to fail until the additional loading is stabilized. As a result, a substantial part of
the structure may collapse, causing greater damage to the structure than the initial impact.
This research begins with the evaluation of the General Services Administration
(GSA) Progressive Collapse Analysis and Design Guidelines (2003). The GSA
guidelines provide general formulas and conditions that determine what members of a
structure are susceptible to progressive collapse. Specifically, the demand-capacity-ratio
(DCR) is used by the GSA guidelines to determine if individual members will fail leading
to progressive collapse. This research analyzes and investigates the progressive collapse
of an existing building using the 2003 GSA guidelines. The structure was a three story
building located in Northbrook, Illinois. Built in 1968, the structure had reinforced
concrete (RC) members in the basement, concrete slabs for the flooring, and was
composed of steel framing on the first and second floors. The sixth edition of the AISC

8
Steel Construction Manual (1963) was used to design the structure, and the building was
scheduled for demolition in early August, 2008.
Following a predetermined testing procedure (developed following the GSA
guidelines), the demolition team removed four columns from the existing structure. In
order to measure the strains in various columns and beams, the structure was
instrumented with strain gauges prior to the column removals. As each column was
removed, the strain gauges captured the data that is later analyzed and compared with the
analysis results from the computer program SAP2000 (2008).
The Structural Analysis Program (SAP2000) is a powerful computer program
used to design and analyze various structures. The program analyzes two dimensional
linear static models to three dimensional nonlinear dynamic models. This study involves
linear elastic static analysis of the structure. The data obtained from the strain gauges on
the actual structure during the demolition is then compared to the analysis results of the
linear static model in SAP2000.
The strain measured from the strain gauges in the field is used to understand the
response of the structure during and after column removals. The load distributions,
change in strains, and bending moments generated from each column removal are
calculated from the measured strain values collected in the field. The load distributions,
change in strains, and bending moments generated from each column removal are also
calculated and compared in the SAP2000 computer simulation. This research study
analyzes the data collected in the field and compares it to the SAP2000 simulation results
to verify the GSA guidelines.

9
1.2 Scope and Objectives
The focus of this research is to determine if a structure is susceptible to
progressive collapse. The recorded strain values are analyzed, and compared with the
results from SAP2000 computer model of the building. The accuracy of the measured
strains and SAP2000 analysis is also discussed. Using SAP2000, the structure’s potential
for progressive collapse was determined. The theory and instrumentation of strain gauges
and sensors is discussed. Guidelines for column removal in future experiments of existing
buildings are developed.
The objectives of this experiment are:
Describe the progressive collapse experiment conducted
Analyze the strain values recorded by the strain gauges in the field
Determine the Demand-Capacity Ratios (DCR) using SAP2000
Compare the recorded strains with the strains obtained from SAP2000 analysis
Discuss instrumentation plans for most beneficial results
Discuss guidelines for column removals in future tests
1.3 Literature Review
This experiment was influenced by two previously published research studies.
Sasani and Sagiroglu (2007) reported experimental and analytical data from the testing of
a building located in San Diego, California. Their research studied the progressive
collapse potential of Hotel San Diego. The Hotel San Diego building was instrumented

10
with similar strain gauges to measure the strain as two of the exterior columns were
removed. The research conducted by Sasani and Sagiroglu (2007) gave valuable insight
on how a structure would respond when faced with abnormal conditions. This research
study also discussed the GSA (2003) guidelines, but did not calculate the DCR values for
each member. The data recorded was purely field data, lacking a computer model
simulation.
Another influential research study was conducted by Sezen and Song (2008) to
test the progressive collapse potential of the Ohio State Union scheduled for demolition
in 2007. Sezen and Song (2008) followed the GSA (2003) guidelines and calculated the
DCR values as four exterior columns were removed from the structure. The computer
program SAP2000 was used in the study to generate a computer model simulation of the
Ohio State Union. Their research compared the predicted and calculated building
responses using the GSA (2003) as a guideline.
1.4 Scope and Organization
The research thesis begins with an introduction discussing related progressive
collapse analysis literature. Chapter 2 provides the detailed building description and
geometry of the structure. Chapter 3 addresses the instrumentation details and the testing
procedure for column torching and removal, showing the data collected from the strain
gauges as each column is torched and removed. Chapter 3 also analyzes the load
distributions, change in strain, and change in the bending moment. Chapter 4 discusses
the GSA guidelines for progressive collapse as they pertain to the data collected. Chapter

11
5 examines the SAP2000 analysis to determine the actual DCR values of the members.
Chapter 6 develops a general guideline to advise the placement of sensors in order to
obtain the most beneficial data measurements for future experiments. Finally, Chapter 7
provides the summary and conclusions for the research.

12
CHAPTER 2
2. BUILDING AND EXPERIMENT DETAILS
2.1 Building Description
The Bankers Life and Casualty Company insurance building, located in
Northbrook, IL, was constructed in 1968 following the 6th edition of AISC Steel
Construction Manual (1967) design code. The building had nine bays spanning 27 ft wide
in the longitudinal direction, and 8 bays spanning 23 ft-6 in. in the transverse direction as
shown in Figure 2.1. The basement and first story are 10 ft-6 in. and 20 ft-6 in. in height,
as shown in Figure 2.2. The heights of the lower and high points of the second story are
14 ft-8 in. and 15 ft-2 in., respectively. Figure 2.3 shows the beam and column
designation for the structure.
A large loading dock bay area is located at the far Northwest corner of the
structure. In addition, a mezzanine level exists between the first and second floors at the
Southeast and Southwest end of the structure. For this research, the docking bay and
mezzanine level were not considered, because neither would affect the experiment. Also,
the plans available do not include a recent addition of two stairwells at the south end of
the building. This addition does not have any effect this study. Figures A.1 through A.9
in Appendix A contain the original structural drawings and design notes for the building.
The columns in the basement are reinforced concrete (RC) with a compressive
strength of 4000 psi. The steel reinforcing bars had a specified yield strength of 75,000
pounds per square inch (psi). Figure A.5, in Appendix A, shows the typical exterior

13
column section detail. The steel columns, with a yield stress of 36,000 psi, were rigidly
connected to the RC columns at the first floor level. The steel girders and beams had a
specified yield stress of 42,000 psi. The steel girders, beams, and columns were
connected with a simple connection.
2.2 Experiment Information
The entire experiment involves recording the strain on various structural members
as four columns are removed from the North side of the building shown in Figures 2.4
and 2.5. The Environmental Cleansing Corporation was hired to demolish the Bankers
Life and Casualty Company insurance building. They agreed to help with the study,
tearing out the four columns as specified in this research using GSA (2003) as a
guideline. Figure 2.5 highlights the four columns selected for removal.
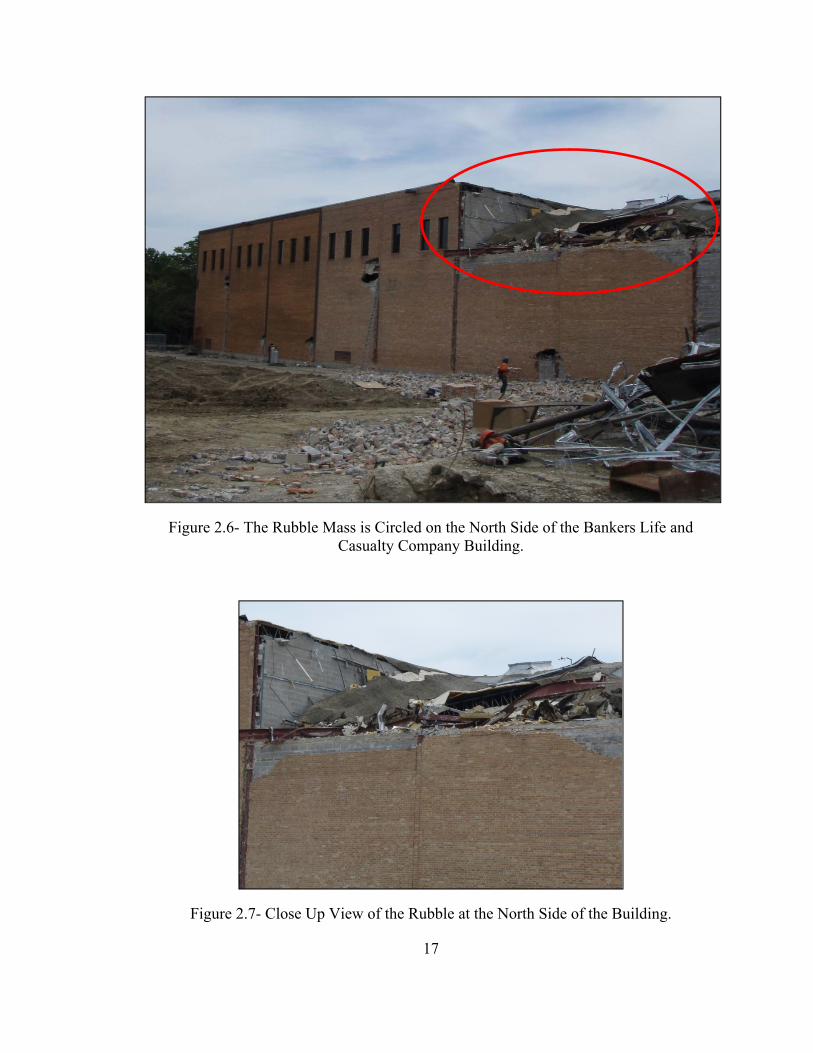
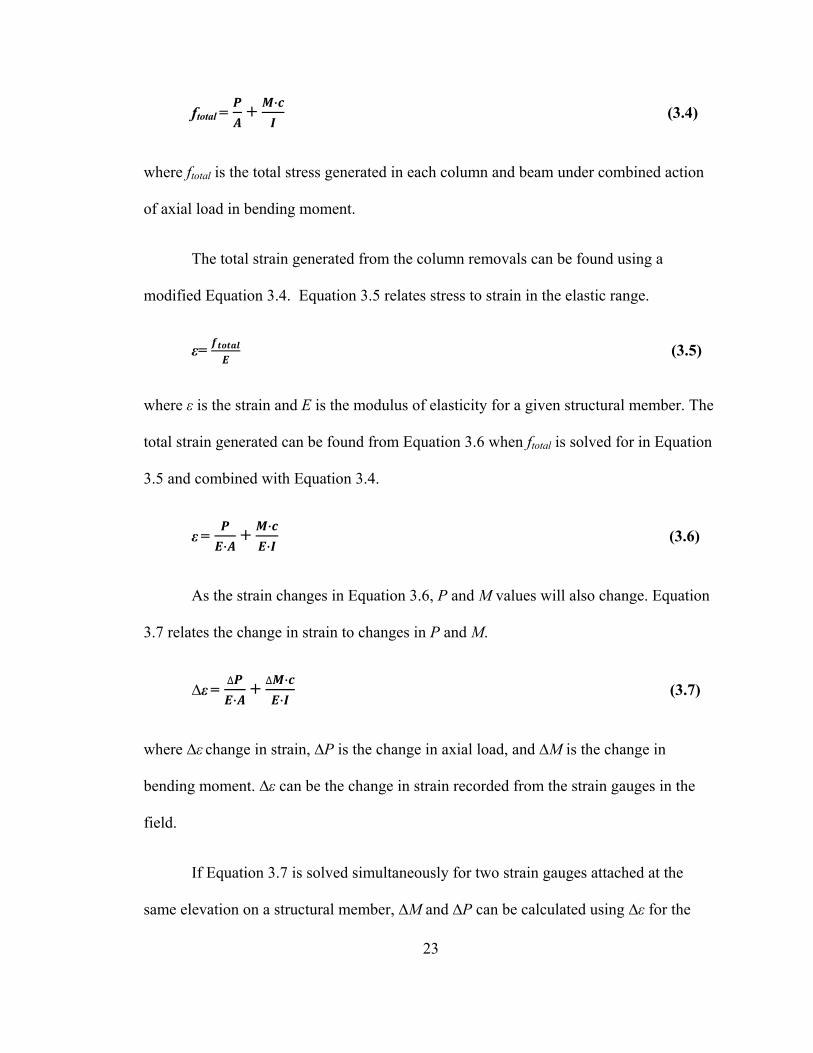
Prior to removing the columns, the demolition team tore down the second floor
near the Northwest corner of the structure due to a miscommunication between the owner
and the demolition team. As a result, all of the building materials remained on the second
floor concrete slab. The joists, bridging joists, roofing, bricks, tie rods, and concrete
masonry units (CMU) created a rubble mass on the second floor slab. This rubble spans
the area of four bays east from the northwest corner and approximately two bays south,
resulting in a slightly different loading scenario for the four columns nearest the
Northwest corner. Figures 2.6 and 2.7 show the rubble mass at the North side of the
building.

14
Figure 2.1- Dimensions for the Second Floor of the Bankers Life and Casualty Company
Building and Experiment Location is Highlighted in Blue.

15
Figure 2.2- Elevation of North End Frame of the Bankers Life and Casualty Company
Building.
Beam Number Beam Type Column Number Column Type 1 RC Flat Slab 1C RC 2 RC Flat Slab 2C RC 3 RC Flat Slab 3C RC 4 RC Flat Slab 4C RC 5 RC Flat Slab 5C RC 6 RC Flat Slab 6C RC 7 RC Flat Slab 7C RC 8 RC Flat Slab 8C RC 9 RC Flat Slab 9C RC 10 24 I 79.9 10C RC 11 21 WF 62 11C 10 WF 49 12 21 WF 62 12C 10 WF 72 13 21 WF 62 13C 10 WF 72 14 21 WF 62 14C 10 WF 72 15 21 WF 62 15C 10 WF 72 16 21 WF 62 16C 10 WF 72 17 21 WF 62 17C 10 WF 72 18 21 WF 62 18C 10 WF 72 19 18 WF 45 19C 10 WF 72 20 18 WF 45 20C 10 WF 72 21 18 WF 45 21C 8 WF 31 22 18 WF 45 22C 8 WF 31 23 18 WF 45 23C 8 WF 31
24C 8 WF 31 25C 8 WF 31 26C 8 WF 31
Figure 2.3- Beam and Column Designation of the Bankers Life and Casualty Company Building Corresponding with Figure 2.2.

16
Figure 2.4- North Side of Bankers Life and Casualty Company Building.
Figure 2.5- The Circled Columns on North Side of the Building were Removed During the Experiment.
17
Figure 2.6- The Rubble Mass is Circled on the North Side of the Bankers Life and Casualty Company Building.
Figure 2.7- Close Up View of the Rubble at the North Side of the Building.

18
CHAPTER 3
3. INSTRUMENTATION AND TESTING PROCEDURE
3.1 Instrumentation and Column Removal Process
Chapter 3 discusses the placement of strain gauges on the structural members on
the North side of the building. This chapter briefly explains how the strain gauges record
data and their locations on the structure shown in the tables and graphs to follow. The
results are used to determine which members have progressive collapse potential.
Alternative column removal processes are also discussed for comparison. In addition,
Chapter 3 describes the testing procedure and methodology for the experiment, exhibiting
the columns removed, the removal method, and the data collection.
3.2 Instrumentation
The strain gauges attached to the columns and beams are universal general-
purpose strain gauges with a resistance of 120 ± 0.3% Ohms, and have a strain range of
±3%. They measure the strain in the Z direction caused by the compressive and tensile
forces displayed in Figure 3.1. A set procedure was used to install the strain gauges on
each column and beam.
The demolition team first exposed the columns and beams by removing the
exterior brick wall. Then, the surface of the columns and beam were grinded down to
remove all paint and debris. Next, a degreaser, conditioner and a neutralizer were applied

19
to the clean surface before attaching the strain gauges using an adhesive. The strain
gauges were then covered with a strain gauge shield to protect against debris. Figure 3.2
shows a strain gauge attached to a column protected with a cover shield.
A total of nine strain gauges were used in the experiment, eight were attached on
the columns and one was attached to a beam. Figures 3.3 and 3.4 display the Columns
13C, 14C and 17C instrumented with two strain gauges each approximately 6 ft from the
bottom. One strain gauge was placed on the East facing web, and one strain gauge was
placed on the North exterior facing flange. Columns 12C and 16C were each
instrumented with one strain gauge on their Northern exterior facing flanges (Table 3.1
lists the locations of the strain gauges used).
The strain gauge attached on Beam 10 measured the strain in the Z direction
caused by the bending moment. Due to very tall heights, only Beam 10 was instrumented
with a strain gauge on the exposed bottom face of the flange approximately 1 ft-6 in.
from the left of the beam. This bending moment along the length of Beam 10 is caused by
the weight of the structure shifting as each column is removed.
3.3 Testing Procedure
The strain gauges were attached to a portable data acquisition scanner system and
laptop. Figure 3.5 displays the computer station set up at the demolition site. During the
column removal process, the computer measurement scanner and laptop recorded all nine
strain gauge readings simultaneously. The strain values were recorded every tenth of a
second during the column removal. Unfortunately, during the experiment several

20
columns were knocked as the bricks were being removed around each column, causing
certain strain gauge readings to spike suddenly. The data collected takes into account
these sudden changes in strain during the entire column removal process.
During the column removal process, each column was weakened by a blow torch
prior to its removal for safety reasons. During the torching process, the demolition team
melt nearly through each column’s cross section at two points above the strain gauges.
The distance between the torched lines on each column was approximately two to three
feet. The demolition team then melted a hole in the Northern facing flange of each
column between the torched lines. A chain was then attached to the hole, and the column
was pulled out by a large backhoe. Figure 3.6 shows a torched column with a chain
attached.
Figure 3.7 shows the North side of the structure and the order that each of the four
columns was torched and removed. Column 15C was torched first, Column 16C was
second, Column 12C was third, and Column 11C was fourth. After the four columns
were torched, the removal process began. The columns were removed in the same order,
but Column 11C was removed third, and Column 12C was removed fourth. The time
span between the torching and removing of the columns was relatively short to simulate a
more realistic immediate removal. Figure 3.8 shows Column 16C being torched, Figure
3.9 shows Column 16C removed, and Figure 3.10 shows Column 11C being removed.
3.4 Strain Gauge Data Measured During Column Removals
The strain variation was recorded by the nine strain gauges during the entire
column removal process. Strain is a unitless value calculated using Equation 3.1.

21
ε= ∆
(3.1)
where ∆L is the change in length of a structural member, and L is the original length of
the structural member. A positive strain value means the structural member elongates and
is in tension, and a negative strain value means the structural member contracts and is in
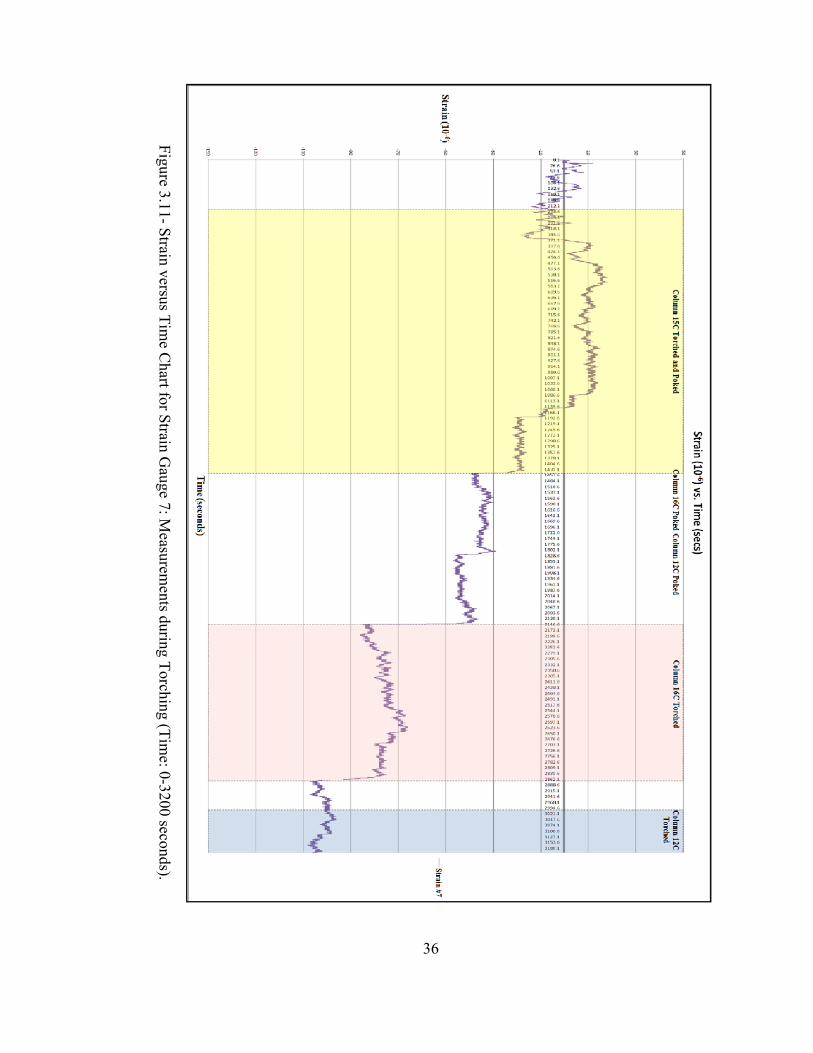
compression. Figures 3.11-3.13 display the strain versus time graph of the strain gauge 7
attached to Column 14C. The graph shows the strain values generated from the four
columns being torched and removed. The most important observations from Figure 3.11
occur between 2141-2870.5 seconds. There is a sudden compressive strain increase of
65*10-6 indicating the torching of Column 16C resulted in additional axial loads on
Column 14C. Further implications of the measured strain data are investigated in the next
few sections and Chapter 4.
Figures B.1 through B.3 in Appendix B show the strain versus time graphs for all
nine strain gauges attached to the structure. Each graph highlights when each column was
torched, knocked/poked, and removed. Strain gauge 5 was hit by the demolition team’s
backhoe approximately 1620 seconds into the experiment and was severed.
3.5 Load Redistribution During Column Torching and Removal
As each column was torched and removed, the remaining columns and beams
must resist a new gravity load to support the building. This additional loading, caused by
the redistribution of the building’s weight to neighboring columns and beams, creates

22
new additional stress in the structural members. The new stress is due to the combination
of axial loading and a bending moment.
The axial loading is a concentrated force, from the live and dead loads in the
building, acting at the center of the structural member’s cross section. The axial loading
generates a compressive or tensile axial stress in the structural member. The bending
moment is generated by the weight of the structure acting not directly at the structural
member’s cross section center. The bending moment generates a bending stress in the
structural member. The total stress generated in each column and beam can be calculated
from the following equations. The first equation is for axial stress, fa. Axial stress can be
calculated using Equation 3.2.
fa= (3.2)
where P is the weight load from the structure and A is the cross sectional area of the
column or beam. The second equation is for the stress created from the bending moment.
The bending stress, fb, is calculated using Equation 3.3.
fb= ·
(3.3)
where M is the bending moment, c is the distance from the neutral axis to top or bottom
of structural member, and I is the moment of inertia given for a structural member.
The total stress generated in each column and beam is found by combining
Equations 3.2 and 3.3 to create Equation 3.4.
23
ftotal = + ·
(3.4)
where ftotal is the total stress generated in each column and beam under combined action
of axial load in bending moment.
The total strain generated from the column removals can be found using a
modified Equation 3.4. Equation 3.5 relates stress to strain in the elastic range.
ε= (3.5)
where ε is the strain and E is the modulus of elasticity for a given structural member. The
total strain generated can be found from Equation 3.6 when ftotal is solved for in Equation
3.5 and combined with Equation 3.4.
ε = ·
+ ·
· (3.6)
As the strain changes in Equation 3.6, P and M values will also change. Equation
3.7 relates the change in strain to changes in P and M.
∆ε = ∆
· +
∆ ·
· (3.7)
where ∆ε change in strain, ∆P is the change in axial load, and ∆M is the change in
bending moment. ∆ε can be the change in strain recorded from the strain gauges in the
field.
If Equation 3.7 is solved simultaneously for two strain gauges attached at the
same elevation on a structural member, ∆M and ∆P can be calculated using ∆ε for the

24
two strain gauges. Chapter 6, Section 6.5 gives more detail about strain gauge placement
and solving Equation 3.7 correctly. Figure B.4 in Appendix B shows the strain values at
specific times for all nine strain gauges. Figure B.5 in Appendix B shows a graphical
example where ∆ε was measured from.
Beams on a structure typically will be subjected to very small or no axial load.
Therefore, Equation 3.7 becomes Equation 3.8 for beams not carrying an axial load.
∆ε = ∆ ·
· (3.8)
Equation 3.8 can be solved directly for any strain gauge attached to a beam since ∆P
equals zero. Due to extreme heights, Beam 10 was the only beam accessible to be
instrumented with a strain gauge. The change in moment values (∆M) and the total
change in moment can be found in Figure B.6 in Appendix B for Beam 10. The total
change in moment, ∆M, is measured from a starting strain of zero to the final strain value
at the removal of the last column, Column 12C.
3.6 Load Redistribution Analysis from Strain Gauge Readings
The maximum axial load a column can endure before failure is found using
Equation 3.9, assuming the applied moments are relatively small.
Py =fy·A (3.9)
25
where Py is the maximum axial load capacity, fy is the yield stress, and A is the cross
sectional area of the column or beam. The maximum axial load capacity can be found
using Equation 3.10.
Pmax = Pexisting + ∆P (3.10)
where Pmax is the maximum applied axial load capacity, Pexisting is the original/existing
load on the column or beam caused from the weight of the structure, and ∆P is the change
in loading caused by column removal. Pmax is limited by Py (Pmax ≤ Py).
The ∆P can be calculated using Equation 3.7, and the Pexisting on the columns will
be analyzed in Chapter 5 using the computer program SAP2000. Using the ∆P recorded
in the field and the Pexisting calculated in SAP2000, Pmax can be determined and compared
with Py. For example, the 10WF72 columns have an area of 21.18 in2 and a yield stress of
36,000 psi, and the maximum load (Pmax) the columns can withstand before inelastic
failure is 762.5 kips (Equation 3.9).
3.7 Strain Analysis from Strain Gauge Readings
The maximum strain the columns and beam can endure before failure is
calculated using Equation 3.11, assuming the strain hardening of steel material can be
ignored for practical purposes.
εy= (3.11)

26
where εy is the yielding strain, fy is the yield stress, and E the modulus of elasticity for a
given structural member. The maximum strain can be found using Equation 3.12.
εmax = ε existing+∆ ε (3.12)
where εmax is the maximum strain that is measured in the member (εmax ≤ εy) , ε existing is
the original/existing strain on the column or beam caused from the weight of the
structure, and ∆ε is the change in strain caused by column removal. εmax is not necessarily
equal to εy.
The ∆ε was recorded directly from the strain gauges, but the original/existing
strain conditions on the columns and beams are unknown. The existing strains (ε existing)
will be analyzed in Chapter 5 using SAP2000.
All the columns and beams in the test building have a yield stress of 36,000 psi
and 42,000 psi respectively. The modulus of elasticity for both steel columns and beams
is 29,000 kips per square inch (ksi). The yield strain for steel columns and beams is
0.00124 and 0.001445 respectively (Equation 3.11). Once the strain of 0.00124 is
reached, the column becomes inelastic and has a greater chance of failure, and beams also
become inelastic once the strain of 0.001445 is reached. The maximum value the strain
gauges recorded for ∆ε on the building during the column removal never exceeded
0.0008. The original/existing (ε existing) strain on the columns and beams caused by the
weight of the structure must be less than 0.00044 (Equation 3.12) or these members could
fail. The actual field measurements of strain show the structure did not seem susceptible
to progressive collapse.

27
3.8 Bending Moment Analysis from Strain Gauge Readings
The maximum bending moment that the beam could endure before yielding is
calculated using Equation 3.13.
My=fy·Sx (3.13)
where My is the yield moment, fy is the yield stress, and Sx is the elastic modulus given
for a steel structural member. The maximum bending moment that the beam can endure
before a plastic hinge is formed is found using Equation 3.14.
Mp=fy·Zx (3.14)
where Mp is the plastic moment, fy is the yield stress and Zx is the plastic modulus given
for a steel structural member. The maximum moment (yielding or plastic) can be found
using Equation 3.15.
Mp or My = Mexisting+∆M (3.15)
where Mp is the plastic moment, My is the yield moment, Mexisting is the original/existing
moment on the column or beam caused from the weight of the structure including live
load, and ∆M is the change in moment caused by column removal. The SAP2000 analysis
in Chapter 5 will be used to calculate the Mexisting values for the beams and columns, and
the maximum moment recorded in the field, ∆M, was 13.45 kip-ft on the beam.
For example, the elastic modulus for the 24 I 79.9 beam (Beam 10) is 173.9 in.3,
and the maximum bending moment is 608.65 kip-ft (Equation 3.13). The plastic modulus

28
for the 24 I 79.9 beam is 203.0 in.3, and the maximum plastic moment is 710.5 kip-ft
(Equation 3.14). The original/existing moment (Mexisting) cannot be greater than 594.78
kip-ft for yielding moment and 696.63 kip-ft for plastic moment for the beam (Equation
3.15). The beams actual field measurement of ∆M (Equation 3.8) show the structure was
not susceptible to progressive collapse.
3.9 Strain Relationship between Torching and Removal Phases
Figure B.4 in Appendix B displays the recorded strains, ε, and change in strain,
∆ε, at specific times. The reported strains do not take into account the initial strain in the
frame due to existing loads (discussed in Section 3.7). Ideally, the strain recorded at the
end of each column torching process should equal the strain at the beginning of the next
column torching. However, the strains fluctuate slightly between column torchings. The
∆ε values are greatest when the columns are torched, because the columns lose most of
their structural strength and loads have to be redistributed. Most of the ∆ε values increase
very slightly between the last column being torched and the first column removed.
However, some of the ε values do increase greatly between the last torching and
the first column removal. Once the column removal phase begins, the ∆ε values
generated between each column removal are very close to zero and the ε values are fairly
constant. This appears to be because most of the load redistribution between members has
taken place during the torching phase. A relationship between the measured strains
during the torching phase and removed phase needs to be developed in order to directly
compare with the SAP2000 analysis presented in Chapter 5.
29
Ideally, the experiment would completely remove one column at a time, and the ε
and ∆ε values would be created from the column removals only. The entire torching
phase would be eliminated. However, the columns must be torched first for safety. A
relationship between the torching and column removal phases is found in Equation 3.16.
This equation is used to create a single column removal phase in the structure to
determine the ε and ∆ε values, eliminating the torching phase.
ε current removed= ε current torching + (εremoved average – εlast torching) (3.16)
where ε current removed is the strain generated in a structural member after one to four
columns are removed (taking into account the torching phase), εcurrent torching is the strain
generated in a structural member after one to four columns are torched (Figure B.4),
εremoved average is the ε value created from averaging the recorded strains from all four
column removals for a given structural member. Since there is very little change in the
strain during the column removal phase, the four strains for a given structural member are
averaged to generate a single value (εremoved average). εlast torching is the final ε value for a
given structural member generated from the final column torching. The εlast torching = εcurrent
torching during the last column torching.
For example, the Strain Gauge 7 in Figure B.4 had a strain of -0.000105 when
Column 16C was torched. The -0.000105 strain is the εcurrent torching value. The εremoved
average value averages all four strains recorded during the column removal. The strains
during each column removal are -0.000652, -0.000668, -0.000668, and -0.000691. The
average of those strains is -0.000669.75 and becomes the εremoved average value. The εlast

30
torching value is a strain of -0.000447 from the torching of Column 11C. Therefore, the ε
current removed value for Column 16C removed from Equation 3.16 is -0.000328.
Strain Gauge Name Member Location
12 Beam 10 Bottom Flange 11 Column 12C Exterior Flange 10 Column 13C Web 9 Column 13C Exterior Flange 8 Column 14C Web 7 Column 14C Exterior Flange 5 Column 16C Exterior Flange 4 Column 17C Web 3 Column 17C Exterior Flange
Table 3.1- Strain Gauge Numbers with Location.
Figure 3.1- Axis Labels for Columns and Beams.

31
Figure 3.2- Strain Gauge Attached to a Column with a Cover Shield Applied.
Figure 3.3- Exposed Columns and Beam Labeled.

32
11C 12C 13C 14C 15C 16C
10
SG 12
SG 11
SG 10
SG 9
SG 8
SG 7 SG 5
17C
SG 4
SG 3
Strain Gage = SG
6'
Figure 3.4- Strain Gauge Placement with Columns and Beam Labeled.
Figure 3.5- Computer Station and Data Acquisition System.

33
Figure 3.6- Torched Column Ready to be Pulled Out.
11C 12C 13C 14C 15C 16C
10
17CTorched 2ndRemoved 2nd
Torched 1stRemoved 1st
Torched 3rdRemoved 4th
Torched 4thRemoved 3rd
Figure 3.7- Order of Column Torching and Removal.

34
Figure 3.8- Column 16C Being Torched.
Figure 3.9- Column 16C Removed.

35
Figure 3.10- Torched Section of Column 11C Being Removed.
36
Figure 3.11- S
train versus Tim
e Chart for S
train Gauge 7: M
easurements during T
orching (Tim
e: 0-3200 seconds).

37
Figure 3.12- S
train versus Tim
e Chart for S
train Gauge 7: M
easurements during T
orching (Tim
e: 3200-6398 seconds).

38
Figure 3.13- S
train versus Tim
e Chart for S
train Gauge 7: M
easurements during C
olumn R
emoval (T
ime: 5000-5800 seconds).

39
CHAPTER 4
4. GSA GUIDELINES FOR PROGRESSIVE COLLAPSE
4.1 Introduction
Chapter 4 discusses the General Services Administration (GSA) Progressive
Collapse guidelines. This chapter explains the procedure GSA (2003) follows in order to
determine if a structure will be susceptible to progressive collapse. GSA (2003)
recommendations and formulations for column removal are illustrated in various figures,
and the Demand-Capacity Ratios (DCR) values for the building are presented.
4.2 General GSA (2003) Guidelines
The GSA Progressive Collapse Analysis and Design Guidelines (2003) define
analysis procedures to evaluate the vulnerability of a structure against progressive
collapse. GSA (2003) recommends that a structure be analyzed by instantaneously
removing a column from the middle of the traverse side of the building, near the middle
of the longitudinal side of building, and at the corner of the building (Figure 4.1).

40
When analyzing the structure for progressive collapse potential, GSA (2003)
recommends a general loading factor to be used for every structural member in the
building being tested. GSA (2003) factors the loading conditions using Equation 4.1:
Load=2.0(Dead Load +0.25(Live Load)) (4.1)
Equation 4.1 is used for all loads acting on the structure, and increases the loading
condition to account for irregularities in the structure. This equation presents the worst
case scenario for the structure being tested for progressive collapse potential. Using
Equation 4.1, the allowable extents of collapse resulting from instantaneous removal of
primary exterior vertical supports are found in Figure 4.2.
When vertical members are instantaneously removed, GSA (2003) uses Demand-
Capacity Ratios (DCR) to analyze which structural members will exceed their loading
capacity and lead to progressive collapse. Using the linear elastic static analysis, the DCR
values are found using Equation 4.2.
DCR= (4.2)
where Mmax equals the moment demand calculated using linear elastic static analysis from
SAP2000, and Mp equals the ultimate moment capacity (plastic moment) can be
calculated from Equation 3.14. Using these two values, the DCR value for each structural
member of the building is calculated. The DCR values calculated from Equation 4.2
cannot exceed the DCR limits presented in Figure 4.3.
41
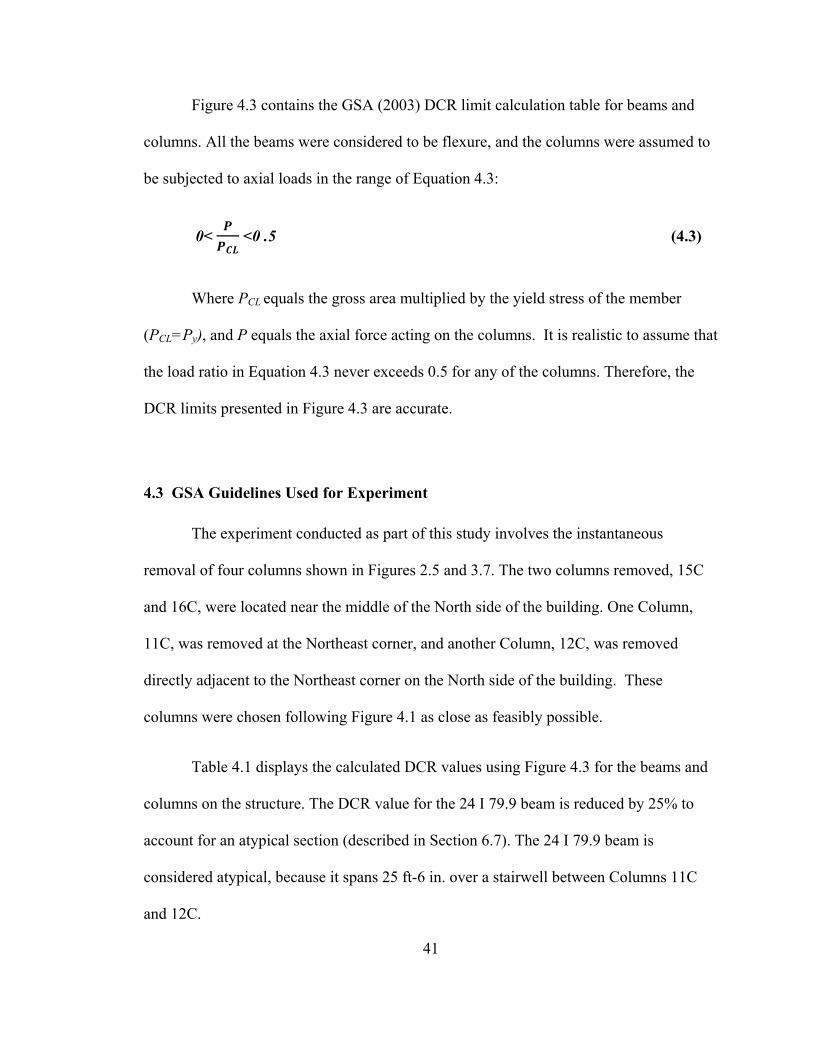
Figure 4.3 contains the GSA (2003) DCR limit calculation table for beams and
columns. All the beams were considered to be flexure, and the columns were assumed to
be subjected to axial loads in the range of Equation 4.3:
0< <0 .5 (4.3)
Where PCL equals the gross area multiplied by the yield stress of the member
(PCL=Py), and P equals the axial force acting on the columns. It is realistic to assume that
the load ratio in Equation 4.3 never exceeds 0.5 for any of the columns. Therefore, the
DCR limits presented in Figure 4.3 are accurate.
4.3 GSA Guidelines Used for Experiment
The experiment conducted as part of this study involves the instantaneous
removal of four columns shown in Figures 2.5 and 3.7. The two columns removed, 15C
and 16C, were located near the middle of the North side of the building. One Column,
11C, was removed at the Northeast corner, and another Column, 12C, was removed
directly adjacent to the Northeast corner on the North side of the building. These
columns were chosen following Figure 4.1 as close as feasibly possible.
Table 4.1 displays the calculated DCR values using Figure 4.3 for the beams and
columns on the structure. The DCR value for the 24 I 79.9 beam is reduced by 25% to
account for an atypical section (described in Section 6.7). The 24 I 79.9 beam is
considered atypical, because it spans 25 ft-6 in. over a stairwell between Columns 11C
and 12C.

42
Figure 4.1- GSA (2003) Recommendation for Column Removal for Steel Frame Buildings.
Figure 4.2- GSA (2003) Allowable Extent of Collapse from Column Removal for Steel Frame Buildings.

43
Figure 4.3- GSA (2003) Specified DCR Limits for Steel Frame Components.
Beam DCR value
24 I 79.9 2.25 21 WF 62 3
18 WF 45 3
Column DCR value 10 WF 49 1.9
10 WF 72 2 10 WF 77 3 8 WF 31 1.8
Table 4.1- Required DCR Limits for the Beams and Columns of the Structure.

44
CHAPTER 5
5. SAP2000 ANALYSIS
5.1 SAP2000 Analysis Introduction
Chapter 5 describes the computer simulation from the structural analysis program,
SAP2000. The calculations for loading conditions are described and presented, and the
assumptions for the building model are presented. The demand-capacity-ratios (DCR),
strain variations (∆ε), and change in moment (∆M) values are generated from the
SAP2000 analysis and are compared with the actual values from the strain gauges. This
comparison is then discussed and analyzed.
5.2 SAP2000 Information, Assumptions, and Loading Conditions
The structural analysis computer program, SAP2000, is used to analyze the
Bankers Life and Casualty Company Insurance building. A linear elastic static analysis
was done on the two dimensional exterior frame located on the North side of the building,
which takes into account the effect of immediate surrounding structural members.
SAP2000 analyzes the loading conditions caused by the structure’s weight.
Loading conditions for the structural members on the North side of the structure
were hand calculated. The loads acting on the structural members were caused by the
dead load weight from various structural members. The joists (28 LH 06) are 19 pounds

45
per linear foot (plf), and the bridging (L 1 ¼ in. x 1 ¼ in. x 1 1/8 in.) is 1.01 plf. The 1 in.
diameter tie rods weight is calculated using Equation 5.1 from 1963 AISC manual.
0.223(L) + 0 .56 lb (5.1)
where L is the length of the tie rod. The tie rods weigh 145.6 lbs. The roof material is
assumed to be 25 pounds per square foot (psf). The concrete slabs are assumed to be 150
pounds per cubic foot (pcf), the concrete masonry units are assumed to be 135 pcf, the
exterior bricks are assumed to be 120 pcf, and the glass is assumed to be 160 pcf. The
second floor has an assumed dead load of 45 psf acting upon it from carpet, electric
wires, ceiling panels, lights, tubing ducts, partition walls, and a small air conditioning
unit.
Equation 4.1 was used for the loading conditions. Therefore, all the dead loads
were multiplied by a factor of two. The same procedure for the field experiment was
implemented in the SAP2000 analysis, and all the structural properties of the members
were inserted into the computer model. The SAP2000 analysis is a two dimensional
linear elastic static simulation, and the columns were removed in SAP2000 in the same
order they were torched in the field. The computer model of the structure in SAP2000
analyzes the original building conditions and each subsequent column removal.
5.3 SAP2000 DCR Computer Simulation
The hand calculated loads were inserted into the SAP2000 program, and a model
of the building was created. A SAP2000 computer simulation was performed after each

46
column removed on the model and the results are analyzed. Figures 5.1 through 5.5 show
the SAP2000 bending moment diagrams and DCR values for the two dimensional
exterior frame on the North side of the structure. The DCR values in red in Figures 5.1
through 5.5 have exceeded the specified DCR limits shown in Table 4.1.
Column 12C was torched third and removed last in the field, but was removed
third in SAP2000. This removal was deliberately done, because the strains had the largest
readings when the columns were torched and barely reacted and changed when the
columns were removed. For this experiment, the column torching order is the SAP2000
column removal order.
Some of the DCR values for the members exceeded the specified DCR limit
(GSA,2003) by a factor of eight. These high DCR values could partially be due to the
inaccuracy in dead and live load predictions. Approximately half of the second floor was
collapsed by the demolition team (Figures 2.6 and 2.7) prior to the first column removal,
the GSA guidelines require all dead loads be multiplied by a factor of two (Equation 4.1),
or inaccuracy in our judgment for assumed loading conditions. Also, the structure could
not redistribute the gravity loads as easily because it was a two story tall structure, half of
the second story was collapsed, and had large spans between columns. A taller structure
probably would be able to distribute gravity loads to more members and would generate
smaller DCR values as found in Sezen and Song (2008).
The SAP2000 study conducted showed eight columns and seven beams exceeded
their respected DCR limits when all four columns were removed (Figure 5.5). These
members are deemed susceptible to progressive collapse. The DCR limit for 8 WF 31

47
columns is 1.8. The DCR value for a 8 WF 31 column above the removed Column 12C
was 16.12 after all four columns were removed. The DCR limit was exceeded by a factor
of 8.8. However, during the experiment the building did not experience progressive
collapse when all four columns were removed. A nonlinear dynamic analysis performed
in SAP2000 would provide more accurate DCR values.
5.4 SAP2000 Analysis ε Clarifications
The SAP2000 program calculates the ε when a column is completely removed only,
i.e., either there is a column or no column in the model. There is not a way for a linear
elastic static analysis to account for the torching and removal of the columns using the
same model. The ∆ε value can be determined in SAP2000 by taking the difference in ε
values for each column removal (i.e., based on analysis with and without a column in the
model). The ε and ∆ε created in SAP2000 between column removals cannot be compared
directly with the ε and ∆ε generated between actual column removals, because the ε and
∆ε have the greatest change during the torching phase and change slightly during column
removals as shown in Figure B.4 and discussed in Section 3.9. The ε and ∆ε from
Equation 3.16 are compared with the ε and ∆ε generated from the SAP2000 analysis.
5.5 SAP2000 Analysis Comparison with Recorded Data
The strain gauges in the field were set to zero before the experiment began. There
was an initial strain in the columns before the strain gauges were instrumented, but could
not be recorded (discussed in Section 3.7). Table 5.1 shows the axial force (P), bending

48
moment (M), strain (ε) after each torching phase, average ε value from the four similar
strain values recorded during column removal process (discussed in Section 3.9). The
final ε, and ∆ε for Strain Gauge 7 on Column 14C are compared with the generated
SAP2000 values.
Strain Gauge 7 was selected for this experimental study because it was believed to
have recorded the most consistent and accurate data in the field. Table 5.1 shows that the
strain values recorded in the field from Strain Gauge 7 had an average 21% error between
the field and SAP2000 results using Equation 5.2.
Percent Error= (5.2)
where the percent error is the error between the SAP2000 strains and the strains recorded
in the field, SAP2000 is the strain after each column removal (Table 5.1), and Field is the
strain recording in the field after each column removal (Table 5.1). The percent error was
calculated for each column removal. The absolute values of the four percent errors were
then averaged to generate the 21% error. These values were very close considering all the
possibilities for error. The exact time of each column torching and removal was not
recorded, the exact locations of strain gauges were not recorded, and the demolition
atmosphere could have caused recording discrepancies.
Figure 5.6 shows the comparison between the ε values from the SAP2000 analysis
and the actual field measurements. Referring back to Chapter 3 and Table 5.1, the
measured maximum P value of Strain Gage 7 never exceeded the allowable Pmax value,
762.5 kips (Equation 3.9). The initial strain, ε existing , was equal to 0.000192 which did not
49
exceed the allowed ε existing value of 0.00044 (Equation 3.12). The Mexisting value in Table
5.1 for Strain Gauge 7 was equal to -0.85 kip-ft and was not greater than allowable
Mexisting absolute value of 594.78 kip-ft (Equation 3.15). Using Equations 3.13 and 3.14,
the moment from the SAP2000 analysis in Table 5.1 for Strain Gauge 7 never exceeded
the maximum bending (238 kip-ft) or plastic moment (269 kip-ft).
Strain Gauge 12 located on Beam 10 was also directly compared strain generated
SAP2000. There was over a 400% error between the SAP2000 and field recorded strains
(Equation 5.2). This large error could be partially attributed to the linear elastic static
analysis, because it does not include dynamic, nonlinear, and three dimensional effects.
Therefore, corner columns and beams are not able to transfer loads around the corner to
neighboring columns and beams. Also, the beams in on the structure were assumed to
have zero or little axial loads from Equation 3.8. The SAP2000 analysis had cases where
approximately 70 kips were applied in some beams. The SAP2000 results had Beam 10
very close to failure, while the recorded strains in the field had Beam 10 not close to
failure.

50
Figure 5.1- SAP2000 Model of Original Intact Building with DCR Values.
Figure 5.2- SAP2000 Model after Column 15C Removed with DCR Values.
Figure 5.3- SAP2000 Model after Columns 15C and 16C Removed with DCR Values.

51
Figure 5.4- SAP2000 Model after Columns 12C, 15C, and 16C Removed with DCR Values.
Figure 5.5- SAP2000 Model after Columns 11C, 12C, 15C, and 16C Removed with DCR Values.
.

52
Figure 5.6- SAP2000 and Field Strain Values Shown for Strain Gauge 7 (21% Error between SAP2000 Results and Actual Measurements).

53
SAP2000-Prior to removal
Field- prior to removal
SAP2000-15 C
removed
Field- 15 C
removed
SAP2000-16 C
removed
Field- 16 C
removed Axial Force at 6 ft from bottom (kip) -113.8 ? -193.72 ? -317.23 ?
Moment at 6 ft from bottom (kip-ft) -0.85 ? -6.28 ? -23.1 ?
Strain from Torching at 6 ft from bottom - ? - -37 - -105 Avg. Strain from
Removal at 6 ft from bottom - ? - -222.75 - -222.75
Strain (ε) 6 ft from bottom -0.000192 -0.000192 -0.000351 -0.000451 -0.000642
-0.000519
Absolute Change in Strain (∆ε) 0.000000 0.000000 0.000160 0.000260 0.000291 0.000068
SAP2000-12 C removed
Field-12 C removed
SAP2000-11 C
removed Field-11 C removed
Axial Force at 6' from bottom (kip) -291.5 ? -195 ?
Moment at 6' from bottom (kip-ft) -29.64 ? -64.85 ?
Strain from Torching at 6' from bottom - -138 - -447 Avg. Strain from
Removal at 6' from bottom - -222.75 - -222.75
Strain (ε) 6' from bottom -0.000634 -0.000552 -0.000659 -0.000861
Absolute Change in Strain (∆ε) 0.000008 0.000033 0.000025 0.000309
Average % ε Error 21 Table 5.1- Axial Force and Moment Acting on Column 14C at Location of Strain Gauge
7, and Strain Gauge 7 Values from SAP2000 Analysis and Field Measurements.

54
CHAPTER 6
6. GENERAL GUIDELINES FOR INSTRUMENTATION AND COLUMN REMOVAL PROCEDURE
6.1 Introduction
Chapter 6 discusses strain gauge instrumentation and suggests placement of
sensors for optimum results. The strains generated from bending moments and axial loads
applied on columns and beams are discussed. The instrumentation of linear displacement
sensors is also introduced. The optimum column removal procedure to produce the most
beneficial data measurements is also presented. Methods for removing exterior columns
are discussed, and suggestions for interior column removal are presented.
6.2 Strain Gauge Theory
Strain gauges were used to measure the strain in the longitudinal direction of
beams and columns on the first floor of the structure. The strain gauge will face
vertically for columns (silver solder points facing down), and will face left or right for
beams. Figure 6.1 shows a typical strain gauge.
Most columns and beams in structures are designed to resist lateral forces about
their strong axis or X axis (see Figure 3.1 for axis details). As a result, most exterior
columns of a building will have their flanges facing inward and outward, and beams have
their flanges facing upwards and downward. Most W shape columns and beams have a

55
larger moment of inertia about the X axis, and can resist a greater bending moment in that
direction. For this research, it is assumed the exterior columns of structures have their
flanges facing inward and outward and beam’s flanges are facing upward and downward.
Many columns resist an axial stress and a bending stress from the building’s
gravity load (dead and live loads). Beams generally resist a bending stress from the
building’s gravity load and usually an axial stress is not generated. The stress generated
from the gravity load of the structure is directly proportional to strain as long as the steel
material stays elastic and does not yield. The stress-strain relationship for elastic steel
material is linear (Equation 3.5). Therefore, the larger the stress generated, the greater the
strain.
6.3 Strain Gauge Instrumentation Theory on Columns
If a structure fails due to progressive collapse, it is difficult to determine which
direction the column will fail. The column can bend about the X axis and fail outward or
inward, it can fail by bending about the Y axis, or a combination of both. Theoretically,
the strain should be the same value on the flange in compression and the flange in tension
from a bending moment alone. As the weight of structure shifts, a combination of an
axial load and bending moment is generated. As the weight of the structure shifts, one
flange of a structural member becomes more in compression. The strain and stress are
uniform across the cross sectional area of the column from the axial force, and are linear
across the cross sectional area of the column from the bending moment. Shown in Figure
6.2, the strain generated from the bending moment is added to the strain created from the

56
compressive axial loading creating a larger strain in the compression flange (Equation
3.6).
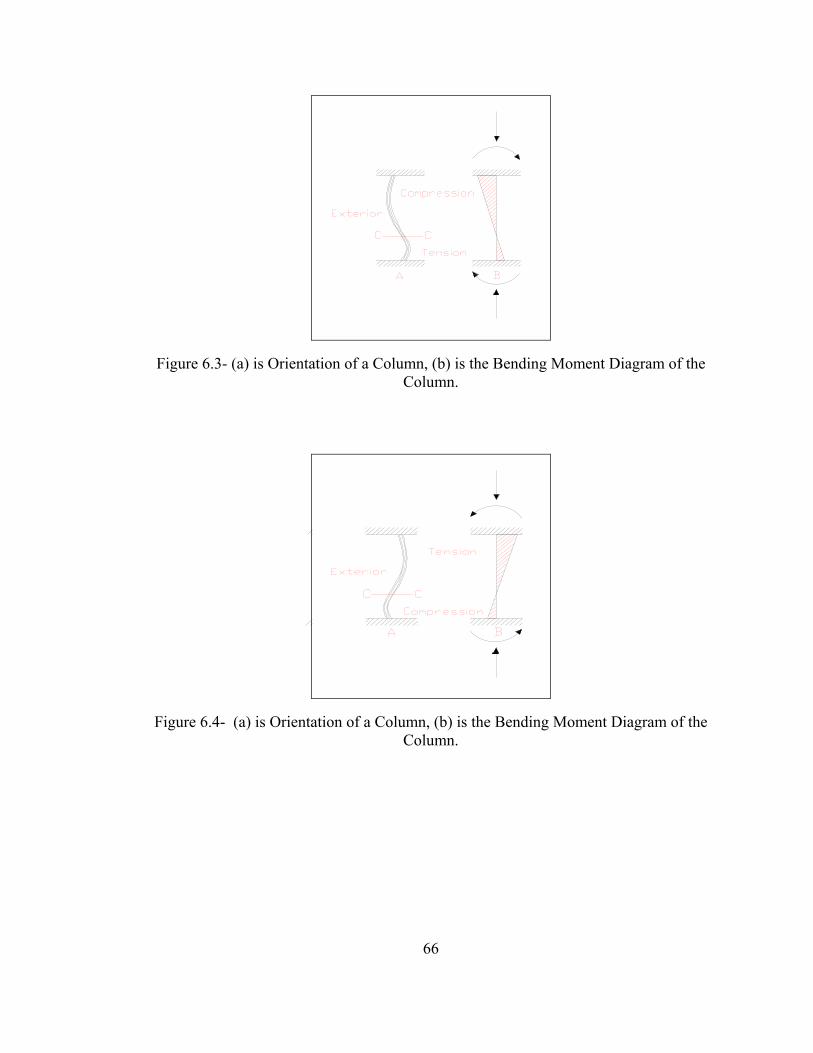
Figures 6.3 and 6.4 show the two possible cases for a fixed end connection
column bending about the X axis. Figure 6.3 shows the orientation of the column when
the flange on the right, near the top of the column, is in compression. Figure 6.4 shows
the orientation of the column when the flange on the left, near the top of the column, is in
compression.
The stress and strain developed is the greatest at the ends of the cross sectional
area of the W shape, and the greatest strain is generated where the moment is the largest
(Equation 3.8 and Figure 6.2). Therefore, one strain gauge should be attached on the
column at the center of the compression flange near the top of the column to record the
largest strain readings. Unfortunately, it is difficult to determine which flange will
become more in compression when the neighboring columns are removed.
If the column fails due to bending about the Y axis, the strain gauges attached
vertically on the flanges theoretically should not record any strain. The strain developed
from bending about the Y axis can be recorded if the strain gauge was instrumented
facing left or right on the flange. This strain gauge would record the strain in the X
direction, and further investigation will be done in future research. For most progressive
collapse research, the strain gauges will be placed at the center of column’s flanges
facing upwards near the top of the column.
Theoretically, the column cross section will have a zero bending moment value at
the point where the bending direction changes. Figures 6.3 and 6.4 show this point at the

57
line labeled C. The strain developed only from axial loading in the column can be
determined if a strain gauge is attached facing vertically at the very center of the web at
the point of zero moment. Although there is no easy way to determine the inflection point
or zero moment location, a preliminary analysis predication shows the bending effects
will be very small (close to zero) at 1/3 the length of the column from the bottom.
6.4 Strain Gauge Theory on Beams
Beams generally carry have a very small axial load. The bending moment due to
gravity loads will create the largest strains in the flanges of the beam (Figure 6.5). Attach
strain gauges facing left or right to the bottom flange of the beam (flange facing the
ground) because the bottom flange will most likely be easier to access.
The greatest strains will be generated where the bending moment is the largest.
For beams with fixed ends, the moment will be greatest at the ends of the beam and
possibly near the middle of the span length as shown in Figure 6.6.
The strain gauges should be placed as close to the ends of the beam as possible at
the center of the flange. The strain gauges should face the column that they are closer to,
but investigation will be done for future research (silver solder points facing away from
the column closest). If an axial force is believed to be developed during the experiment, a
strain gauge will only record the strain generated from the axial force if it is placed at the
center of the beam’s web at either point C in Figure 6.6. The strain gauge should be
facing left or right (facing the direction the axial force will come from).

58
6.5 Strain Gauge Locations for Columns and Beams
The strain gauges record a uni-axial strain generated from a combination of the
axial loads and bending moments as described in Chapter 3 (Equations 3.6 and 3.7). In
order to determine the actual variation of axial load (∆P) and the moment (∆M) in the
member, placement of sensors should follow Figures 6.7 and 6.8.
Strain gauges must be placed near the top of columns at points A and C shown in
Figure 6.7. It is expected that the maximum moment will occur at the top of the column
both before and after the removal of neighboring column(s). The axial load will be
constant over the length of the column. Strain gauges A and C in Figure 6.7 will be used
to determine which flange is in compression and has a greater strain. Strain gauge B will
record strains mostly due to axial load, and possibly some strains due to bending moment.
Therefore, strain gauge B in Figure 6.7 is not necessary at the top of the column. Strain
gauges A and C should be sufficient to determine the strain distribution at the top of the
column. Once the strain gauges at points A and C record the ∆ε in Figure 6.7, Equation
3.7 can be used to calculate the strains at point A and C. When both equations are solved
simultaneously, the ∆P and ∆M values acting on the column can be determined.
We predict a strain gauge placed approximately 1/3 the length of the column from
the bottom at point B in Figure 6.7 will record the strain from the axial load only. Using
Equation 3.7, the ∆P can be calculated because ∆M is theoretically close to zero. This ∆P
value can be checked with the ∆P calculated from the strain gauge readings near the top
of the column at points A and C shown in Figure 6.7, and should be similar in value.

59
At least, a single strain gauge must be placed near the end of the beam at either
point A or C shown in Figure 6.8. Since beams are rarely subjected to an axial load,
placement of a strain gauge at point B in Figure 6.8 is probably not necessary.
Theoretically, the strains due to bending moments will be the same at points A and C in
Figure 6.8. Using the strains recorded at point A or C and Equation 3.8, the ∆M can be
determined since ∆P is approximately zero. Figure 6.9 shows the beam response stages.
The two beams immediately above a removed column can be subjected to tensile
axial load, especially if catenary action develops (Figure 6.9). Prior to inelastic or
catenary action, the moments in the midspan of beams can be reduced significantly
(Figure 6.6). Similarly, after the column removal, the ends of elastic beams near the
removed column can be subjected to large positive moments (Figure 6.6). Under positive
moments, the beam ends will have tension in the bottom flange and compression in the
top flange. Before the column removal, the same beam ends would carry negative
moments with the top flange in tension and the bottom flange in compression. Therefore,
it is critical to capture this stress change at beam ends. As a result, at least two strain
gauges are necessary, one on the top flange and another on the bottom flange at the ends
of beams jointed above the removed column. To summarize, a minimum of two strain
gauges are needed in each beam end at M and two gauges on columns at M shown in
Figure 6.10.
Figure 6.10 shows three columns and two beams instrumented with strain gauges,
and the column in the middle is removed. If the axial load is to be determined for the
beam, then strain gauges should be installed at locations where the moment will be close

60
to zero as discussed earlier in this section. The strain gauge instrumentation presented in
Figure 6.10 should be applied to the entire part of a structure used for a progressive
collapse experiment.
Table 6.1 provides recommendation for the amount of strain gauges to use
depending on availability. The minimum number of strain gauges used in a progressive
collapse experiment for one column removal is eight, shown in Table 6.1. If the
minimum amount of strain gauges is to be used, strain gauges need to be attached near
the most critical sections where columns will be removed labeled M in Figure 6.10
following the guidelines presented in this chapter
The practical number of strain gauges to use in a progressive collapse experiment
is 12, shown in Table 6.1. If the practical amount of strain gauges is available, attach
strain gauges on beams and columns surrounding columns to be removed. The strain
gauges labeled M and P in Figure 6.10 show where the strain gauges should be placed on
each structural member, and Table 6.1 shows how many strain gauges should be attached
to each column and beam for practical purposes. In addition to each column having two
strain gauges instrumented at location M, each beam should be instrumented with a strain
gauge on each flange at each end labeled M and P shown in Figure 6.10.
The desirable amount of strain gauges to use in a progressive collapse experiment
is 16, as shown in Table 6.1. If the desirable amount of strain gauges is available, attach
strain gauges on every beam and column around the column to be removed during the
progressive collapse experiment. The strain gauges labeled M, P, and D in Figure 6.10
show where the strain gauges should be placed, and Table 6.1 shows how many strain

61
gauges should be attached to each column and beam for the desirable chase. Each column
should have two strain gauges instrumented at M and one strain gauge at the center of the
web 1/3 the length of the column from the bottom labeled D (Figure 6.10). Each beam
should be instrumented with strain gauges on each flange at each end labeled M and P,
and one at the center labeled D, as shown in Figure 6.10. Should the axial load need to be
determined for the beam, an extra strain gauge can be added at section D following the
procedure presented earlier in the section. If strain gauges are still available, attach strain
gauges following Section 6.5 to columns that will be removed.
6.6 Linear Displacement Sensor Instrumentation and Placement
Linear displacement sensors (LDS) are used to measure the vertical or horizontal
displacement of beams or columns. Linear displacement sensors are connected to the
same data acquisition system and computer station the strain gauges are, and the
computer program records the displacements and strains simultaneously. The varying
models of LDS can record a displacement ranging from 0.25 in. to 4 in., and can work in
almost any temperature conditions. A LDS is shown in Figure 6.11.
The sensor needs to be attached to a fixed stand completely separate from
structure. A wooden frame and retractable metal stand is being developed to support the
sensor. These stands need to be absolutely secure and should not move during the
experiment or the LDS will record data inaccurately.
The sensor needs to be depressed slightly against an exposed exterior flange
(bottom face) of a beam supporting the second floor. Placement of the LDS should be

62
where the engineer believes the greatest vertical displacement will occur. Using Figure
6.5, the largest displacements would be at the ends of beams near the removed column.
As each column is removed, the beam to column connection points will have the largest
vertical displacement, and the LDS should be placed near and under these connections to
record the largest vertical displacement.
6.7 Column Removal Guidelines
Structural redundancy and continuity across the structure is crucial for the
prevention of progressive collapse. Beams jointed together independently from a column
form a beam-to-beam structural continuity across a removed column. A column should
be removed if the two beams above it do not form a beam-to-beam structural continuity.
A typical beam-column frame structure usually has a relatively simple, uniform, and
repetitive layout (GSA, 2003). An atypical structure with plan or vertical irregularities
requires a different approach than described here.
Atypical structures may contain: combination structures, vertical discontinuities,
transfer girders, variations in bay sizes, bay sizes greater than 30 ft. in any direction, plan
irregularities, and closely spaced columns (GSA,2003). Combination structures combine
frame and wall systems; therefore, engineering judgment is needed for combination
structures, closely following the typical structural analysis results. Vertical
discontinuities/transfer girder areas of the structure require column removal around these
areas (GSA 2003). Therefore, if a vertical discontinuity exists, the neighboring columns
of the vertical discontinuity must be removed. If a bay size should vary, the columns
63
nearest the largest bay size variation should be removed. Extreme bay sizes (30 ft or
greater) have greater potential for progressive collapse.
Plan irregularities usually need the engineer’s judgment for column removal. If a
re-entrant corner is present, the column at the re-entrant corner should be removed (GSA,
2003). For closely spaced columns, GSA (2003) recommends: “…the structure should be
analyzed for the loss of both columns if the distance between the columns is less than or
equal to 30% of the longest dimension of the associated bay. Otherwise, only the loss of
one column shall be required in the analysis.”
In this study, we developed a general procedure for removing first story columns
from a regular frame building. The procedure is illustrated in Figure 6.12. Figure 6.12
shows the order for which column should be removed. For safety reasons, the columns all
have to be torched first, and the columns will be removed in the same order. Following
the procedure in Chapter 3, the column circled 6th should be torched first. Prior to
torching, the 2nd floor has to be supported near the column circled 6th in Figure 6.12. Steel
supports being developed will support the weight of the structure above the interior
column circled 6th, and a jacking system will hold the supports in place. The interior
column is to be torched and removed while the support mechanism supports the weight of
the structure above the column. The jacking system will be disengaged once the interior
column is to be removed.
The interior column circled 6th will be considered removed once the jacking
system is disengaged. The columns circled 7th and 8th are optional to be torched and

64
removed. Also, it may not be possible to remove columns 5th and 8th if the left side of the
building is not accessible for testing.
Ideally, each column would need to be removed immediately after it was torched.
This is almost impossible to do for safety reasons. Instead of using the torching method, a
controlled blast can be the best method for removal of columns. Several critical columns
would be attached with explosives, and all exterior and interior columns could be
removed in a set order until collapse occurs. Controlled explosives would eliminate the
need for the steel support jacking system, and create a more realistic progressive collapse
scenario.

65
Figure 6.1- A Typical Strain Gauge.
Figure 6.2- Strain from Combination of Axial Load (P) and Bending Moment (M).
66
Figure 6.3- (a) is Orientation of a Column, (b) is the Bending Moment Diagram of the Column.
Figure 6.4- (a) is Orientation of a Column, (b) is the Bending Moment Diagram of the Column.

67
Figure 6.5- Beam Deflection and Moment Diagrams before and after Column Removal.
Figure 6.6- (a) Deflected Shape of a Fixed Ended Beam Under Uniform Vertical Load, (b) Moment Diagram of the Beam.

68
Figure 6.7- Strain Gauge Instrumentation on a Column.
Figure 6.8- Strain Gauge Instrumentation on a Beam.
Figure 6.9- Stages of Beam Response.

69
Figure 6.10- Strain Gauge Instrumentation for Columns and Beams Labeled by
Importance Corresponding with Table 6.1.
Strain Gauges needed per Beam
Strain Gauges needed per Column
(1) Minimum (8 strain gauges) 2 2
(2) Practical ( 12 strain gauges) 4 2
(3) Desirable (16 strain gauges) 5 3
Table 6.1- Number of Strain Gauges Needed if One Column is Removed (Figure 6.10).

70
Figure 6.11- Linear Displacement Sensor.
Figure 6.12- Suggested Order of Column Removal for the First Floor.

71
CHAPTER 7
7. SUMMARY AND CONCLUSION
7.1 Summary
This research investigated the progressive collapse potential of an actual building
scheduled for demolition. The data recorded in the field was analyzed and compared with
data from a SAP2000 computer model. The GSA (2003) guidelines were discussed, and
the demand-capacity-ratio (DCR) values were calculated. An in depth investigation of
testing procedure and instrumentation for future experiments was done in Chapter 6.
Suggestions for instrumentation placement and column removal guidelines were
presented. The experience gained and errors observed in this research will be used to
improve future progressive collapse research.
7.2 Conclusion
The building itself was unique because some of the second floor was collapsed
prior to initiation of our experiment. Future structures should be fully intact and not
damaged. The DCR values and some SAP2000 analysis results were excessively high
due to the unique properties of the structure, inaccurate data recording, and demolition

72
site inconsistencies. However, a great deal was learned and investigated from this
research study.
Future progressive collapse experiments will be more informative and accurate. A
more in depth SAP2000 analysis will be developed for future research that will analyze
every member on the structure near the removed columns. The SAP2000 analysis for this
experiment was similar to some of the strain gauge recordings, and Strain Gauge 7 had an
average 21% error from the SAP2000 analysis. The DCR values deemed the structure to
be at high risk for progressive collapse when all four columns were removed, while the
field recorded strains did not come close to failure. It should be noted that DCR values
are calculated from linear elastic static analysis, as recommended by GSA (2003). A
more accurate numerical simulation should include the material nonlinearity, three-
dimensional, and dynamic effects which are the subject of future research.

73
APPENDIX A
A. STRUCTURAL NOTES AND BUILDING PLANS

74
Figure A
.1-F
oundation Plan (S
tructural).

75
Figure A
.2- First F
loor Framing P
lan (Structural).

76
Figure A
.3- Second F
loor Fram
ing Plan (S
tructural).

77
Figure A
.4- Roof F
raming P
lan (Structural).

78
Figure A.5- Typical Exterior Column Section (Structural).
Figure A.6- Concrete Notes (Structural).

79
Figure A.7- Composite Beam Schedule (Structural).
Figure A.8- Steel Notes (Structural).

80
Figure A.9- General Notes (Structural).

81
APPENDIX B
B. STRAIN GAUGE CHARTS AND LOAD DISTRIBUTION VALUES DURING COLUMN REMOVAL

82
Figure B
.1- Strain versus
Tim
e Chart M
easurements during T
orching, (Tim
e: 0-3200 seconds).
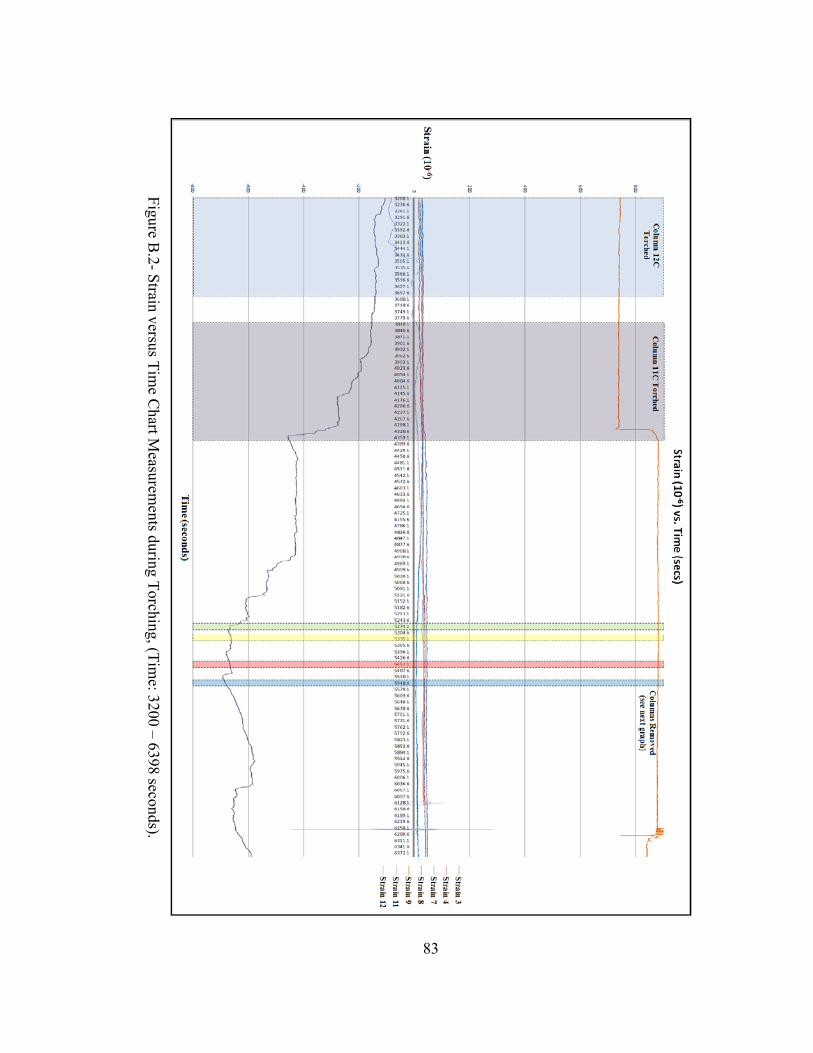
83
Figure B
.2- Strain versus T
ime C
hart Measurem
ents during Torching, (T
ime: 3200 – 6398 seconds).

84
Column 15C Torched @233secs -1465 seconds
Column 16C Torched @2141secs -2870.5 seconds
Column 12C Torched @3000secs -3676.9 seconds
Column 11C Torched @3799secs -4385.6 seconds
Strain 3 -23 up to 18-- increase of 41 22 to 21- -decrease of 1 22up to 26--increase of 4
29 up to 41--increase of 12
Strain 4 -11 up to 17-- increase of 28 17to 13- -decrease of 4 17up to 17--no change
18 up to 30--increase of 12
Strain 5 -11 up to 5-- increase of 16 gone gone gone
Strain 7 -5 up to 16 to -37--decrease of 32
-40 to -105-- decrease of 65
-101 up to -138--decrease of 37
-153 to -447--decrease of 294
Strain 8 -13 up to 7-- increase of 20 28 to 26--decrease of 2 28 up to 30--increase of 2 31 to 30--decrease of 1
Strain 9 112 fluctuates wildly to 774-increase 662
768 to 749 -- decrease of 19 746 to 741--decrease of 5
737 up to 880--increase of 143
Strain 11 -65 up to -38--increase of 27
128 fluctuates up finally ends at 120-- decrease of 8 133 to 0--decrease of 133 9 up to 12--increase of 3
Strain 12 -6 up to 16-- increase of 22 27 to 25--decrease of 2 25up to 29--increase of 4 29 up to 32--increase of 3
Column 15C Removed @ 5269 seconds
Column 16C Removed @ 5308 seconds
Column 11C Removed @ 5449 seconds
Column 12C Removed @ 5532 seconds
Strain 3 45 to 44--decrease of 1 45 to 44--decrease of 1 45 to 45--no change 45 to 45--no change
Strain 4 38-37--decrease of 1 38 to 38-- no change 38 to 37--decrease of 1 37 to 37--no change
Strain 5 gone gone gone gone
Strain 7 -650 to -652--decrease of 2
-671 to -668--decrease of 3
-669 to -668--decrease of 1
-690 to -691--decrease of 1
Strain 8 9 to 9--no change 8 to 8-- no change 8 to 6--decrease of 2 6 to 6--no change
Strain 9 882 to 882--no change 882 to 882-- no change 882 to 882-- no change 880 to 880-no change
Strain 11 29 to 29--no change 27 to 28--no change 33 to 33-- no change 33 to 33-- no change
Strain 12 32 to 32--no change 34 to 34-- no change 33 to 33-- no change 33 to 33-- no change
Figure B.3- Strain Values (10-6) and Change in Strain at Specific Times during Column
Torching and Removal.

85
Figure B.4- Change in Strain (∆ε) Measurement.
∆ε
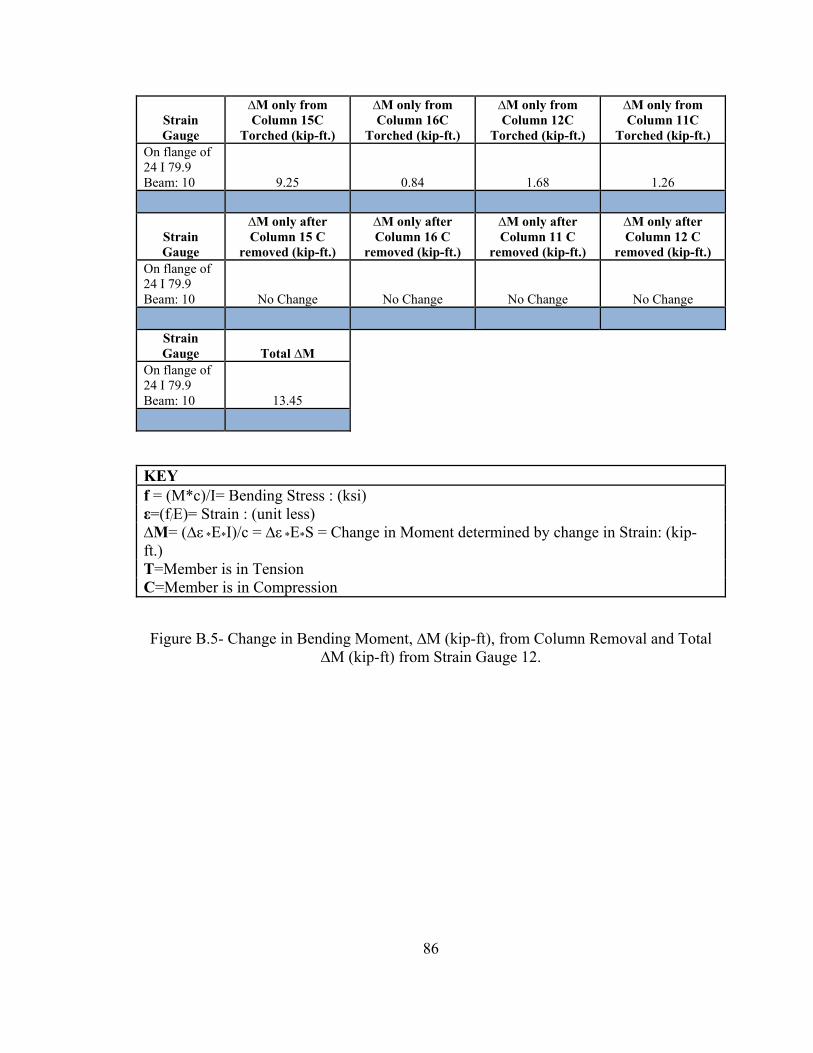
86
Strain Gauge
∆M only from Column 15C
Torched (kip-ft.)
∆M only from Column 16C
Torched (kip-ft.)
∆M only from Column 12C
Torched (kip-ft.)
∆M only from Column 11C
Torched (kip-ft.) On flange of 24 I 79.9 Beam: 10 9.25 0.84 1.68 1.26
Strain Gauge
∆M only after Column 15 C
removed (kip-ft.)
∆M only after Column 16 C
removed (kip-ft.)
∆M only after Column 11 C
removed (kip-ft.)
∆M only after Column 12 C
removed (kip-ft.) On flange of 24 I 79.9 Beam: 10 No Change No Change No Change No Change
Strain Gauge Total ∆M
On flange of 24 I 79.9 Beam: 10 13.45
Figure B.5- Change in Bending Moment, ∆M (kip-ft), from Column Removal and Total ∆M (kip-ft) from Strain Gauge 12.
KEY f = (M*c)/I= Bending Stress : (ksi) ε=(f/Ε)= Strain : (unit less) ∆M= (∆ε *Ε*I)/c = ∆ε *Ε*S = Change in Moment determined by change in Strain: (kip- ft.) T=Member is in Tension C=Member is in Compression

87
LIST OF REFERENCES
AISC, Manual of Steel Construction, 6th Edition, American Institute of Steel Construction (AIST), 1969.
GSA, Progressive Collapse Analysis and Design Guidelines for New Federal Office Buildings and Major Modernization Projects. General Services Administration (GSA), Washington, D.C., 2003.
SAP2000, 2008. Version Advanced 12.0.0, “Structural Analysis Program,” Computers and Structures Inc., 2008.
Sasani, M. and Serkan, S., 2008. "Progressive Collapse Resistance of Hotel San Diego," Journal of Structural Engineering. ASCE V. 134, No. 3, March 2008. Pp. 478-488.
Sezen, H. and Song, B.,2008. "Progressive Collapse Analysis of the Ohio Union Steel Frame Building." EuroSteel 2008. V. 3, No.5 2008.