Embed Size (px)
Citation preview
PROGRESS REPORT
Award Number: DE‐EE0001109
Award Recipient: Pennsylvania State University
Principal Investigator: Jim Freihaut, (814)863‐0083, [email protected]
Reporting Period: January 1, 2010 through March 31, 2010
Submission Date: April 5, 2010
Submitted to: U.S. DOE / NETL
Joseph Renk, (412) 386‐6406, [email protected]
Page: 1

Page: 2
Mr. Joe Renk Project Manager Power and Vehicle Technology Division NETL PO Box 10940 Pittsburgh, PA 15236‐0940 Dear Mr. Renk, Please find the attached Progress Report for the 4th quarter 2009 (Q4.09) for award number DE‐EE0001109 – “Mid Atlantic Region Clean Energy Application Center.” The center has invoiced $15,395.30 for Q4.09: • Jan. 2010: $6,253.36 • Feb. 2010: $12,653.82 • Mar 2010: $18,550.11 Total expenditures through March 31, 2010: $52,852.59 Total Cost Share through March 31, 2010: $68,842.54 Below you will find a brief synopsis of our activities (deliverables and tasks) for Q4.09. If you have any questions, please do not hesitate to contact John Cuttica (312‐996‐4382, [email protected]), Richard Sweetser (703‐707‐0293, [email protected] ), or Gearoid Foley, (609‐799‐2340, [email protected] ) Thank you, Larry Burton Gearoid Foley Jim Freihaut Joe Orlando Rich Sweetser Bill Valentine

Page: 3
Deliverable: 1 Task:1 Description: Updated Project Management Plan Activity: Will be submitted Q 1.10 Deliverable: 2.1 Task:2 Description: Baseline the Mid Atlantic Region with focus on Pennsylvania and New Jersey Activity: Activity refocused to delineating state and municipal CHP related policies relevant to the greater New York City metropolitan area as directed by results of DOE ITP EERE and CEAC Regional leader meeting held in January, 2010. Report summarizing result of Northeast and Mid Atlantic analysis indicated in Appendix A. Report summarizing technical and market potential of CHP, WHR, and District Systems applicable to the greater Mid Atlantic Region to be submitted Q 2.10.
Deliverable: 2.2 Task:2 Description: Baseline results check with cognizant DOE staff and State staffs Activity: Results submitted Q2.10 Results to be submitted Q 2.10 Deliverable: 2.3 Task:2 Description: Baseline results check with Architectural Engineering Design firms in Mid Atlantic Region Activity: Results submitted Q2.10 Deliverable: 2.4 Task:2 Description:

Page: 4
Establish 4 Year Mid Atlantic Center Operating Plan based on completed baseline analysis of 2.1 – 2.3 Activity: Results submitted Q2.10 Deliverable: 3.1 Web Site Re‐engineering of Mid Atlantic RAC Site Task: 3 Description: Re‐engineering of Mid Atlantic CEAC Website following DOE formatting and content Structure Activity: Continued interaction with central and regional Web formatting team discussions. Anticipated completion date of initial re‐engineered Mid Atlantic CEAC site including Web working group configuration implementations is: Q 2.10 Deliverable: 3. 2 Quarterly Newsletter Task:3 Description: Starting 2nd Quarter of Calendar Year 1 issue Quarterly electronic newsletter to AE Design firms, PSU Agricultural Extension Education offices, and collaborating Delaware Valley Industrial Resource Center (DVIRC) http://www.cceconomicdevelopment.com/service_dvirc, Pennsylvania Technical Assistance Program (PENNTAP) http://penntap.psu.edu, Philadelphia Industrial Development Corporation (PIDC) http://www.pidc‐pa.org offices. Activity: eNewsletter under development for distribution Q2.10 Deliverable: 3.3Workshops /Webinars on CHP, Waste Heat Recovery, District Energy Task 3 \ Description: Minimum of 3 and maximum of 6 workshops and/or Webinars on target application sectors Activity:

Page: 5
Coordination workshops have been held with PSU Ag Extension, DVIRC, PENNTAP and PIDC office to establish electronic and hardcopy newsletter distribution pathways; first quarterly report will be delivered in Q2.10. Mid Atlantic CEAC personnel conducted a Webinar with Lockheed Martin Corporate Facilities Strategic Team to discuss potential applications of CHP. Follow on site visits are planned. Mid Atlantic CEAC personnel attended GLOBALCON 2010 and met with members of the Association of Energy Engineers and local area Utilities to discuss potential applications of CHP as well as pending CHP related programs. Conducted necessary program planning to prepare for a CHP workshop scheduled for 4/8/10 2010 at the Innovation Center at the Navy Yard in Philadelphia. The DOE Mid Atlantic CEAC, in collaboration with the Penn State Agricultural Extension organization of Penn State University, held its first annual Biomass Based CHP Systems Short Course on March 18 and March 19, 2010 (See Appendix B). The seminar was attended by 35 personnel from throughout the U.S. and Canada. Feedback was quite positive and a number of follow‐up actions were established. CEU equivalents were those interested. “Building Design for CHP vs CHP to Building Design” was discussed at the Ben Franklin Center for High Performance Building Systems Research conference held March 19, 2010 at the Penn State Innovation Center. About 30 personnel from the Architectural Engineering community attended the membership conference held by the PSU Department of Architectural Engineering. Deliverable: 3.3 Seminars on CHP, Waste Heat Recovery, District Energy Task 3 Description: 8 – 12 Presentations and/or seminars presented on CHP, WHR or District Energy technologies to relevant technical, regulatory, legislative technical staff groups Activity Activity: Program (PENTAP) field engineering staff, State College, PA. (PENTAP has agreed to assign field engineers stationed in Philadelphia, Pittsburgh and central PA areas to assist DOE Mid‐Atlantic CEAC to identify potential PA manufacturing and agricultural processing sites for CHP

Page: 6
application and assist in performing Level I Feasibility Analysis in State of Pennsylvania). 40 attendees.
Legislative and regulatory staff interaction:
(See Appendix A relative to New Jersey related activities.)
Mid Atlantic CEAC personnel, with the cooperation of Penn State government affairs personnel, is establishing a series of legislative and utilities commission discussions relating to Pennsylvania State incentives for CHP in its Renewable Portfolio Standards legislation and its ACT 129 legislation wrt to energy efficiency incentive programs. This discussion plan is to be completed and implemented in Q2.10 and is reflective of the recent CEAC program focus on clearly delineating policy related issues inhibiting the broader application of CHP.
Related Educational and CHP Site Identification Activity and Support:
DVIRC has assigned two field engineers to assist MA CEAC with its outreach and site identification activities in the Delaware Valley (Southeast PA and Delaware).
PENNTAP has requested training of their 5 field engineers to identify potential PA industrial and manufacturing sites for CHP application. MA CEAC personnel have already given the initial seminars.
DVIRC and Mid Atlantic CEAC personnel will hold a CHP workshop in the Philadelphia Navy Yard office on April 8, 2010. (See Appendix C.).
Deliverable: 3.5 Clean Energy Installation Task:3 Description: Semi‐annual reporting of CHP Installations in Mid Atlantic Region Activity: State of Pennsylvania approves following CHP and Waste Heat to Power installations, totaling about 16 MW in installed power, under its Green Energy Program. The Mid Atlantic RAC is in contact with the site project managers and will use these installations as case studies, and eventually, site profile examples in its database update.
Bradford County, PA Craftmasters ‐‐ $1,358,869 to install and operate a back‐pressure steam turbine that would use existing excess steam to generate up to 1,000 kilowatts of electricity. The electricity produced would offset current electrical consumption.

Page: 7
Cumberland County, PA East Pennsboro Township ‐‐ $500,000 to purchase and install equipment to recover and use excess biogas from an existing anaerobic digester at a wastewater treatment plant and convert it to electrical power and heat. Digester gas is currently wasted. McKean County, PA American Refining Group Inc. ‐‐ $831.072 to install a steam turbine and an 875 kilowatt generator to produce electricity from existing high pressure steam while still using low pressure steam. Lancaster County, PA Mount Joy Wire Corporation ‐‐ $1,181,250 to purchase and install a 1 megawatt microturbine combined heat and power system to provide nearly all of its manufacturing process energy requirements. Lycoming County, PA Susquehanna Health ‐‐ $1,500,000 to install a new primary heat source at the Divine Providence Hospital. The project includes a 3.1 megawatt cogeneration unit with a reciprocating natural gas engine, backup boilers and chiller. Montgomery County, PA Abington Memorial Hospital ‐‐ $3,000,000 for the installation of a 4.5 megawatt natural gas‐fired combustion turbine that will produce steam as a byproduct and serve approximately 66 percent of its onsite electricity needs. Montour County Geisinger Medical Center ‐‐ $2,250,000 to install and operate a 5 megawatt gas‐fired turbine generator coupled with a waste heat‐fired tube boiler. This project is anticipated to generate approximately 20,000 megawatt hours of electricity per year that will be used onsite. Geisinger predicts saving more than $1.4 million annually. Philadelphia City AIMCO ‐‐ $1,087,100 for the installation of eight, 75 kilowatt natural gas‐fired reciprocating engines that will provide space heat and hot water at four separate apartment buildings serving approximately 40 percent of the onsite electrical needs. Philadelphia Gas Works ‐‐ $465,000 for the installation of a 300 kilowatt natural gas‐fired microturbine and absorption chiller that will provide approximately 40 percent of the electrical needs and provide supplemental building heat and cooling. Ongoing reporting on site installation, and upon installation, performance results in subsequent quarterly reports

Page: 8
Deliverable: 3.6 On‐Line Continuing Education CHP Technology & Site Feasibility Task:3
Description: With Penn State University continuing education and outreach departments establish an accredited on‐line course on CHP technology and identification of potential application for design engineers Activity: Course to be offered as part of Clean Energy and Sustainability degree being developed by Architectural Engineering Department at Penn State University Course to be completed by: Q4.10 Deliverable: 4.1 Feasibility Analysis of Potential CHP Application Task:4 Description: Up to 10 technical site evaluations on an as required basis (Level 1 and initiation of Level 2) Activity: High Visibility Sites Philadelphia Navy Shipyard October, 2009 to present: Mid Atlantic personnel have engaged facilities managers and site development personnel at the Philadelphia Navy Yard, a 1200 acre site being developed as an Energy Innovation Park for the City of Philadelphia by the Philadelphia Industrial Development Corporation (PIDC). CHP for building clusters and district energy for the campus are both under consideration. These analysis and meetings are continuing, with several meetings scheduled for Q1:10 Pittsburgh Gateway Center Mid Atlantic personnel have engaged site development planners at the Pittsburgh Gateway Development Area, a site in which the first Vocational Technical School in the U.S. is to be renovated to educate for Green Collar jobs of the future. The site may be expanded to include the new Pittsburgh Penguins’ Ice Facility and the surrounding acreage for residential and commercial building clustering. The Pittsburgh Gateway Corporation and the Pittsburgh Board of Education are the principals involved in the development project. CHP for building clusters

Page: 9
and district energy for the campus are both under consideration. These analysis and meetings are continuing, with several meetings scheduled for Q2:10 . The first site design conference is scheduled for April 5, 2010. Level I Feasibility Activities Lockheed Martin Corporation ‐ Moorestown, NJ Mid Atlantic personnel engaged Lockheed Martin corporate representatives it identify the potential for CHP at some of their facilities throughout the Mid Atlantic region. Subsequent to this meeting, Mid Atlantic personnel met with facilities personnel at the LM Moorestown, NJ facility and evaluate the site for CHP. A draft report demonstrating the economic advantage and significant greenhouse gas reduction potential for CHP was developed and presented for review by LM. Feedback on the report is by local LM staff is awaited before the final report is delivered to the local and corporate management. Lockheed Martin Corporation ‐ Valley Forge, PA Mid Atlantic personnel reviewed baseline data for some of the larger buildings at LM’s Valley Forge facility. A preliminary economic review was presented during the March 25th Webinar which also presented on general CHP attributes. A follow up site visit and Level I analysis for the Valley Forge facility is being planned for Q3.10. Capitol Power Plant Mid Atlantic personnel have engaged Capitol Hill Utilities Facilities management in December, 2010 through February of 2010 to assist in feasibility of installing a 7.5 MW natural gas turbine, duct‐fired HRSG, 1.05 MW BP steam turbine also producing 80,000 PPH steam at 205 psig. The plant will also replace a 200 psig to 100 psig PRV with a 2.1 MW steam turbine generator as part of the project. The MA CEAC has worked with the Architect of the Capitol and EPA’s CHP Partnership on the project. A suggested CHP design for the site has been established and is to be presented to appropriate D.C. authorities. The report is attached in Appendix D . NJ Natural Gas Mid Atlantic personnel will follow up with this gas utility to investigate potential sites for Level I study requested as a result of meetings at the NJ Clean Energy Conference. Mid Atlantic personnel together with NJ Natural Gas identified Brookdale Community College as being a suitable site for a Level I analysis. Brookdale have significant and concurrent electric and thermal loads and are in the process of evaluating a major renovation of their boiler plant. NJ Natural Gas are in contact with Brookdale to arrange for a site visit.

Page: 10
NJ Economic Development Authority Mid Atlantic personnel will follow up with the NJ EDA who own and operate numerous buildings in the state. The EDA is interested in the potential to have the CEAC provide Level I studies. The EDA is also very influential in NJ clean energy policy so integrating the CEAC with their efforts is recognized as having potential positive benefits in other areas. NJ Department of Corrections As a result of meetings at the NJ Clean Energy Conference, further dialogue will proceed on working with the NJ DEC to evaluate the potential for CHP at their various sites. Given the pending change in administration in NJ, these discussions will now occur in Q2, 2010. Deliverable: 4.2 High Visibility CHP Application Sites Task:4 Description: Develop and maintain a database of high visibility CHP, WHR, District Energy systems in the Mid Atlantic Region using the following metrics Activity: Philadelphia Navy Yard Mid Atlantic personnel have engaged facilities managers and site development personnel at the Philadelphia Navy Yard, a 1200 acre site being developed as an Energy Innovation Park for the City of Philadelphia by the Philadelphia Industrial Development Corporation (PIDC). CHP for building clusters and district energy for the campus are both under consideration. These analysis and meetings are continuing, with several meetings occurring in Q1.10 and more planned for Q2.10. Pittsburgh Gateway Center The first site CHP feasibility design discussions are the be held April 5, 2010. Deliverable: 4.3 CHP, Waste Heat Recovery Project Profiles Task:4 Description:

Page: 11
Develop 5 CHP focused project application profiles, 2 Waste Heat Recovery project application profiles and 2 District Energy project application profiles Activity: See Deliverable 3.5 above for sites that have been identified for both CHP and WHR profiling. Deliverable: 4.4 Education Assistance to DVIRC, PENTAP Partners Task:4 Description: Provide clean energy technology support to Mid Atlantic Industrial Assistance Centers (e.g. DVIRC, PENNTAP, etc.) – one day educational sessions Activity: Mid Atlantic held an introductory meeting with DVIRC personnel on March 10th to review the application, advantages and qualifiers for CHP.
DVIRC and PENNTAP along with Mid Atlantic CEAC personnel will hold a Delaware Valley CHP seminar for interested Delaware Valley plant managers on April 8, 2010. More such seminars will follow on a regular basis. The follow‐up sessions are planned when the new Level I Feasibility Analysis process is formulated by the Mid Atlantic RAC team.
Deliverable: 5.0 Feasibility Analysis of Potential CHP Application Task:5
Description: Submit reports as required Activity: Quarterly report Q4.09 included.

&
NEW JERSEY / NEW YORK / SOUTHWEST CT / ("NEW YORK METRO AREA") CLEAN ENERGY POLICY OPPORTUNITY DRAFT
Opportunities
Electricity prices in the New Jersey, New York, New England region are the highest in the nation.
State
Average Retail Price, All Sectors
(cents/kWh) Rank Hawaii 29.20 1Connecticut 17.79 2New York 16.57 3Massachusetts 16.27 4Rhode Island 16.01 5
Page: 12
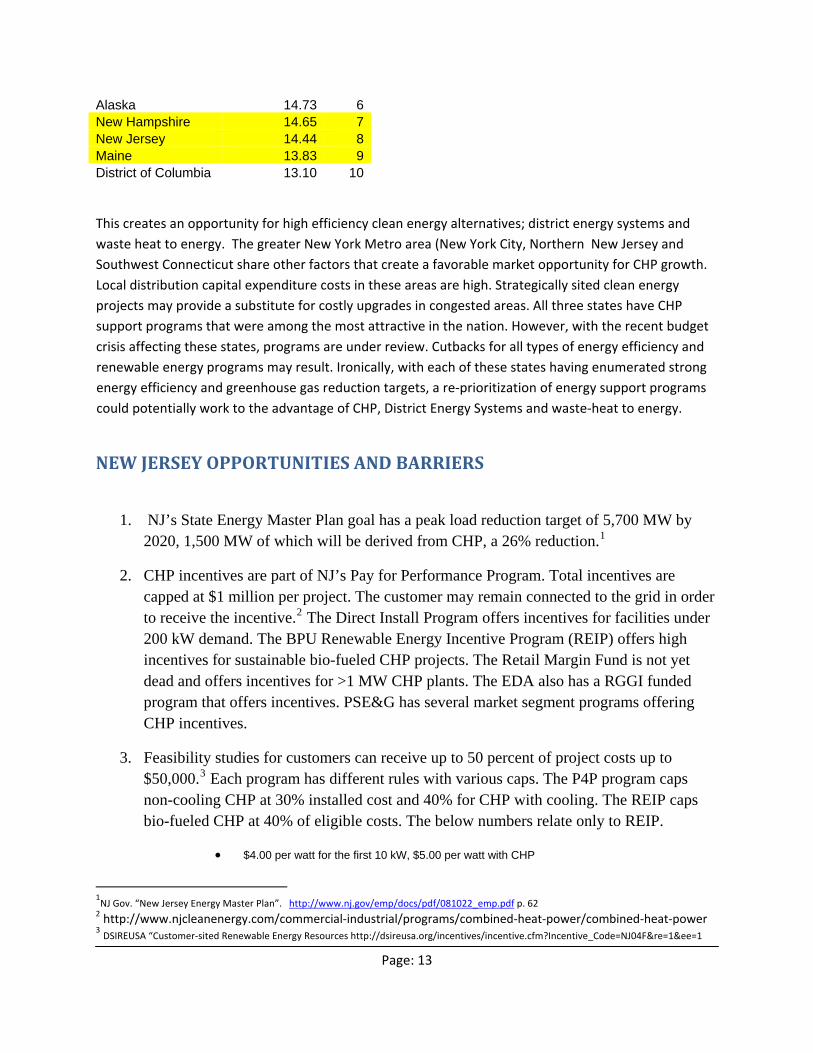
Page: 13
Alaska 14.73 6New Hampshire 14.65 7New Jersey 14.44 8Maine 13.83 9District of Columbia 13.10 10
This creates an opportunity for high efficiency clean energy alternatives; district energy systems and waste heat to energy. The greater New York Metro area (New York City, Northern New Jersey and Southwest Connecticut share other factors that create a favorable market opportunity for CHP growth. Local distribution capital expenditure costs in these areas are high. Strategically sited clean energy projects may provide a substitute for costly upgrades in congested areas. All three states have CHP support programs that were among the most attractive in the nation. However, with the recent budget crisis affecting these states, programs are under review. Cutbacks for all types of energy efficiency and renewable energy programs may result. Ironically, with each of these states having enumerated strong energy efficiency and greenhouse gas reduction targets, a re‐prioritization of energy support programs could potentially work to the advantage of CHP, District Energy Systems and waste‐heat to energy.
NEW JERSEY OPPORTUNITIES AND BARRIERS
1. NJ’s State Energy Master Plan goal has a peak load reduction target of 5,700 MW by 2020, 1,500 MW of which will be derived from CHP, a 26% reduction.1
2. CHP incentives are part of NJ’s Pay for Performance Program. Total incentives are capped at $1 million per project. The customer may remain connected to the grid in order to receive the incentive.2 The Direct Install Program offers incentives for facilities under 200 kW demand. The BPU Renewable Energy Incentive Program (REIP) offers high incentives for sustainable bio-fueled CHP projects. The Retail Margin Fund is not yet dead and offers incentives for >1 MW CHP plants. The EDA also has a RGGI funded program that offers incentives. PSE&G has several market segment programs offering CHP incentives.
3. Feasibility studies for customers can receive up to 50 percent of project costs up to $50,000.3 Each program has different rules with various caps. The P4P program caps non-cooling CHP at 30% installed cost and 40% for CHP with cooling. The REIP caps bio-fueled CHP at 40% of eligible costs. The below numbers relate only to REIP.
• $4.00 per watt for the first 10 kW, $5.00 per watt with CHP
1NJ Gov. “New Jersey Energy Master Plan”. http://www.nj.gov/emp/docs/pdf/081022_emp.pdf p. 62
2 http://www.njcleanenergy.com/commercial‐industrial/programs/combined‐heat‐power/combined‐heat‐power 3 DSIREUSA “Customer‐sited Renewable Energy Resources http://dsireusa.org/incentives/incentive.cfm?Incentive_Code=NJ04F&re=1&ee=1

Page: 14
• $3.00 per watt for the next 90 kW, $3.75 per watt with CHP • $1.50 per watt for the next 400 kW, $2.00 per watt with CHP • $0.15 per watt for the next 500 kW, $0.65 per watt with CHP
4. All new construction state buildings more than 15,000 square feet must achieve at least LEED Silver certification. CHP is an eligible technology to meet LEED standards4.
5. New Jersey recently enacted legislation permitting sales of electric power and thermal energy among non-affiliated entities. In order to allow for sale of electricity the CHP plant entity must supply thermal energy to the customer. It also creates new sales and use tax exemptions for the purchase or natural gas used for cogeneration. NJ A3339
6. The above (expanding the limits of microgrids or district systems), together with similar initiatives in NY (St. Luke's Hospital / Utica College) and the Energy Improvement Districts legislation in CT (EID's) offer a really unique opportunity for multiple customers, diverse electric and thermal loads, connected to a single project.
7. Interconnection Standards-According to the Network for New Energy Choices’ 2009 “Freeing the Grid” edition5, NJ was received a “B” from a grade scale of “A” to “F”. The recommendations to improve were to increase the limit from 2 MW to 20 MW. 6
8. Federal Incentives- There is a 10 percent investment tax credit for costs up to 15 MW for projects up to 50 MW. The project must exceed 60 percent in total energy efficiency. The ITC terminates on January 1, 2017.7 There is also the Modified Accelerated Cost Recovery System (MACRS) which allows for a five-year depreciation method. Fifty percent of the cost can be depreciated the first year. In order to qualify for MACRS, the system must be installed by the end of 2010.8
Barriers
The Mid-Atlantic CEAC in partnership with the Northeast CEAC have been following developments that may negatively impact CHP incentives in New Jersey.
4 One Bryant Park "the nation’s first commercial tower certified by the U.S. Green Building Council as “LEED Platinum
5 Network for New Energy Choices’ 2009 “Freeing the Grid” http://www.newenergychoices.org/uploads/FreeingTheGrid2009.pdf 6 http://www.newenergychoices.org/uploads/FreeingTheGrid2009.pdf 7 http://dsireusa.org/incentives/incentive.cfm?Incentive_Code=US02F&re=1&ee=1 8 DSIRE. “MACRS” http://www.dsireusa.org/incentives/incentive.cfm?Incentive_Code=US06f&State=federal¤tpageid=1&re=1

Page: 15
1. Up until October 1, 2009, NJ offered low interest loans and financing for CHP projects but due overwhelming demand, its Economic Development Agency cut funding for the Clean Energy Solutions Capital Investment (CESCI) program.9 10 kW while agricultural biogas was set at 500 kW and solar was 2 MW. It was recommended that 2 MW should be the standard across the board for all technologies and uses. Also another limiting factor is the limit on overall enrollment is set 1 percent of a utility’s peak demand. It was recommended that the limit should increase from 1 percent to 5 percent.
2. Governor Christie’s focus on balancing NJ’s budget is likely to reduce the scale of financial incentives available for CHP in the State. This is an issue facing many of the states in our region, as severe budget constraints have led to increased scrutiny of expenditures.
NE-CEAC and Mid-Atlantic CEAC staff have been following these developments. Our advice is that key stakeholders should be prepared to make the case for CHP, District Energy System programs in the State. Ironically, as New Jersey and other Northeastern states consider some retrenchment in existing programs for clean and renewable energy, new opportunities to promote CHP and DES may take shape. No states are proposing to rescind greenhouse gas reduction goals. More expensive means of securing those goals, such as New Jersey's very lucrative Solar support program, may be under closer scrutiny. When crafting new GHG strategies in light of new budget realities, legislators, key decision-makers and opinion leaders may be more receptive to the idea of shifting some of the scarce public incentive resources to lower cost, higher return CHP and DES projects
CHP Potential
Based upon data collected by Energy & Environmental Analysis, Inc., 2,062 MW of commercial and 1,563 MW of industrial CHP technical potential exists in New Jersey. In total, there is almost 3,625 MW of total CHP technical potential.
SICs Application
New Jersey
SICs Application
New Jersey
Commercial Industrial43 Post Offices 20 Food 148.2
4581 Airports 22 Textiles 56.5 6512 Office Buildings 801.2 24 Lumber and Wood 26.7 6513 Apartments 122.8 25 Furniture 6.5 7542 Carwashes 12.3 26 Paper 137.5 7832 Movie Theaters 27 Printing/Publishing
9 NJ Economic Development Agency. “Clean Energy Solutions Capital Investment” http://www.njeda.com/web/Aspx_pg/Templates/Npic_Text.aspx?Doc_Id=1078&menuid=1360&topid=722&levelid=6&midid=1357

Page: 16
8412 Museums 3 28 Chemicals 830.7 4222 Warehouses 32.4 29 Petroleum Refining 68.8
4952 Water Treatment/Sanitary 68.1 30 Rubber/Misc. Plastics 74.8
5200 Big Box Retail 32 Stone/Clay/Glass 5411 Food Sales 13.7 33 Primary Metals 42.9 5812 Restaurants 61.6 34 Fabricated Metals 48.7
7011 Hotels 207.1 35 Machinery/Computer Equip 29.5
7211 Laundries 9.7 37 Transportation Equip. 9.1 7991 Health Clubs 17.8 38 Instruments 43.3 7992 Golf/Country Clubs 20.1 39 Misc. Manufacturing 39.7 8051 Nursing Homes 87.9 8062 Hospitals 164.4
8211 Schools 104.6
8221 Colleges/Universities 311
9223 Prisons 24.5
Total 2,062.20 Total 1562.9
Although our proposal is to focus on the greater New York Metro area of Northern NJ, New York City / Long Island region and Southwestern CT, we do not have the data available to specify how much of the potential NJ resource base is in this region. We can do some analysis of the location of major economic activity using data from BLS, Census, State Labor Department and elsewhere to give a rough estimation of the geographic location of this potential.
RAC Strength/Weaknesses
The Northeast Clean Energy Application Center (NE-CEAC) has several strengths when advancing CHP policy. NE-CEAC is compromised of two organizations, UMASS and Pace University’s Energy and Climate Center (PECC), the latter being located in NY. PECC has over 20 years experience advancing clean energy generation focusing on CHP. The NE-CEAC has produced by far the most case studies of the other RACs.
Over the years, the NE-CEAC has developed critical relationships with trade associations, industry groups, key policymakers and stakeholder organizations, as well as financing and regulatory authorities. Our strategic partnership with the Northeast CHP Initiative has given us a platform to work with project developers, equipment manufacturers, and interested end-users to assist in creating a more favorable market environment for Clean Energy Applications.
In New Jersey (and NY and other New England States) we have done presentations at numerous clean energy events, target market workshops, education and training sessions. Specific to New Jersey, we have presented at and attended key conferences including the NJ Association of
Page: 17
Energy Engineers Annual Meeting in 2009, a major clean energy event at New Jersey Institute of Technology (NJIT) in June of 2009, met with agencies and policy-makers including the NJ-BPU and the NJ Economic Development Authority (NJEDA) and the Governors Office.
The one weakness that the NE-CEAC has had in the past is lack of sufficient personnel to accomplish all the goals it envisioned. With the commitment that the DOE has shown NE-CEAC, PECC has been able to hire additional personnel to address these issues. The NE-CEAC will work closely with the Mid-Atlantic Clean Energy Application Center to promote CHP.
Key messages
• Who is the audience?
There are several key stakeholders that the NE-CEAC believes is its audience. Generally, stakeholders include end use customers, developers, utilities and state officials. Concerning policy related issues; NE-CEAC will be working with state officials including the New Jersey Board of Public Utilities and its energy department, the Office of Clean Energy, state and local governments, and the governor’s office. As importantly, we will partner with NJ AEE, project developers, equipment manufacturers and other key market representatives.
• What do they care about?
The majority of potentially interested parties primarily cares about return on investment, though this is not the sole driver. It is important to demonstrate the opportunities for technically feasible, and economically viable CHP and District energy projects. Other important drivers include state and other institutional commitments to meeting greenhouse gas reduction targets. There has been no indication of a retraction of State Energy Master Plan goals that this state, or any other that has made similar commitments. Colleges and Universities, hospitals, local governments and certain other businesses have made carbon reduction a part of their longer term planning and capital strategy. It is incumbent upon us to deliver the message that CHP, District Energy Systems and Waste-heat-to-energy projects represent a near term, readily available and lower cost alternative to meeting strategic emission reduction goals, as compared to many other alternative investments.
• How to get their attention?
NE-CEAC continually must advise each organization of the benefits of CHP and advance the promulgation of CHP technologies both short-term and long-term. NE-CEAC will work with each organization by participating at meetings, deepening relationships with project developers, equipment manufacturers, trade associations and key market makers. We will continue working with state officials, submitting comments on policy rule changes and incentives and acting as a liaison between these organizations and other stakeholders.

Page: 18
There are some great stories to be told in New Jersey and these need much wider dissemenation. For example focusing on the multiple benefits that have been achieved by the Princeton project which serves as a model for energy and cost savings, reducing demand on the local distribution system and markedly reducing greenhouse gas emissions, resulting in a major, and cost-effective contribution to the University's climate action plan.
NEW YORK STATE CLEAN ENERGY POLICY OPPORTUNITY DRAFT
Opportunities
Electricity prices in New York and New England region are the highest in the nation.
State
Average Retail Price, All Sectors
(cents/kWh) Rank Hawaii 29.20 1Connecticut 17.79 2New York 16.57 3Massachusetts 16.27 4Rhode Island 16.01 5Alaska 14.73 6New Hampshire 14.65 7New Jersey 14.44 8Maine 13.83 9District of Columbia 13.10 10
Presenting the Statewide average for New York, masks the divide between prices in Downstate New York (New York City, Long Island) and the rest of the State.
NYS PUBLIC SERVICE COMMISSION'S TYPICAL BILLS SEMI‐ANNUAL REPORT Customer Type Size (kW) Load Factor Rate Commercial Customer 250 50% $ 0.21 Commercial Customer 250 30% $ 0.26

Page: 19
This creates an opportunity for high efficiency clean energy alternatives; district energy systems and waste heat to energy. The greater New York Metro area (New York City, Northern New Jersey and Southwest Connecticut share other factors that create a favorable market opportunity for CHP growth. Local distribution capital expenditure costs in these areas are high. Strategically sited clean energy projects may provide a substitute for costly upgrades in congested areas. All three states have CHP support programs that were among the most attractive in the nation. However, with the recent budget crisis affecting these states, programs are under review. Cutbacks for all types of energy efficiency and renewable energy programs may result. Ironically, with each of these states having enumerated strong energy efficiency and greenhouse gas reduction targets, a re‐prioritization of energy support programs could potentially work to the advantage of CHP, District Energy Systems and waste‐heat to energy.
9. NY has several initiatives in place that do or could in the future contain provisions to advance the implementation of CHP on a larger scale. Most importantly, the Systems Benefits Charge (SBC) energy incentive financing mechanism, which is renewed on a three year cycle is up for renewal. SBC III is set to expire June 2011. The nature, size, and scope of eligible funding will be determined for SBC IV over the course of the next 12 to 14 months.
10. Other initiatives that may offer opportunities for a CHP/DES role, or expanded role, include the Energy Efficiency Portfolio Standard (EEPS), Renewable Portfolio Standard (RPS), NYS Smart Grid Consortium, Con Edison's DG Collaborative, Mayor Bloomberg’s PlaNYC, NY Battery Energy Storage Technology (NY BEST),and Property Assisted Clean Energy (PACE) bonds.
11. The interconnection standards for New York State were recently updated in February 2010.10 Specifically, the following changes occurred: (1) the specification of residential micro-CHP and fuel cell interconnection cost responsibility, (2) the incorporation of micro-CHP and fuel cells into the references the SIR make to net metering up to 10 kW, and (3) the addition of a definition for micro-CHP and fuel cell definitions.
12. Per Case 09-E-0109, NYS PSC ordered on May 18, 2009 that CHP systems sized at 1 MW and meeting specified efficiency and emission provisions can elect to take service under standby rates or the parent tariff, whichever is more favorable, until May 31, 2015 when the current exemption is set to expire. The EPA conducted a study of successful standby rates in the country. Orange & Rockland Utilities, a NY utility was cited favorably in its design of standby rates.11
10 These updated requirements can be found at the New York State PSC website, Distributed Generation Information, http://www.dps.state.ny.us/distgen.htm. 11 EPA. “Standby rates for Customer‐Sited Generation”. http://www.epa.gov/CHP/documents/standby_rates.pdf

Page: 20
13. On December 16, 2009 as part of the Renewable Portfolio Standard (RPS), the PSC approved funding for $30 million each year to be allocated downstate for PV, anaerobic digesters and fuel cell projects.12 The downstate region of NY has contributed more into the RPS than has received a benefit out. On January 15, 2010, Staff discussed straw proposals.13 Presently, there is no CHP requirement in the RPS.
14. The PSC in Case 02-M-051514 on April 17, 2002 directed ordered 1115 gas utility
companies to create rates for DG customers. These rates were frozen until 2007 to allow for greater DG penetration. The rates are for firm delivery service for units under 50 MW. Customers with units greater than 5 MW pays a demand charge. As of March 2010, 35 C&I customers are taking service under the new DG rates, while 217 customers are taking service under the old DG rate. The customers represent 428 MW and 12,413,888 dth.16
15. NYSERDA currently has several programs available to customers interested in CHP including:
New Construction Program, http://www.nyserda.org/programs/New_Construction/default.asp
Existing Facilities Program, http://www.nyserda.org/programs/Existing_Facilities/default.html
FlexTech Program (cost-shared energy studies) http://www.nyserda.org/programs/flextech.asp
12 New York State Public Service Commission. “PSC Sets Expanded Renewable Energy Goal” http://readme.readmedia.com/PSC‐Sets‐Expanded‐
Renewable‐Energy‐Goal/1000487
13 New York State Public Service Commission. “03‐E‐0188: NY RPS Proceeding Home”. http://www.dps.state.ny.us/03e0188.htm
14 New York State Public Service Commission. “Case 02‐M‐0515”. http://www3.dps.state.ny.us/pscweb/WebFileRoom.nsf/Web/047CACD1286149B285256DF10075636D/$File/doc11651.pdf?OpenElement 15 The Brooklyn Union Gas Company d/b/a KeySpan Energy Delivery New York, KeySpan Gas East Corporation d/b/a KeySpan Energy Delivery
Long Island, Central Hudson Gas & Electric Corporation, Consolidated Edison Company of New York, Inc., New York State Electric & Gas Corporation, Niagara Mohawk Power Corporation, Orange and Rockland Utilities, Inc., Rochester Gas and Electric Corporation and National Fuel Gas Distribution Corporation, St. Lawrence Gas Corporation and Corning Natural Gas Corporation
16 NYS PSC, Thomas Cooney, Chief, Gas Rates Section. Interviewed by Tom Kelly, Pace University Energy & Climate Center. March 8, 2010.

Page: 21
NYSERDA expects that there may be one more announcement of the DG as CHP Program Opportunity Notice (PON) that may occur in the Summer of 2010.
16. Table 1 provides the current CHP incentives levels.
Table 1 Upstate Con Edison
Combined Heat and Power
$0.10/kWh + $600/kW*
$0.10/kWh + $750/kW*
*kW is summer peak demand reduction, not installed capacity17
Incentives are greater in the Con Edison service territory because of the greater need to reduce congestion on the grid. Total incentives may not exceed $2 million.
17. Federal Incentives- There is a 10 percent investment tax credit for costs up to 15 MW for projects up to 50 MW. The project must exceed 60 percent in total energy efficiency. The ITC terminates on January 1, 2017. There is also the Modified Accelerated Cost Recovery System (MACRS) which allows for a five-year depreciation method. Fifty percent of the cost can be depreciated the first year. In order to qualify for MACRS, the system must be installed by the end of 2010.18
17 NYSERDA “Combined Heat and Power Incentives”. http://www.nyserda.org/programs/Existing_Facilities/chp.html 18 EPA, “MACRS” http://www.epa.gov/chp/incentives/index.html

Page: 22
Barriers
One of the most attractive markets for CHP is in New York City. However, siting projects in Manhattan and other parts of New York can be challenging, time consuming and significantly more costly than the typical project.
Funding projects at this time, given the state of the credit markets had proven problematic. While much progress has been made on interconnection and codes, siting and permitting issues, other issues remain. One example is Con Edison's fault current problems limiting DG systems operating synchronous generators that lack protective equipment. In order to add such generators to the system, the fault current margin must be sufficient to allow for their operation. Con Edison has developed a Fault Current Margin Queing Position Process in which applicants interested in adding synchronous generators to the system must wait until the system is able to support it.
As described in the Opportunities section, there are presently no procurement requirements for CHP requirements within the RPS nor is there yet a place for CHP in new initiatives like PACE
With the recent budget crisis affecting New York and other Northeast states, energy incentive programs are under scrutiny. on December 4, 2009, NYS transferred $90 million in RGGI proceeds to help balance its budget.19
Cutbacks for all types of energy efficiency and renewable energy programs may result.
Ironically, with each of these states having enumerated strong energy efficiency and greenhouse gas reduction targets, a re-prioritization of energy support programs could potentially work to the advantage of CHP, District Energy Systems and waste-heat to energy.
Local distribution capital expenditure costs New York City and the surrounding areas is quite high. Strategically sited clean energy projects may provide a substitute for costly upgrades in congested areas. Con Edison is starting a DG collaborative in Spring 2010 where this issue, among others pertinent to CHP/DES, will be taken up.
19 NYSERDA. “New York’s RGGI Funded Programs”. http://www.nyserda.org/RGGI/3rdquarter2009report.pdf

Page: 23
1.
CHP Potential Based upon data collected by Energy & Environmental Analysis, Inc., 6,111.5 MW of commercial and 2,053.2 MW of commercial CHP technical potential exists in New York. In total, there is almost 8,165 MW of total CHP technical potential.
NY CHP Downstate* Technical Potential (2005 Data) Total MW
SICs Application Commercial
SICs Application Industrial
New York New York 43 Post Offices 33.2 20 Food 324.4
4581 Airports 4.1 22 Textiles 68.9 6512 Office Buildings 1,678.10 24 Lumber and Wood 6.5 6513 Apartments 791 25 Furniture 1.7 7542 Carwashes 5.9 26 Paper 342.7 7832 Movie Theaters 8.7 27 Printing/Publishing 27.1 8412 Museums 25.5 28 Chemicals 870.9 4222 Warehouses 18.7 29 Petroleum Refining 20.6 4952 Water Treatment/Sanitary 72.1 30 Rubber/Misc. Plastics 85.1 5200 Big Box Retail 417.9 32 Stone/Clay/Glass 152.7 5411 Food Sales 167.1 33 Primary Metals 7.8 5812 Restaurants 136.4 34 Fabricated Metals 13.8 7011 Hotels 419.9 35 Machinery/Computer Equip 0 7211 Laundries 12.5 37 Transportation Equip. 117.9 7991 Health Clubs 77.1 38 Instruments 7.5 7992 Golf/Country Clubs 33.5 39 Misc. Manufacturing 5.6 8051 Nursing Homes 487.4
8062 Hospitals 431.8
8211 Schools 299.7
8221 Colleges/Universities 921.5
9223 Prisons 69.4
Total 6111.5 Total 2053.2 *Downstate New York includes the five boroughs of New York City, Westchester Co., and all of Long Island
CHP Market Penetration Estimates
Downstate New York Market Penetration (2020)

Page: 24
50-500 kW
(MW) 500-1 MW
(MW) 1-5 MW (MW)
5-20 MW (MW)
>20 MW (MW)
Total MW
Total 105.1 242.7 708.2 193.2 93.1 1342.4
• Market penetration results are from an analysis for NYSERDA that was conducted in 200820 • Energy prices and economic conditions reflect forecasts created at the time • These results are for a business as usual scenario (no added incentives for CHP)
RAC Strength/Weaknesses
The Northeast Clean Energy Application Center (NE-CEAC) has several strengths when advancing CHP policy. NE-CEAC is compromised of two organizations, UMASS and Pace University’s Energy and Climate Center (PECC), the latter being located in NY. PECC has over 20 years experience advancing clean energy generation focusing on CHP. The NE-CEAC has produced by far the most case studies of the other RACs.
Our strategic partnership with the Northeast CHP Initiative has given us a platform to work with project developers, equipment manufacturers, and interested end-users to assist in creating a more favorable market environment for Clean Energy Applications. NECHPI conducts regular meetings around the region and holds an annual conference in one of our member states. The members of NECHPI include gas and electric utilities, project developers, equipment manufacturers, key end-user organizations as well as members of the NE-CEAC. The 2010 Chair of NECHPI is John Rathbun of National Grid.
Over the years, the NE-CEAC has developed critical relationships with trade associations, industry groups, key policymakers and stakeholder organizations, as well as financing and regulatory authorities.
In New York we have done presentations at numerous clean energy events, target market workshops, education and training sessions. Specific to New York, we have presented at and attended key conferences including the Association of Energy Engineers, Food Processing Industry, Brownfields redevelopment, Hospital Associations (Greater NY Hospital Association, Dormitory Authority and others). We routinely meet with agencies and policy-makers including
20 NYSERDA. March 2009. Draft Report: “Quantifying the Environmental and Economic Benefits of Increased Deployment of Combined Heat and Power Technologies in New York State and the Impacts of Various Regulatory Scenarios.”

Page: 25
the NYSERDA, PSC, DASNY, Economic Development Agencies (NY ESDC and NYC-EDC) the Legislature, Governors Office and other key stakeholders.
The one weakness that the NE-CEAC has had in the past is lack of sufficient personnel to accomplish all the goals it envisioned. With the commitment that the DOE has shown NE-CEAC, PECC has been able to hire additional personnel to address these issues. One of PECC’s most recent additions has been a staff member who works in Albany advancing CHP policy to state legislators.
Key messages
• Who is the audience?
There are several key stakeholders that the NE-CEAC believes is its audience. Generally, stakeholders include end use customers, developers, equipment manufacturers, utilities and state officials. Concerning policy related issues; NE-CEAC will be working with state officials including the New York State Department of Environmental Conservation, the New York State Public Service Commission and the New York State Energy Research & Development Authority (NYSERDA).
We have heard over and over from those active in the marketplace that financing is a critical issue. NECEAC has formed a close relationship with some very innovative public finance senior staff in agencies that provide capital to projects in the State. We intend to stregthen these relationships and work toward encouraging the development of new financial mechanisms that will lead to greater CHP / DES project development. 21
• What do they care about?
The majority of potentially interested parties primarily cares about return on investment, though this is not the sole driver. It is important to demonstrate the opportunities for technically feasible, and economically viable CHP and District energy projects. Other important drivers include state and other institutional commitments to meeting greenhouse gas reduction targets. There has been no indication of a retraction of energy and environmental goals that this state, or any other that has made similar commitments. Colleges and Universities, hospitals, local governments and certain other businesses have made carbon reduction a part of their longer term planning and capital strategy. It is incumbent upon us to deliver the message that CHP, District Energy 21For example, NECEAC has been in consultation with Senior Public Finance Staff at the Dormitory Authority of the State of NY to encourage the creation of off‐balance sheet, 3rd party, and tax exempt financing tools for severely capital constrained sectors, like hospitals, that are interested in CHP.
Page: 26
• How to get their attention?
NE-CEAC continually must advise each organization of the benefits of CHP and advance the promulgation of CHP technologies both short-term and long-term. NE-CEAC will work with each organization by participating at meetings, deepening relationships with project developers, equipment manufacturers, trade associations and key market makers. We will continue working with state officials, submitting comments on policy rule changes and incentives and acting as a liaison between these organizations and other stakeholders.
There are some many great stories to be told in New York and these need much wider dissemenation. For example focusing on the fleet of existing CHP in New York State and the benefits provided.
Data mining the NYSERDA CHP/DG Data Integrator database to detail multiple benefits that have been achieved by projects in specific target markets. These flagship projects, including several EPA/CHP Partnership Award winning projects, serve as a models for energy and cost savings, reducing demand on the local distribution system, improving reliability and markedly reducing greenhouse gas emissions.

Appendix B: PSU Biomass Based CHP Shortcourse (March 17, 18 – 2010)
Page: 27

Page: 28

Page: 29
Appendix C: DOE Mid Atlantic CEAC + DVIRC + PENNTAP CHP Shortcourse

Page: 30

Page: 31
Appendix D: Capitol Hill CHP Feasibility Analysis

ARCHITECT OF THE CAPITOL Review of proposed Capitol Power Plant CHP Phase 1 Project
CAPITOL POWER PLANT PROJECT
REVIEW
Richard Sweetser Washington DC Office 12020 Meadowville Court Herndon, VA 20170
Phone: (703) 707-0293 Fax: (703) 707-9566 E-mail: [email protected]
Bruce Hedman ICF International 1655 North Fort Myer Dr. Arlington, VA 22209
Phone: (703) 373-6632 Fax: (703) 528-5106 E-mail: [email protected]

Page 2 of 19
DISCLAIMER
This analysis was sponsored by the United States Department of Energy (DOE) and the Environmental Protection Agency (EPA). Neither DOE nor EPA make any warranty, express or implied, or assume any legal liability or responsibility for the accuracy, completeness, or usefulness of any information, product, or process disclosed. Reference to any specific commercial product, process, or service by trade name, trademark, manufacturer, or otherwise, does not necessarily constitute or imply its endorsement, recommendation, or favoring by the United States Government or any agency thereof.
DOE’S CLEAN ENERGY APPLICATION CENTERS
The Department of Energy (DOE) has established Clean Energy Application Centers (RACs) to promote and assist in transforming the market for clean heat and power throughout the U.S. The DOE Clean Energy RACs offer local, individualized solutions to customers on specific projects, provide end-user education and outreach, and lead initiatives to educate state policymakers and regulators. The Mid-Atlantic Clean Energy Application Center is based at the Navy Yard, Philadelphia. It was created with funding from the US DOE to promote the use of CHP in the Mid-Atlantic Region. The objectives of the Center are to reduce the perceived risk of CHP to users, foster CHP as a viable technical and economic option for the participating region, and to capitalize on existing regional CHP resources. More regional and national information is available on our website at: http://www.maceac.psu.edu.
EPA COMBINED HEAT AND POWER PARTNERSHIP
The EPA CHP Partnership is a voluntary program that seeks to reduce the environmental impact of power generation by promoting the use of combined heat and power (CHP). The Partnership works closely with energy users, the CHP industry, state and local governments, and other stakeholders to support the development of new projects and promote their energy, environmental, and economic benefits. The Partnership provides informational resources about CHP technologies, incentives, emissions profiles, and many other areas on its website at: http://www.epa.gov/chp.

Page 3 of 19
EXECUTIVE SUMMARY Table ES-1 provides a summary of the financial, primary energy and environmental
benefits of installing the nominal 7.5 MW CHP system at the Capital Power Plant
based on the recommended approach of using the “all fossil average” for displaced
electricity.
Under the current CPP electric and natural gas schedules the CHP plant annual
operating cost is about $15.7 million and the displaced electricity and steam cost for
the basic CHP system is about $ 20.2 million. The basic CHP system as currently
configured would save the CPP about $4.32 million annually. The enhanced CHP
system would add the low pressure steam turbine generator contributing an
additional $2.5 million in annual energy savings.
Primary energy savings and GHG emissions reductions are significant and presented
in Table ES-1 displacing grid electricity based on the “all fossil average” using EPA’s
eGrid Model.
Table ES‐1 Performance Summary
Annual Basic CHP System Enhanced CHP System
Operating Savings $4,322,913 $6,765,902 Primary Energy Savings (MMBTU) 286,930 482,937
CO2 emissions reduction (tons) 42,099 60,772
Equivalent car removal 6,954 10,038
Equivalent forest planted (acres) 8,675 12,523

Page 4 of 19
BACKGROUND The Architect of the Capitol (AOC) requested general feasibility review of the
proposed phase 1 CHP Plant project based on the design material provided by Ross
International. DOE’s Mid-Atlantic Clean Energy Application Center (MA-CEAC) also
engaged EPA’s CHP Partnership (CHPP) in this review, particularly with respect to
atmospheric emission implications.
CAPITOL POWER PLANT (CPP) PHASE 1 CHP PLANT The Capitol Plant Provides steam, chilled water, and domestic water to AOC facilities
plus Union Station, Government Printing Office, Thurgood Federal judiciary Building,
Postal Square, and Folger Library. Figure 1 shows the CPP and general site location
of the Phase 1 CHP plant.
Figure 1 – CPP Site Layout
Page 5 of 19
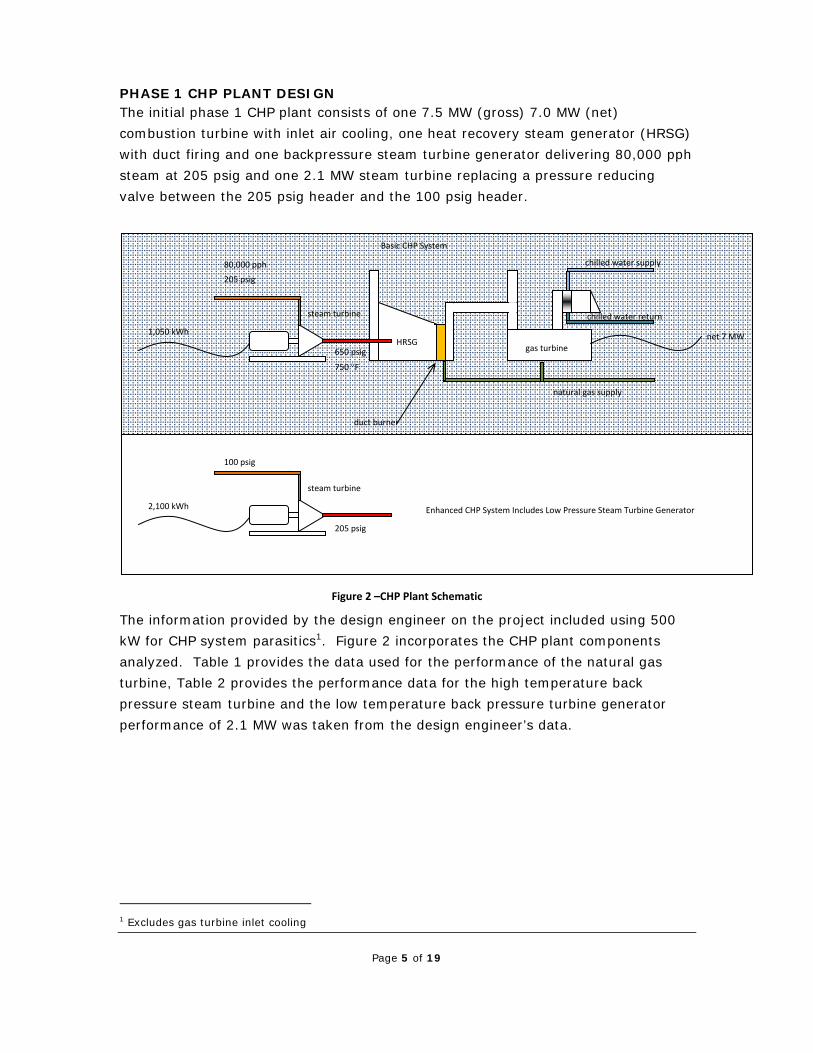
PHASE 1 CHP PLANT DESIGN The initial phase 1 CHP plant consists of one 7.5 MW (gross) 7.0 MW (net)
combustion turbine with inlet air cooling, one heat recovery steam generator (HRSG)
with duct firing and one backpressure steam turbine generator delivering 80,000 pph
steam at 205 psig and one 2.1 MW steam turbine replacing a pressure reducing
valve between the 205 psig header and the 100 psig header.
Figure 2 –CHP Plant Schematic
The information provided by the design engineer on the project included using 500
kW for CHP system parasitics1. Figure 2 incorporates the CHP plant components
analyzed. Table 1 provides the data used for the performance of the natural gas
turbine, Table 2 provides the performance data for the high temperature back
pressure steam turbine and the low temperature back pressure turbine generator
performance of 2.1 MW was taken from the design engineer’s data.
1 Excludes gas turbine inlet cooling
steam turbine
HRSG 650 psig
750 °F
80,000 pph
205 psig
duct burner
1,050 kWh net 7 MW gas turbine
natural gas supply
chilled water supply
chilled water return
steam turbine
205 psig
100 psig
2,100 kWh
Basic CHP System
Enhanced CHP System Includes Low Pressure Steam Turbine Generator

Page 6 of 19
Table 1 –Combustion Turbine Performance Data
Combustion Turbine Data
Output Power, kWe ISO: 15°C (59°F), sea level 7520
Heat Rate, kJ/kWe-hr (Btu/kWe-hr) 10 650 (10,100)
Exhaust Flow, kg/hr (lb/hr) 97 000 (213,840)
Exhaust Temperature, °C (°F) 490 (910)
Table 2 ‐1,050 kW Steam Turbine Data
The CHP plant is designed to produce 80,000 ppl of steam. Figure 3 shows that
steam demand on the CPP always exceeds the CHP plant’s desing capacity. Figure 4
shows that the average hourly steam load on the CPP exceeds the CHP plant’s
58,400 KLBS/month production. Therefore, the CPP system does not economically
limit the operation of the CHP plant.
Figure 3 – Campus Steam Demand

Page 7 of 19
Figure 4 –Average Hourly Campus Steam Usage
Figure 5 – Electricity Demand
Figure 5 shows the Peak CPP monthly electric demand (blue dotted line), electric
chiller system demand assuming 0.95 kW/ton performance (purple dash-dotted line).
This shows that the CPP electric demand is driven by chiller performance and cooling
load requirements. Figure 5 also provides AOC facilities peak demand (red dashed
line) and total system demand (AOC facilities plus CPP) (green line).

Page 8 of 19
Figure 6 – Maximum and Minimum Electric Demand
The CPP electric demand is driven by the chiller plant. Figure 6 provides monthly
min/max electric demand on the CPP. The CHP plant capacity as defined by the
natural gas turbine, high pressure steam turbine and low pressure steam turbine
generators exceeds the minimum electric demand in certain months. Since the CHP
plant is not steam capacity limited, but is electric capacity limited the plant will be
designed as an electric load following. The design requirement given by the AOC is
that the steam turbines should both run at full capacity, the natural gas turbine will
be the electric load following device and thermal capacity will be segmented by the
duct burner during part load operation of the gas turbine.
Figure 7 – CHP Electricity Operating Scheme

Page 9 of 19
Figure 7 presents the monthly operating scheme for the CHP plant showing the two
steam turbines performing at full capacity and the natural gas turbine in electric load
following mode.
CHP PLANT ECONOMICS The CPP currently purchases electricity and natural gas on a federal government
schedule. The average electricity price for 2009 was 13.28 ¢/kWh2 (Table 3) and
$1.18/therm2 (Table 4). We understand that these utility schedules were negotiated
in 2008. The electric cost has remained relatively stable, natural gas prices have
dramatically changed since that time. Currently a 2 year strip of natural gas can be
purchased for under $8/decatherm.
Table 3 – 2008 ‐ 2010 CPP Monthly Electric Cost
¢/kWh OCT NOV DEC JAN FEB MAR APR MAY JUN JUL AUG SEP FY 2010 15.15 15.49 13.93 13.80 FY 2009 13.36 13.73 13.67 13.72 13.88 13.94 13.50 13.45 13.28 13.33 13.29 13.28 FY 2008 13.86 15.45 14.26 14.05 14.49 14.43 13.96 13.83 13.59 13.31 13.18 13.08
Table 4 ‐ 2008 and 2009 CPP Monthly Natural Gas Cost
$/THERM OCT NOV DEC JAN FEB MAR APR MAY JUN JUL AUG SEP FY 2010 1.28 1.23 1.23 0.94 FY 2009 1.16 1.19 1.25 1.28 1.26 1.20 1.14 1.10 1.12 1.13 1.17 1.18 FY 2008 1.14 1.23 1.29 1.35 1.34 1.29 1.27 1.31 1.31 1.30 1.29 1.29
Current operations and maintenance (O&M) contracts cost about 0.95¢/kWh
including necessary core replacement. The O&M cost for a backpressure steam
turbine generator ranges from 0.02¢ to 0.05¢/kWh. Therefore a conservative
number for the basic or enhanced CHP plant is 1.0¢/kWh as the LPST operation and
maintenance has little impact on these overall costs.
2 Table shows cumulative year-to-date average so September depicts the annual average for the fiscal year.
Page 10 of 19
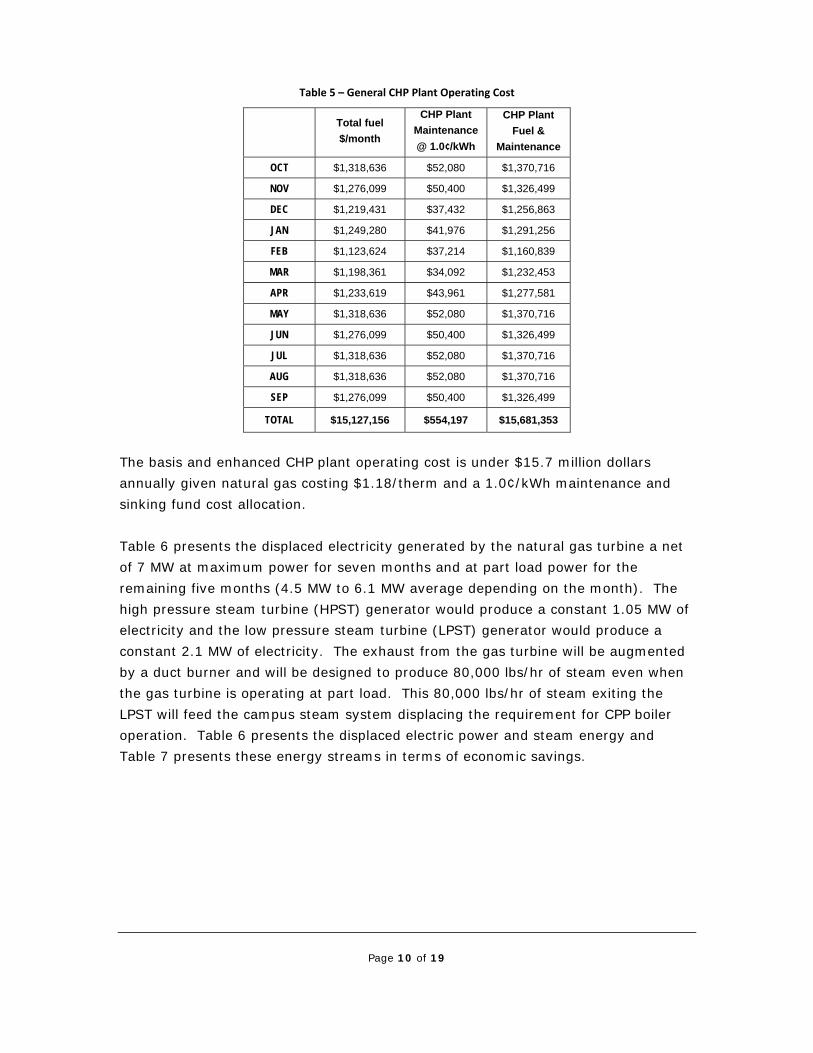
Table 5 – General CHP Plant Operating Cost
Total fuel $/month
CHP Plant Maintenance @ 1.0¢/kWh
CHP Plant Fuel &
Maintenance
OCT $1,318,636 $52,080 $1,370,716
NOV $1,276,099 $50,400 $1,326,499
DEC $1,219,431 $37,432 $1,256,863
JAN $1,249,280 $41,976 $1,291,256
FEB $1,123,624 $37,214 $1,160,839
MAR $1,198,361 $34,092 $1,232,453
APR $1,233,619 $43,961 $1,277,581
MAY $1,318,636 $52,080 $1,370,716
JUN $1,276,099 $50,400 $1,326,499
JUL $1,318,636 $52,080 $1,370,716
AUG $1,318,636 $52,080 $1,370,716
SEP $1,276,099 $50,400 $1,326,499
TOTAL $15,127,156 $554,197 $15,681,353
The basis and enhanced CHP plant operating cost is under $15.7 million dollars
annually given natural gas costing $1.18/therm and a 1.0¢/kWh maintenance and
sinking fund cost allocation.
Table 6 presents the displaced electricity generated by the natural gas turbine a net
of 7 MW at maximum power for seven months and at part load power for the
remaining five months (4.5 MW to 6.1 MW average depending on the month). The
high pressure steam turbine (HPST) generator would produce a constant 1.05 MW of
electricity and the low pressure steam turbine (LPST) generator would produce a
constant 2.1 MW of electricity. The exhaust from the gas turbine will be augmented
by a duct burner and will be designed to produce 80,000 lbs/hr of steam even when
the gas turbine is operating at part load. This 80,000 lbs/hr of steam exiting the
LPST will feed the campus steam system displacing the requirement for CPP boiler
operation. Table 6 presents the displaced electric power and steam energy and
Table 7 presents these energy streams in terms of economic savings.

Page 11 of 19
Table 6 – Displaced Electricity and Steam
Displaced
Electricity GT kWh
Displaced Electricity HPST kWh
Displaced Electricity Basic CHP
kWh
Displaced Electricity LPST kWh
Displaced Electricity
Enhanced CHP kWh
Displaced Low Pressure Steam
to Campus KLBS
OCT 5,208,000 781,200 5,989,200 1,562,400 7,551,600 59,520 NOV 5,040,000 756,000 5,796,000 1,512,000 7,308,000 57,600 DEC 3,743,239 781,200 4,524,439 1,562,400 6,086,839 59,520 JAN 4,197,611 781,200 4,978,811 1,562,400 6,541,211 59,520 FEB 3,721,423 705,600 4,427,023 1,411,200 5,838,223 53,760 MAR 3,409,246 781,200 4,190,446 1,562,400 5,752,846 59,520 APR 4,396,147 756,000 5,152,147 1,512,000 6,664,147 57,600 MAY 5,208,000 781,200 5,989,200 1,562,400 7,551,600 59,520 JUN 5,040,000 756,000 5,796,000 1,512,000 7,308,000 57,600 JUL 5,208,000 781,200 5,989,200 1,562,400 7,551,600 59,520 AUG 5,208,000 781,200 5,989,200 1,562,400 7,551,600 59,520 SEP 5,040,000 756,000 5,796,000 1,512,000 7,308,000 57,600
TOTAL 55,419,666 9,198,000 64,617,666 18,396,000 83,013,666 700,800
Table 7 – Displaced Electricity and Steam
Displaced Electricity
GT
Displaced Electricity
HPST
Displaced Electricity Basic CHP
Displaced Electricity
LPST
Displaced Electricity Enhanced
CHP
Displaced Steam3
Displaced Electric &
Steam Basic CHP
Displaced Electric &
Steam Enhanced CHP
OCT $691,622 $103,743 $795,366 $207,487 $1,002,852 $970,176 $1,765,542 $1,973,028
NOV $669,312 $100,397 $769,709 $200,794 $970,502 $938,880 $1,708,589 $1,909,382
DEC $497,102 $103,743 $600,845 $207,487 $808,332 $970,176 $1,571,021 $1,778,508
JAN $557,443 $103,743 $661,186 $207,487 $868,673 $970,176 $1,631,362 $1,838,849
FEB $494,205 $93,704 $587,909 $187,407 $775,316 $876,288 $1,464,197 $1,651,604
MAR $452,748 $103,743 $556,491 $207,487 $763,978 $970,176 $1,526,667 $1,734,154
APR $583,808 $100,397 $684,205 $200,794 $884,999 $938,880 $1,623,085 $1,823,879
MAY $691,622 $103,743 $795,366 $207,487 $1,002,852 $970,176 $1,765,542 $1,973,028
JUN $669,312 $100,397 $769,709 $200,794 $970,502 $938,880 $1,708,589 $1,909,382
JUL $691,622 $103,743 $795,366 $207,487 $1,002,852 $970,176 $1,765,542 $1,973,028
AUG $691,622 $103,743 $795,366 $207,487 $1,002,852 $970,176 $1,765,542 $1,973,028
SEP $669,312 $100,397 $769,709 $200,794 $970,502 $938,880 $1,708,589 $1,909,382
TOTAL $7,359,732 $1,221,494 $8,581,226 $2,442,989 $11,024,215 $11,423,040 $20,004,266 $22,447,255
Under the current CPP electric and natural gas schedules the CHP plant annual
operating cost is about $15.7 million and the displaced electricity and steam cost for
the basic CHP system is about $ 20.2 million. The basic CHP system as currently
configured would save the CPP about $4.32 million annually (Table 8). The
enhanced CHP system would add the low pressure steam turbine generator
contributing an additional $2.5 million in annual energy savings.
3 Based on AOC data showing cost of steam at $16.30 per 1,000 lbs
Page 12 of 19
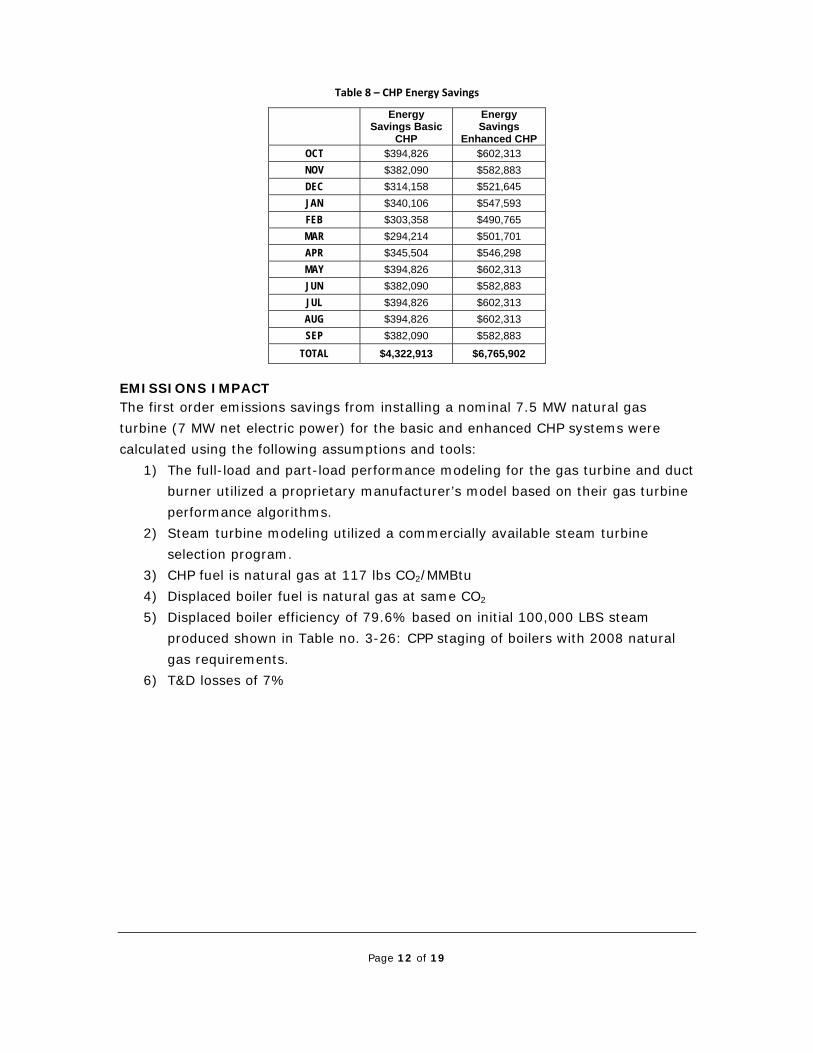
Table 8 – CHP Energy Savings
Energy
Savings Basic CHP
Energy Savings
Enhanced CHP OCT $394,826 $602,313 NOV $382,090 $582,883 DEC $314,158 $521,645 JAN $340,106 $547,593 FEB $303,358 $490,765 MAR $294,214 $501,701 APR $345,504 $546,298 MAY $394,826 $602,313 JUN $382,090 $582,883 JUL $394,826 $602,313 AUG $394,826 $602,313 SEP $382,090 $582,883
TOTAL $4,322,913 $6,765,902
EMISSIONS IMPACT The first order emissions savings from installing a nominal 7.5 MW natural gas
turbine (7 MW net electric power) for the basic and enhanced CHP systems were
calculated using the following assumptions and tools:
1) The full-load and part-load performance modeling for the gas turbine and duct
burner utilized a proprietary manufacturer’s model based on their gas turbine
performance algorithms.
2) Steam turbine modeling utilized a commercially available steam turbine
selection program.
3) CHP fuel is natural gas at 117 lbs CO2/MMBtu
4) Displaced boiler fuel is natural gas at same CO2
5) Displaced boiler efficiency of 79.6% based on initial 100,000 LBS steam
produced shown in Table no. 3-26: CPP staging of boilers with 2008 natural
gas requirements.
6) T&D losses of 7%

Page 13 of 19
Displaced Electricity
Displaced electricity heat rate4 and CO2 emissions5 based on average fossil
generation in the RFC eGRID subregion (Reliability First Corp [FSCE] – NJ, PA, MD
and DC) – see Figure 8
Figure 8 ‐ eGRID Subregions
A key factor in estimating the energy and CO2 emissions savings for CHP is
determining the nature of the avoided central station generation. Should the
calculation of the displaced energy and CO2 emissions be based on the all-generation
average of the region the facility is located in, the all-fossil average, the average for
some specific fuel type, an estimate of marginal generation, or a projection of future
installed generation? eGRID and the other data sources typically include a variety of
regional heat rate and emissions data based on fuel type (coal, oil, and natural gas),
all fossil fuels (a weighted mix of fuels), and all generation sources (including nuclear
and renewable generation). Currently, there is no consensus on what baseline to
use for displaced power calculations, and different entities base their estimates on
different comparisons.
4 Central Station 9,909 btu/kWh heat rate for Average fossil generation in RFCE eGRID subregion 5 Central Station 1.888 lbs/kWh CO2 emissions for Average fossil generation in RFCE eGRID subregion

Page 14 of 19
The EPA CHP Partnership often uses the all-fossil average heat rate and emission
factors in their calculations of avoided energy and CO2 emissions. This is based on an
understanding that nuclear and renewable generation are most likely must-run
resources in all regions, and seasonal and daily variations in power supply and
demand are generally met with changes in the amount and mix of operating fossil
generation. To validate if this is the correct approach, one would need to use an
electricity capacity dispatch model to see how CHP operates in the dispatch mix for a
given region and what generation resources and emissions are displaced. (see Figure
9)
Peaking units may run only tens to hundreds of hours, so a high capital cost is not
supportable. On the other hand, high efficiency is not critical, since these plants only
run when there is no other source of capacity and electricity prices are very high.
Simple cycle gas turbines are the classic peaking generator, though reciprocating
engines and standby oil and gas steam plants are used for peaking in some parts of
the country.
Between the very peak and the very base load, a variety of generating assets is used
to meet demand. In most regions these are cycling coal, oil and gas steam units.
Large hydro generators can also fit in this regime. Developers of gas combined cycle
plants would like them to run 5,000 hours or more, in the base load to low
intermediate load ranges. Depending on the cost of gas and other factors, they may
run in the middle intermediate range.
The CO2 emissions from power generation are the product of the MWh of generation
of each part of the mix times the emission rate in lbs CO2/MWh. One could multiply
each unit of generation under the load curve times the associated emission factor
and derive an emissions curve that would look very similar. The nuclear component
would drop out. The coal component would be accentuated due to higher emission
rates. It is noteworthy that even at the peak hours, the majority of the emissions are
from the base load units at the bottom of the stck.

Page 15 of 19
Figure 9 – Typical Electric Grid Load Duration Curve
Table 9 – CHP Systems Emissions
Total CHP fuel,
MMBtu CHP Plant Total CO2
emissions, tons
OCT 111,749 6,537 NOV 108,144 6,326 DEC 103,342 6,045 JAN 105,871 6,193 FEB 95,222 5,571 MAR 101,556 5,941 APR 104,544 6,116 MAY 111,749 6,537 JUN 108,144 6,326 JUL 111,749 6,537 AUG 111,749 6,537 SEP 108,144 6,326
TOTAL 1,281,962 74,995
Figure 10 shows (yellow line) the monthly fuel usage of the basic CHP system,
including the gas turbine and duct burner, when generating the electric power shown
in Figure 7 and including the HPST steam turbine generator (with gas supplied to the
duct burner), The calculation included part-load gas turbine performance calculated
based on average monthly load. The purple area is displaced primary fuel relating to
Peaking Turbines and Engines
Cycling Coal, Oil and Natural Gas
Gas Combined Cycle Turbines
Baseload Coal
Baseload Nuclear

Page 16 of 19
the reduction in grid electric power required and the red area is the displaced boiler
fuel.
The basic CHP system would save 286,930 MMBTU per year of energy in this case
over the current grid power and boiler fuel operation.
Figure 11 shows (yellow line) the monthly CO2 emissions from the basic CHP system,
including the gas turbine and duct burner, when generating the electric power shown
in Figure 7 and including the HPST steam turbine generator (with gas supplied to the
duct burner), The calculation included part-load gas turbine performance calculated
based on average monthly load. The purple area is displaced CO2 emissions relating
to the reduction in grid electric power required and the red area is the displaced
boiler CO2 emissions.
The basic CHP system would save 42,099 tons per year of CO2 emissions in this case
over the current grid power and boiler fuel operation.
Figure 10 – Basic CHP System Primary Energy Savings (delivered fuel basis)

Page 17 of 19
Figure 11 – Basic CHP System Primary Energy Savings (delivered fuel basis)
Figure 12 shows (yellow line) the monthly fuel usage of the enhanced CHP system,
including the gas turbine and duct burner, when generating the electric power shown
in Figure 7 and including the HPST & LPST steam turbine generators (with gas
supplied to the duct burner), The calculation included part-load gas turbine
performance calculated based on average monthly load. The purple area is displaced
primary fuel relating to the reduction in grid electric power required and the red area
is the displaced boiler fuel.
The enhanced CHP system would save 482,937 MMBTU per year of energy in this
case over the current grid power and boiler fuel operation.
Figure 13 shows (yellow line) the monthly CO2 emissions from the enhanced CHP
system, including the gas turbine and duct burner, when generating the electric
power shown in Figure 7 and including the HPST & LPST steam turbine generators
(with gas supplied to the duct burner), The calculation included part-load gas
turbine performance calculated based on average monthly load. The purple area is
displaced CO2 emissions relating to the reduction in grid electric power required and
the red area is the displaced boiler CO2 emissions.
The enhanced CHP system would save 60,772 tons per year of CO2 emissions in this
case over the current grid power and boiler fuel operation.

Page 18 of 19
Figure 12 – Enhanced CHP System CO2 Savings (delivered fuel basis)
Figure 13 – Enhanced CHP System CO2 Savings (delivered fuel basis)

Page 19 of 19
PERFORMANCE SUMMARY Table 9 provides a summary of the financial and environmental benefits of installing
the nominal 7.5 MW CHP system at the Capital Power Plant based on the
recommended approach of using the “all fossil average” for displaced electricity.
Table 10 Performance Summary
Annual Basic CHP
System Enhanced CHP System
Operating Savings $4,322,913 $6,765,902
Primary Energy Savings (MMBTU) 286,930 482,937
CO2 emissions reduction (tons) 42,099 60,772
Equivalent car removal 6,954 10,038
Equivalent forest planted (acres) 8,675 12,523
Note using the “all electric average6” versus the “all fossil average7” for the electric
grid provides the following results.
Table 11 Performance Summary
Annual Basic CHP System Enhanced CHP System
Operating Savings $3,924,373 $6,435,427
Primary Energy Savings (MMBTU) 16,301 135,261
CO2 emissions reduction (tons) 16,078 27,343
Equivalent car removal 2,656 4,517
Equivalent forest planted (acres) 3,313 5,634
6 Central Station 9,909 btu/kWh heat rate and 1.888 lbs/kWh CO2 emissions for Average fossil generation in RFCE eGRID subregion 7 Central Station 6,016 btu/kWh heat rate and 1.139 lbs/kWh CO2 emissions for Average fossil generation in RFCE eGRID subregion