Embed Size (px)
Citation preview

March 14th , 2013
Progress Meeting 2: Proof-of-Concept Models for Truck-Body Classification using Inductive Loop Signature Data
Sponsored by: California Air Resources Board Performed by: Institute of Transportation Studies University of California, Irvine

Outline
• Task Schedule • Truck-Body Type Classification Model
Data Collection and Data Processing Efforts Loop Signature Model Combined WIM and Loop Signature Model
• Hardware Integration 1060 Hardware Integration iSinc Hardware Integration iSinc and IST Signature Comparison
• Progress Summary
2

Task Schedule
3

Progress by Task
• Phase 1 1.1 Develop body type classification model using
signature data (for VDS locations) 1.2 Develop body type classification model using
derived WIM and signature data (for WIM locations) 1.3 Investigate hardware interface configuration to
obtain Inductive Signature data at WIM station
• Phase 2 2.1 Data Collection at Deployed WIM station 2.2 Model Enhancement from data fusion with WIM
and signature data
4

TRUCK-BODY TYPE CLASSIFICATION MODEL DEVELOPMENT
5

Data Collection Sites
Classification Data
Signature Comparison
Station Lane Number of
Trucks Data Description
I-5 Yale (Irvine) Lane 5 Lane 4
3,039 3,924
- VDS: IST Signatures and Photo Images - WIM: IST Signature and 1060 Outputs
CA-99 Fresno Lane 3 Lane 2
5,108 4,610 - No VDS
- WIM: Photo Images, IST Signature, and 1060 Outputs
I-5
Willows Lane 2 Lane 1
5818 1090
Redding Lane 2 Lane 1
4337 773
San Onofre Lane 4 Lane 3
181 1725
- Including passenger vehicles
Leucadia Lane 4 Lane 3
2019 1998
TOTAL : 34,622
SB I-5 Redding WIM Dec 10-12, 2012
5,110 Trucks
NB I-5 Willlows WIM Dec 10-12, 2012
6,908 Trucks
SB SR-99 Fresno WIM Nov 7-8, 2012 9,718 Trucks
SB I-5 Leucadia WIM Jan 9-10, 2013 4,017 Trucks
SB I-5 San Onofre PrePass WIM Jan 9-10, 2013 1,906 Trucks
SB I-5 Irvine (Yale) WIM & VDS Sep 21, Oct 2-3, 2012
6,963 Trucks SB I-405 Saigon WIM & VDS Oct 9, 2012 97 Trucks
Total : 34,719 Number of Vehicles
Equipment Setup

Data Groundtruth Progress Update
7
• Complete Records by FHWA Class:
FHWA Class Completed
3 1533 4 122 5 1386
6 340
7 105
8 223 9 2225
10 13
11 335 12 27
13 1 14 125 15 265
TOTAL 6700

Classification Scheme Framework: Drive Units
• Body Types – 29 Classes
9
Service Trucks Busses Vans Tank Ambulance, Street Sweeper,
Fire truck RV (Coach) Multi-Stop or Step Van Tank Truck
Wrecker 30ft Bus Enclosed Van Pneumatic Tank
Winch/Crane Truck 20ft Bus Drop Frame Van
Garbage Curtain-side Van Specialty Dump Semi-Truck Drive Units Open Top Van Livestock
Bottom Dump Conventional Cab Logging
Dumpster Transport Extended Cab Platforms Beverage
Flatbed Tow Truck Cab-Over Engine Low Boy Platform
Concrete Mixer Automobile Transport Cab Basic Platform
Utility Truck
Classification Scheme Framework: Trailers
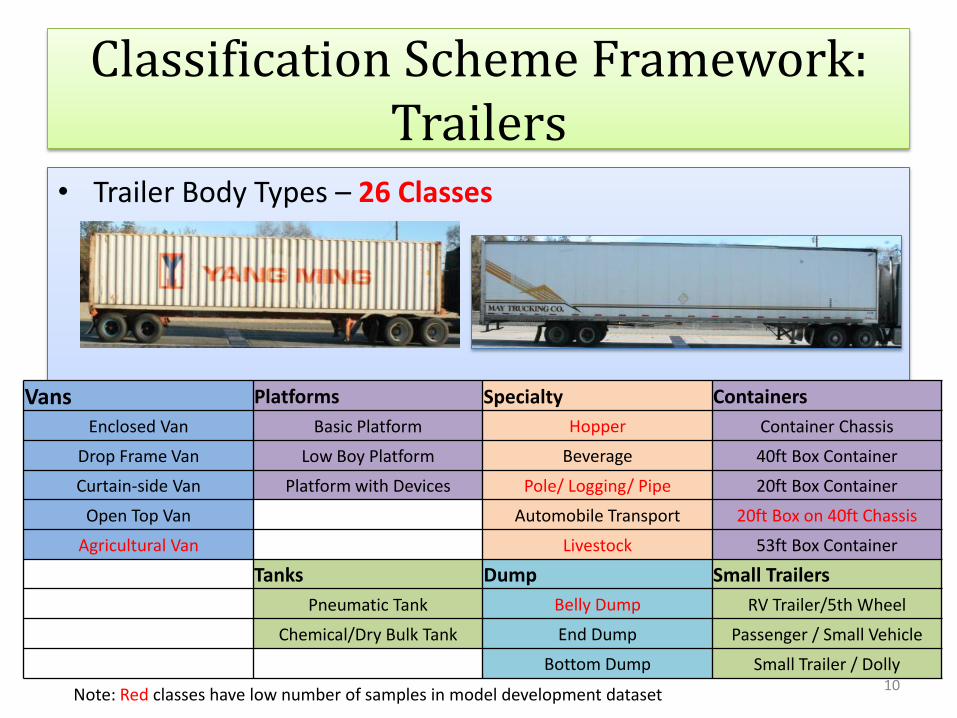
• Trailer Body Types – 26 Classes
10
Vans Platforms Specialty Containers
Enclosed Van Basic Platform Hopper Container Chassis
Drop Frame Van Low Boy Platform Beverage 40ft Box Container
Curtain-side Van Platform with Devices Pole/ Logging/ Pipe 20ft Box Container
Open Top Van Automobile Transport 20ft Box on 40ft Chassis
Agricultural Van Livestock 53ft Box Container
Tanks Dump Small Trailers
Pneumatic Tank Belly Dump RV Trailer/5th Wheel
Chemical/Dry Bulk Tank End Dump Passenger / Small Vehicle
Bottom Dump Small Trailer / Dolly
Note: Red classes have low number of samples in model development dataset

Loop Signature Classification: Model Structure
12
Single Unit Truck Body Classes
Single vs. Multi- Unit
Single Unit Body Class
Multi Unit Trailer
Body Class Passenger vehicles
Multi Unit Tractor
Body Class
Trailer Unit Body Class
Tractor Unit Body Class

Loop Signature Classification: Summary of Modeling Approach Feed Forward Neural Network implemented in Matlab
Single Hidden Layer with 15 neurons
Input features: 30 interpolated magnitude differences
Output classes: • Single Unit Model - 27 Body Classes
• Multi Unit Model - 28 Body Classes including axle config.
Dataset proportionally split into Training (60%), Validation (20%), and Testing (20%)
30 runs performed to obtain best model
13

Loop Signature Classification: Feature Selection
• 29 magnitude differences from duration and max. magnitude normalized signatures
14
Feature 3
4 10
Normalized Signatures Extracted Features

Loop Signature Classification: Single v. Multi Unit Model
• Single-Unit vs. Multi- Unit Classification
– 2 Classes
– Overall Correct Classification Rate (CCR) = 98%
15
Test Dataset Outputs Actual
Count CCR
Single Unit Multi Unit
Targ
ets
Single Unit 451 5 456 99%
Multi Unit 14 328 342 96%
Predicted Count 465 333 798 98%
Selected Features

Loop Signature Classification: Single-Unit Model
• 27 Body Classes, CCR = 77%
16
Targets Samples CCR (%)
Pass
enge
r V
ehic
les Sedan or Coupe 0 -
SUV 1 0
Minivan 0 -
Pick-up (4 tire) 159 92
Pick-up (6 tire) 1 0
12 Passenger Van 71 94
Bu
sses
RV (Coach) 2 0
30ft Bus 13 85
20ft Bus 13 69
Sem
i-Tr
acto
rs Conventional Cab 1 0
Extended Cab 2 50
Automobile Transport Cab 0 -
Basic Platform 34 53
Beverage Truck 2 0
Targets Samples CCR (%)
Serv
ice
Tru
cks
Ambulance, Street Sweeper, Fire truck
4 0
Wrecker 6 17
Winch or Crane Truck 4 0
Garbage Truck 22 100
Dump Truck 12 42
Dumpster Transport 10 50
Flatbed Tow Truck 5 60
Concrete Mixer 3 100
Utility Truck 21 43
Van
s
Multi-Stop or Step Van 8 38
Enclosed Van 68 79
Curtainside Van 0 -
Chemical/Dry Bulk Tank Truck 3 0

Loop Signature Classification: Collapsed Single-Unit Model
17
• 15 Body Classes, 80% CCR
Test Dataset
Pas
s. V
eh.
RV
(C
oac
h)
30
ft B
us
20
ft B
us
Bo
bta
il
Pla
tfo
rms
Bev
erag
e/Lo
w V
an
Serv
ice
Uti
lity
Tru
ck
Co
ncr
ete
Mix
er
Du
mp
Tru
ck
Du
mp
ster
Tra
nsp
ort
Gar
bag
e Tr
uck
Van
s
Tan
k
Tru
e C
ou
nt
CC
R
Pass. Veh. 228 0 0 0 0 3 1 0 0 0 0 0 0 0 0 232 98%
RV (Coach) 0 0 0 0 0 1 0 0 1 0 0 0 0 0 0 2 0%
30ft Bus 0 0 11 0 0 2 0 0 0 0 0 0 0 0 0 13 85%
20ft Bus 3 0 0 9 0 0 0 1 0 0 0 0 0 0 0 13 69%
Bobtail 0 0 0 0 2 1 0 0 0 0 0 0 0 0 0 3 67%
Platforms 3 0 0 0 0 22 2 0 0 0 3 0 1 8 0 39 56%
Beverage/Low Van 3 0 0 3 0 1 3 0 0 0 0 0 0 0 0 10 30%
Service 8 0 0 1 0 1 0 1 0 0 1 0 0 2 0 14 7%
Utility Truck 6 0 0 0 0 2 2 1 9 1 0 0 0 0 0 21 43%
Concrete Mixer 0 0 0 0 0 0 0 0 0 3 0 0 0 0 0 3 100%
Dump Truck 1 1 0 0 0 2 1 1 0 1 5 0 0 0 0 12 42%
Dumpster Transport 0 0 1 0 0 2 1 0 0 0 0 5 0 1 0 10 50%
Garbage Truck 0 0 0 0 0 0 0 0 0 0 0 0 22 0 0 22 100%
Vans 1 0 0 0 0 8 0 1 0 2 0 0 2 54 0 68 79%
Tank 0 0 0 0 0 0 0 1 0 0 0 0 0 2 0 3 0%
Predicted Count 253 1 12 13 2 45 10 6 10 7 9 5 25 67 0 465 80%
Targ
ets
Outputs

• 28 Classes, Overall CCR = 82%
Loop Signature Classification: Trailer Unit Body Classification
19
Targets # CCR
Pla
tfo
rm Basic S 0 -
Basic ST 13 38
Basic MT 0 -
Low Boy Platform 9 89
Platform with Devices 2 0
Van
s
Enclosed ST 122 91
Enclosed MT 2 0
Drop Frame 4 50
Open Top 30 93
Curtain-side 1 0
Co
nta
iner
s 40ft (2 TEU) Box Container 2 0
20ft (1 TEU) Box Container 0 -
53ft Box Container 8 13
Container Chassis 1 0
Targets, cont’d # CCR
Tan
ks Pneumatic Tank ST 0 -
Pneumatic Tank MT 1 0
Chemical Tank S 1 100
Chemical Tank ST 7 71
Spe
cial
ty Auto. Transp. S 3 0
Auto Transp. ST 4 50
Beverage ST 1 0
Beverage MT 0 -
Du
mp
Bottom Dump MT 26 100
End Dump S 10 80
End Dump ST 5 100
No
n-
Sem
i RV Trailer/5th Wheel 5 40
Passenger / Small Vehicle 3 0
Small Trailer / Dolly 54 96
S = Single Trailer, ST = Semi-Trailer, MT = Multi-Trailer

Loop Signature Classification: Collapsed Trailer Classes
• 25 Classes, Overall CCR = 83%
20
Test Dataset
Bas
ic S
ingl
e Tr
aile
r
Bas
ic P
latf
orm
+ P
latf
orm
wit
h D
evic
es
Bas
ic M
ult
i-Tr
aile
r
Low
Bo
y P
latf
orm
Encl
ose
d V
an +
Cu
rtai
nsi
de
Van
Encl
ose
d V
an M
ult
i-Tr
aile
r
Dro
p F
ram
e V
an
Op
en T
op
Van
40
ft B
ox
Co
nta
iner
20
ft B
ox
Co
nta
iner
53
ft B
ox
Co
nta
iner
Co
nta
iner
Ch
asis
Pn
eum
atic
Tan
k Se
mi-
Trai
ler
Pn
eum
atic
Tan
k M
ult
i-
Trai
ler
Ch
emic
al T
ank_
Sin
gle
Trai
ler
Ch
emic
al S
emi-
Trai
ler
Au
tom
ob
ile T
ran
spo
rt S
ingl
e
Trai
ler
Au
tom
ob
ile T
ran
spo
rt S
emi-
Trai
ler
Bev
erag
e Se
mi-
Trai
ler
Bev
erag
e M
ult
i-Tr
aile
r
Bo
tto
m D
um
p M
ult
i-Tr
aile
r
End
Du
mp
Sin
gle
Trai
ler
End
Du
mp
Sem
i-Tr
aile
r
RV
Tra
iler/
5th
Wh
eel
Smal
l Veh
icle
+ S
mal
l Tra
iler
Targ
et
Co
un
t
CC
R
Basic Single Trailer 0 0 0 0 0 0 0 0 0 0 0 0 0 0 0 0 0 0 0 0 0 0 0 0 0 0 -Basic Platform + Platform with Devices 0 7 0 0 3 0 0 1 0 0 0 0 0 0 0 0 0 0 0 0 0 1 1 0 2 15 47%
Basic Multi-Trailer 0 0 0 0 0 0 0 0 0 0 0 0 0 0 0 0 0 0 0 0 0 0 0 0 0 0 -Low Boy Platform 0 0 0 8 1 0 0 0 0 0 0 0 0 0 0 0 0 0 0 0 0 0 0 0 0 9 89%
Enclosed Van + Curtainside Van 0 0 0 1 111 0 0 4 0 0 0 0 0 0 0 1 0 0 0 0 0 0 0 3 3 123 90%Enclosed Van Multi-Trailer 0 1 0 0 0 0 0 0 0 0 0 0 0 0 0 0 0 1 0 0 0 0 0 0 0 2 0%
Drop Frame Van 0 0 0 0 0 0 2 0 0 0 0 0 0 0 0 0 0 0 0 0 0 0 0 0 2 4 50%Open Top Van 0 0 0 0 2 0 0 28 0 0 0 0 0 0 0 0 0 0 0 0 0 0 0 0 0 30 93%
40ft Box Container 0 0 0 0 0 0 0 1 0 0 0 0 0 0 0 0 1 0 0 0 0 0 0 0 0 2 0%20ft Box Container 0 0 0 0 0 0 0 0 0 0 0 0 0 0 0 0 0 0 0 0 0 0 0 0 0 0 -53ft Box Container 0 0 0 0 7 0 0 0 0 0 1 0 0 0 0 0 0 0 0 0 0 0 0 0 0 8 13%
Container Chasis_Single Semi-Trailer 0 0 0 0 1 0 0 0 0 0 0 0 0 0 0 0 0 0 0 0 0 0 0 0 0 1 0%Pneumatic Tank Semi-Trailer 0 0 0 0 0 0 0 0 0 0 0 0 0 0 0 0 0 0 0 0 0 0 0 0 0 0 -Pneumatic Tank Multi-Trailer 0 1 0 0 0 0 0 0 0 0 0 0 0 0 0 0 0 0 0 0 0 0 0 0 0 1 0%Chemical Tank Single Trailer 0 0 0 0 0 0 0 0 0 0 0 0 0 0 1 0 0 0 0 0 0 0 0 0 0 1 100%
Chemical Tank_Single Semi-Trailer 0 1 0 0 0 0 0 0 0 0 0 0 0 0 0 5 0 0 0 0 0 0 1 0 0 7 71%Automobile Transport Single Trailer 0 0 0 2 0 0 0 0 0 0 0 0 0 0 0 0 0 0 0 0 0 0 0 0 1 3 0%Automobile Transport Semi-Trailer 0 0 0 1 0 0 0 0 0 0 0 0 0 0 0 0 1 2 0 0 0 0 0 0 0 4 50%
Beverage Semi-Trailer 0 0 0 0 0 0 0 0 0 0 0 0 0 0 0 0 0 0 0 0 0 0 0 0 1 1 0%Beverage Multi-Trailer 0 0 0 0 0 0 0 0 0 0 0 0 0 0 0 0 0 0 0 0 0 0 0 0 0 0 -
Bottom Dump 0 0 0 0 0 0 0 0 0 0 0 0 0 0 0 0 0 0 0 0 26 0 0 0 0 26 100%End Dump_Single Trailer 0 0 0 0 0 0 0 0 0 0 0 0 0 0 2 0 0 0 0 0 0 8 0 0 0 10 80%
End Dump_Single Semi-Trailer 0 0 0 0 0 0 0 0 0 0 0 0 0 0 0 0 0 0 0 0 0 0 5 0 0 5 100%RV Trailer/5th Wheel 0 0 0 0 0 0 0 0 0 0 0 0 0 0 0 0 0 0 0 0 0 1 0 2 2 5 40%
Small Vehcile + Small Trailer 0 0 0 1 0 0 0 0 0 0 0 0 0 0 0 0 1 0 0 0 1 0 0 0 54 57 95%
Outputs
Targ
ets
Tan
ksD
um
pSp
ecia
lity
No
n-
Sem
iP
latf
orm
sV
ans
Co
nta
iner
s
Further breakdown of Enclosed Vans needed
Feature set Not able to distinguish 53ft containers from Vans

Loop Signature Classification: Multi-Unit Tractor Classification
21
Pas
s. C
ar
SUV
Min
ivan
4 T
ire
Pic
kup
6 T
ire
Pic
kup
12
Pas
sen
ger
Van
Encl
ose
d V
an
Op
en T
op
Van
Flat
bed
To
w
Tru
ckC
on
cret
e
Mix
er
Du
mp
Du
mp
ster
Tran
spo
rtA
mb
ula
nce
,
Fire
Tru
ck, e
tc.
Win
ch o
r
Cra
ne
Tru
ck
Wre
cker
Co
nve
nti
on
al
Cab
Sem
i
Exte
nd
ed C
ab
Sem
i-Tr
acto
r
Cab
-Ove
r
Engi
ne
Sem
i-A
uto
mo
bile
Tran
spo
rt C
ab
Basic Platform S 0 0 0 0 0 0 0 0 0 3 0 0 0 0 0 0 0 2 0 0 0 0 0 2Basic Platform ST 0 0 0 0 0 0 0 0 0 0 0 0 0 0 0 0 0 0 0 45 30 0 0 2Basic Platform MT 0 0 0 0 0 0 0 0 0 0 0 0 0 0 0 0 0 0 0 1 0 0 0 1Low Boy Platform ST 0 0 0 0 0 0 0 0 0 1 0 0 0 0 0 0 0 1 0 34 8 0 0 4Platform with Devices ST 0 0 0 0 0 0 0 0 0 0 0 0 0 0 0 0 0 0 0 7 5 0 0 2Enclosed Van ST 0 0 0 0 0 0 0 0 0 0 0 0 0 0 0 0 0 0 0 307 280 21 0 3Enclosed Van MT 0 0 0 0 0 0 0 0 0 0 0 0 0 0 0 0 0 0 0 8 0 0 0 1Drop Frame Van ST 0 0 0 0 0 0 0 0 0 0 0 0 0 0 0 0 0 0 0 2 15 2 0 3Curtainside Van ST 0 0 0 0 0 0 0 0 0 0 0 0 0 0 0 0 0 0 0 2 2 0 0 2Open Top Van ST 0 0 0 0 0 0 0 0 0 0 0 0 0 0 0 0 0 0 0 136 2 13 0 340ft (2 TEU) Box Container ST 0 0 0 0 0 0 0 0 0 0 0 0 0 0 0 0 0 0 0 7 4 1 0 320ft (1 TEU) Box Container ST 0 0 0 0 0 0 0 0 0 0 0 0 0 0 0 0 0 0 0 1 1 0 0 253ft Box Container ST 0 0 0 0 0 0 0 0 0 0 0 0 0 0 0 0 0 0 0 5 37 0 0 2Container Chasis ST 0 0 0 0 0 0 0 0 0 0 0 0 0 0 0 0 0 0 0 0 4 0 0 1Pneumatic Tank ST 0 0 0 0 0 0 0 0 0 0 0 0 0 0 0 0 0 0 0 2 0 0 0 1Pneumatic Tank MT 0 0 0 0 0 0 0 0 0 0 0 0 0 0 0 0 0 0 0 4 0 0 0 1Chemical/Dry Bulk Tank S 0 0 0 0 0 0 0 0 10 0 0 0 0 0 0 0 0 0 0 0 0 0 0 1Chemical/Dry Bulk Tank ST 0 0 0 0 0 0 0 0 0 0 0 0 0 0 0 0 0 0 0 24 13 0 0 2Automobile Transport S 0 0 0 5 0 0 0 0 1 1 1 0 0 0 9 1 2 0 0 0 0 0 0 7Automobile Transport ST 0 0 0 0 0 0 0 0 0 0 0 0 0 0 0 0 0 0 0 2 2 0 13 3Beverage ST 0 0 0 0 0 0 0 0 0 0 0 0 0 0 0 0 0 0 0 5 1 0 0 2Beverage MT 0 0 0 0 0 0 0 0 0 0 0 0 0 0 0 0 0 0 0 1 0 0 0 1Bottom Dump MT 0 0 0 0 0 0 0 0 0 0 0 0 0 0 0 0 0 0 0 116 11 2 0 3End Dump S 0 0 0 0 0 0 0 0 0 0 0 0 0 0 51 0 0 0 0 0 0 0 0 1End Dump ST 0 0 0 0 0 0 0 0 0 0 0 0 0 0 3 0 0 0 0 16 8 0 0 3RV Trailer/5th Wheel S 0 2 2 17 6 0 0 0 0 0 0 0 0 0 0 0 0 0 0 0 0 0 0 4Passenger / Small Vehicle S 0 0 0 0 0 0 5 0 0 0 0 0 4 0 0 0 0 0 4 0 0 0 0 3Small Trailer / Dolly S 2 9 4 87 13 12 1 2 1 18 6 1 0 78 8 0 17 8 1 1 0 0 0 18
Ch
emic
alTa
nk
Tru
ck
Bas
ic P
latf
orm
Trailer Units
Drive Units
RV
(C
oac
h)
Uti
lity
Tru
ck
Spec
ialit
yD
um
pN
on
-
Sem
i
Passenger Vehicles Semi-TractorsServiceVans
# D
rive
Un
it
Cla
sse
s
Plat
form
sV
ans
Co
nta
iner
sTa
nks
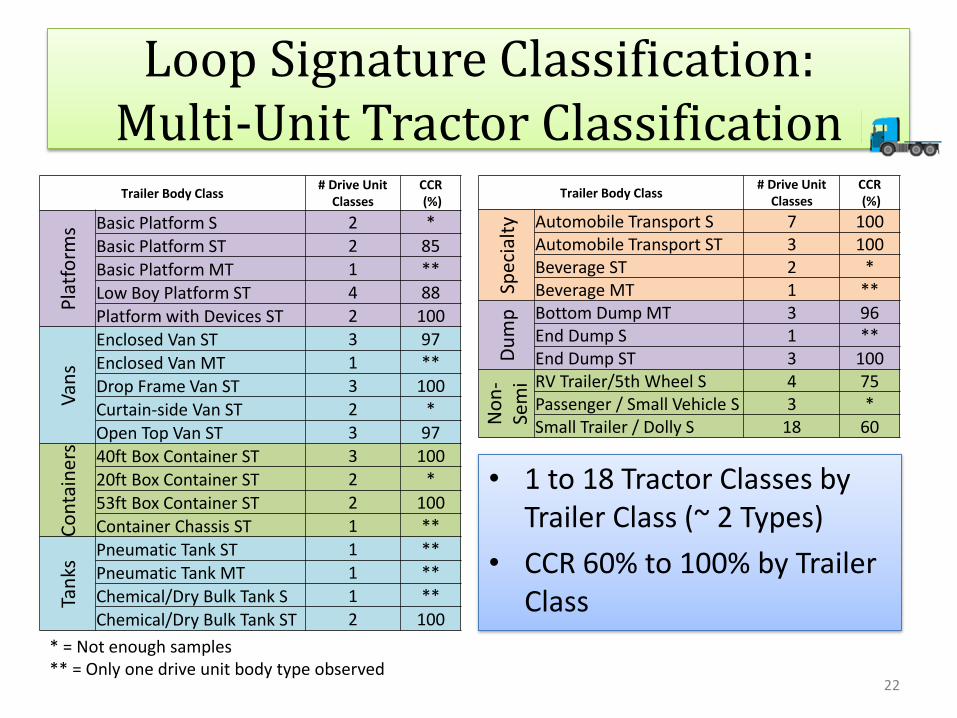
Loop Signature Classification: Multi-Unit Tractor Classification
• 1 to 18 Tractor Classes by Trailer Class (~ 2 Types)
• CCR 60% to 100% by Trailer Class
22
* = Not enough samples ** = Only one drive unit body type observed
Trailer Body Class # Drive Unit
Classes CCR (%)
Pla
tfo
rms Basic Platform S 2 *
Basic Platform ST 2 85
Basic Platform MT 1 **
Low Boy Platform ST 4 88
Platform with Devices ST 2 100
Van
s
Enclosed Van ST 3 97
Enclosed Van MT 1 **
Drop Frame Van ST 3 100
Curtain-side Van ST 2 *
Open Top Van ST 3 97
Co
nta
iner
s
40ft Box Container ST 3 100
20ft Box Container ST 2 *
53ft Box Container ST 2 100
Container Chassis ST 1 **
Tan
ks Pneumatic Tank ST 1 **
Pneumatic Tank MT 1 **
Chemical/Dry Bulk Tank S 1 **
Chemical/Dry Bulk Tank ST 2 100
Trailer Body Class # Drive Unit
Classes CCR (%)
Spec
ialt
y Automobile Transport S 7 100 Automobile Transport ST 3 100 Beverage ST 2 * Beverage MT 1 **
Du
mp
Bottom Dump MT 3 96 End Dump S 1 ** End Dump ST 3 100
No
n-
Sem
i RV Trailer/5th Wheel S 4 75 Passenger / Small Vehicle S 3 * Small Trailer / Dolly S 18 60
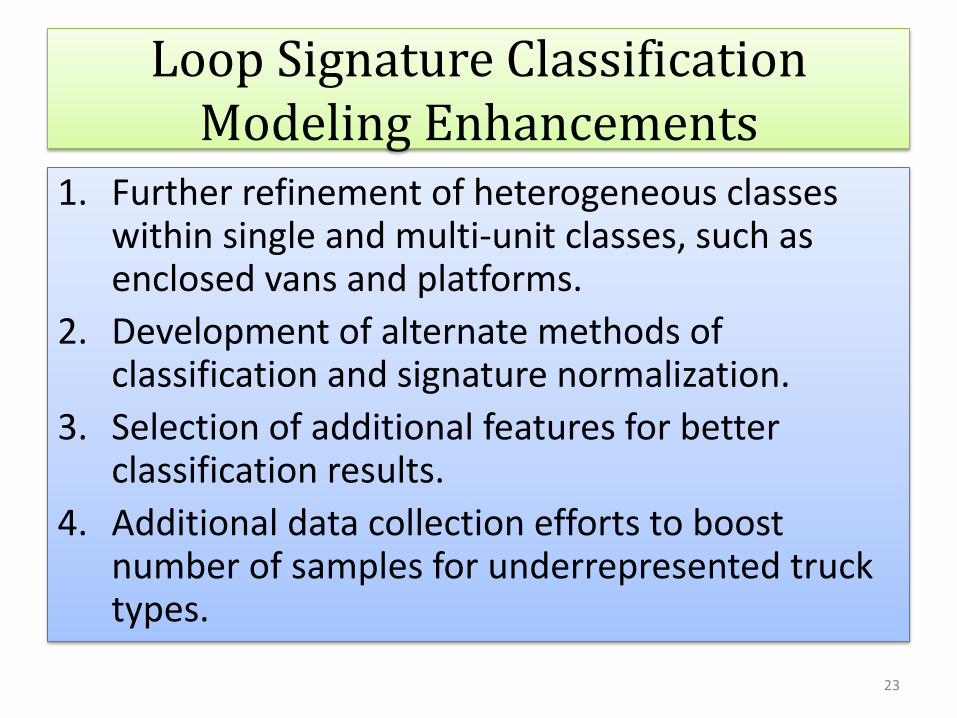
Loop Signature Classification Modeling Enhancements
1. Further refinement of heterogeneous classes within single and multi-unit classes, such as enclosed vans and platforms.
2. Development of alternate methods of classification and signature normalization.
3. Selection of additional features for better classification results.
4. Additional data collection efforts to boost number of samples for underrepresented truck types.
23

WIM + Signature Classification: Model Structure
24
Multi-Unit (Class 5 w/ Trailer)
FHWA Class from
WIM
FHWA 5 Body Class
Model
FHWA 9 Body Class
Model Single Unit Body Type
Multi Unit Tractor
Body Class
Semi- Trailer Body Class
Tractor Unit Body Class
Single Trailer Body Class (misclassified as
FHWA 9)

WIM + Signature Classification: Model Input Data
26
Data Type Variables
WIM
Gross Vehicle Weight (GVW)
Vehicle Length
Right and Left Axle Weights
Axle Spacing
FHWA Class
Speed
Inductive Signature Change in inductive magnitude over
time
Station Lanes Date FHWA 5
Samples
FHWA 9
Samples
I-5 @ Yale 4, 5 9/21, 10/2, 10/3 752 847
CA-99 @ Fresno 2, 3 11/7, 11/8 83 476
TOTAL 835 1323
Data Available for Model Development:
Available Variables for Model Development:

WIM + Signature Classification: Data Fusion for Feature Selection
28
Interpolated Magnitudes
Feature Set
Normalized Signature WIM Controller Outputs
Axle Spacing
Vehicle Length

WIM + Signature Classification: Summary of Modeling Approach
• Feed Forward Neural Network implemented in Matlab
• Single Hidden Layer with 15 neurons
• Input features: FHWA Class 5 Model – 30 interpolated magnitude differences + Axle
Spacing
FHWA Class 9 Trailer Model – 20 interpolated magnitude differences + Axle Spacing
• Output classes: FHWA Class 5 Model – 33 Body Classes
FHWA Class 9 Model – 21 Body Classes
• Dataset Allocation Training (60%), Validation (20%), and Testing (20%)
• 30 runs performed to obtain best model 29

WIM + Signature Classification: FHWA Class 5 Results
• 33 Classes, Overall CCR = 69%
30 S = Single Trailer, Ambulance, etc. * = Ambulance, Street Sweeper, Fire Trucks
Targets Samples CCR (%)
Pass
enge
r V
ehic
les 4 Tire Pick-up 6 67
4 Tire Pick up S 4 75
6 Tire Pick-up 0 -
6 Tire Pick-up S 3 33
12 Pass. Van 11 100
12 Pass. Van S 0 -
Bu
sses
RV (Coach) 3 0
RV (Coach) S 1 0
30ft Bus 4 50
20ft Bus 10 70
Sem
i-Tr
acto
rs Conventional Cab 1 0
Conventional Cab ST 0 -
Basic Platform 21 38
Basic Platform S 1 100
Beverage Truck 1 0
Targets Samples CCR (%)
Serv
ice
Tru
cks
Ambulance, etc. * 3 0
Ambulance, etc. S* 2 0
Wrecker 5 100
Wrecker S 1 0
Winch or Crane Truck 2 0
Winch or Crane Truck S 0 -
Dump Truck 1 0
Flatbed Tow Truck 4 75
Flatbed Tow Truck S 0 -
Utility Truck 15 87
Utility Truck S 0 - V
ans
Multi-Stop or Step Van 7 43
Enclosed Van 53 94
Enclosed Van S 1 0
Curtain-side Van 0 -
Open Top Van S 0 -
Chemical/Dry Bulk Tank Truck 1 0

WIM + Signature Classification: FHWA Class 5 Collapsed Results
• 13 Classes, Overall CCR = 72%
31
Test Dataset
Target Class Pas
sen
ger
Veh
icle
RV
30
ft B
us
20
ft B
us
Sem
i
Trac
tors
Bas
ic
Pla
tfo
rms
Serv
ice
Du
mp
Uti
lity
Tru
ck
Mu
ltis
top
Van
Encl
ose
d
Van
s
Tan
k
Cla
ss 5
wit
h
Trai
ler
# S
amp
les
CC
R
Passenger Vehicle 14 0 0 1 0 0 0 0 2 0 0 0 0 17 82%
RV 0 1 0 0 0 0 0 0 0 1 0 0 1 3 33%
30ft Bus 0 0 2 0 0 0 0 0 0 0 2 0 0 4 50%
20ft Bus 0 0 0 7 0 0 0 0 0 1 2 0 0 10 70%
Semi Tractors 0 0 0 0 0 0 1 0 0 0 0 0 0 1 0%
Basic Platforms 1 0 0 0 0 10 2 0 2 0 6 0 0 21 48%
Service 0 0 0 0 0 0 9 0 1 0 2 0 2 14 64%
Dump 0 0 0 0 0 0 1 0 0 0 0 0 0 1 0%
Utility Truck 0 0 0 0 0 0 0 0 15 0 0 0 0 15 100%
Multistop Van 0 0 0 1 0 0 1 0 1 4 0 0 0 7 57%
Enclosed Vans 1 0 0 2 0 5 0 0 1 0 45 0 0 54 83%
Tank 0 0 0 0 0 0 1 0 0 0 0 0 0 1 0%
Class 5 with Trailer 0 1 0 0 0 3 0 0 0 0 0 0 10 14 71%
Output Class

WIM + Signature Classification: FHWA Class 9 Results
• 21 Classes, Overall CCR = 85%
32
Targets # CCR
Pla
tfo
rm
Basic 19 89
Low Boy Platform 10 90
Platform with Devices 2 0
Van
s
Enclosed 153 98
Drop Frame 3 0
Open Top 27 70
Curtain-side 2 0
Co
nta
iner
s 40ft Box Container 4 75
20ft Box Container 0 -
20ft on 40ft Chassis 0 -
53ft Box Container 8 50
Container Chassis 1 0
Targets, cont’d # CCR
Tan
ks
Pneumatic Tank 2 0
Chemical Tank 18 67
Spe
cial
ty
Auto Transp. 4 75
Agricultural Van 0 -
Livestock 1 100
End Dump 4 50
No
n-
Sem
i Auto. Transp. S 1 100
Passenger / Small Vehicle S 0 -
Small Trailer / Dolly S 0 -
S = Single Trailer (non-semi-trailer)

WIM + Signature Classification: FHWA 9 Collapsed Class Results
• 17 Classes, Overall CCR = 86%
33
Test DatasetP
latf
orm
Low
Bo
y P
latf
orm
Encl
ose
d V
an
Dro
p F
ram
e V
an
Op
en T
op
Van
40
ft C
on
tain
er
20
ft C
on
tain
er
20
ft o
n 4
0ft
Ch
assi
s
53
ft C
on
tain
er
Co
nta
iner
Ch
assi
s
Pn
eum
atic
Tan
k
Ch
emic
al T
ank
Au
to T
ran
spo
rt
Live
sto
ck
Agr
icu
ltu
ral V
an
End
Du
mp
No
n-S
emi
# Sa
mp
les
CC
R
Platform 18 0 1 0 1 1 0 0 0 0 0 0 0 0 0 0 0 21 86%
Low Boy Platform 1 9 0 0 0 0 0 0 0 0 0 0 0 0 0 0 0 10 90%
Enclosed Van 1 0 150 0 3 0 0 0 0 0 1 0 0 0 0 0 0 155 97%
Drop Frame Van 0 1 1 0 0 0 0 0 0 0 0 0 0 0 0 0 1 3 0%
Open Top Van 1 0 4 0 19 0 0 0 0 0 0 3 0 0 0 0 0 27 70%
40ft Container 0 0 0 0 1 3 0 0 0 0 0 0 0 0 0 0 0 4 75%
20ft Container 0 0 0 0 0 0 0 0 0 0 0 0 0 0 0 0 0 0 -
20ft on 40ft Chassis 0 0 0 0 0 0 0 0 0 0 0 0 0 0 0 0 0 0 -
53ft Container 0 0 4 0 0 0 0 0 4 0 0 0 0 0 0 0 0 8 50%
Container Chassis 0 0 1 0 0 0 0 0 0 0 0 0 0 0 0 0 0 1 0%
Pneumatic Tank 1 0 0 0 0 0 0 0 0 0 0 1 0 0 0 0 0 2 0%
Chemical Tank 3 0 0 0 1 1 0 0 0 0 1 12 0 0 0 0 0 18 67%
Auto Transport 0 0 0 1 0 0 0 0 0 0 0 0 3 0 0 0 0 4 75%
Livestock 0 0 0 0 0 0 0 0 0 0 0 0 0 1 0 0 0 1 100%
Agricultural Van 0 0 0 0 0 0 0 0 0 0 0 0 0 0 0 0 0 0 -
End Dump 0 0 1 0 0 0 0 0 0 0 0 1 0 0 0 2 0 4 50%
Non- Semi 0 0 0 0 0 0 0 0 0 0 0 0 0 0 0 0 1 1 100%
Outputs
Targ
ets

WIM + Signature Classification: Model Results in Context
• Lit Review of Class. Studies
34
Model Structure Loop Only Model WIM + Loop Model
Single Units Multi-Units FHWA 5 FHWA 9
# Classes 27 28 33 21
CCR 77% 82% 69% 85%
Recap of Proof-of-Concept Model Results:
Author (year) Classifications CCR
Ki and Baik (2006) 5 Classes 91.5%
Sun and Ritchie (2000) 7 Classes 82-87%
Jeng and Ritchie (2008) 13 Classes 93%
Liu et al. (2011) 5 MOVES Classes 97.6%
Tok (2009) 9 Drive and 10 Trailer Unit 81.8%
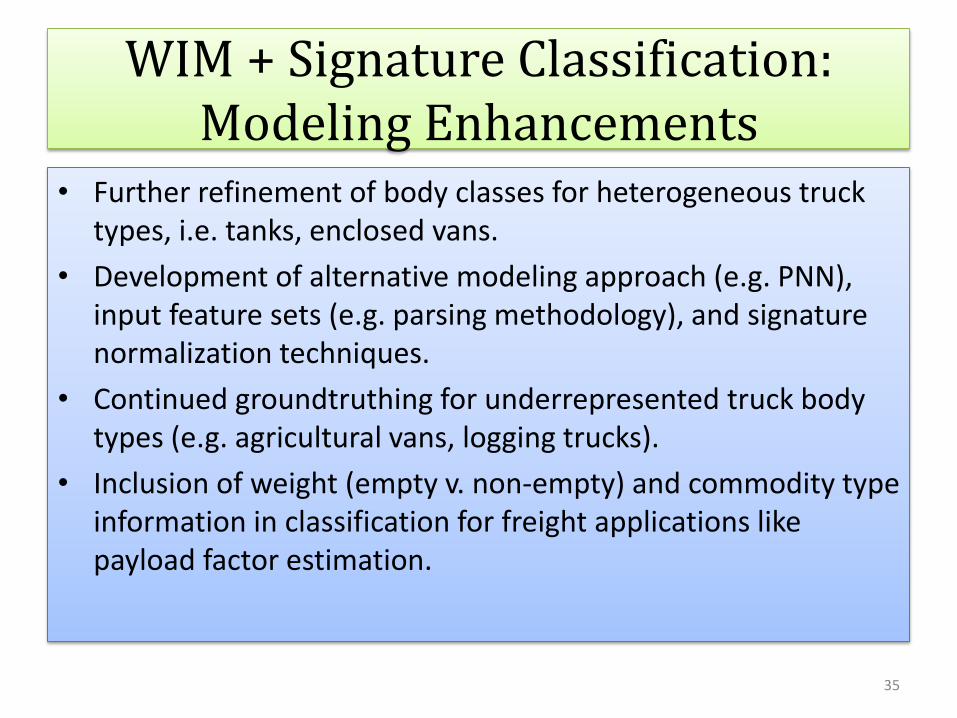
WIM + Signature Classification: Modeling Enhancements
• Further refinement of body classes for heterogeneous truck types, i.e. tanks, enclosed vans.
• Development of alternative modeling approach (e.g. PNN), input feature sets (e.g. parsing methodology), and signature normalization techniques.
• Continued groundtruthing for underrepresented truck body types (e.g. agricultural vans, logging trucks).
• Inclusion of weight (empty v. non-empty) and commodity type information in classification for freight applications like payload factor estimation.
35

HARDWARE INTEGRATION
36

Hardware Integration Tasks
37
1060 Controller Integration
iSinc Controller Integration
Inductive Signature Comparison between
1060 Controller and iSinc Controller

WIM Sites by Controller Type
38
1060 series
iSINC

1060 Controller Hardware Integration Components
39
222 Input File with Inductive Signature Detector Cards
Field Processing Unit 1060 Loop Sensor Module (LSM) and
LSM Adapter (right)

Deployment of 1060 Controller Hardware Integration Components
IST 222 Signature Detector Card & 222 Input File Interface
Field Processing Unit
LSM Adapter 1060 WIM Controller Cabinet

1060 Controller Hardware Integration Architecture
1060 Controller
IST-222 LSM Adapter for WIM
lanes 1 & 2
1060 Controller
Loop Sensor Module
IST-222 Signature
Detector Card 222 Input
File Interface
IST-222 Signature
Detector Card
WIM Lane #1
WIM Lane #2
Field Processing Unit
Null Modem Serial Cable
USB Cable
Custom Dual VGA-type 15-pin Interface
222 Interface
1060 Module Interface
WIM data logging In
du
ctiv
e Si
gnat
ure
d
ata
logg
ing
Scale Sensor Module Modem
Standalone 1060
Integrated 1060
Replaces Loop Sensor Module

iSinc Hardware Components
iSinc Controller with Serial Bus Module (SBM)
SBM Null MODEM
Cable
Field Processing Unit

i-Sinc Controller Hardware Integration Architecture
iSinc WCU-III
Serial Bus Module (SBM)
Field Processing
Unit
Null MODEM (WIM & Signature Data)
Loop Sensor Module (LSM)
Scale Sensor Module (SSM)

Controller Integration Summary
1060 Controller
• Successfully integrated with IST-222 inductive signature detector cards and field processing unit for data collection
iSinc Controller
• Performed trial data collection through Serial Bus Module
• Needs further investigation to parse binary data

Comparison of IST and iSinc Inductive Signatures
• Objective
Statistical testing on the signatures from the IST and iSinc detectors
If IST and iSinc signature are not statically different, classification model with IST signature will be applicable to iSinc signature
• Records
Yale (IST-IST) : 400 vehicle records
Westminster (IST-iSinc) : 97 vehicle records
45

Experimental Setup
• Yale (IST – IST) • Westminster (IST – iSinc)
46
VDS Loops (IST Card)
S/B WIM Sensors (IST Card)
S/B WIM Sensors (iSinc Card)
VDS Loops (IST Card)

Signature Transformation
• Step 1. Normalization
• Step 2. Shift and Stretch
47
Normalization

Comparison results of transformation
Before Transformation
IST-IST
IST-iSinc
After Transformation
Average Median Error : 0.048 Average Median Error : 0.021
Error
Average Median Error : 0.030 Average Median Error : 0.021

Result
• Statistical test T-test of the mean of median error from the IST-
IST and IST-iSinc are equal
Result : cannot reject the null hypothesis at the 5% significance level
• Interpretation : Signatures from IST and iSinc are not statistically different.
• Conclusion : The classification model is applicable to iSinc signatures.
49

Progress Summary: Phase 1
• Phase 1 (Proof of Concept) Task 1.1 (Signature-only Classification)
• Performed required data collection and data ground truth • Developed proof-of-concept model for 27 single unit classes at
77% CCR AND 28 multi unit trailer classes at 82% CCR • Identified possible modeling improvements for Phase 2
Task 1.2 (WIM & Signature Classification) • Performed data collection required and data ground truth • Developed proof-of-concept model for FHWA Class 5 with 33
classes at 69% CCR AND FHWA Class 9 with 21 classes at 85% CCR • Identified possible modeling improvements for Phase 2
Task 1.3 (Hardware Integration) • Designed hardware integration architecture • Developed hardware components for integration
50

Progress Summary: Phase 2
• Phase 2 Task 2.1 (Data Collection)
• Performed data collection at 7 sites
• Performed data ground truth of ~8000 trucks
Task 2.3 (Spatial Propagation) • Performed literature review of propagation techniques
Task 2.5 (Optimal Facility Location) • Analyzed WIM data
• Explored Truck GPS data to determine truck routes associated with each WIM station
51

THANK YOU! Questions and Comments
53


![Stanford University · 3.1 Dataset SQuAD dataset is a machine comprehension dataset on Wikipedia articles with more than 100,000 questions [1]. The dataset is randomly partitioned](https://img.dokumen.tips/doc/110x75/602d75745c2a607275039f53/stanford-university-31-dataset-squad-dataset-is-a-machine-comprehension-dataset.jpg)