Embed Size (px)
Citation preview
PROGRESS IN X-RAY ASTRONOMY
Riccardo Giacconi
American Science and Engineering, Inc. Cambridge, Massachusetts 02139*
INTRODUCTION
The most significant progress in x-ray astronomy in the past few years has been brought about by the advent of satellite observatories and by the great num- ber of new radio and optical identifications of cosmic x-ray sources.
Since the discovery from rocket-borne instruments of extrasolar sources of x-radiation, ten years ago, it has been clear to most experimenters that a very considerable advancement in our knowledge could be obtained through the use of satellite instrumentation. The launch of the first small astronomy satellite, UHURU, entirely devoted to x-ray observations, which occurred on 12 Decem- ber, 1970, was expected to lead to the detection of fainter sources with finer angular resolution and positional accuracy, thereby expanding our catalog of celestial x-ray emitters. What was unexpected was the qualitative change in our understanding of the nature of cosmic x-ray emitting objects that several new discoveries by UHURU have brought about.
The discovery of pulsating x-ray sources in binary systems has offered us the first clear evidence of the role of accretion as the energy source for the genera- tion of the very large x-ray fluxes observed from stellar objects. The presence in these systems of white dwarfs, neutron stars, or black holes gives us a most fortunate astrophysical laboratory in which to study their properties. Evidence is becoming more convincing almost on a weekly basis in favor of the interpre- tation of the Cygnus X-1 in terms of a black hole orbiting a massive companion.
In extragalactic x-ray research the increase in the number of observed sources has been so great as to make it possible for the first time to attempt a classifica- tion of different types of extragalactic emitters and to evaluate their contribution to the isotropic x-ray background. The detection of stellar sources in external galaxies of the local group has established an unequivocal value for the intrinsic x-ray luminosities of stellar objects. The detection of diffused emission from clusters of galaxies furnishes important clues on the dynamics of the clusters and on the existence of intracluster gas and may provide a very powerful tool with which to investigate cosmological questions.
As the scope of x-ray astronomy expands and the observations yield a greater and greater wealth of experimental data, it becomes impossible in a short review to give a comprehensive description of the experiments and of the results. I will base most of my remarks on results obtained from UHURU, with a sprinkling of data from the two satellite experiments by M.I.T. and La Jolla on the OSO-7 satellite and some from rocket flights.
I will not attempt to describe results obtained at x-rays of lower energies than observable from UHURU, about 1-20 keV, except as they pertain to the discussion of particular objects. This is not due to any lack of progress in the field, but rather to the fact that the sky appears quite different below and above 1 keV. At low energies the diffused background appears dominated by galactic
* Present address: Center for Astrophysics, Cambridge, Massachusetts 02138. 149
150 Annals New York Academy of Sciences
contributions in net contrast to what we believe to be the case at higher energies. Also, the individual sources observed, such as extended supernova remnants, appear in general to be characterized by lower temperatures than observed for compact stellar sources and are, therefore, unobservable at higher energies. The production mechanisms giving rise to the observed radiation also appear to be different in the two regions of the spectrum. Finally, with the exception of old supernova remnants, there is no evidence for the existence of sources below 1 keV not observed at higher x-ray energies.
THE NIGHT SKY IN X-RAYS Before discussing individual properties of x-ray sources, it is useful to con-
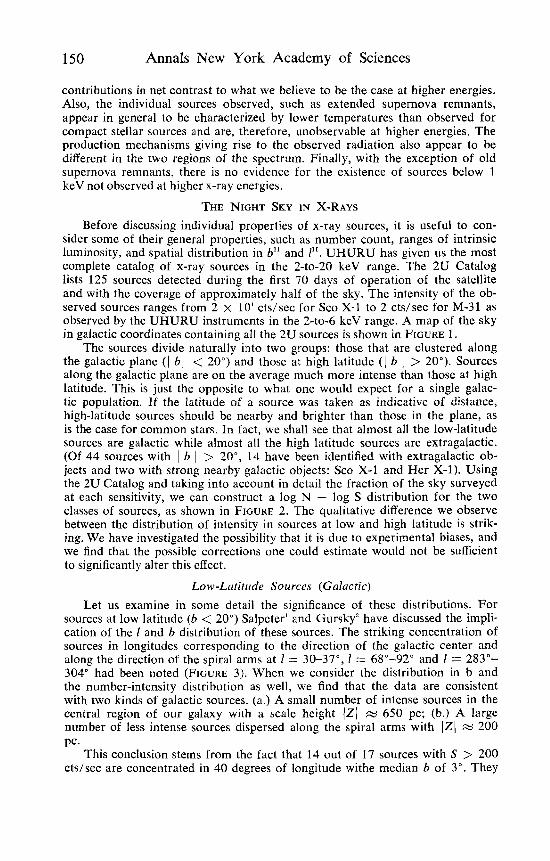
sider some of their general properties, such as number count, ranges of intrinsic luminosity, and spatial distribution in b" and 11', UHURU has given us the most complete catalog of x-ray sources in the 2-to-20 keV range. The 2U Catalog lists 125 sources detected during the first 70 days of operation of the satellite and with the coverage of approximately half of the sky. The intensity of the ob- served sources ranges from 2 x 10' cts/sec for Sco X-1 to 2 cts/sec for M-31 as observed by the UHURU instruments in the 2-to-6 keV range. A map of the sky in galactic coordinates containing all the 2U sources is shown in FIGURE 1 .
The sources divide naturally into two groups: those that are clustered along the galactic plane ( 1 bl < 20") and those at high latitude (I b 1 > 20"). Sources along the galactic plane are on the average much more intense than those at high latitude. This is just the opposite to what one would expect for a single galac- tic population. If the latitude of a source was taken as indicative of distance, high-latitude sources should be nearby and brighter than those in the plane, as is the case for common stars. In fact, we shall see that almost all the low-latitude sources are galactic while almost all the high latitude sources are extragalactic. (Of 44 sources with I b I > 20", 14 have been identified with extragalactic ob- jects and two with strong nearby galactic objects: Sco X-1 and Her X-1). Using the 2U Catalog and taking into account in detail the fraction of the sky surveyed at each sensitivity, we can construct a log N - log S distribution for the two classes of sources, as shown in FIGURE 2. The qualitative difference we observe between the distribution of intensity in sources at low and high latitude is strik- ing. We have investigated the possibility that it is due to experimental biases, and we find that the possible corrections one could estimate would not be sufficient to significantly alter this effect.
Low-Latitude Sources (Galactic) Let us examine in some detail the significance of these distributions. For
sources at low latitude (b < 20") Salpeter' and Gursky' have discussed the impli- cation of the 1 and b distribution of these sources. The striking concentration of sources in longitudes corresponding to the direction of the galactic center and along the direction of the spiral arms at 1 = 30-37", I = 68"-92" and 1 = 283"- 304" had been noted (FIGURE 3). When we consider the distribution in b and the number-intensity distribution as well, we find that the data are consistent with two kinds of galactic sources. (a.) A small number of intense sources in the central region of our galaxy with a scale height IZI M 650 pc; (b.) A large number of less intense sources dispersed along the spiral arms with IZI w 200 PC.
This conclusion stems from the fact that 14 out of 17 sources with S > 200 cts/sec are concentrated in 40 degrees of longitude withe median b of 3". They
Giacconi: Progress in X-Ray Astronomy 151
x m
al .c, L 0

152 Annals New York Academy of Sciences
10=
102
N (S)
lo'
I I I I
% SLOPE=-0.4
100
- SLOPE= -1.34
I I
10' 10' 103
S Cis/sec FIGURE 2. X-ray source number counts in the 2-6 keV energy range are plotted
as a function of S, counts/second. The low-latitude sources, b < 20", are shown as dots, the high-latitude sources, b > 20°, are shown as x's. Also shown are the best-fit straight lines to the data. All data are corrected for nonuniform sky coverage. The righthand scale applies only to the b > 20" sources.
appear to show large, low-energy cutoffs that do not appear to vary with time. If the cutoff is due to interstellar absorption, as pointed out by many authors (see, for instance, Seward and colleagues3), then they must be near the galactic center. This required that they have large intrinisic luminosity of the order of 10" erg/sec, a value that does not appear unduly large in view of the observa- tion of individual sources of comparable intrinsic luminosity in the Small and Large Magellanic Clouds. Their galactic half width then would be of Z = 650 parsecs, typical of an intermediate population 11." Thus, in the log N - log S plot, the highest-intensity sources are also the furthest from us. The slope of -1.5 for these objects would simply be a fortuitous result of the intrinsic range of luminosities of these sources (10:" < L, < 10" ergs/sec-' in the range from 2-10 keV).
The remainder of the sources with S < 200 cts/sec and b < 20" are more uniformly distributed in 1 with an apparent correlation with spiral arms. If they have the typical Z of a type I population, ( Z / 200 pc, their median of lb( 5.6" places them on the average about 2 kpc away, with a resulting intrinsic lumi- nosity of 10" erg/sec in the range of 2 to 10 keV. This is in agreement with the intrinsic luminosities we estimate in the identified objects. If the sources are in- deed clustered in the spiral arms, one would expect to observe a slope for the log N - log S curve of about -0.5 consistent with the data. If we adopt the above view on the intrinsic luminosity and distances of the sources, it also follows that at 3 cts/sec minimum intensity, we can observe sources with L, >, throughout the buIk of our galaxy.

Giacconi: Progress in X-Ray Astronomy 153
A
154 Annals New York Academy of Sciences
The bulk of the luminosity in our galaxies is given by the integrated emission of a dozen extremely powerful (L, 2 10" ergs/sec) sources concentrated at the galactic center, just as it appears to be the case in the LMC and SMC. Some 100 more sources emitting at L, w 10'" dispersed through the galactic arms, of which two-thirds have in fact already been observed, would yield about 10% of the total galactic output. There might be additional sources of x-ray radiation in the galaxy due either to diffused sources or to unresolved discrete sources. These may be the cause of the observed galactic ridge of a few counts/sec ob- served in the 2-to-20 keV range at several places along the Milky Way. The observed flux from the ridge can be related to an emission of E M ergs/ cm3/sec, implying a limit of about 10'' erg/sec for the total galactic emission due to all unresolved sources in the 2-to-20 keV range.
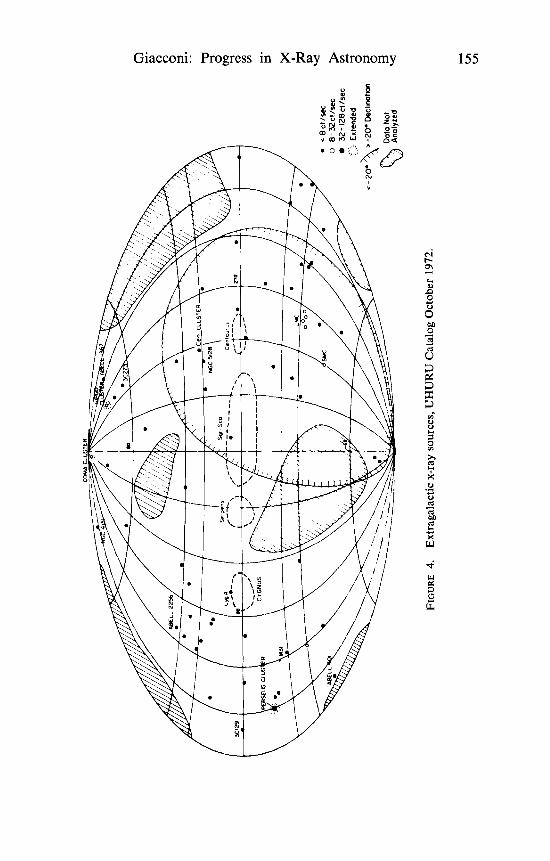
High-Latitude Sources (Extragalactic) The 2U Catalog lists 44 sources at high latitude lbl > 20". Of these, two
have high density (2 x lo4 cts/sec for Sco X-1 and 10' cts/sec for Her X-1) and are identified with galactic objects. Five are identified with individual stars in the LMC and SMC at about 20 cts/sec. Ten with intensity ranging from 20 cts/sec (Virgo Cluster M 87) to 2 cts/sec (M 31) are identified with individual galaxies or clusters, and the remainder are unidentified. A map of the sky in galactic coordinates for all identified extragalactic sources and all sources weaker than 8 cts/sec is shown in FIGURE 4. Since all of the weak sources that have been identified have been found to be extragalactic, we are led to question whether also the unidentified sources with b > 20" are extragalactic. Examining their 1 and b distributions, we note that they are consistent with isotropy. This could be reconciled with galactic origin only if the sources were members of a halo population, or were very nearby objects. The first possibility is excluded by the fact that we observe no excess in the direction of the galactic center; the second, by the fact that we do not observe a very intense galactic ridge. Unless we invent an ad hoc galactic population with appropriate intrinsic luminosity and distribution, we are led to conclude that all high-latitude sources are ex- tragalactic.
With this in mind, we can consider the log N - log S distribution for high- latitude sources. While we cannot assume a restricted range of intrinsic lumi- nosity for the objects, if we assume that objects of each class contained in the sample are uniformly distributed in space and not subject to evolutionary effects, then the slope of the Log N - log S relationship should be -1.5 out to a redshift 2 of 0.25. The slope we find experimentally is -1.34 2 0.2 consistent with the value we expect for isotropically distributed extragalactic sources in a static Euclidean universe. Thus, this also is consistent with the hypothesis that all high- latitude sources are extragalactic. This conclusion has important consequences with respect to the possibility that the bulk of the isotropic x-ray background may be due to the superposition of fainter unresolved sources of this type and because the unidentified sources may belong to a new class of extragalactic x-ray emitters. We can now turn to a more detailed consideration of the properties of the individual extragalactic and galactic sources.
GALAXIES OF THE LOCAL GROUP
We have discussed previously the fact that most of the x-ray luminosity of our own galaxy appears to be due to a very small number of high-intensity (L, x 10" erg/sec) sources. If we integrate all contributions, we find that our
Giacconi: Progress in X-Ray Astronomy 155

156 Annals New York Academy of Sciences
galaxy would have a total L, of about 3 x 10'" erg/sec. These conclusions are supported by the observation of individual sources in the L M C and the SMC. FIGURE 5 shows the map of x-ray emission from the LMC. The emission of the galaxy as a whole is of about 4 x 10" erg/sec. More than 90% is due to four individual sources, each of about L, =loJ8 erg/sec. In the Small Magellanic Cloud the x-ray emission is dominated by a single x-ray eclipsing system of about L, = 10" erg/sec in the 2-8-keV range. M-31 has also been detected with L, = 1.2 x lo3' erg/sec. Since the source is near the limit of our sensitivity, it is not yet posible from UHURU to study the existence and distribution of in- dividual sources in M-3 1.
RIGHT ASCENSION FIGURE 5 . Map of the Large Magellanic Cloud. In addition to the three sources
there is a diffuse emission whose intensity, averaged over the whole region shown in the map, is (0.57 2 0.16) counts/sec-l. The heavy rectangles show areas in which additional excess emission appears. Some radio and optical features are shown for comparison: the bar is represented by the dash-dot line (--.--.); the constellations" by the rectangles. Scan tracks of the center of the field of view of the 0"s FWHM detector for the three scans are given by the dashed lines.
Giacconi: Progress in X-Ray Astronomy 157
We conclude that in normal galaxies, including our own, the x-ray emission appears to be dominated by the integrated output of individual stellar sources. The x-ray luminosity appears to be a small fraction of the total light emitted at all wavelengths LsIL rad M 10.'. In all other identified extragalactic sources the total energy emitted in x-rays is much larger in absolute value ranging from 10" to lo4' erg/sec in the I-to-10-keV range, and also relative to the total emission at all wavelengths.
Seyferts, QSOs, Radio Galaxies
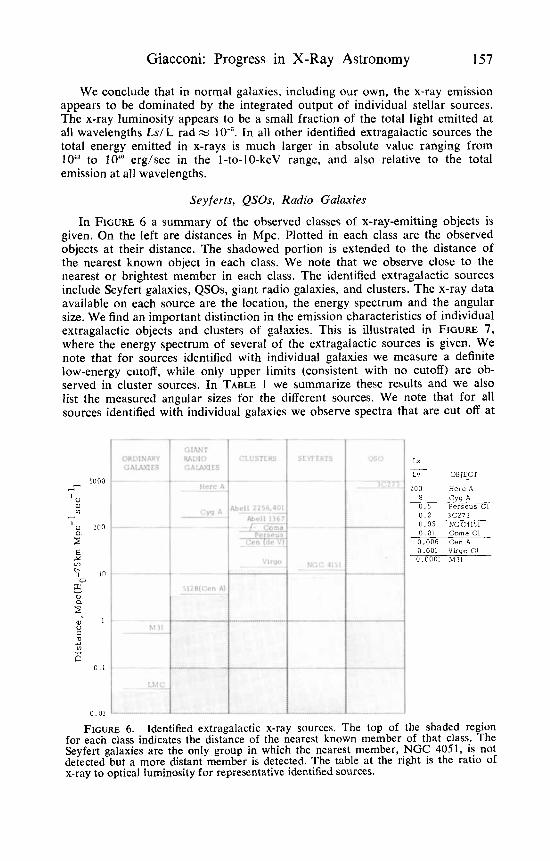
In FIGURE 6 a summary of the observed classes of x-ray-emitting objects is given. On the left are distances in Mpc. Plotted in each class are the observed objects at their distance. The shadowed portion is extended to the distance of the nearest known object in each class. We note that we observe close to the nearest or brightest member in each class. The identified extragalactic sources include Seyfert galaxies, QSOs, giant radio galaxies, and clusters. The x-ray data available on each source are the location, the energy spectrum and the angular size. We find an important distinction in the emission characteristics of individual extragalactic objects and clusters of galaxies. This is illustrated in FIGURE 7, where the energy spectrum of several of the extragalactic sources is given. We note that for sources identified with individual galaxies we measure a definite low-energy cutoff, while only upper limits (consistent with no cutoff) are ob- served in cluster sources. In TABLE 1 we summarize these results and we also list the measured angular sizes for the different sources. We note that for all sources identified with individual galaxies we observe spectra that are cut off at
1000
100
10
1
0 . 1
0 .01
Lx
L" OBi'LCT
200 Herc A
- - _ _
8 Cyg A 0 . 5 Perseus C1 0.2 3 C 2 7 3 0 . 0 5 NCC4151 0.01 coma CI 0.006 CenA 0.001 Virgo Cl 0.0001 M i l
FIGURE 6 . Identified extragalactic x-ray sources. The top of the shaded region for each class indicates the distance of the nearest known member of that class. The Seyfert galaxies are the only group in which the nearest member, NGC 4051, is not detected but a more distant member is detected. The table at the right is the ratio of x-ray to optical luminosity for representative identified sources.

158 Annals New York Academy of Sciences
0.7
W
5 c3
t- z 1.0 5 8 w 2 5 1.0 k!
01
-
-
-
-
a.003 1024
T
t
-2 0 2 4 6 8 1 0
IC
6C
2c
IC
0
I
10 -
01 -
1 2 1 4 0 2 4 6 8 ! 0 0 2 4 6 8 1 0 E (keV)
FIGURE 7. Spectra of extragalactic sources. Counting rates versus energy are plotted as histograms with 1-sigma error bars. The closed circles are the predicted count ranges, assuming model spectra as inputs and computing the count rate after accounting for counter efficiency, pulse height resolution, and fluorescence-escape effects. The slope is given as OL for the energy index of a fit to a power law, or kT for an exponential. E, is the low-energy cutoff in keV, assuming photoelectric absorp- tion. The four spectra in the left column show a drastic turnover at low energies. The spectra in the center column and the two lower ones in the right column are from sources located in clusters and show no cutoff. The spectrum of the Crab Nebula is shown at the top of the right column for comparison.
low energy, and small angular size, For cluster sources we observe no cutoff and extended size.
In the case of 4151, the stated limit of 15 arc minutes corresponds to about 50 kpc diameter at the distance of 4151. In fact, the emitting region may be much more compact. The very large cutoff, which corresponds to a column density of absorbing matter in excess of atoms/cm-', could be taken to indicate that the x-rays are coming from a small region at the nucleus of NGC 4151. In fact, if we assume that the source is of much larger dimensions, the total mass one can derive for the absorbing gas is prohibitively large (3.5 X 10" Mo). Similar considerations apply in the case of NGC 5128 and 3s 273. (In FIGURE 8 the observed location of the source in NGC 5128 is shown. It is clear that the emission is concentrated in a region not much larger than the optical galaxy).

Giacconi: Progress in X-Ray Astronomy 159
TABLE 1 SIZES AND X-RAY LUMINOS~TIES OF EXTRAGALACTIC X-RAY SOURCES*
Size Lx Ea
angular kpc (ew/sec) (keW
Abell2256 Perseus-NGC 1275 Coma CEN-NGC 4696 Virgo-M87 NGC 4151 NGC 5128 GCX 3C273
35' f 15' 35' f 3' 36' 4' 37' f 8' 50' f 5'
515 ' - < 10' - J 2 O
?
2800 5 X 10" 740 3 x 1 0 4 4
1050 2 x 1044 500 2 x 1 0 4 3 200 7 x 1042 5 60 1 x 1042
? 2.7 x 1 0 4 6
5 20 6 X 1041 -0.3 N 1037
< 1 . 7 31.1 - <1.0 - C1.9 <1.0
5.7-Zt 1.1 3.0 f 0.4 2.8 f 0 . 2 2.6 f 0.1
* Five extended cluster sources and three compact sources not in clusters are listed. The cluster sources are mjch more luminous than the compact sources. Also shown for comparison are the dimensions and luminosity of GCX, the extended source at the center of our own galaxy.
CLUSTER CONTAINING- NGC 4696
I
IZ?d 12'm~
FIGURE 8. Centaurus A. The optical galaxy NGC 5128 is located within the x-ray source error box. The size of the source is less than 10'. This still allows the x-ray emission to be coming from the inner radio lobes shown in the inset or from the optical galaxy. The nucleus of the optical galaxy is the most likely location of the source, since it is so strongly cut off at low x-ray energies, because of absorption.
We conclude that the x-ray we observe from these individual galaxies are emitted in small regions near the nucleus of the galaxy. Presumably they are not due to the collective emission of a number of individual stars, since the x-ray output is lo3 times larger than in normal galaxies and the LJLv ratio is also much larger. Also, since the emission spectra are so different, we can conclude that the emission from the clusters must originate from a different mechanism than the collective emission from the individual cluster galaxies. At present we
160 Annals New York Academy of Sciences
do not have sufficient data to distinguish between thermal bremsstrahlung emission and synchrotron or inverse Conipton emission processes for the emis- sion occurring in individual galaxies.
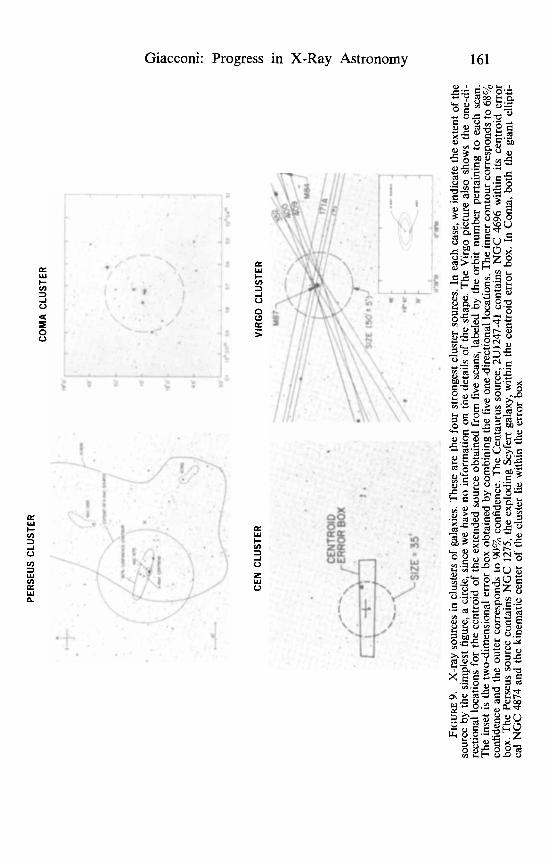
Clusters The detection of x-ray emission from extended regions in clusters of galaxies
is potentially one of the most important new results from UHURU. We have identified about 10 sources associated with clusters. In FIGURE 9 the positional information of the x-ray source region for the clusters in Virgo, Centaurus, Perseus and Coma is shown. We find that the center of emission is centered on active galaxies when present, as in Virgo and Perseus. They have great physical size (-1 Mpc). The x-ray emission appears to be strongly dependent upon cluster richness, and for richness class 2 we observe a narrow range of luminosities be- tween lo'& and 10'" erg/sec. They are, therefore, much more luminous than in- dividual galaxies. The absence of cutoffs in their spectra seems to require that they are truly diffused rather than a collection of individual sources. The spectral information available from UHURU alone is insufficient to distinguish between possible emission mechanisms. In particular, one cannot distinguish between a power-law spectrum and an exponential spectrum. However, rocket observations of Coma and Virgo at long wavelength (10-20A) appear to favor a turnover at low energy, as would be expected for an exponential thermal bremsstrahlung
These results also seem to indicate the presence of a more complex structure in the emission region of Coma and Virgo than indicated by our simple fit to a uniformly illuminated extended source. In particular, there appears to be evidence for a region of small angular size containing about one-third of the total flux centered on the active galaxy.
If the mechanism for emission is thermal bremsstrahlung from a hot inter- cluster gas, we find that the gas would have a total mass comparable to the mass contained in the observed galaxies and a temperature of some 70 x 10°K. This gas could be heated by energy output from active galaxies. I t might be that the x-ray emission is not simply related to cluster richness, but to specific parameters describing the dynamics of the clusters. Solinger and Tucker' have suggested, for example, that the x-ray emission be related to the fourth-power velocity dispersion of the galaxies of the cluster, and although not proved, this suggestion appears consistent with all available data.
It is to be expected that further study of the powerful extended sources in clusters will tell us much about the evolution of clusters and perhaps about cosmological phenomena. The rich clusters, being very luminous and of great angular size, will be identifiable out to distances where redshift effects dominate. We might be able with the advent of large orbiting x-ray observatories to detect clusters to Z = 3 and learn about their evolution in the early stages of the forma- tion of the universe.
Unidentified Extragalactic Sources and the Diffused Background In a simple way, if we extrapolate the observed log N - log S curve for
extragalactic sources to smaller values of the intensity according to a slope of -1.5 or steeper, we find that we can account for the diffused x-ray background in the 2-20 keV range by the summed contribution of individual sources provided we can extrapolate to a source strength about times smaller than observed and, therefore, to a distance about 30 times larger than the objects we observe.
CEN
CLU
STER
..
.
.
29"O
45'
30
5
22
0
45
'
CO
MA
CLU
STER
-7
-i-
-r
- 77-7-
-
I 4
..
I I i .
I
I
FIG
UR
E
9.
X-r
ay s
ourc
es in
clu
ster
s of
gal
axie
s. T
hese
are
the
four
stro
nges
t clu
ster
sou
rces
. In
each
cas
e, w
e in
dica
te th
e ex
tent
of
the
sour
ce b
y th
e si
mpl
est f
igur
e, a
circ
le, s
ince
we
have
no
info
rmat
ion
on t
he d
etai
ls o
f the
sha
pe. T
he V
irgo
pict
ure
also
sho
ws
the
one-
di-
rect
iona
l loc
atio
ns f
or th
e ce
ntro
id o
f th
e ex
tend
ed s
ourc
e ob
tain
ed f
rom
five
sca
ns, l
abel
ed b
y th
e or
bit
num
ber
perta
inin
g to
eac
h sc
an.
The
inse
t is
the
two-
dim
ensi
onal
err
or b
ox o
btai
ned
by c
ombi
ning
the
five
one-
dire
ctio
nal l
ocat
ions
. The
inne
r con
tour
cor
resp
onds
to 6
8%
conf
iden
ce a
nd th
e ou
ter
corr
espo
nds
to 90%
conf
iden
ce. T
he C
enta
urus
sou
rce,
2U
1247
-41
cont
ains
NG
C 4
696
with
in i
ts c
entro
id e
rror
bo
x. T
he P
erse
us so
urce
con
tain
s N
GC
127
5, th
e ex
plod
ing
Seyf
ert g
alax
y, w
ithin
the
cent
roid
err
or b
ox. I
n C
oma,
bot
h th
e gi
ant
ellip
ti-
cal N
GC
487
4 an
d th
e ki
nem
atic
cen
ter
of t
he c
lust
er li
e w
ithin
the
erro
r bo
x.

162 Annals New York Academy of Sciences
TABLE 2 CONTRIBUTIONS TO THE DIFFUSE X-RAY BACKGROUND
(2-6 keV)
df Type erglsec P (MPc-3) erg/cm sec ster
Lx
Normal galaxies 2 X 1039 .03 .24 x Radio galaxies 6 X 1041 3 x 10⁻⁶ .07 x Seyferts 1042 3 x 10⁻⁴ 1.2 x 10⁻⁸ QSOs 3 x 1046 10-8 .08 x Clusters 2 X lo4' 10-6 .8 x
Total = 2.4 x 10⁻⁸ Observed = 3 x 10⁻⁸ ergs/crn* sec ster
If we attempt to define in more detail the contribution from different classes of extragalactic objects, we find the situation depicted in TABLE 2; namely, the largest contribution of 1.2 x lo-* erg/cm-'/sec-'/ster-' could come from Seyferts, if the luminosity of NGC 4151 is considered typical. From QSOs, if 3C273 is typical, we obtain 0.3 X lo-' and from rich clusters and normal galaxies 0.25 x 10~8/erg/cm''/sec-'/ster~'. The total is of order of 2 x 10.'; that is, approxi- mately one-half of the total diffused background observed by UHURU in the energy interval 2-10 keV. This calculation is obviously an upper limit, since in some of the classes of objects we consider, in particular Seyferts, it is possible that the sample object is usually bright. It, however, shows that the total con- tribution from individual sources can be a considerable fraction of the total background and also that, if all the background is due to discrete sources, the unidentified sources must contribute as much as one-half the total.
It is interesting to note that the present upper limit of point-to-point fluctu- ation of the diffused background in the energy region of interest is of order of 4% in 25 dega bins (the field of view of the UHURU counters). This result is consistent with the view that a large fraction of the background could be due to discrete sources whose density is of the order of 800 per 25 deg'. This is the density of sources that can be derived by extrapolation of the log N - log S curve to the required value such that the integral contribution of discrete sources equals the background. Thus, we conclude that a significant fraction, and perhaps the entire diffused background, could be due to discrete sources. If it is, the bulk of the contribution must come from the extragalactic sources so far unidentified.
Unidentified Sources
The unidentified sources constitute about two-thirds of all high-latitude sources. Of the 35 objects in this class, we have selected those with x-ray error boxes less than a few square degrees at northern latitudes. For these sources we conducted a search for association with known classes of cataloged extragalactic objects: Bright galaxies, Seyferts, QSOs, 3C radio sources, and Arp's peculiar galaxies. We find no association with any of these objects outside of possible chance coincidence. This implies that the x-ray flux from the objects much ex- ceeds the radio or visible light Aux. The suggestion has been made by Setti and Woltjer' that these objects could be radio-quiet QSOs. A preliminary search on the basis of very blue, starlike objects in the region of interest has shown no strong correlation. We are left with the possibility that we may be confronted with a new
Giacconi: Progress in X-Ray Astronomy 163
class of objects which I had suggested calling x-ray galaxies9 simply to indicate their main characteristic. I t might be possible by studying the spectrum of these objects, although very faint, to decide whether their integrated spectral content could also give rise to the observed background. Gursky'O has attempted to de- duce sme of the properties of these objects in the assumption that 75% of the background is due to such sources. He finds: distance to nearest object 2150 Mpc; intrinsic luminosity 2-10 keV 2 2 x 10" erg/sec; uniform volume density < 5 X lo-' M p P . It might be that the study of these objects may prove as rewarding as the study of faint radio sources has been.
Galactic Sources
The major new results in the study of galactic x-ray sources have been pro- duced by the refinement in our ability to measure positions in the sky, which has led to several new identifications with radio and optical objects, and by the opportunity afforded by satellite observatories to monitor with high time resolu- tion (0.1 sec) the x-ray flux of specific sources for periods of time as long as two years. Of the approximately 65 galactic sources with intensity greater than 8 cts/sec (4 X lo-' SCO) in the energy range 2-8 keV approximately 60% have positional errors in the 2U Catalog of <0.02 deg' and some 20% have positional errors less than 0.003 sq. degrees. While this is not better than the best that could be done for the strongest individual sources from a modulation collimator rocket experiment," the extension of these precise measurements to many more and weaker sources has led to significant new results. With respect to time variation, we had considerable indications prior to the UHURU flight for the existence of significant time variability in several of the galactic sources." How- ever, the short glimpses obtained with different payloads always raised the ques- tion of instrumental effects and did not give the characteristic time scale for the variation.
Of the 65 galactic sources, seven can be identified with supernova remnants, and their flux averaged over a second or longer is not observed to vary, although, of course, NP0532 is known to exhibit x-ray pulsations at 33 m/sec. Of the remainder, more than 60% have been observed to vary on the time scales of 0.1 sec or longer. In only five of the 21 cases where no variation was observed was the intensity greater than lO+'Sco X-1; thus, for several it might simply be that we have not yet achieved sufficient precision to determine their variability. The precision of the available locations and this general prevalence of short- time variability excludes the possibility that most of the galactic x-ray sources may be connected with extended supernova remnants. At most, 20% of them may ultimately fall into this category. The remainder must be associated with compact objects.
Considerable progress has been made in the past few years in the study of x-ray emission connected with supernova remnants, particularly with rocket measurements at long wavelengths. The energy source has been determined in the case of Crab to probably reside in the rotational energy of the pulsar, which is observed to slow down at a rate sufficient to provide the required erg/sec of energy. A particularly important experiment by Novick13 has established the existence of polarization of the x-ray radiation, thereby strongly supporting the view that x-rays are emitted via synchrotron radiation from energetic electrons. The x-ray emission from the diffused nebulae surrounding the older supernovas can apparently be explained as thermal bremsstrahlung emission from gas heated
164 Annals New York Academy of Sciences
by the transformation of transitional energy of the shell ejected by the supernova explosion. Satellite experiments have contributed very slightly to the develop- ment in the field; therefore, I will concentrate on the new results obtained on compact x-ray sources.
Compact Galactic Sources
by the following properties: AS outlined above, the majority of the sources in our galaxy are characterized
1. Their luminosity is in the range 10"'-10" ergs/sec. 2 . The number in the galaxy is exceedingly small-perhaps no more than
3 . The sources in the outer regions of the galaxy are found in the spiral arms; 4. The sources exhibit large (>2) variability in the 2-20 keV range with
time scales ranging from 0.1 second to months. 5. The excitation process by which x-rays are emitted favors the production
of 2-10-keV photons or most of the sources are embedded in an absorbing envelope with column density of order of 10'' atoms/cm2 of hydrogen. These last statements stem from the fact that no x-ray source is observed only at energies >20 keV. The flux at E > 20 keV is much smaller than in the 1-20- keV region. At most one or two sources are observed only at energies < 1 keV, a result that cannot be explained on the basis of interstellar absorption.
The preceding comments indicate that the compact x-ray sources are among the most luminous objects in our galaxy and that they are exceedingly rare or represent short-lived x-ray emitting phases in stellar evolution. Thus, one can conceive of very exotic circumstances that could furnish the energy source and the production mechanism for the observed x-ray fluxes. I n several of the sources, however, we are as yet unable to determine the nature of the energy im- put and of the acceleration or heating mechanism. This includes not only weak unidentified sources for which data may be insufficient, but also some of the strongest and best-identified, such as Sco X-1, Cyg X-2, GX 17 + 2, etc. A no- table exception exists, however, in this puzzling situation. One of the most im- portant recent results from UHURU is the discovery of x-ray sources in the binary system. Although we may not yet be able to fully understand all the details of these systems, we have an energy source, accretion, and well-defined ideas as to the dimensions and nature of the systems themselves.
Sco X-I-Like Sources
Sco X-1 was the first x-ray source observed. It was correctly identified in 1966 on positional data alone. The optical Sco X-1 has been subject to intensive study since its discovery, as has been reviewed by Hiltner." As part of the UHURU observing program, more than one week was devoted to correlated x-ray optical studies of this source. The x-ray emission in the 1-10-keV energy range can best be fit by an exponential spectrum with kT x 5 X 10°K HOW- ever, it is seen at energies >20 keV to possess a nonthermal tail. The x-ray spectral data themselves cannot be taken as positive evidence that the x-ray emission process is thermal bremsstrahlung. A more pIausibIe case for the thermal mechanism can be made by looking at the entire electromagnetic spec- trum. The optical continuum is consistent with an extrapolation of a simple thermal spectrum from x-ray into the visible light range. An important charac- teristic has been revealed in the infrared region as observed by Neugebauer and
100, of which about one-half have been observed;
Giacconi: Progress in X-Ray Astronomy 165
colleagues;I5 namely, that the flux density falls off as expected from free-free absorption in the emitting region, from which the size of the emitting region can be inferred at between 10' and 1 0 km, depending on the distance to the ob- ject. The observed absence of x-ray line emission is consistent with an object of the size; the lines become broadened and weakened by electron scattering.18
Optically, SCO X-1 varies between 12 and 13 m. The intensity varies by a few percent on a time scale of minutes (flickering) and flares by a factor of two on a time scale of hours. The spectrum shows a strong continuum plus a number of high-excitation emission lines. There is no evidence for a periodic component in the optical intensity or in the Doppler shift of the spectral lines, although the spectral lines do vary in both intensity and position. In radio, Sco X-1 is the seat of a faint, highly variable radio source radiating from about 0.2 flux units to below present limits of detectability of 0.005 flux units. There are present two weak, steady radio sources several arc minutes on either side of Sco X-1. To a precision of arc seconds the line joining these two sources passes through Sco x- 1 .='
Optical photometry and simultaneous x-ray optical observations performed in 1971 between the UHURU satellite and the Observatory in Cerro Tololo, Chile, a portion of which are shown in FIGURE 10, have revealed that the intensity in SCO X-1 has two well-defined states; in one of which both the x-ray and optimal intensity is relatively steady and variations occur of the order 20% over times of a day. The second state begins abruptly; both x-ray and optical intensity show continuous variability (flaring?) of a factor of two or more on a time scale of the order of less than one hour. The average intensity in both optical and x-ray in this second, active state is about a factor of two higher than in the first quiescent state.
There is a correlated spectral change as well. When active, the x-ray spectrum is harder (of higher temperature?) and the optical colors become more blue. These are average statements; the point-to-point values of intensity and spectrum do not show a good correlation. When the x-ray intensity is plotted against the simultaneously recorded optical intensity (B-magnitude), two states appear to ex- ist: the data points fall in only two sharply delineated regions; however, within those regions, the points show considerable scatter. The time of persistence of each state is of the order of days; there is no evidence that the occurrence of the states is periodic. The conventional view of Sco X-1 has been that the x-ray emission is thermal brernsstrahlung and occurs in a volume the size of order 10'-10' km. The optical emission is produced in a outer region and the radio even farther out. If Sco X-1 is radiating in x-rays at erg/sec, its distance would be 200 pc. From optical distance indicators, such as reddening, polarization on CaK absorption, we see that it is at least this distance, but could be much farther. Its optical luminosity at 200 pc would be loT3 erg/sec, about that of the sun.
Thus, in spite of an enormous amount of observational material, there is information available only on the size of the x-ray emitting region. There is no information on the mass or dimensions of the system. For example, being the strongest source, Sco X-1 has been subject to the most serious attempt to dis- cover emission lines in its x-ray spectrum without success, as most recently ex- emplified by Kestenbaum and associates."
Cyg X-2 is believed to be similar to Sco X-1, except there is not nearly SO much information available concerning it. Its intensity is only about %o of SCO X-1 , The optical identification was proposed in 1967'" and was based on the dis- covery of a star with characteristics similar to that of Sco X-1 within the area of

166 Annals New York Academy of Sciences
_ -
. .
v) c)
.- 0 a x c) .- I- j 8 I: M I: 0
.3
Giacconi: Progress in X-Ray Astronomy 167
uncertainty of the x-ray source. The distance is estimated to be 500 to 700 pc. If this distance is assumed, the x-ray luminosity is of the order of 10" erglsec, and the optical luminosity is lower by a factor of 100 and is dominated by the G-type star. The optical emission from the x-ray region could be, as in Sco X-1, about of x-ray emission.
Several other x-ray sources have properties, in terms of the spectrum and variabilities of the x-ray intensity, similar to those of Sco X-1 and Cgy X-2 (for instance, GX17 + 2); however, there has been no other identification of a similar optical object. If, however, the ratio L,/L,, , = lo', then this is not so surprising. Sco X-1 and Cyg X-2 are not only bright in x-rays but located at high galactic latitude out of regions of high optical obscuration. The visible emission from a source lo-' of Sco X-1 located in the galactic plane would appear to be of 17 m if its optical emission were lo-'' of its x-ray emission. Allowing for several magnitudes of obscuration, such a star would be hopelessly difficult to find.
X-Ray Binaries C y g X-I-a randomly pulsating x-ray object with extremely rapid intensity
variation on the time scale of 50 msec or less. Has been identified with a vari- able radio source, which in turn leads to an optical identification with a spectro- scopic binary of 5.6 days' period.
Cen X-3-an eclipsing (2.1 days) periodically pulsating (4.8 seconds) x-ray source. Doppler shifts in the period of pulsation in phase with the 2.1 days occultation period give us from the x-rays along fairly conclusive evidence for binary nature. No radio source or optical counterpart yet known.
Her X-1-an eclipsing (1.7 days), periodically pulsating x-ray source (1.25 sec). Doppler shifts in the period of pulsation, in phase with occultation period, demonstrated the binary nature. Recent identification with 1.7 days eclipsing optical binary. No radio identification yet. Her X-1 is the best known object after Crab Pulsar (possible I .24-sec pulsations).
2CJ(l700-37)-a 3.4 day x-ray eclipsing binary. Suggested candidate HDI 53 1 19 077" star on basis of positional coincidence.
2 U(0I I5-73)-a 3.9-day eclipsing x-ray binary. From positional coincidence it is assumed the source is in the SMC. Its importance is that we have some idea of distance. L, M erg/sec-'/cm-'.
2U(0900-40)-a variable x-ray source. Identified on the basis of positional coincidence with a B-type supergiant with a companion with period of nine days (SAO 220767). UHURU data and OSO-7 data confirm periodic behavior with a nine-day period."
C y g X-3-a 4.8-hour eclipsing x-ray source or periodically pulsating x-ray source. Has been identified with source of giant radio burst on September 2, 1972, on the basis of positional coincidence only.
All of the above sources, with the exception of Cyg X-I, share a common feature in that they show definite intensity variations periodically recurring over times of the order of 0.2 to 8 days. They also show common features in the spectra. To illustrate the first point, I would like to present some light curves for a few of the objects. FIGURE 11, 12, and 13 show the light curves for Cen x-3, 2UO155-73," and 2U1700-37. Cen X-3 was the first source observed to show eclipses in the x-rays; the observations have now been extended over two years. Notice the broad eclipse feature. 2U0115-73(SMC) has been observed over a time span of five months. The most interesting feature is that if the source is indeed associated with the SMC, then its x-ray luminosity is very large: L, - 10% erg/sec

168 Annals New York Academy of Sciences
FIGURE 11. The observed intensity from Cen X-3 average over 0. ld intervals and corrected for elevation in the field of view is plotted as a function of time. Statistical errors are now shown and are typically of the order of 1%. Also plotted is the average intensity predicted by the light curve.
in the 2-6 keV range. 2U1700-37 source first detected in December 1970 oc- cultations 3.4 days. Highly variable on short time scale. EcIipse duration 35%! The source is extremely variable in the x-rays. X-ray luminosity changed by a factor of 3 in two hours. Short time fluctuations in which 30% of flux changes in 3-second intervals. Thus, all sources we have considered here as binaries show deep and broad eclipses, except for Cyg X-1, It should also be noted that most of these sources show extreme variability in their x-ray flux.
Another common feature is their spectral shape and the existence of large and variabIe low-energy cutoff, except again for Cyg X-1. FIGURE 14 shows typical spectra of six of the sources mentioned before. The slide was prepared before the periodic nature of the intensity variations for Cyg X-3 had been dis- covered; however, Cyg X-3 has the same spectral behavior.
Intensities have been normalized to Cen X-3. The parameters shown repre- sent the best f i t s to the data of the power-law expression (with cutoff) shown at the top. Two characteristics immediately stand out:

DAT OF 1971
FIGURE 12. The intensity of SMC X-1 in observed counts/second during eight days in January and three days in June 1971. Data corrected for elevation in the field of view; I-sigma error bars include both statistical and elevation correction errors.
PHASE
FIGURE 13. The location of 2U 1700-37 shown on a n enIargement from the Palomar Sky Survey. Both the old location from the 2U catalog and the new UHURU position are shown. In addition, a location recently determined by Rappaport and co- workers is given." The bright star contained within all three location determinations is HD1593919, the suggested optical candidate.
169

170 Annals New York Academy of Sciences
ENERGY (keW
FIGURE 14. Binary source spectra.
1. All the spectra are hard or “fiat”, significantIy flatter than the Crab spec- trum, where (Y M I .
2 . For all the spectra, with the notable exception of Cyg X-1, there is signifi- cant low-energy attenuation.
I would like to note that a power law was chosen for uniformity. Cyg X-1 is the only one of the spectra both steep enough and with good enough statistics to allow us to distinguish between a power-law and an exponential thermal bremsstrahlung fit. Since UHURU has spectral response only up to 20 keV, any thermal spectrum much above that looks the same as a power law with index close to zero.
If we consider the seven sources we believe to be binaries, there is only one whose spectrum is not cut off: Cyg X-1. This is also the only one that does not occult. If we consider this to be more than a chance occurrence, we may offer a plausible explanation. In order to view occultation, the observer must be close to the plane of the binary orbit. Furthermore, most of any matter being trans- ferred between the members of the system (as with an accretion disk), as well as any circumbinary matter, will be concentrated in the orbital plane. Thus, low- energy absorption at the source would be most pronounced in the orbital plane and would thus be greatest for the occulting sources. I might also add that Bolton” has recently stated that the Cyg X-l optical binary candidate does have

Giacconi: Progress in X-Ray Astronomy 171
a rather low inclination, in agreement with the lack of x-ray occultations, and thus is of low-energy absorption.
To summarize the foregoing, there are a number of x-ray sources that we believe to be binaries either because of their x-ray behavior or because the can- didate object has been shown to be a member of a binary system. A11 of the sources that exhibit eclipses in the x-rays also show very flat spectra and large and variable low-energy cutoffs. All sources appear to exhibit large fluctuations in in- tensity-periodic pulsations of seconds in Cen X-3 and Her X-1, aperiodic fluctu- ations in time of milliseconds in Cyg X-3, and intensity changes in time of sec- onds or less on 2U1700-37 and in 2UO900-40. This is very strong indication that x-rays originate from compact regions of the order of less than 10" or lo9 cm.
When we attempt a more detailed examination of the characteristic of the x-ray-emitting binaries, we find that they seem to fall into two different types: ir- regular pulsating objects, such as Cyg X-1, and x-ray pulsars, such as Cen X-3 and Her X-1.
Cygnus x-1 Perhaps the most significant of the UHURU results for the galactic x-ray
sources has been the discovery of pulsations from Cygnus X-1, which led to further study of this object and to the present belief that we are dealing with a black hole. The discovery of the pulsations also led to a search for other rapidly varying x-ray sources, leading to many of the results I have been discussing. FIGURE 15 contains data already reported in the literature showing substantial variations in x-ray intensity on time scales from 100 milliseconds to 10s of seconds. Some 80 seconds of data are shown here summed on four time scales from 100 milliseconds up to 14 seconds. With the relatively good x-ray location determined by an MIT rocket flight and by UHURU, a radio source was dis-
yo
240
60
00
,L 1 _L- ~~i I X R ~ L ) 2- 21m. 2022 2a.o 2 0 S 8 20986 2,m. 2 0 2 2 ZWXO
SECONDS U 1
FIGURE 15. Observation of Cygnus X-1 on June 10, 1971. Data have been correc- ted for triangular collimator response. Data are summed over 0.096s, 0.48s, 4.8% and 14.4s intervals. Typical 1-sigma error bars are shown.

172 Annals New York Academy of Sciences
covered by Braes and Miley"" and by Hjellming and Wade." It is this precise radio location that led to the optical identification by Webster and Murdin': and by Bolton2' of Cygnus V-1 as a 5.6-day spectroscopic binary system. The central object of this system is a ninth-magnitude BO supergiant and conservative mass estimates such as 12 Mo lead to a mass in excess of 3 Mo for the unseen com- panion.
There is no evidence for a 5.6-day eclipse in the 2-6-keV region, and we be- lieve that previous reports of such an effect at higher energies was caused by the large-scale time variability and not by a 5.6-day effect. This does not rule out the identification and can be understood in terms of an appropriate inclination angle for the orbital plane of the binary system. Bolton in a recent preprint agrees with this conclusion and presents a refined 5.6-day period that is not in phase with the high-energy x-ray observations in accordance with our findings.
With the use of UHURU as an observatory, we have now accumulated over 16 months of data on Cygnus X-1, which are shown in FIGURE 16. We have plotted the 2-6-keV intensity vs day of 1970. The vertical lines for a given day show the range of variability observed on that day. For some days we have only the average intensity, shown by a dash available in our analyzed results. We see that a remarkable transition occurred in March and April 1971, with the source changing its average 2-6-keV intensity level by a factor of 4. We have also in- dicated in the figure the 6-10-keV and 10-20-keV x-ray intensities and see that the average level of the 10-20 keV flux increased by a factor of 2. The Figure also shows that at the same time the x-ray intensity changed, a weak radio source
RADIO FLUX X-RAY COUNTS PER SECOND W/M~H~ 2-6 keV
uo s, 8 T-7
c i t 1
I-, , , , , , , , , , , I
6 - 10 keV
L
10-20 keV
0 8 8 8 8
t , i
t +-I t ---i 1
FIGURE 16. Sixteen months of observations of Cygnus X-1. X-ray data are shown for three energy bands, 2-6 keV, 6-10 keV, and 10-20 keV plotted vs day of 1970. The transition discussed in the text occurred in the period near day 450. The radio data are shown at the bottom of the figure.
Giacconi: Progress in X-Ray Astronomy 173
appeared at the Cyg X-1 location and was detected by the Westerbork and NRAO groups. If, then, the arguments are reviewed, Cyg X-1 undergoes large intensity changes in times as short as 100 milliseconds, requiring the x-ray emit- ting region to be compact. The very good x-ray position plus the correlated x-ray- radio variation demonstrate the x-ray-radio identification. The optical-radio identification is based on position agreement better than 1 arc second. Then the optical data, taken conservatively, require at least 3 solar masses in the unseen companion, which is the compact x-ray source. Thus we have the strong possi- bility that Cygnus X-1 is a black hole-it is compact and itsmass exceeds 3 M o.
Centaurus X-3 and Hercules X-1 We come now to two x-ray sources, Cen X-3 and Her X-1, that are identified
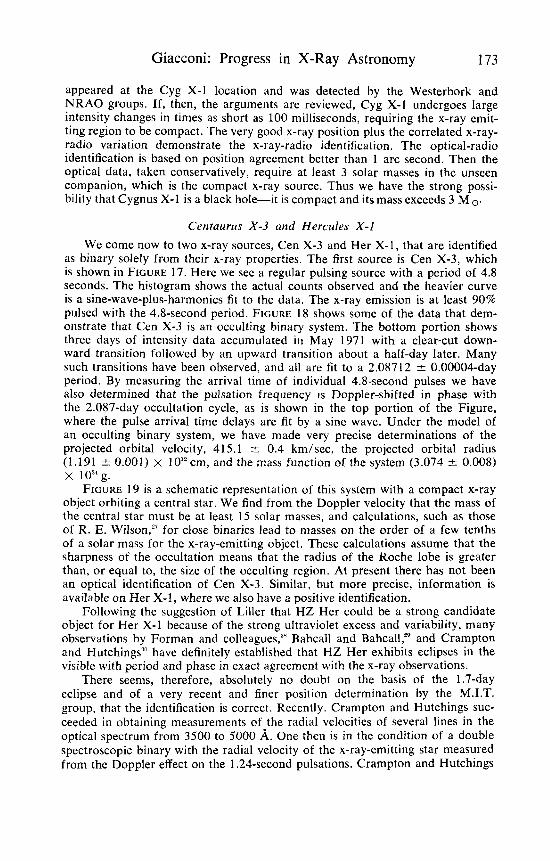
as binary solely from their x-ray properties. The first source is Cen X-3, which is shown in FIGURE 17. Here we see a regular pulsing source with a period of 4.8 seconds. The histogram shows the actual counts observed and the heavier curve is a sine-wave-plus-harmonics fit to the data. The x-ray emission is at least 90% pulsed with the 4.8-second period. FIGURE 18 shows some of the data that dem- onstrate that Cen X-3 is an occulting binary system. The bottom portion shows three days of intensity data accumulated in May 1971 with a clear-cut down- ward transition followed by an upward transition about a half-day later. Many such transitions have been observed, and all are fit to a 2.08712 & 0.00004-day period. By measuring the arrival time of individual 4.8-second pulses we have also determined that the pulsation frequency IS Doppler-shifted in phase with the 2.087-day occultation cycle, as is shown in the top portion of the Figure, where the pulse arrival time delays are fit by a sine wave. Under the model of an occulting binary system, we have made very precise determinations of the projected orbital velocity, 415.1 -t 0.4 km/sec, the projected orbital radius (1.191 k 0.001) x 10l2 cm, and the mass function of the system (3.074 2 0.008)
FIGURE 19 is a schematic representation of this system with a compact x-ray object orbiting a central star. We find from the Doppler velocity that the mass of the central star must be at least 15 solar masses, and calculations, such as those of R. E. Wilson," for close binaries lead to masses on the order of a few tenths of a solar mass for the x-ray-emitting object. These calculations assume that the sharpness of the occultation means that the radius of the Roche lobe is greater than, or equal to, the size of the occulting region. At present there has not been an optical identification of Cen X-3. Similar, but more precise, information is available on Her X-1, where we also have a positive identification.
Following the suggestion of Liller that HZ Her could be a strong candidate object for Her X-1 because of the strong ultraviolet excess and variability, many observations by Forman and colleagues,'" Bahcall and Bahcall," and Crampton and Hutchings'" have definitely established that HZ Her exhibits eclipses in the visible with period and phase in exact agreement with the x-ray observations.
There seems, therefore, absolutely no doubt on the basis of the 1.7-day eclipse and of a very recent and finer position determination by the M.I.T. group, that the identification is correct. Recently. Crampton and Hutchings SUC-
ceeded in obtaining measurements of the radial velocities of several lines in the optical spectrum from 3500 to 5000 A. One then is in the condition of a double spectroscopic binary with the radial velocity of the x-ray-emitting star measured from the Doppler effect on the 1.24-second pulsations. Crampton and Hutchings
x lo7* g.

174 Annals New York Academy of Sciences
I
I !
- WEAK OR f NOT SEEN - - - -
JAN.1 .1971 F E B . 1 M R . 1 A P R . l NAY. l JUNE. l JULY.1 AUG.1 .1971
FIGURE 17. X-ray variability of Cen X-3. The upper curve shows the 4.8-second pulsations as they appear in the raw data (each bin is 0.096 second). The fitted curve is the result of a Fourier analysis. The middle curve is the average intensity folded modulo the eclipse period of two days. The period and phase of the eclipse were ob- tained from the Doppler velocity variations of the pulsing. The lower curve is the time variability on a scale of months and shows extended periods (e.g. February- April) when the source is weak or absent when it was predicted to be seen.
deduce masses for the system of -2.5 Mo for the occulting object and -1.3 Mo for the x-ray-emitting object.
Forman and associates estimate distances of 2.5 to 4.5 kpc for the source, depending on the spectral type. This corresponds to an x-ray luminosity of about lo3” ergslsecond, although this could decrease tr, 10” ergdsecond by accounting for the limited solid angle the pulsed source fills. We have analyzed the x-ray pe- riod for December 1971, January 1972, March 1972, and April 1972, and can set an upper limit of 2 microseconds’ change (slowdown) in a period of four months. For a 1-solar-mass neutron star of 10-km radius, the rotational kinetic energy is 2.5 x ergs, and with our upper limit on the period slowing down we find that only 2.5 x lo3* ergs/sec could be converted into x-rays by a 100%

a Iok . '. 5 ,'- '.- j" ..f. I , 1 1 . 01 ' 1
, \ To- 4.8423998 f 0.MxXx)l $EL
A - O . D X 7 1 7 f 0.OMM5 IEC
I
FIGURE 18. Bottom: intensity observed from Cen X-3 (dots) and the light curve predictions for 5-7 May. Top: difference At between the time of occurrence of a pulse and the time predicted for a constant period, plotted as a function of time. A best-fit function and the values of the parameters are given. Center: dependence of the pulsa- tion period t on time as derived from the best-fit phase function. Note the coincidence of the null points of the period function with the centers of the high and low intensity states.
6 CENTER OF HIGH STATE
TRANSITION REGION (0.035 DAYS)
I ! A 1 1
ORBIT OF / ' 1 ;\ THROUGH ROCHE LOBE
y ; TO OBSERVER
FIGURE 19. Schematic representation of occulting binary x-ray system.
175

176 Annals New York Academy of Sciences
efficient mechanism if the source were slowing down at the determined upper limit rate. This, then, demonstrates that rotation cannot be the energy source, and one turns to accretion as the most likely alternative energy source, with ro- tation still presumably providing the clock mechanism.
CONCLUSION
Several significant results have come about from the UHURU mission and have greatly expanded the scope of galactic and extragalactic x-ray astronomy. In extragalactic research we may have the beginning of an explanation for the diffused x-ray background. We may have detected the presence of high-tempera- ture, intercluster gases. The relationship of the mass and temperature of this gas to other cluster parameters, as determined by visible light observations of the galaxies in the cluster, may furnish us a tool with which to study cluster dy- namics and to investigate evolutionary effects of cluster matter at redshifts of cosmological significance.
In galactic x-ray astronomy, the discovery of x-ray sources in binary sys- tems gives us some understanding of the mechanisms (accretion) leading to the production of copious x-ray fluxes in stellar objects. Since the systems contain massive luminous stars, optical identifications are relatively straightforward, and, thus, we can determine distances and absolute luminosities. When such identi- fications occur, we also may have available radial velocity for the x-ray sources directly from the x-ray data and for the massive companion from the radial velocity spectroscopic binary, with additional information as to length of the oc- cultation. We can, therefore, determine the masses of both objects, and we can thus distinguish between different possible compact objects, such as white dwarfs, neutron stars, and black holes. We are indeed very fortunate that exotic objects of such great astrophysical significance may be located in binary systems, where we can conveniently study them.
With the advent of the large orbiting observatories planned in the High En- ergy Astronomy Observatory program of NASA, we will extend the sensitivity of the measurements by another 3 orders of magnitude. If our understanding of the properties of extragalactic sources is correct, we might be in a position to study approximately 1 O6 external galaxies. At that point, x-ray astronomy will, I believe, take its place beside the more traditional branches of astronomy with scientific results of comparable significance.
REFERENCES
1. SALPETER, E. E. 1972. In X- and Gamma-Ray Astronomy. H. Bradt & R. Giacconi, Eds. IAU Symposium No. 55:35. D. Reidel Pub. Co. Dordrecht, The Netherlands.
2. GURSKY, H. In Black Holes, C. DeWitt & B. S. DeWitt, Eds. Gordon & Breach. New York, N. Y .
3. SEWARD, F. D., G. A. BURGINYON, R. J. GRADER, R. W. HILL, & T. M. PALMIER]. 1972. Ap. J. TR Press.
4. BLAAUW, A. In Galactic Structure. A. Blaauw & M. S. Schmidt, Eds.: 435. University of Chicago Press. Chicago, 111.
5. GORENSTEIN, P., B. HARRIS, & H. GURSKY. 6. GARMIRE, G. 1972. Personal communication. 7. SOLINGER, A. & W. TUCKER. 8. SETTI, G. & L. WOLTJER.
R. Giacconi, Eds. D. Reidel Pub. Co. Dordrecht, The Netherlands. 9. GIACCONI, R., S. MURRAY, H. TANANBAUM, E. KELLOGG & H. GURSKY.
Bull. AAS 3: 477.
1972.
1964.
1972. Ap. J . 172: L41-L45.
In X- and Gamma-Ray Astronomy. H. Bradt &
1971.
1972. Ap. J . 175: L107-L111. 1972.

Giacconi: Progress in X-Ray Astronomy 177
10. GURSKY, H.
11. RAPPAPORT, S., R. DOXSEY & W. ZAUMEN. 12. FRIEDMAN, H., E. T. BYRAM & T. A. CHUBB. 13. KESTENBAUM, H., J. R. P. ANGEL & R. NOVICK. 1971. 14. HILTNER, W. A. & D. E. MOOK. 15. NEUGEBAUER, G., J . OKE, E. BECKLIN & G. GARMIRE. 16. NOVICK, R., M. C. WEISSKOPF, R. BERTHELSDORT, R. LINK & R. S. WOLFF.
Astrophys. J. 178: L1. 17. HJELLMING, R. M. & C. M. WADE. 1971. Ap. J. (Lett) 164: L1. 18. KESTENBAUM, H., J. R. P. ANGEL & R. NOVICK. 19. GIACCONI, R., P. GORENSTEIN, H. GURSKY, P. D. USHER, J. R. WALTERS, A.
20. ULMER, M. P., W. A. BAITY, W. A. WHEATON & L. E. PETERSON. 1972. Astro-
21. SCHREIER, E., R. LEVINSON, H. GURSKY, E. KELLOGG, H. TANANBAUM & R. GIAC-
22. BOLTON, C. T. 1972. Nat. Phys. Sci. 240: 174. 23. BRAES, L. & G. K. MILEY. 1971. Nature 232: 246. 24. HJELLMING, R. M. & C. M. WADE. 1971. 25. WEBSTER, L & P. MURDIN. 1972. Nature 235: 37. 26. BOLTON, C. T. 1972. Nature 235: 271. 27. WILSON, R. E. 1972. Ap. J. (Lett.) 174: L27. 28. FORMAN, W., C. JONES & W. LILLER. Optical Studies of UHURU Sources
I11 of the Optical Variations of the X-ray Eclipsing System HZ Hercules. Astrophys. J. 177: L103.
29. BAHCALL, J. & N. BAHCALL. The Period and Light Curve of HZ Hercules, Astrophys. J. 178: L.I.
30. CRAMPTON, D. & J. B. HUTCHINGS. 1972. Spectroscopic Observations of H Z Hercules and the Model for Hercules X-1. Astrophys. J. 178: L65.
31. BOK, B. J.
1972. In Black Holes. C. DeWitt & B. S. DeWitt, Eds. Gordon & Breach. New York, N. Y .
1971. Ap. J. (Lett) 168: L43. 1967. Science 156 374.
Ap. J. (Lett) 164: L 87. Ann. Rev. Astron. Astrophys. 8: 139.
1969. Ap. J. 155: 1. 1970.
1972.
1971. Ap. J. (Lett) 164: L87.
SANDAGE, P. OSMER & J. V. PEACH.
phys. J. 178: L121.
CONI. 1972. Ap. J. (Lett) 172: L79.
1967. Ap. J. (Lett) 148: L119.
Ap. J. (Lett) 168: L21.
1972.
1972.
1966. Ann. Rev. Astr. Ap. 4: 95.
DISCUSSION OF THE PAPER DR. FELTEN (University of Arizona, Tucson, Ariz.): I think you said there is
an optical binary identified with the Small Magellanic Cloud. Does one know the mass of the visible component in that binary, and if so, how does that mass compare with the mass based on the observed x-ray luminosity?
DR. GIACCONI: The only pieces of information we have on this object are the fact that we observe an x-ray light curve and the fact that there is an announce- ment that an object which shows a light curve in the visible with the x-ray pe- riod has been found. Webster, I believe, has studied the spectral type of this ob- ject and he concludes that it is an 0 1 star, and, therefore the visible light object is not very massive.
I think there is absolutely no information, or a t least I don’t know of any way to get it, about the mass of the unseen x-ray object.
DR. FELTEN: The point that I was trying to get out is that one requires sev- eral solar masses in order to get three38 ergs, despite the outward radiation pres- sure, and I understand you are telling me now that we have so far no notion from the optical binary of what the mass of the invisible component is.
DR. GIACCONI: Yes, that is right, and I think one ought also to be careful about applying the limits just like that, because there might be dispersion that permits you to violate a particular case.