Embed Size (px)
Citation preview
Progress in Measurements and Modeling of Fast-ion Dα Light
W.W. Heidbrink1, A. Bortolon1, B.A. Grierson2, D. Liu1, G.R. McKee3, C.M. Muscatello4,
M. Podestà2, and E. Ruskov1
1University of California, Irvine, California, USA2Princeton Plasma Physics Laboratory, Princeton, New Jersey, USA
3University of Wisconsin, Madison, Wisconsin, USA4University of California, Davis, California, USA
1498
1859 1860 1861TIME (ms)
-200
0
200
400
600
-200
0
200
400
600
BES (a.u.)
MIRNOV (T/s)
(a) w/o Beam
(a) w/ Beam
#141076
#141069
14971496
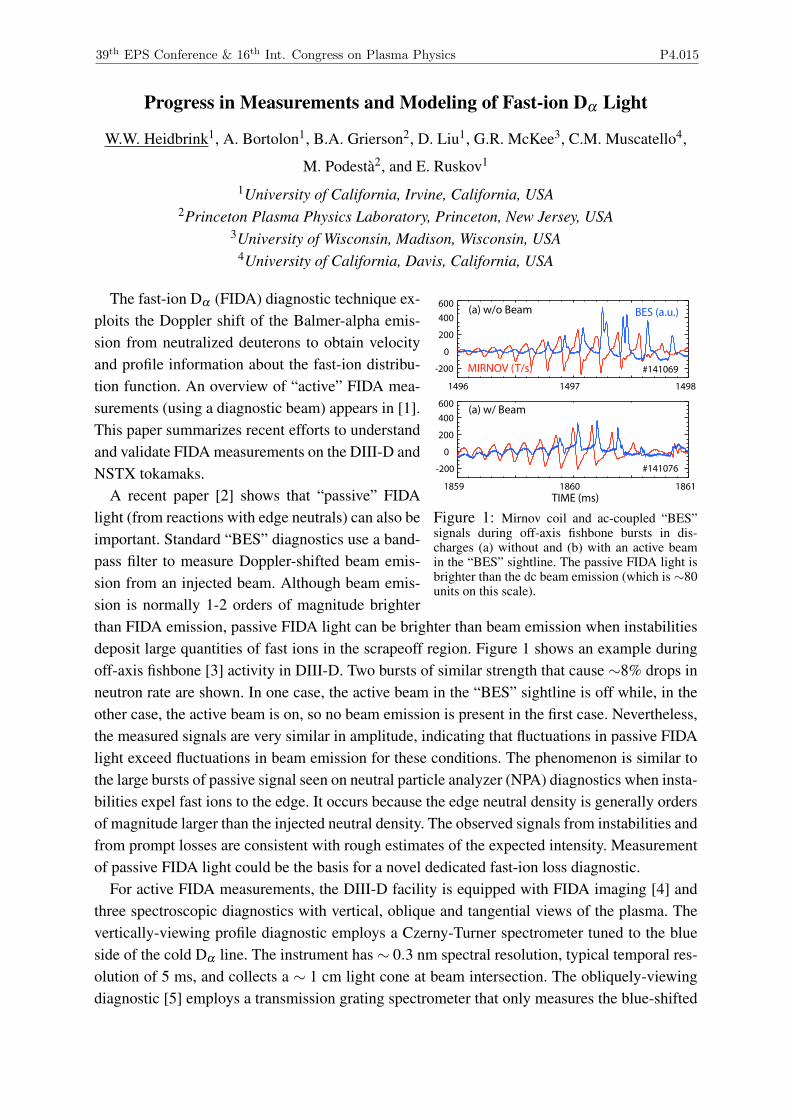
Figure 1: Mirnov coil and ac-coupled “BES”signals during off-axis fishbone bursts in dis-charges (a) without and (b) with an active beamin the “BES” sightline. The passive FIDA light isbrighter than the dc beam emission (which is ∼80units on this scale).
The fast-ion Dα (FIDA) diagnostic technique ex-ploits the Doppler shift of the Balmer-alpha emis-sion from neutralized deuterons to obtain velocityand profile information about the fast-ion distribu-tion function. An overview of “active” FIDA mea-surements (using a diagnostic beam) appears in [1].This paper summarizes recent efforts to understandand validate FIDA measurements on the DIII-D andNSTX tokamaks.
A recent paper [2] shows that “passive” FIDAlight (from reactions with edge neutrals) can also beimportant. Standard “BES” diagnostics use a band-pass filter to measure Doppler-shifted beam emis-sion from an injected beam. Although beam emis-sion is normally 1-2 orders of magnitude brighterthan FIDA emission, passive FIDA light can be brighter than beam emission when instabilitiesdeposit large quantities of fast ions in the scrapeoff region. Figure 1 shows an example duringoff-axis fishbone [3] activity in DIII-D. Two bursts of similar strength that cause ∼8% drops inneutron rate are shown. In one case, the active beam in the “BES” sightline is off while, in theother case, the active beam is on, so no beam emission is present in the first case. Nevertheless,the measured signals are very similar in amplitude, indicating that fluctuations in passive FIDAlight exceed fluctuations in beam emission for these conditions. The phenomenon is similar tothe large bursts of passive signal seen on neutral particle analyzer (NPA) diagnostics when insta-bilities expel fast ions to the edge. It occurs because the edge neutral density is generally ordersof magnitude larger than the injected neutral density. The observed signals from instabilities andfrom prompt losses are consistent with rough estimates of the expected intensity. Measurementof passive FIDA light could be the basis for a novel dedicated fast-ion loss diagnostic.
For active FIDA measurements, the DIII-D facility is equipped with FIDA imaging [4] andthree spectroscopic diagnostics with vertical, oblique and tangential views of the plasma. Thevertically-viewing profile diagnostic employs a Czerny-Turner spectrometer tuned to the blueside of the cold Dα line. The instrument has ∼ 0.3 nm spectral resolution, typical temporal res-olution of 5 ms, and collects a ∼ 1 cm light cone at beam intersection. The obliquely-viewingdiagnostic [5] employs a transmission grating spectrometer that only measures the blue-shifted
39th EPS Conference & 16th Int. Congress on Plasma Physics P4.015
side of the spectrum. A bandpass filter transmits the blue wing but strongly attenuates the coldDα line. The instrument has spectral resolution of ∼ 0.5 nm, temporal resolution of 1 ms, andcollects a ∼ 5 cm light cone at beam intersection. The main-ion charge exchange recombina-tion (CER) diagnostic [6] measures the entire Dα feature with a pair of tangential views. Itemploys a Czerny-Turner spectrometer and a 12-bit CCD camera. For FIDA measurements,the pixels at the cold Dα line are allowed to saturate weakly. Typical temporal resolution is5 ms and the analysis procedure fits the entire spectrum [6]. Although the oblique instrumentincludes reference views, all three diagnostics normally use beam modulation to remove thebackground. Recent work confirms the value of multiple views. Comparison of data from thedifferent instruments shows that the sawtooth instability causes greater transport of passing fastions than of trapped ones [7]. In a comparison of different angles of beam injection, the moretangential sources produce larger signals on the tangential and oblique diagnostics, while themore perpendicular sources produce larger signals on the vertical diagnostic [8].
The FIDASIM code models active FIDA and NPA signals, as well as beam, direct charge-exchange, halo, and visible bremsstrahlung (VB) emission. The physics assumptions of the codeare described in Ref. [9]. Recently, three “bugs” were identified that effect results published intwo publications [6, 8]. The most important of these resulted in an overestimate of the lifetime ofhalo neutrals, which increased the predicted halo and FIDA emission. Another “bug” involvingincorrect cross sections produced a ∼10% overestimate of FIDA light. A third “bug” causeddistortions in the predicted spatial profile. These errors as well as an adjustment of the DIII-Dinjection geometry are corrected in the version employed in this paper (FIDASIM 4.0).
649 650 651 652 653
0
1
2
3
1013
Ph
oto
ns/
(cm
2 -s-
nm
)
Wavelength (nm)
649 650 651 652 653 6540
VB
Beam On
Beam Off
DIII-D #14608810
8
6
4
2Net FIDASIM
(a) Oblique
(b) Vertical
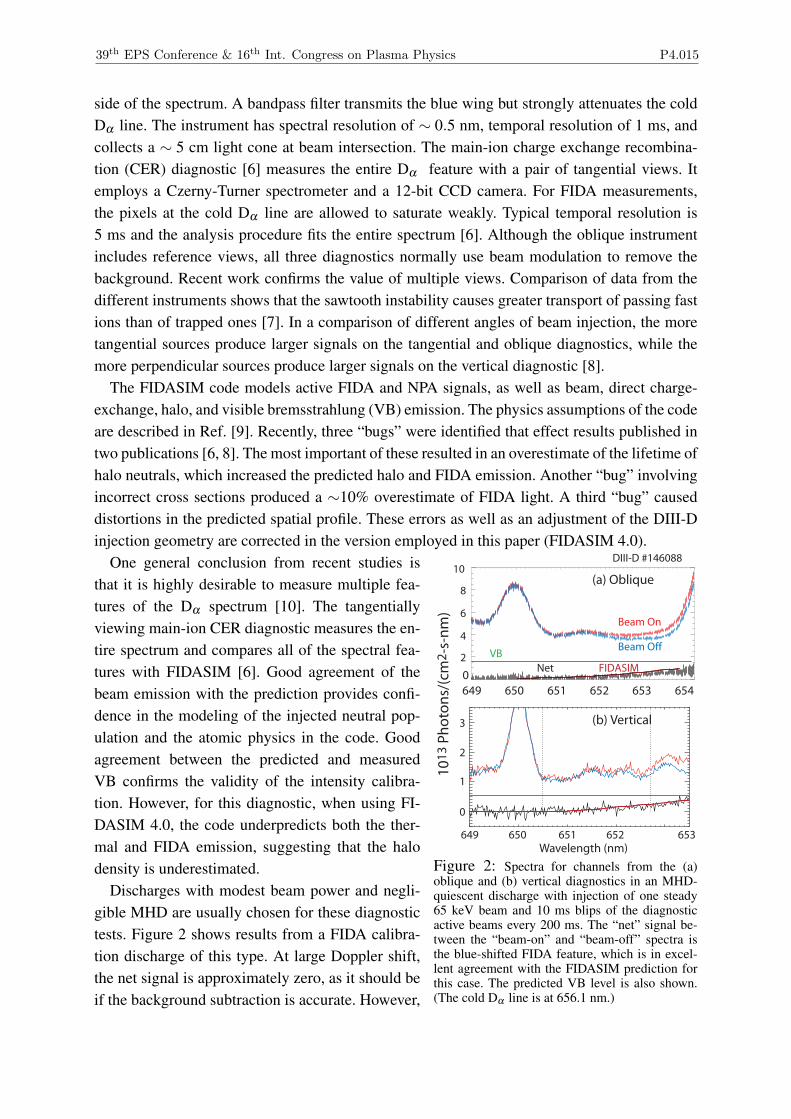
Figure 2: Spectra for channels from the (a)oblique and (b) vertical diagnostics in an MHD-quiescent discharge with injection of one steady65 keV beam and 10 ms blips of the diagnosticactive beams every 200 ms. The “net” signal be-tween the “beam-on” and “beam-off” spectra isthe blue-shifted FIDA feature, which is in excel-lent agreement with the FIDASIM prediction forthis case. The predicted VB level is also shown.(The cold Dα line is at 656.1 nm.)
One general conclusion from recent studies isthat it is highly desirable to measure multiple fea-tures of the Dα spectrum [10]. The tangentiallyviewing main-ion CER diagnostic measures the en-tire spectrum and compares all of the spectral fea-tures with FIDASIM [6]. Good agreement of thebeam emission with the prediction provides confi-dence in the modeling of the injected neutral pop-ulation and the atomic physics in the code. Goodagreement between the predicted and measuredVB confirms the validity of the intensity calibra-tion. However, for this diagnostic, when using FI-DASIM 4.0, the code underpredicts both the ther-mal and FIDA emission, suggesting that the halodensity is underestimated.
Discharges with modest beam power and negli-gible MHD are usually chosen for these diagnostictests. Figure 2 shows results from a FIDA calibra-tion discharge of this type. At large Doppler shift,the net signal is approximately zero, as it should beif the background subtraction is accurate. However,
39th EPS Conference & 16th Int. Congress on Plasma Physics P4.015

the observed baseline at large Doppler shift is twice as large as the predicted VB. This discrep-ancy is attributed to scattered light. Both the spectral shape and the magnitude of the FIDAfeature are in excellent agreement with the prediction.
180 190 200 210
MAJOR RADIUS (cm)
0
2
4
6
1012
Ph
oto
ns/
(cm
2 -s-
nm
) DIII-D #144307
On-axis
Off-axis
Data
FIDASIM
Figure 3: Vertical FIDA profiles during (blue)on-axis injection of a single near-perpendicularsource and during (red) off-axis injection of a sin-gle near-tangential source. The data (*) agree wellwith theory (�). Spectral integration from 650.5-652.7 nm.
A new capability at DIII-D is vertical steeringof one of the beamlines so that two sources injectoff-axis. In a number of discharges designed to testthis new capability, each of the available sourcesinjected for ∼100 ms, followed by a 10 ms blipof the FIDA active beams [8]. Figure 3 shows oneof these comparisons. The FIDA data show thatthe central fast-ion density is much lower with off-axis injection than with on-axis injection. All avail-able diagnostics confirm this result. Quantitatively,it was found that the vertically-tilted sources pro-duce∼20% fewer fast ions than expected, probablydue to an error in the reported beam power. Thisstudy also provided a good test of the active NPAsignals produced by trapped fast ions near the magnetic axis. Comparison with FIDASIM pre-dictions shows good agreement between theory and the NPA data.
Dedicated FIDA experiments have been conducted at NSTX with the vertically-viewing s-FIDA diagnostic [11]. This instrument uses a transmission grating spectrometer in conjunctionwith a CCD camera to measure Dα spectra between 645-667 nm. An OD2 neutral densityfilter in the spectrometer image plane partially blocks the cold Dα center line. The spectralresolution is ∼ 0.23 nm and the data are acquired in 10 ms time bins. To minimize MHDactivity, a single modulated (50 Hz at 50% duty cycle) 65 keV neutral beam is injected intoplasmas with different values of plasma current Ip, density ne, and toroidal field BT . For verticalviews in a conventional tokamak, the blue- and red-shifted sides of the spectrum should benearly identical but, in a spherical tokamak, owing to the large field-line pitch and fast-iongyroradius, large asymmetries are expected. Of the beam-driven instabilities that are commonlyobserved in NSTX, low-frequency instabilities such as the toroidal Alfvén eigenmode (AE)were absent but, despite the low beam power, MHz global or compressional AEs were presentin these discharges. The measured neutron rate agrees well with TRANSP predictions duringthe low-power phase, suggesting that any spatial transport caused by the MHz instabilities ismodest. Raw data from this experiment appear in Ref. [10]. Comparison between the measuredand calculated VB baselines shows that the measured value is about half of the predicted value,implying that the experimental calibration is erroneously low. There are also difficulties withthe background subtraction for some of the data. For some channels, offsets are observed atDoppler shifts above the injection energy; also, the net signal from beam modulation sometimesdisagrees with the net signal derived from the reference views. Operating at low beam powerto minimize MHD aggravates the difficulties in background subtraction. Analysis shows thatscattered light is responsible for the baseline offsets.
39th EPS Conference & 16th Int. Congress on Plasma Physics P4.015

80 90 100 110 120 130 140
0.0
0.2
0.4
0.6
0.8
MAJOR RADIUS (cm)
0
2
4
6
BRI
GH
TNES
SSP
ECTR
AL
SHA
PE
NSTX #132655
Blue-shiftRed-shift
FIDASIM
DATA
(a)
(b)
Figure 4: (a) Reduced χ2 for a comparison betweenthe measured FIDA spectrum and the spectral shapepredicted by FIDASIM vs major radius. Both sidesof the spectrum agree well with theory. (b) Measured(symbols) and predicted (dashed) spatial profiles forthe red- and blue-shifted sides of the spectrum. Thedata and theory are averaged over 140 ms and the the-ory is divided by a factor of 7.
Despite these experimental difficulties, theNSTX diagnostic unquestionably measures FIDAlight. The spectral shape is in excellent agree-ment with theory [Fig. 4(a)]. Apart from theextreme channels on the red-shifted side ofthe spectrum (where the difficulties with back-ground subtraction are largest), the spatial pro-files agree reasonably well with theory (Fig. 4).Figure 5 compares the scaling of the spatial pro-file with theory for all of the discharges in thededicated experiment. As predicted, the loca-tion of the peak of the red-shifted profile oc-curs at larger major radius than the peak of theblue-shifted profile [Fig. 5(a)]. Despite consid-erable scatter, the observed variations in positionalso correlate with theory (correlation coefficientr ' 0.5 for both sides of the spectrum). The cor-relation between the measured and predicted brightness is excellent (r > 0.9 for both sides ofthe spectrum). As expected, the blue-shifted side is brighter than the red-shifted side.
100 110 120 130100
110
120
130
0.0 0.5 1.0 1.5 2.0 2.50.00
0.05
0.10
0.15
0.20
0.25
THEORY MAJOR RADIUS (cm)
EXP.
MA
JOR
RA
DIU
S (c
m)
EXP.
BRI
GH
TNES
S
THEORY BRIGHTNESS
Red-shift
Blue-shift
(a)
(b)
Figure 5: (a) Measured position of the peak of the spa-tial profile vs FIDASIM prediction for the blue-shifted(*) and red-shifted (�) sides of the spectrum for the 13discharges in the dedicated NSTX experiment. The lineindicates agreement between theory and experiment. (b)Measured experimental brightness vs FIDASIM predic-tion. The brightness is the sum of the signals for the fivespatial channels closest to the peak.
The support of the DIII-D and NSTXteams is gratefully acknowledged. Thiswork was funded by the US Departmentof Energy under SC-G903402, DE-FC02-04ER54698, DE-FG03-02ER54681, and DE-FG02-06ER54867.
References
[1] W.W. Heidbrink, Rev. Sci. Instrum. 81 (2010)10D727.
[2] W.W. Heidbrink, et al., Plasma Phys. ControlledFusion 53 (2011) 085007.
[3] M. Okabayashi, et al., Phys. Plasma 18 (2011)056112.
[4] M.A. Van Zeeland, et al., Plasma Phys. Con-trolled Fusion 51 (2009) 055001.
[5] C.M. Muscatello et al., Rev. Sci. Instrum. 81(2010) 10D316.
[6] B.A. Grierson, et al., Phys. Plasma 19 (2012)056107.
[7] C.M. Muscatello, et al., Plasma Phys. Con-trolled Fusion 54 (2012) 025006.
[8] W.W. Heidbrink, et al., Nucl. Fusion 52 (2012)in press.
[9] W.W. Heidbrink, et al., Comm. Comp. Physics10 (2011) 716.
[10] W.W. Heidbrink, et al., Rev. Sci. Instrum. 83(2012) submitted.
[11] M. Podestà, et al., Rev. Sci. Instrum. 79 (2008)10E521.
39th EPS Conference & 16th Int. Congress on Plasma Physics P4.015