Embed Size (px)
Citation preview

Journal of Physics Conference Series
OPEN ACCESS
Progress in development of the KSTAR Thomsonscattering systemTo cite this article Jongha Lee and Seung Tae Oh 2010 J Phys Conf Ser 227 012042
View the article online for updates and enhancements
You may also likePose measurement approach based ontwo-stage binocular vision for dockinglarge componentsYuanze Chen Fuqiang Zhou MingxuanZhou et al
-
THE RAPID FORMATION OF AFILAMENT CAUSED BY MAGNETICRECONNECTION BETWEEN TWO SETSOF DARK THREADLIKE STRUCTURESBo Yang Yunchun Jiang Jiayan Yang etal
-
ACCURATE ATMOSPHERICPARAMETERS AT MODERATERESOLUTION USING SPECTRALINDICES PRELIMINARY APPLICATIONTO THE MARVELS SURVEYLuan Ghezzi Letiacutecia Dutra-Ferreira DiegoLorenzo-Oliveira et al
-
This content was downloaded from IP address 14817016589 on 22102021 at 2046
Progress in development of the KSTAR Thomson scattering system
Jongha Lee and Seung Tae Oh National Fusion Research Institute 113 Gwahangno Yuseong-gu Daejeon 305-333 Korea
E-mail jhleenfrirekr
Abstract The design of Thomson scattering system for the Korean Superconducting Tokamak Advanced Research (KSTAR) device is described The system includes a laser beam guiding system laser input port laser beam dump collection lens shutter and cassette system The laser guiding system has a collimating lens set for reducing the laser power loss The laser beam dump will be attached inside of the vacuum vessel and hence it has been designed compactly The preliminary design of collection lens shutter system and the cassette were done by PPPL and the engineering design is being executed by NFRI The collection lens system has two sets of lenses one set is designed for the core and the other set is designed for the edge Two sets of pneumatic shutter systems are designed for independent remote control Most of the KSTAR Thomson scattering system design is already finished and we are planning to install the whole system by March 2010 We will measure the plasma parameters (Te ne) in KSTAR during the third campaign
1 Introduction The Korea Superconducting Tokamak Advanced Research (KSTAR) tokamak [1] achieved the first plasma on the last day of June 2008 at the National Fusion Research Institute Daejeon Korea Thomson scattering has become an important diagnostic for measuring electron temperature and density profiles in most tokamaks [2][3][4] Therefore we plan to install the KSTAR Thomson scattering system before the KSTAR 3rd campaign in 2010 The goal of the Thomson scattering diagnostic on KSTAR is to provide reliable electron temperature Te and density ne profiles in both core and edge regions during long-pulse tokamak plasma discharges To meet this goal we are designing each part of the KSTAR Thomson scattering system such as laser beam guiding system laser inlet system and laser beam dump system inside the KSTAR vacuum vessel and collection optics systems with a cassette For the laser system we will use a commercial NdYAG laser (1064 nm 10 Hz ~15 J Coherent Co) for the 3rd campaign For the KSTAR 4th campaign in 2011 and the next 5 years a high-power high-performance (gt 3 J) high repetition rate (gt 50 Hz) NdYAG laser system will be used which is being developed by JAEA Japan [5] Next year in 2010 the design requirements for parameters to be measured are as follows time resolution 100 msec (10 Hz) spatial resolution 15 mm in the core and 25 mm at the edge temperature range 10 eV lt Te lt 15 keV in the core and edge density range 3 acute 1018 m-3lt ne lt 2 acute 1020 m-3 [6]
In this paper we describe the engineering design of the laser beam dump laser shutter systems etc and the 1st calibration data for the polychromators
14th International Symposium on Laser-Aided Plasma Diagnostics (LAPD14) IOP PublishingJournal of Physics Conference Series 227 (2010) 012042 doi1010881742-65962271012042
ccopy 2010 IOP Publishing Ltd 1
2 Thomson scattering apparatus on the KSTAR tokamak The KSTAR Thomson scattering system is configured with 90deg scattering optics including a single tangential beam as illustrated in Figure 1 The laser beam transported for a distance of about 40 m and focused by a 55 m focal length lens is directed into the vacuum vessel through the mid-plane port of Bay L (the Lm-port) The focal lens and steering mirror are mounted on an optical bench which is located in front of the Lm-Port Finally the laser beam reaches the beam dump that is located at the Bm-port wall in the vacuum pumping duct The collection optics with cassette system is located in the Nm-port and shares that space with the ECH launcher system (Figure 2) Most of the other parts of the Thomson system such as laser polychromators and AD system will be located in the diagnostics room which is well shielded from radiation
Tangential BeamNdYAG (1064 nm)
AB
C
O
M
N
L
D
E
F
P
G
H
IJ
K
Optic system amp Cassette
Beam dump system
Laser input system
Tangential BeamNdYAG (1064 nm)
AB
C
O
M
N
L
D
E
F
P
G
H
IJ
K
Optic system amp Cassette
Beam dump system
Laser input system
Figure 1 Top view of the KSTAR Thomson scattering system
Figure 2 Photograph of the KSTAR Thomson cassette port inside the vacuum vessel (The ECH launcher system is shown on the right side of the photo)
21 Lens design and cassette The preliminary design of the Thomson collection lenses was done by PPPL [6] but recently we have changed the design using lens design software PPPLrsquos design consisted of four lenses for the core and edge collection optics systems and each optics module had the same design However we have designed the core and edge parts of the lenses differently because each part of the KSTAR Thomson collection lenses has different viewing angles Finally we have obtained the optimum focusing spot size for core and edge lens systems using quartz glass In our design the spot size of the core part is around 20 micrometer and the edge part is 500 micrometer The cassette and shutter were also designed by PPPL We will finish this cassette system early in 2010 and will test the collection optics positioning and alignment
22 Laser input port and beam dump design The laser input port of the KSTAR Thomson system is located on the mid-plane Lm- port The Thomson laser input system shares the available space with the resistive bolometer system The laser input port contains five parts of the system an electro-pneumatic operation gate valve ceramic break bellows baffles and vacuum window
The laser beam dump design is very simple as shown at Figure 3 This wedge type beam dump is made with SUS316L outside and thick carbon sheet inside Of course this beam dump has a baffle and straight knife edges around the edge of a doughnut hole that are located at the front of this wedge dump system This simple beam dump will be attached at the end of Bm- port because of the limited number of KSTAR tokamak vacuum windows
14th International Symposium on Laser-Aided Plasma Diagnostics (LAPD14) IOP PublishingJournal of Physics Conference Series 227 (2010) 012042 doi1010881742-65962271012042
2
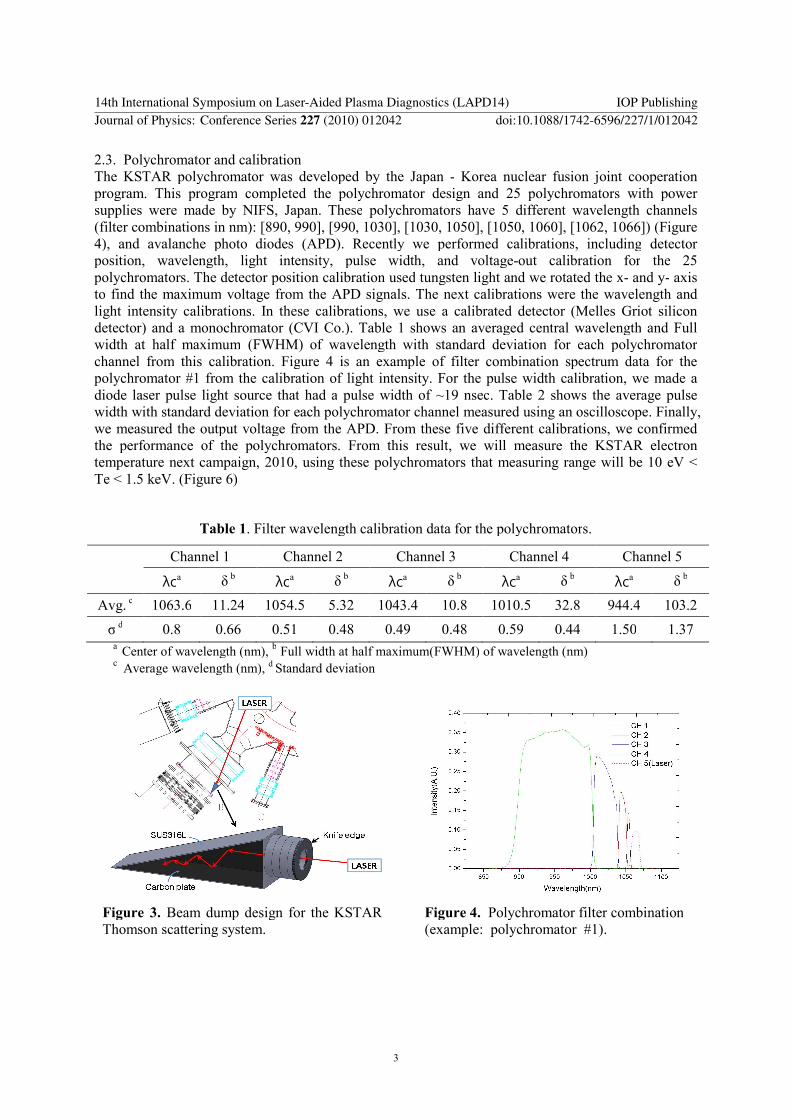
23 Polychromator and calibration The KSTAR polychromator was developed by the Japan - Korea nuclear fusion joint cooperation program This program completed the polychromator design and 25 polychromators with power supplies were made by NIFS Japan These polychromators have 5 different wavelength channels (filter combinations in nm) [890 990] [990 1030] [1030 1050] [1050 1060] [1062 1066]) (Figure 4) and avalanche photo diodes (APD) Recently we performed calibrations including detector position wavelength light intensity pulse width and voltage-out calibration for the 25 polychromators The detector position calibration used tungsten light and we rotated the x- and y- axis to find the maximum voltage from the APD signals The next calibrations were the wavelength and light intensity calibrations In these calibrations we use a calibrated detector (Melles Griot silicon detector) and a monochromator (CVI Co) Table 1 shows an averaged central wavelength and Full width at half maximum (FWHM) of wavelength with standard deviation for each polychromator channel from this calibration Figure 4 is an example of filter combination spectrum data for the polychromator 1 from the calibration of light intensity For the pulse width calibration we made a diode laser pulse light source that had a pulse width of ~19 nsec Table 2 shows the average pulse width with standard deviation for each polychromator channel measured using an oscilloscope Finally we measured the output voltage from the APD From these five different calibrations we confirmed the performance of the polychromators From this result we will measure the KSTAR electron temperature next campaign 2010 using these polychromators that measuring range will be 10 eV lt Te lt 15 keV (Figure 6)
Table 1 Filter wavelength calibration data for the polychromators
Channel 1 Channel 2 Channel 3 Channel 4 Channel 5
λca δ b λca δ b λca δ b λca δ b λca δ b
Avg c 10636 1124 10545 532 10434 108 10105 328 9444 1032
σ d 08 066 051 048 049 048 059 044 150 137 a Center of wavelength (nm) b Full width at half maximum(FWHM) of wavelength (nm) c Average wavelength (nm) d Standard deviation
Figure 3 Beam dump design for the KSTAR Thomson scattering system
Figure 4 Polychromator filter combination (example polychromator 1)
14th International Symposium on Laser-Aided Plasma Diagnostics (LAPD14) IOP PublishingJournal of Physics Conference Series 227 (2010) 012042 doi1010881742-65962271012042
3
Table 2 Laser pulsewidth(FWHM) calibration data for the polychromators
Channel 1 Channel 2 Channel 3 Channel 4 Channel 5
Avg a 1968 1974 1924 1916 1904
σ b 069 135 123 125 14 a Average pulsewidth at FWHM(nsec) b Standard deviation
Figure 5 Normalization data which is result of light intensity calibration for the polychromator 1
Figure 6 Calibration curve for the electron temperature measurement
3 Installation schedule for the KSTAR Thomson scattering system To measure electron density and electron temperature profiles on KSTAR using Thomson scattering diagnostics most of system design has been completed now and the system must be fabricated this year However the cassette system is actually quite complicated to design for the KSTAR Thomson diagnostics because of the long narrow port size and in addition sharing port space with the ECH launcher system For this reason the Thomson cassette will be finished next February The optical fiber and collection lens are designed and these are now undergoing a final check
The 1st calibration of KSTAR polychromator was successfully finished and moreover at the end of this year we will perform a 2nd calibration The 3rd calibration will be performed just before the KSTAR 3rd campaign These calibrations will give reliable results for the KSTAR plasma electron temperature and density
The KSTAR Thomson scattering diagnostic system should be installed next year to measure KSTAR 3rd plasma 10 spatial points for 2010 25 spatial points for 2011 and 40 spatial points for 2012
References [1] Lee GS et al 2000 Nucl Fusion 40 575 [2] Peacock N J et al 1969 Nature (London) 224 488 [3] Murmann H et al 1992 Rev Sci Instrum 63 4941 [4] Carlstrom T N et al 1992 Rev Sci Instrum 63 4901 [5] Hatae Takaki et al 2004 J Plasma Fusion Res 80 870 [6] Lee HG et al 2004 Rev Sci Instrum 75 3903
14th International Symposium on Laser-Aided Plasma Diagnostics (LAPD14) IOP PublishingJournal of Physics Conference Series 227 (2010) 012042 doi1010881742-65962271012042
4

Progress in development of the KSTAR Thomson scattering system
Jongha Lee and Seung Tae Oh National Fusion Research Institute 113 Gwahangno Yuseong-gu Daejeon 305-333 Korea
E-mail jhleenfrirekr
Abstract The design of Thomson scattering system for the Korean Superconducting Tokamak Advanced Research (KSTAR) device is described The system includes a laser beam guiding system laser input port laser beam dump collection lens shutter and cassette system The laser guiding system has a collimating lens set for reducing the laser power loss The laser beam dump will be attached inside of the vacuum vessel and hence it has been designed compactly The preliminary design of collection lens shutter system and the cassette were done by PPPL and the engineering design is being executed by NFRI The collection lens system has two sets of lenses one set is designed for the core and the other set is designed for the edge Two sets of pneumatic shutter systems are designed for independent remote control Most of the KSTAR Thomson scattering system design is already finished and we are planning to install the whole system by March 2010 We will measure the plasma parameters (Te ne) in KSTAR during the third campaign
1 Introduction The Korea Superconducting Tokamak Advanced Research (KSTAR) tokamak [1] achieved the first plasma on the last day of June 2008 at the National Fusion Research Institute Daejeon Korea Thomson scattering has become an important diagnostic for measuring electron temperature and density profiles in most tokamaks [2][3][4] Therefore we plan to install the KSTAR Thomson scattering system before the KSTAR 3rd campaign in 2010 The goal of the Thomson scattering diagnostic on KSTAR is to provide reliable electron temperature Te and density ne profiles in both core and edge regions during long-pulse tokamak plasma discharges To meet this goal we are designing each part of the KSTAR Thomson scattering system such as laser beam guiding system laser inlet system and laser beam dump system inside the KSTAR vacuum vessel and collection optics systems with a cassette For the laser system we will use a commercial NdYAG laser (1064 nm 10 Hz ~15 J Coherent Co) for the 3rd campaign For the KSTAR 4th campaign in 2011 and the next 5 years a high-power high-performance (gt 3 J) high repetition rate (gt 50 Hz) NdYAG laser system will be used which is being developed by JAEA Japan [5] Next year in 2010 the design requirements for parameters to be measured are as follows time resolution 100 msec (10 Hz) spatial resolution 15 mm in the core and 25 mm at the edge temperature range 10 eV lt Te lt 15 keV in the core and edge density range 3 acute 1018 m-3lt ne lt 2 acute 1020 m-3 [6]
In this paper we describe the engineering design of the laser beam dump laser shutter systems etc and the 1st calibration data for the polychromators
14th International Symposium on Laser-Aided Plasma Diagnostics (LAPD14) IOP PublishingJournal of Physics Conference Series 227 (2010) 012042 doi1010881742-65962271012042
ccopy 2010 IOP Publishing Ltd 1
2 Thomson scattering apparatus on the KSTAR tokamak The KSTAR Thomson scattering system is configured with 90deg scattering optics including a single tangential beam as illustrated in Figure 1 The laser beam transported for a distance of about 40 m and focused by a 55 m focal length lens is directed into the vacuum vessel through the mid-plane port of Bay L (the Lm-port) The focal lens and steering mirror are mounted on an optical bench which is located in front of the Lm-Port Finally the laser beam reaches the beam dump that is located at the Bm-port wall in the vacuum pumping duct The collection optics with cassette system is located in the Nm-port and shares that space with the ECH launcher system (Figure 2) Most of the other parts of the Thomson system such as laser polychromators and AD system will be located in the diagnostics room which is well shielded from radiation
Tangential BeamNdYAG (1064 nm)
AB
C
O
M
N
L
D
E
F
P
G
H
IJ
K
Optic system amp Cassette
Beam dump system
Laser input system
Tangential BeamNdYAG (1064 nm)
AB
C
O
M
N
L
D
E
F
P
G
H
IJ
K
Optic system amp Cassette
Beam dump system
Laser input system
Figure 1 Top view of the KSTAR Thomson scattering system
Figure 2 Photograph of the KSTAR Thomson cassette port inside the vacuum vessel (The ECH launcher system is shown on the right side of the photo)
21 Lens design and cassette The preliminary design of the Thomson collection lenses was done by PPPL [6] but recently we have changed the design using lens design software PPPLrsquos design consisted of four lenses for the core and edge collection optics systems and each optics module had the same design However we have designed the core and edge parts of the lenses differently because each part of the KSTAR Thomson collection lenses has different viewing angles Finally we have obtained the optimum focusing spot size for core and edge lens systems using quartz glass In our design the spot size of the core part is around 20 micrometer and the edge part is 500 micrometer The cassette and shutter were also designed by PPPL We will finish this cassette system early in 2010 and will test the collection optics positioning and alignment
22 Laser input port and beam dump design The laser input port of the KSTAR Thomson system is located on the mid-plane Lm- port The Thomson laser input system shares the available space with the resistive bolometer system The laser input port contains five parts of the system an electro-pneumatic operation gate valve ceramic break bellows baffles and vacuum window
The laser beam dump design is very simple as shown at Figure 3 This wedge type beam dump is made with SUS316L outside and thick carbon sheet inside Of course this beam dump has a baffle and straight knife edges around the edge of a doughnut hole that are located at the front of this wedge dump system This simple beam dump will be attached at the end of Bm- port because of the limited number of KSTAR tokamak vacuum windows
14th International Symposium on Laser-Aided Plasma Diagnostics (LAPD14) IOP PublishingJournal of Physics Conference Series 227 (2010) 012042 doi1010881742-65962271012042
2
23 Polychromator and calibration The KSTAR polychromator was developed by the Japan - Korea nuclear fusion joint cooperation program This program completed the polychromator design and 25 polychromators with power supplies were made by NIFS Japan These polychromators have 5 different wavelength channels (filter combinations in nm) [890 990] [990 1030] [1030 1050] [1050 1060] [1062 1066]) (Figure 4) and avalanche photo diodes (APD) Recently we performed calibrations including detector position wavelength light intensity pulse width and voltage-out calibration for the 25 polychromators The detector position calibration used tungsten light and we rotated the x- and y- axis to find the maximum voltage from the APD signals The next calibrations were the wavelength and light intensity calibrations In these calibrations we use a calibrated detector (Melles Griot silicon detector) and a monochromator (CVI Co) Table 1 shows an averaged central wavelength and Full width at half maximum (FWHM) of wavelength with standard deviation for each polychromator channel from this calibration Figure 4 is an example of filter combination spectrum data for the polychromator 1 from the calibration of light intensity For the pulse width calibration we made a diode laser pulse light source that had a pulse width of ~19 nsec Table 2 shows the average pulse width with standard deviation for each polychromator channel measured using an oscilloscope Finally we measured the output voltage from the APD From these five different calibrations we confirmed the performance of the polychromators From this result we will measure the KSTAR electron temperature next campaign 2010 using these polychromators that measuring range will be 10 eV lt Te lt 15 keV (Figure 6)
Table 1 Filter wavelength calibration data for the polychromators
Channel 1 Channel 2 Channel 3 Channel 4 Channel 5
λca δ b λca δ b λca δ b λca δ b λca δ b
Avg c 10636 1124 10545 532 10434 108 10105 328 9444 1032
σ d 08 066 051 048 049 048 059 044 150 137 a Center of wavelength (nm) b Full width at half maximum(FWHM) of wavelength (nm) c Average wavelength (nm) d Standard deviation
Figure 3 Beam dump design for the KSTAR Thomson scattering system
Figure 4 Polychromator filter combination (example polychromator 1)
14th International Symposium on Laser-Aided Plasma Diagnostics (LAPD14) IOP PublishingJournal of Physics Conference Series 227 (2010) 012042 doi1010881742-65962271012042
3
Table 2 Laser pulsewidth(FWHM) calibration data for the polychromators
Channel 1 Channel 2 Channel 3 Channel 4 Channel 5
Avg a 1968 1974 1924 1916 1904
σ b 069 135 123 125 14 a Average pulsewidth at FWHM(nsec) b Standard deviation
Figure 5 Normalization data which is result of light intensity calibration for the polychromator 1
Figure 6 Calibration curve for the electron temperature measurement
3 Installation schedule for the KSTAR Thomson scattering system To measure electron density and electron temperature profiles on KSTAR using Thomson scattering diagnostics most of system design has been completed now and the system must be fabricated this year However the cassette system is actually quite complicated to design for the KSTAR Thomson diagnostics because of the long narrow port size and in addition sharing port space with the ECH launcher system For this reason the Thomson cassette will be finished next February The optical fiber and collection lens are designed and these are now undergoing a final check
The 1st calibration of KSTAR polychromator was successfully finished and moreover at the end of this year we will perform a 2nd calibration The 3rd calibration will be performed just before the KSTAR 3rd campaign These calibrations will give reliable results for the KSTAR plasma electron temperature and density
The KSTAR Thomson scattering diagnostic system should be installed next year to measure KSTAR 3rd plasma 10 spatial points for 2010 25 spatial points for 2011 and 40 spatial points for 2012
References [1] Lee GS et al 2000 Nucl Fusion 40 575 [2] Peacock N J et al 1969 Nature (London) 224 488 [3] Murmann H et al 1992 Rev Sci Instrum 63 4941 [4] Carlstrom T N et al 1992 Rev Sci Instrum 63 4901 [5] Hatae Takaki et al 2004 J Plasma Fusion Res 80 870 [6] Lee HG et al 2004 Rev Sci Instrum 75 3903
14th International Symposium on Laser-Aided Plasma Diagnostics (LAPD14) IOP PublishingJournal of Physics Conference Series 227 (2010) 012042 doi1010881742-65962271012042
4
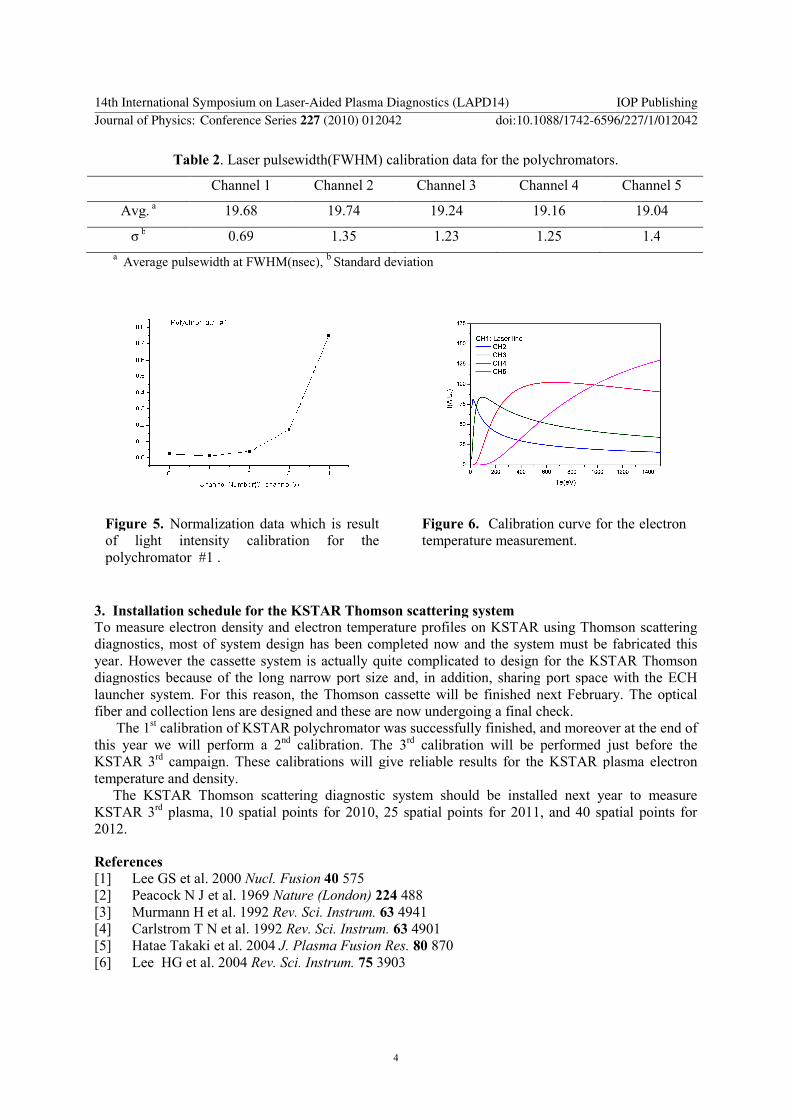