Embed Size (px)
Citation preview
PROGRAM IMPLEMENTATIONAND DELIVERY
Board Workshop #1July 23, 2019
PURPOSE OF WORKSHOPS
• Obtain Board input on program next steps
• Prepare for future Board actions following a full discussion of options
• Identify key issues and concerns before moving forward to next steps
2
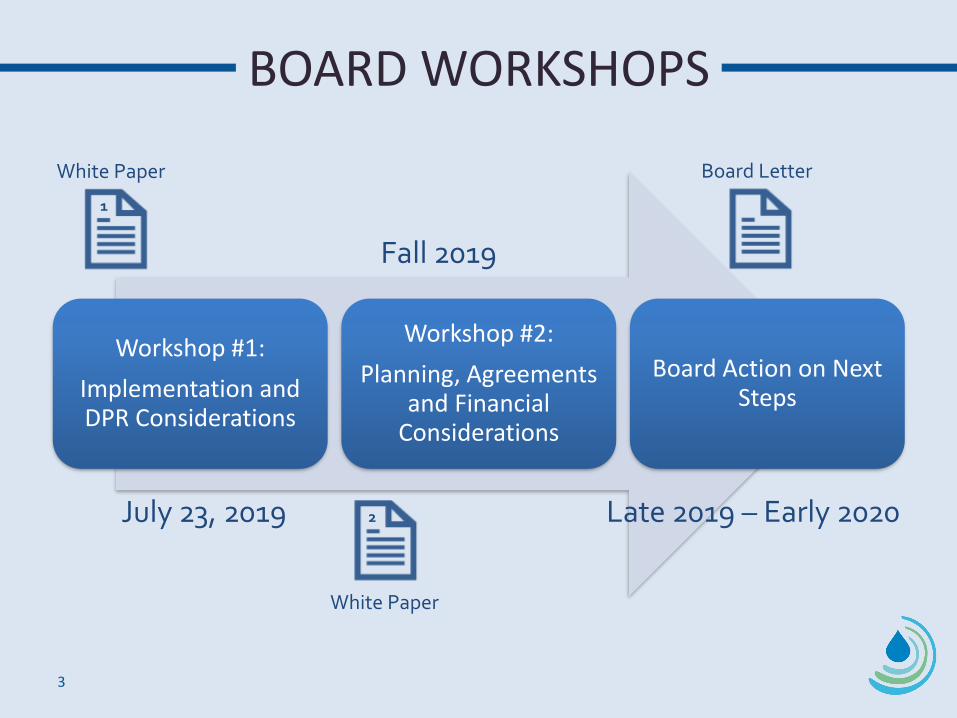
BOARD WORKSHOPS
3
Workshop #1:
Implementation and DPR Considerations
Workshop #2:
Planning, Agreements and Financial
Considerations
Board Action on Next Steps
Late 2019 – Early 2020
Board Letter
July 23, 2019
White Paper
1
Fall 2019
White Paper
2

TWO KEY QUESTIONS TODAY
4
How would Metropolitan proceed in developing raw water augmentation opportunities, considering DPR regulations are not currently in place?
DPR Development?
2
What additional activities (if any) should Metropolitan undertake during the environmental review process in order to accelerate program implementation?
Implementation Urgency?
1

OUTLINE
• Program Overview
• Treatment Plant Site Conditions
• Environmental Review Process
• Implementation Options
• Direct Potable Reuse (DPR) Considerations
• Wrap-up and Next Steps
5
PROGRAM OVERVIEW

PROGRAM BACKGROUND
• Pilot Scale Studies (2010-12)
• Progress Report (Sept. 2015)
• Board approval and appropriation for Demonstration Plant (Nov. 2015)
• Feasibility Study Report (Nov. 2016)
• Demonstration Plant– Completion of Final Design (Feb. 2017)
– Construction Completion & Start-up (Sept. 2019)
• Conceptual Planning Studies Report (Feb. 2019)
7

PROGRAM APPROACH
• Primary objective indirect potable reuse for groundwater recharge
• Two-phase approach (100 mgd followed by 50 mgd or more)
• Built around backbone conveyance system
• Preserving flexibility for the future– DPR utilizing raw water augmentation
– Additional effluent from JWPCP
– Integration with City of Los Angeles and other purified water systems
8
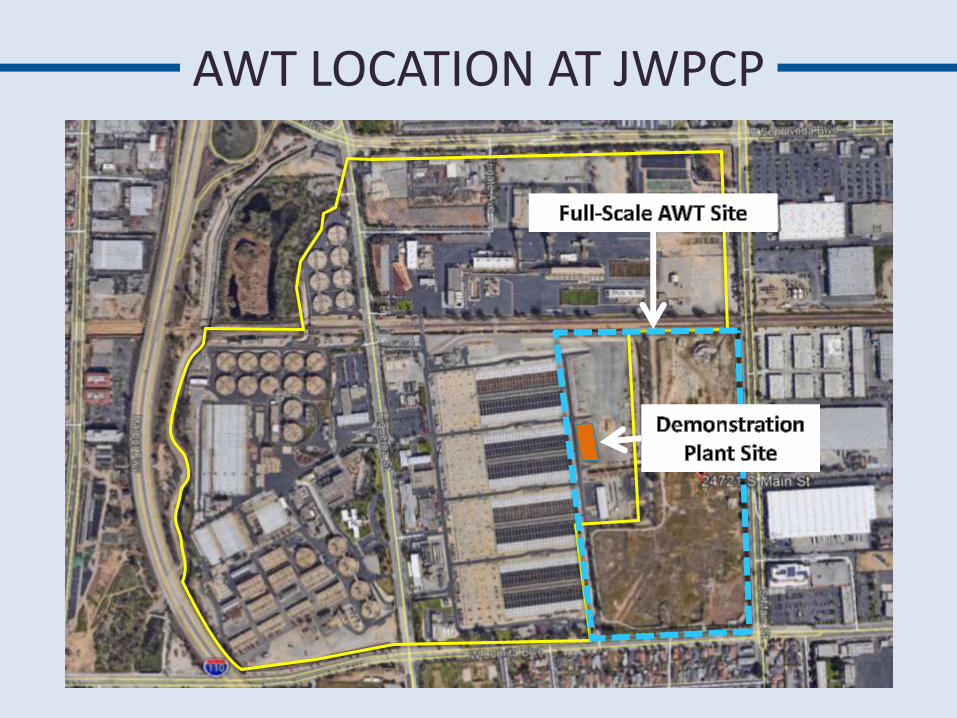
AWT LOCATION AT JWPCP
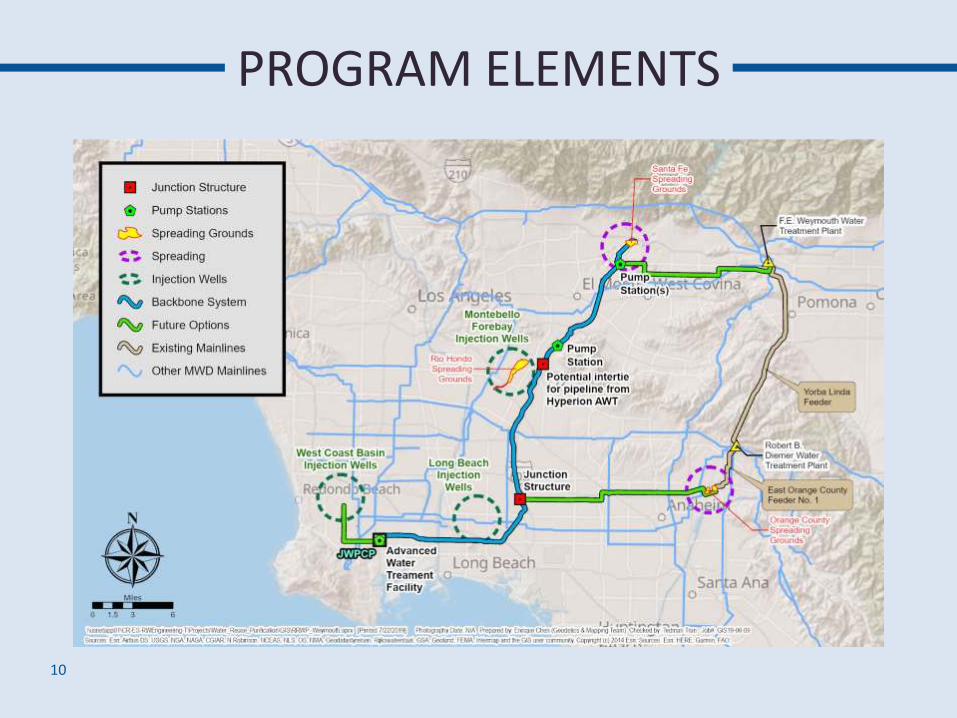
PROGRAM ELEMENTS
10
LETTER OF INTENTWITH CITY OF LOS ANGELES
• In place July 2019• Intent
– Provides a basis for collaboration between the City’s Hyperion Program and Metropolitan’s Regional Program
– Supports development of a formal Memorandum of Understanding between the parties
• Benefits– Improves potential for integration between two
systems– Allows for coordination in planning and regulatory
process– Reduces potential conflicts/duplication of activities
11

REVIEW OF TREATMENT PLANTSITE CONDITIONS
Ray Tremblay
Department Head – Facilities Planning
Sanitation Districts of Los Angeles County
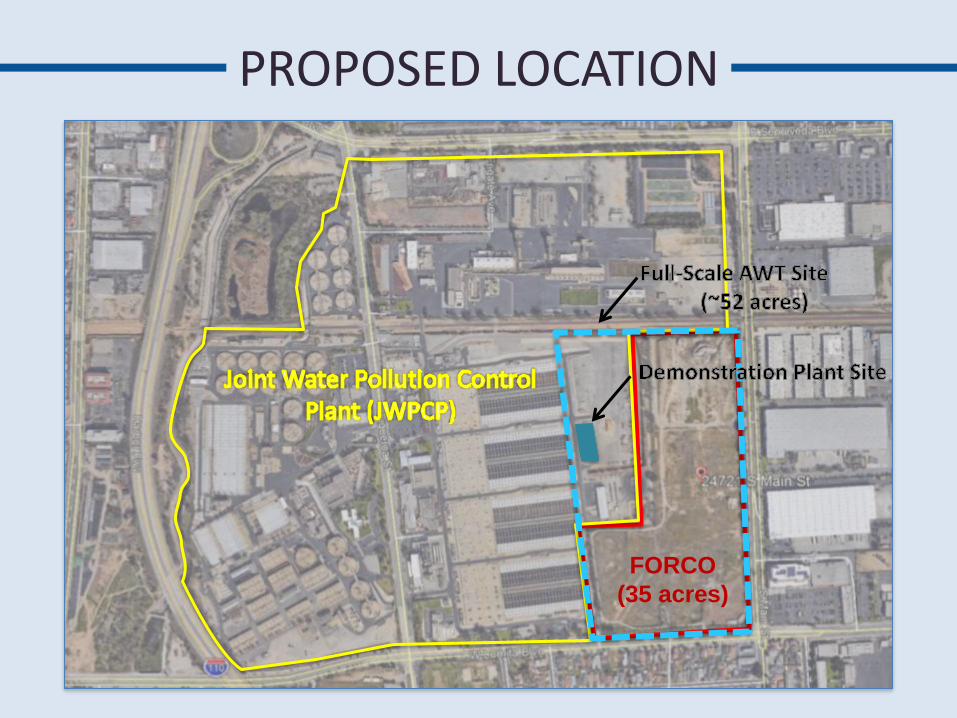
PROPOSED LOCATION
FORCO
(35 acres)

PROJECT SITE COMMITMENTS
• Suitable site within the Joint Water Pollution Control Plant boundaries
– Up to 35 Acres
• Parties to meet and confer to develop an approach to cost-effective mitigation
• Sanitation District responsible for all remediation as needed to permit construction
14

• Operated as a refinery from 1939 to 1992.
• Regional Water Quality Control Board investigation began in 1985.
• LACSD purchased in 2000 for $14 million. Price included cleanup.
• Cleanup entity defaults in 2008. Sanitation Districts assumed responsibility for the remediation.
• 2018 current land value of FORCO site (35 acres) is approximately $60-80 million.
1994 Aerial
SITE HISTORY
15
REMEDIATION TO DATE
• Demolished structures to grade
• Groundwater and soils remediation
• Performed Human Health Risk Assessment
• Pursuing site closure with Regional Board
• Regional Board has given approval to construct AWT on site with conditions
16

• Prepare Remedial Action Plan
• Coordinate with Metropolitan to address interfering utilities and subsurface structures
• Sanitation Districts Board briefing fall 2019
• Implement additional remediation measures
NEXT STEPS
17

ENVIRONMENTAL REVIEW PROCESS
TIERED CEQA PROCESS
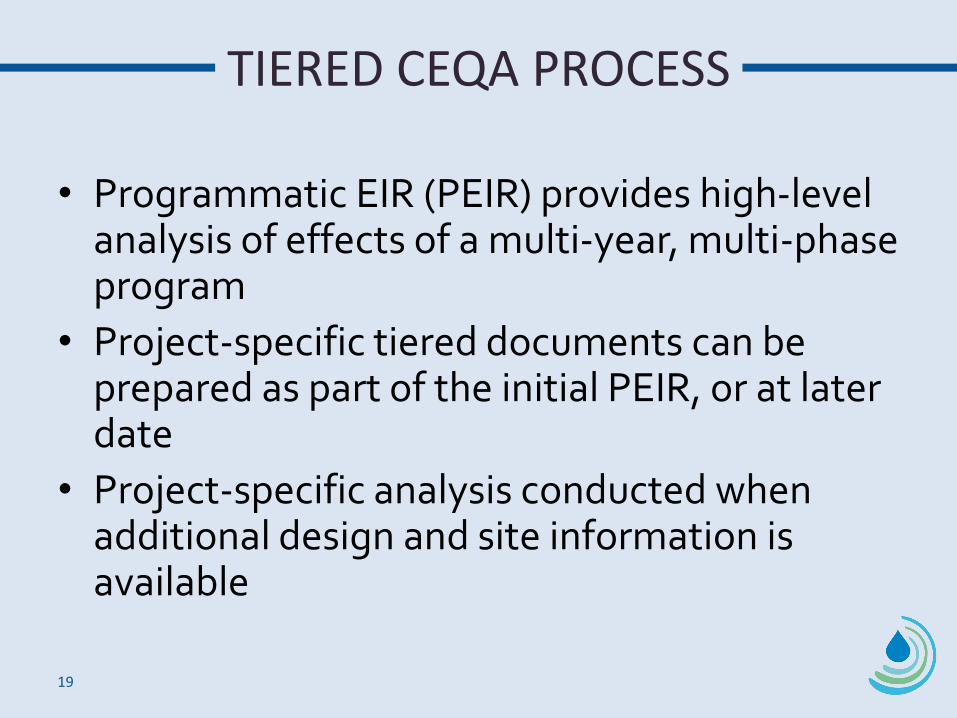
• Programmatic EIR (PEIR) provides high-level analysis of effects of a multi-year, multi-phase program
• Project-specific tiered documents can be prepared as part of the initial PEIR, or at later date
• Project-specific analysis conducted when additional design and site information is available
19

TIERED PROCESS
20
Programmatic EIR
Tiered Project-specific Document
Initial Pipeline Project

IMPLEMENTATION OPTIONS
THREE OPTIONS
22
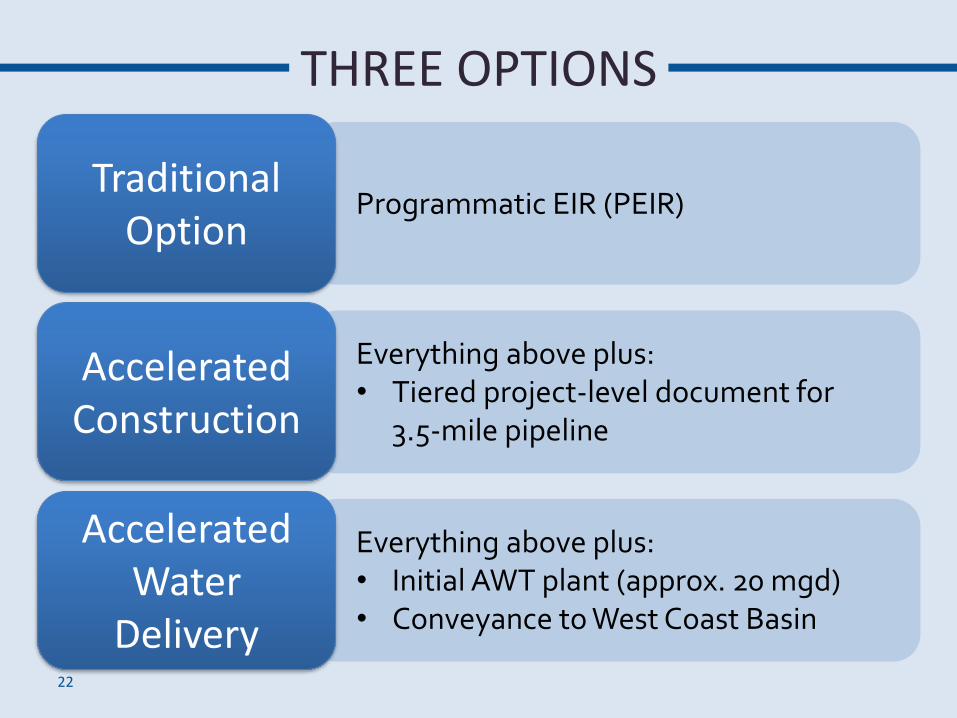
Traditional Option
Programmatic EIR (PEIR)
Accelerated Construction
Everything above plus:• Tiered project-level document for
3.5-mile pipeline
Accelerated Water
Delivery
Everything above plus:• Initial AWT plant (approx. 20 mgd)• Conveyance to West Coast Basin

TRADITIONAL PEIR APPROACH
West Coast Basin
Injection Wells
Santa Fe SpreadingGrounds
Rio Hondo SpreadingGrounds
Orange County SpreadingGrounds
Long BeachInjection Wells
Pump Station
Montebello Forebay Injection Wells
Weymouth WTP
Junction Structure
Diemer WTP
Pump Station(s)
MWD East OC Feeder #1
MWDYorba Linda
Feeder
150-mgd AWT
Harbor Industrial
Users
Intertie with pipeline from Hyperion AWT
Backbone System
Future Options
Existing MWD Infrastructure

Facilities included for Preliminary Design
ACCELERATED CONSTRUCTION WITH PRELIMINARY DESIGN
West Coast Basin
Injection Wells
Santa Fe SpreadingGrounds
Rio Hondo SpreadingGrounds
Orange County SpreadingGrounds
Long BeachInjection Wells
Pump Station
Montebello Forebay Injection Wells
Weymouth WTP
Junction Structure
Diemer WTP
Pump Station(s)
MWD East OC Feeder #1
MWDYorba Linda
Feeder
Harbor Industrial
Users
Intertie with pipeline from Hyperion AWT
100-mgd AWT
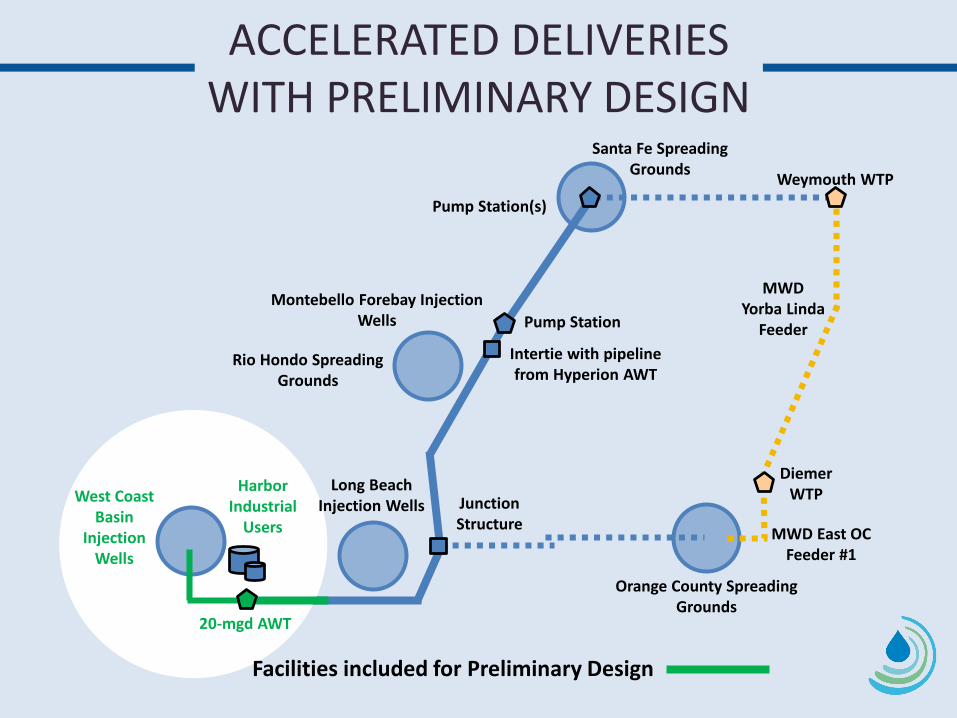
ACCELERATED DELIVERIESWITH PRELIMINARY DESIGN
Santa Fe SpreadingGrounds
Rio Hondo SpreadingGrounds
Orange County SpreadingGrounds
Pump Station
Montebello Forebay Injection Wells
Weymouth WTP
Junction Structure
Diemer WTP
Pump Station(s)
MWD East OC Feeder #1
MWDYorba Linda
Feeder
20-mgd AWT
West Coast Basin
Injection Wells
Facilities included for Preliminary Design
Harbor Industrial
Users
Intertie with pipeline from Hyperion AWT
Long BeachInjection Wells
TRADITIONAL
26
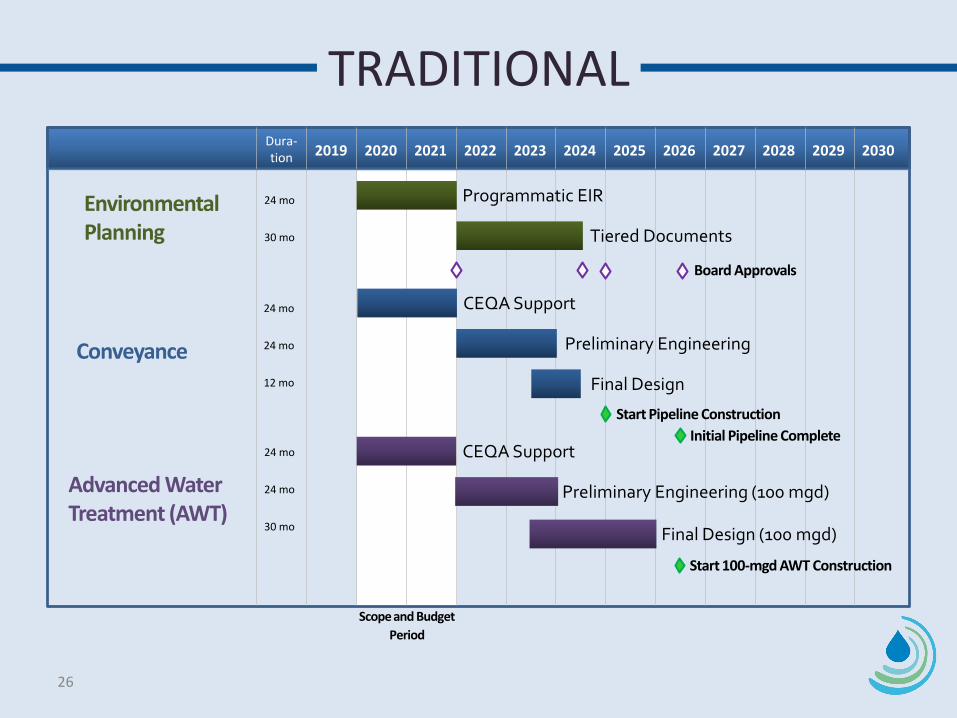
Environmental Planning
24 mo
30 mo
24 mo
24 mo
12 mo
24 mo
24 mo
30 mo
Start Pipeline Construction
Scope and Budget
Period
Board Approvals
2019 2020 2021 2022 2023Dura-tion 2024 2025 2026 2027 2028 2029 2030
Conveyance
Advanced WaterTreatment (AWT)
Programmatic EIR
CEQA Support
Preliminary Engineering (100 mgd)
CEQA Support
Final Design (100 mgd)
Preliminary Engineering
Final Design
Tiered Documents
Start 100-mgd AWT Construction
Initial Pipeline Complete
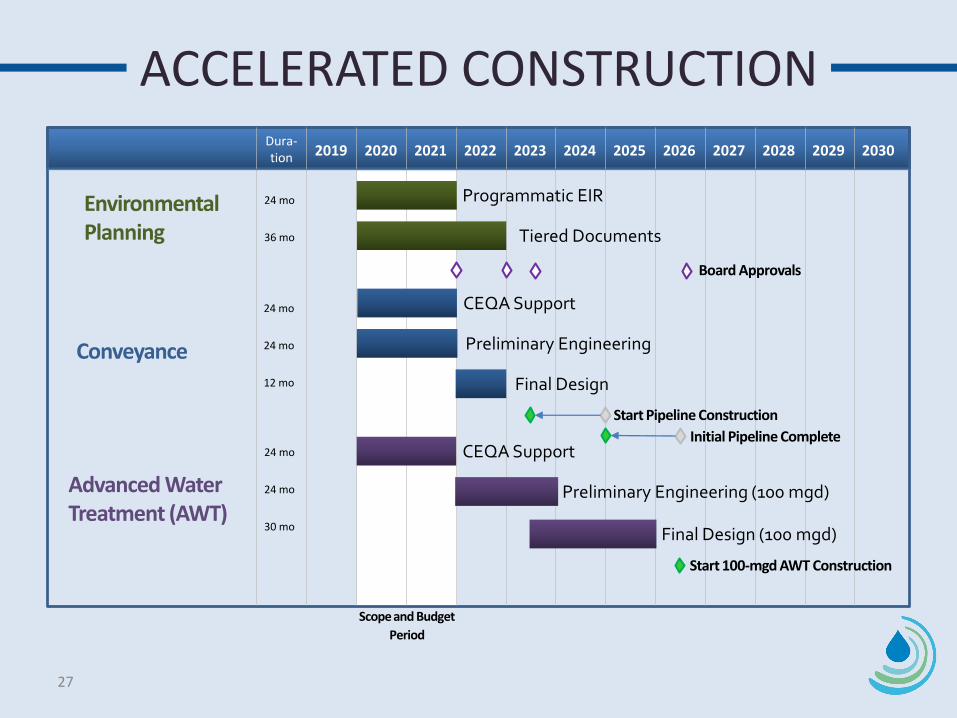
ACCELERATED CONSTRUCTION
27
Environmental Planning
24 mo
36 mo
24 mo
24 mo
12 mo
24 mo
24 mo
30 mo
Start Pipeline Construction
Scope and Budget
Period
Board Approvals
2019 2020 2021 2022 2023Dura-tion 2024 2025 2026 2027 2028 2029 2030
Conveyance
Advanced WaterTreatment (AWT)
Programmatic EIR
CEQA Support
Preliminary Engineering (100 mgd)
CEQA Support
Final Design (100 mgd)
Preliminary Engineering
Final Design
Tiered Documents
Start 100-mgd AWT Construction
Initial Pipeline Complete

ACCELERATED DELIVERIES
28
Environmental Planning
24 mo
36 mo
24 mo
24 mo
12 mo
24 mo
24 mo
28 mo
Start Pipeline Construction
Scope and Budget
Period
Board Approvals
2019 2020 2021 2022 2023Dura-tion 2024 2025 2026 2027 2028 2029 2030
Conveyance
Advanced WaterTreatment (AWT)
Programmatic EIR
CEQA Support
Preliminary Engineering (20 mgd)
CEQA Support
Final Design (20 mgd)
Preliminary Engineering
Final Design
Tiered Documents
Start 20-mgd AWT Construction
Initial Pipeline Complete
20-mgd Complete
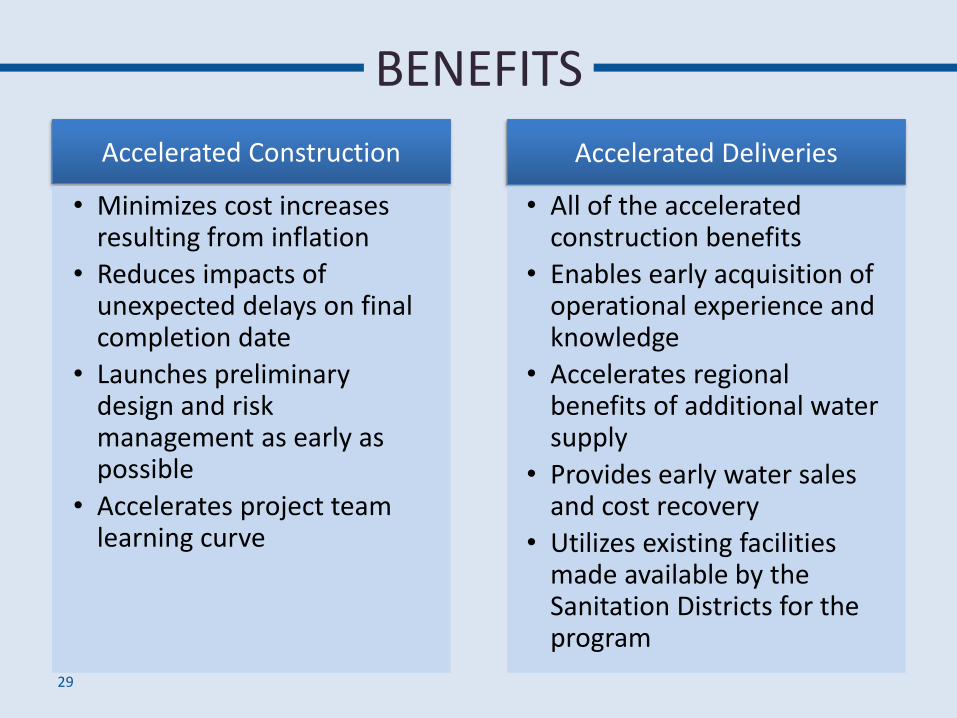
BENEFITS
29
Accelerated Construction
• Minimizes cost increases resulting from inflation
• Reduces impacts of unexpected delays on final completion date
• Launches preliminary design and risk management as early as possible
• Accelerates project team learning curve
Accelerated Deliveries
• All of the accelerated construction benefits
• Enables early acquisition of operational experience and knowledge
• Accelerates regional benefits of additional water supply
• Provides early water sales and cost recovery
• Utilizes existing facilities made available by the Sanitation Districts for the program
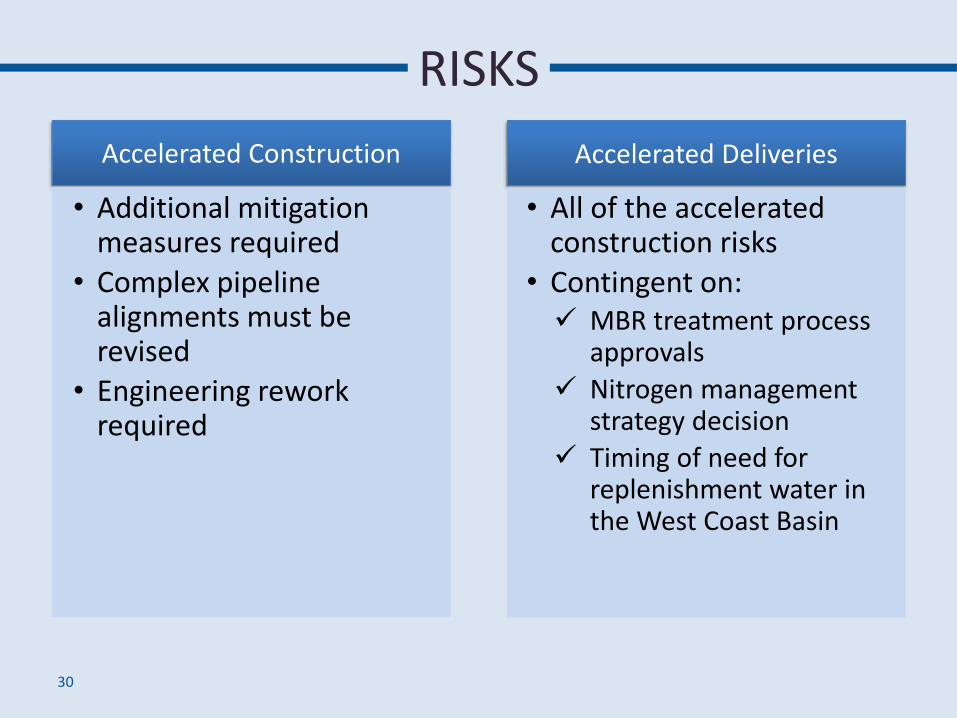
RISKS
30
Accelerated Construction
• Additional mitigation measures required
• Complex pipeline alignments must be revised
• Engineering rework required
Accelerated Deliveries
• All of the accelerated construction risks
• Contingent on: MBR treatment process
approvals
Nitrogen management strategy decision
Timing of need for replenishment water in the West Coast Basin
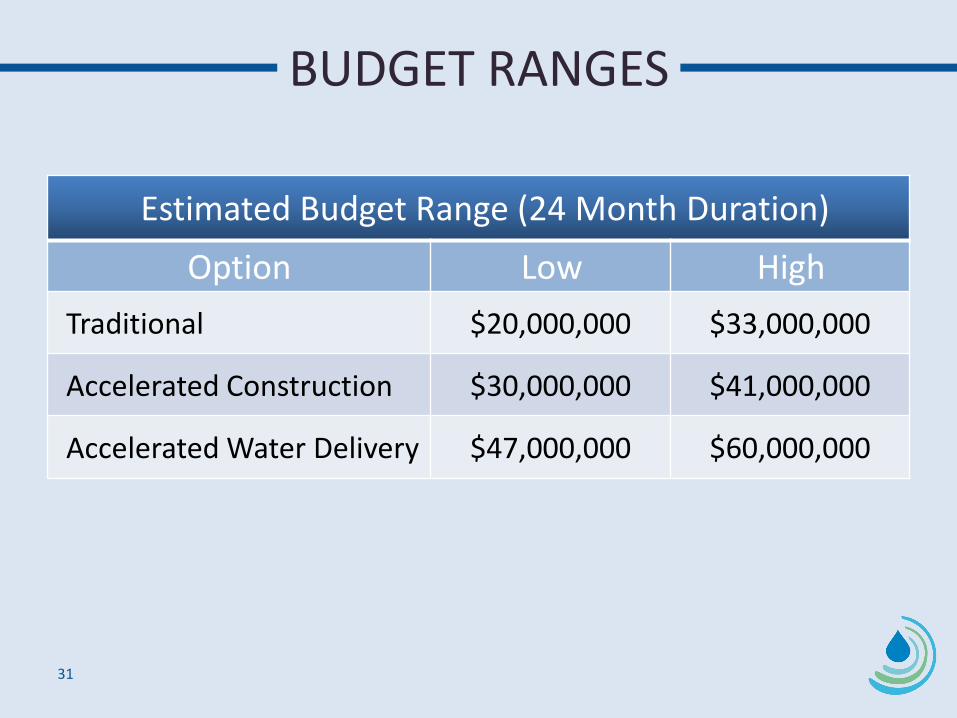
BUDGET RANGES
31
Estimated Budget Range (24 Month Duration)
Option Low High
Traditional $20,000,000 $33,000,000
Accelerated Construction $30,000,000 $41,000,000
Accelerated Water Delivery $47,000,000 $60,000,000
DIRECT POTABLE REUSE CONSIDERATIONS

OUTLINE
• Background
• Raw Water Augmentation Opportunities
• Raw Water Augmentation Development Roadmap
33

BACKGROUND
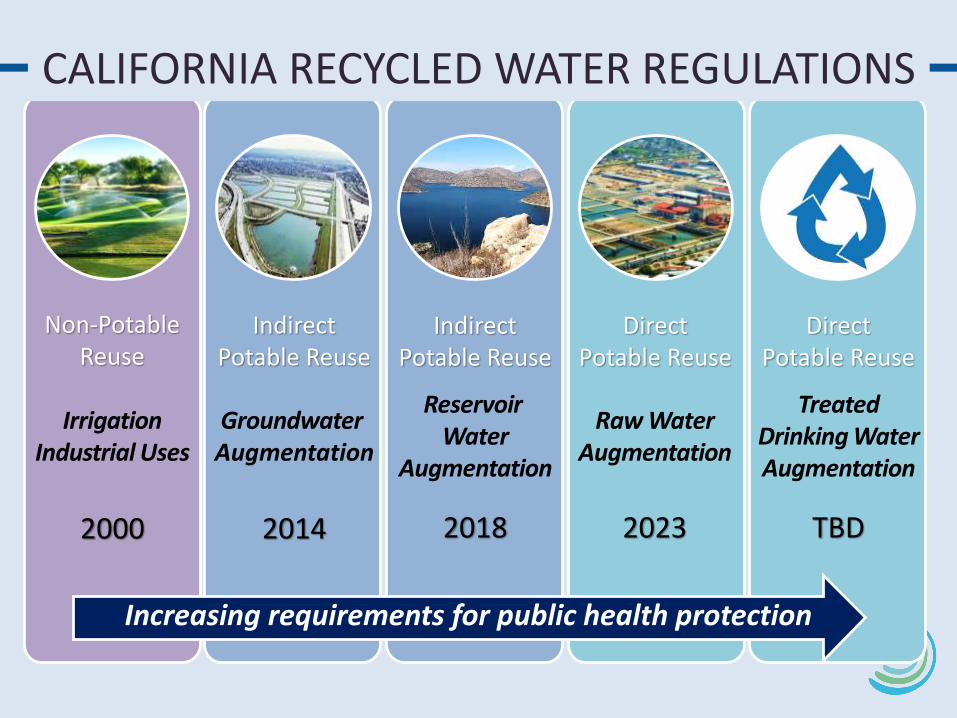
Indirect Potable Reuse
GroundwaterAugmentation
2014
Indirect Potable Reuse
Reservoir Water
Augmentation
2018
Raw Water Augmentation
Direct Potable Reuse
2023
Non-Potable Reuse
2000
IrrigationIndustrial Uses
Increasing requirements for public health protection
Treated Drinking Water Augmentation
Direct Potable Reuse
TBD
CALIFORNIA RECYCLED WATER REGULATIONS
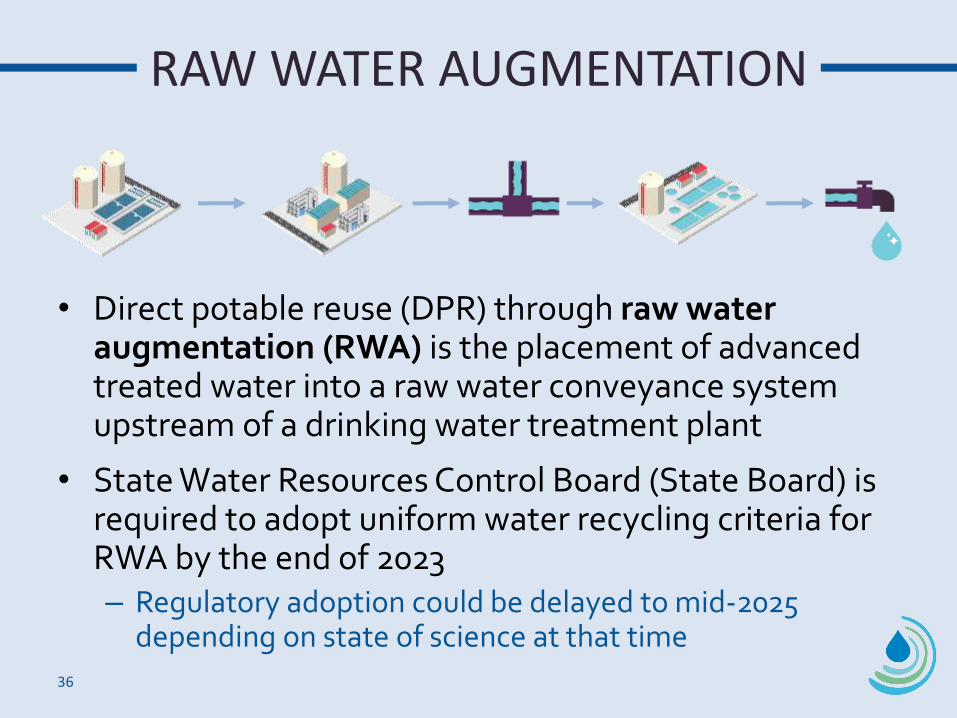
RAW WATER AUGMENTATION
• Direct potable reuse (DPR) through raw water augmentation (RWA) is the placement of advanced treated water into a raw water conveyance system upstream of a drinking water treatment plant
• State Water Resources Control Board (State Board) is required to adopt uniform water recycling criteria for RWA by the end of 2023– Regulatory adoption could be delayed to mid-2025
depending on state of science at that time
36

RAW WATER AUGMENTATIONOPPORTUNITIES

RAW WATER AUGMENTATION OPTIONS
38
West Coast Basin
Injection Wells
Orange County Spreading Grounds
Long BeachInjection Wells
Pump Station
JWPCP150-mgd AWT &
Pump Station
Harbor Industrial
Users
Rio Hondo Spreading Grounds
Montebello Forebay Injection Wells
Santa FeSpreadingGrounds
Weymouth Water Treatment Plant
Diemer Water Treatment Plant
East Orange County Feeder #1
Yorba Linda Feeder
Initial Backbone System
Additional Basin Options
Future RWA OptionsPump Station(s)
Junction Structure
60-mgd Pipeline
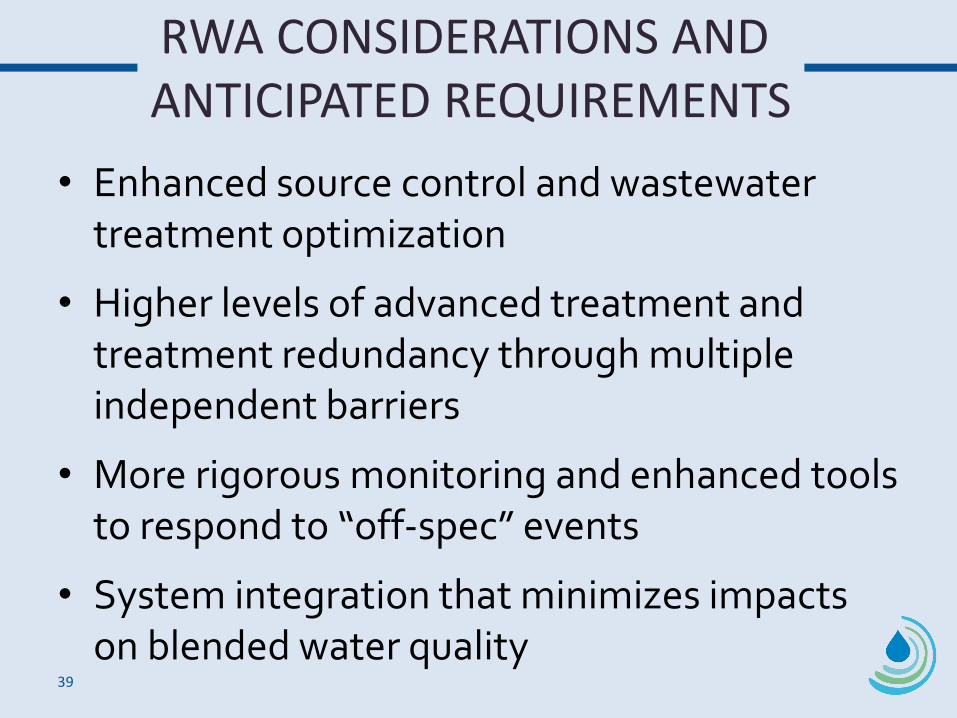
RWA CONSIDERATIONS AND ANTICIPATED REQUIREMENTS
• Enhanced source control and wastewater treatment optimization
• Higher levels of advanced treatment and treatment redundancy through multiple independent barriers
• More rigorous monitoring and enhanced tools to respond to “off-spec” events
• System integration that minimizes impacts on blended water quality
39

TREATMENT FACILITY OPTIONS
• Additional RWA treatment processes could be:
– Part of the AWT facility planned at JWPCP, or
– At a potential satellite facility downstream; only flow to be used for RWA would be treated to more stringent requirements
• Further discussion with State Board is needed to determine potential acceptance of a satellite facility concept
40

BLENDING AT METROPOLITAN’S TREATMENT PLANTS
• State Board has expressed that blending requirements would be incorporated into future RWA regulations to the degree that it provides a “meaningful public health benefit” (SWRCB, 2018)
• Metropolitan may also establish blending requirements for introducing advanced treated water to Weymouth or Diemer plants to ensure water quality goals are met
• Blending percentage may increase with greater project experience and demonstration of public health protection
41
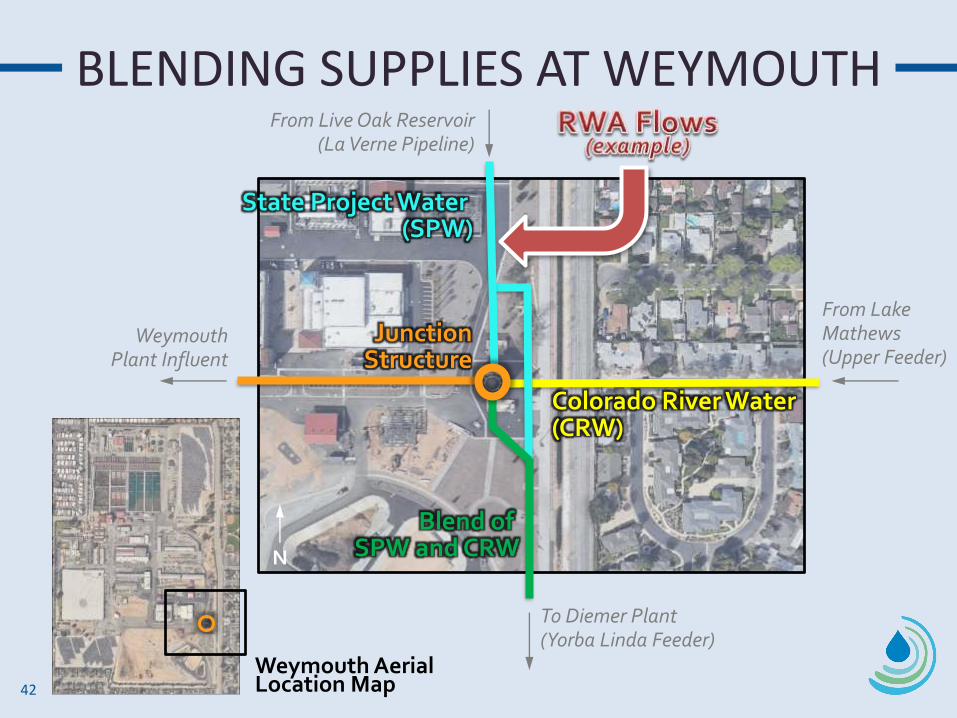
BLENDING SUPPLIES AT WEYMOUTH
42
State Project Water (SPW)
Colorado River Water(CRW)
Blend of SPW and CRW
JunctionStructure
WeymouthPlant Influent
From Lake Mathews(Upper Feeder)
To Diemer Plant(Yorba Linda Feeder)
From Live Oak Reservoir(La Verne Pipeline)
N
Weymouth AerialLocation Map
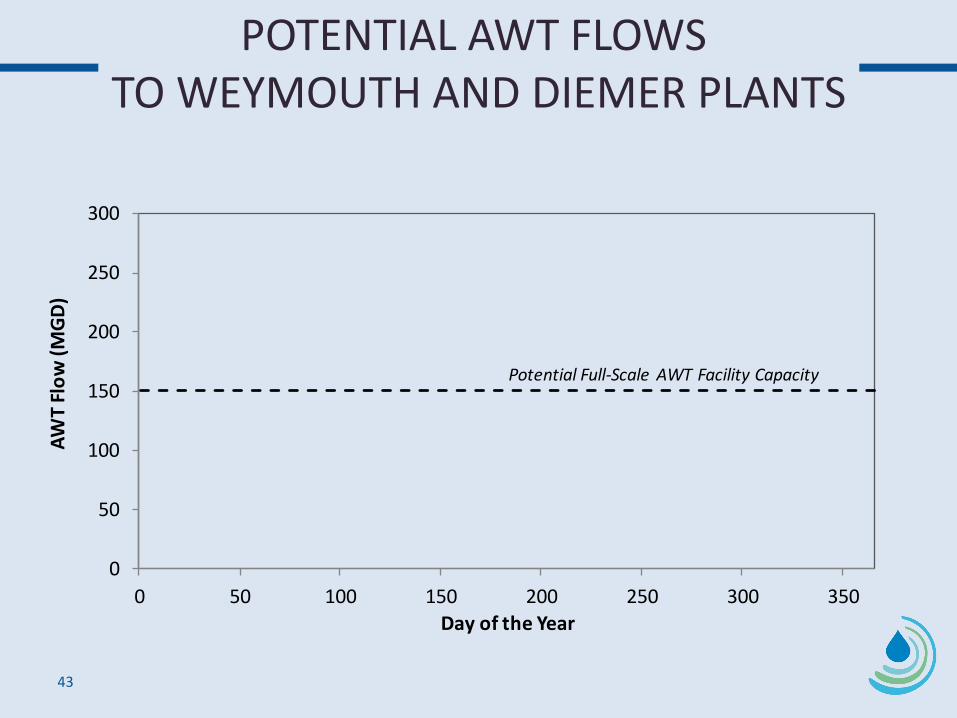
POTENTIAL AWT FLOWS TO WEYMOUTH AND DIEMER PLANTS
43
0
50
100
150
200
250
300
0 50 100 150 200 250 300 350
AW
T F
low
(MG
D)
Day of the Year
Potential Full-Scale AWT Facility Capacity
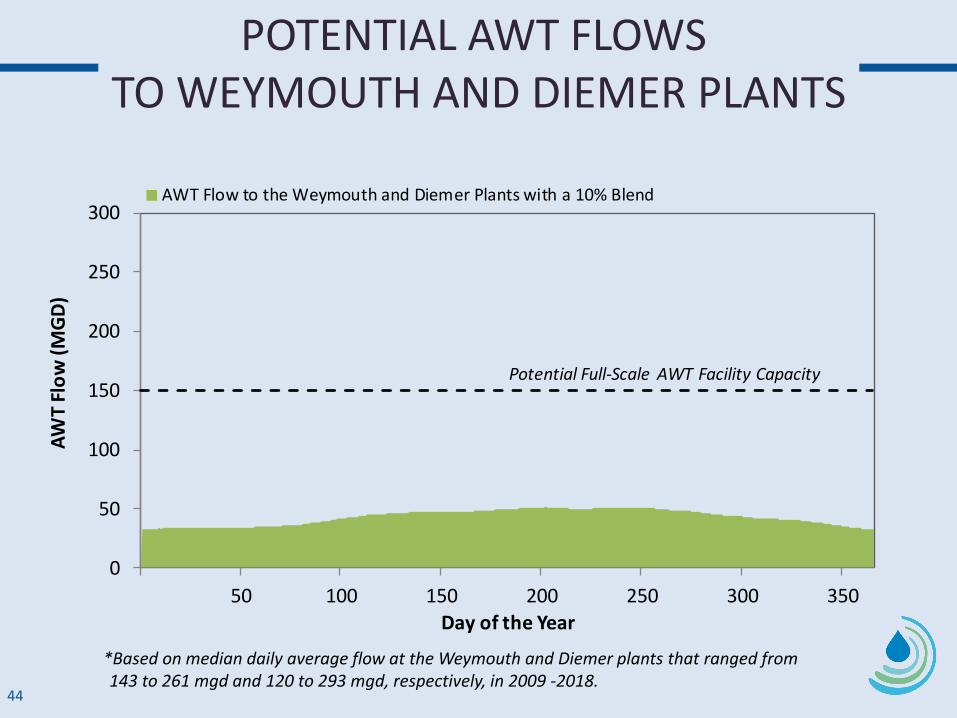
POTENTIAL AWT FLOWS TO WEYMOUTH AND DIEMER PLANTS
44
*Based on median daily average flow at the Weymouth and Diemer plants that ranged from 143 to 261 mgd and 120 to 293 mgd, respectively, in 2009 -2018.
0
50
100
150
200
250
300
50 100 150 200 250 300 350
AW
T Fl
ow
(MG
D)
Day of the Year
Potential Full-Scale AWT Facility Capacity
0
50
100
150
200
250
300
50 100 150 200 250 300 350
AW
T Fl
ow
(M
GD
)
Day of the Year
AWT Flow to the Weymouth and Diemer Plants with a 50% Blend
AWT Flow to the Weymouth and Diemer Plants with a 25% Blend
AWT Flow to the Weymouth and Diemer Plants with a 10% Blend
Potential Full-Scale AWT Facility Capacity

POTENTIAL AWT FLOWS TO WEYMOUTH AND DIEMER PLANTS
45
0
50
100
150
200
250
300
50 100 150 200 250 300 350
AW
T F
low
(MG
D)
Day of the Year
Potential Full-Scale AWT Facility Capacity
0
50
100
150
200
250
300
50 100 150 200 250 300 350
AW
T Fl
ow
(M
GD
)
Day of the Year
AWT Flow to the Weymouth and Diemer Plants with a 50% Blend
AWT Flow to the Weymouth and Diemer Plants with a 25% Blend
AWT Flow to the Weymouth and Diemer Plants with a 10% Blend
Potential Full-Scale AWT Facility Capacity
*Based on median daily average flow at the Weymouth and Diemer plants that ranged from 143 to 261 mgd and 120 to 293 mgd, respectively, in 2009 -2018.
RAW WATER AUGMENTATIONDEVELOPMENT ROADMAP
DEMONSTRATION TESTING OBJECTIVES
• Demonstrate efficacy of additional treatment processes for pathogen and chemical control
• Demonstrate appropriate treatment train (for onsite or satellite facility) to meet anticipated RWA regulatory requirements
• Develop and evaluate water quality criteria and blending strategies for advanced treated water upstream of drinking water treatment plants
• Develop, evaluate, and optimize analytical methods for detecting microbial and chemical contaminants
47
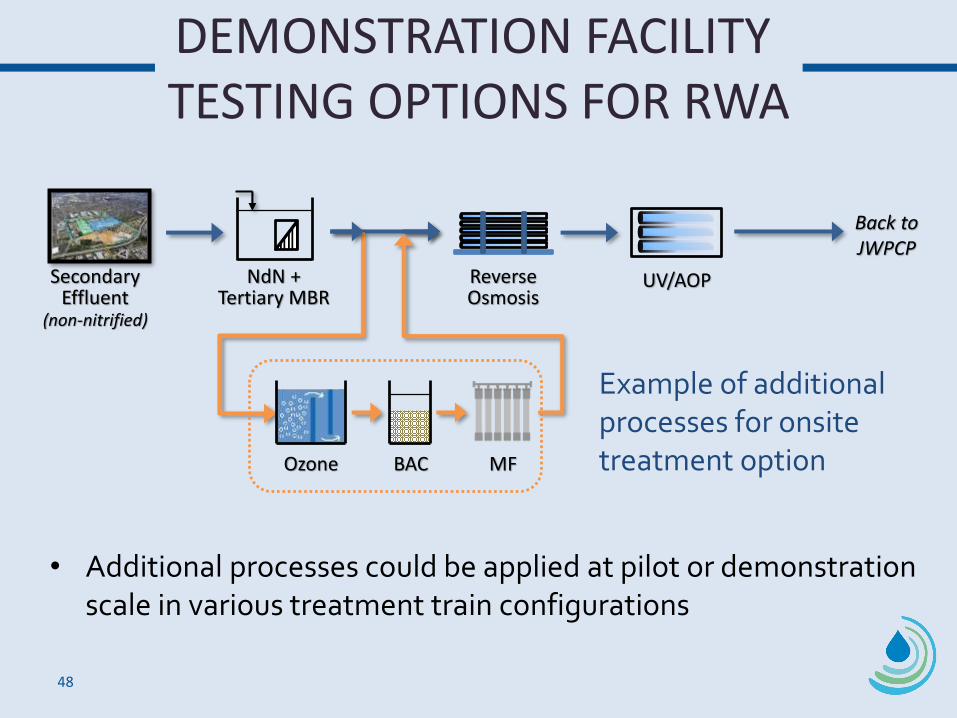
DEMONSTRATION FACILITY TESTING OPTIONS FOR RWA
48
Secondary Effluent
(non-nitrified)
Reverse Osmosis
NdN +Tertiary MBR
Back to JWPCP
UV/AOP
Ozone BAC MF
Example of additional processes for onsite treatment option
• Additional processes could be applied at pilot or demonstration scale in various treatment train configurations

DEMONSTRATION FACILITY TESTING OPTIONS FOR RWA
49
Secondary Effluent
(non-nitrified)
Reverse Osmosis
NdN +Tertiary MBR
Back to JWPCP
UV/AOP
TBD
?Further discussion with State Board needed on additional processes for
satellite treatment option
• Additional processes could be applied at pilot or demonstration scale in various treatment train configurations
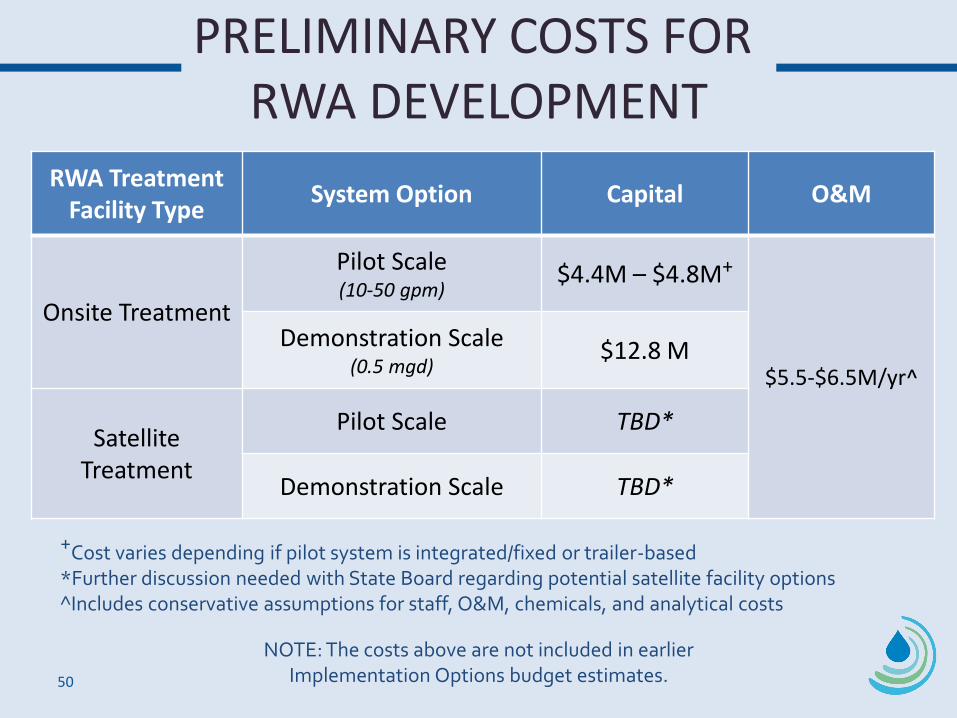
PRELIMINARY COSTS FOR RWA DEVELOPMENT
RWA TreatmentFacility Type
System Option Capital O&M
Onsite Treatment
Pilot Scale(10-50 gpm)
$4.4M – $4.8M+
$5.5-$6.5M/yr^
Demonstration Scale(0.5 mgd)
$12.8 M
SatelliteTreatment
Pilot Scale TBD*
Demonstration Scale TBD*
50
+Cost varies depending if pilot system is integrated/fixed or trailer-based *Further discussion needed with State Board regarding potential satellite facility options^Includes conservative assumptions for staff, O&M, chemicals, and analytical costs
NOTE: The costs above are not included in earlier Implementation Options budget estimates.
POTENTIAL ENGAGEMENT IN REGULATORY DEVELOPMENT
• Engage in ongoing industry research to support RWA regulatory development
• Research findings would support RWA process design and testing
• Engage and assist State Board in the development of raw water augmentation regulatory criteria
• Potential risks with testing prior to final regulatory criteria include:– Exploratory research and/or redesign of treatment
processes– Risk balanced through close coordination with the State
Board and Independent Scientific Advisory Panel (ISAP)51

DEMONSTRATION FACILITY PRELIMINARY TESTING SCHEDULE
52
Design
Construction
2019 2020 2021 2022 2023 2024 2025
RWA Regulatory Adoption
Raw Water Augmentation
Test Plan Development
ISAP/Regulator Review
Phases 1 & 2 MBR Testing
WithExtension
Operations/Testing Construction
Design Completion
Testing

RWA SUGGESTED NEXT STEPS
• Begin RWA test plan development and treatment process design in 2021– Design and construction of RWA treatment processes
at demonstration facility would require future Board action
• Begin RWA testing with draft regulatory criteria in 2023, prior to State Board’s final adoption of raw water augmentation regulations
• Support research and collaborate with regulators and stakeholders in development of raw water augmentation regulations
53
WRAP-UP / NEXT STEPS

NEXT STEPS
• Receive input on implementation options and DPR opportunities
• Will compile ideas and suggestions heard today• Board Workshop #2 later this fall
– White Paper #2: “Planning, Agreements, and Financial Considerations” prior to workshop
• Both workshops will contribute to preparation of potential Board actions
• Future potential actions related to RWA development will follow
55
mwdh2o.com/rrwp
@mwdh2o