Embed Size (px)
Citation preview
Program Assessment Report
Page 1 of 11
Assessment Reporting Spring 2009 – Spring 2010
As you now know an interim report on the assessment of student learning is due to WASC in fall of 2010. We have been asked to demonstrate that we are using assessment data to improve student learning (i.e., “closing the assessment loop”) and that the assessment process is sustainable. To that end, we are asking programs to report on their most complete student learning outcome (SLO) during this reporting cycle. Please identify your selected SLO in the box below and provide the requested information.
Program Information Degree Program(s): Aerospace Engineering Department: Mech&Aerospace Engr.
Department Chair: Fred Barez Phone: Report Prepared by: Nikos J. Mourtos Phone: 4-3867
Student Learning Outcome (SLO)
Ability to use mathematics, science, and engineering principles to identify, formulate, and solve aerospace
engineering problems.
Evidence for Need: What evidence was used to identify this SLO as a candidate for improvement (e.g., describe the prior assessment activities, data, and discussions that led to this decision)? The fact that engineering graduates do not possess adequate problem-solving skills has been confirmed by several studies [1, 2, 3] and is a problem that persists around the world to this date [3]. In one of these studies students showed no improvement in problem solving skills even though they observed at least 1,000 examples worked on the board and solved more than 3,000 exercises in homework by the time they completed their undergraduate work [2]. This evidence was also corroborated by data from several AE/ME courses in the past several years, which showed that students encountered both cognitive and affective difficulties while solving engineering problems. Top cognitive difficulties were (i) applying first principles in the solution of problems, (ii) reflecting on the problem-solving process, (iii) self-assessment of problem-solving skills (iv) defining a problem in engineering terms, (v) selecting a valid model for a problem (making appropriate assumptions), and (vi) following the problem–solving methodology in its entirety. Top affective difficulties were (i) unwillingness to spend sufficient time on task, (ii) reluctance to write down ideas and create sketches while solving a problem, and (iii) dealing with ambiguity and uncertainty.
Changes to Curriculum or Pedagogy: What actions were taken to improve student learning related to this outcome (e.g., program changes, changes in pedagogy, process changes, resources requests, etc)?
Key core AE and ME courses at SJSU were re-designed to help students develop problem-solving skills [4-5]. This re-design includes:

Program Assessment Report
Page 2 of 11
a. Explicit definition of skills and attributes that students need to develop to become capable problem-solvers [4]. These skills and attributes come from both the affective and the cognitive domains of educational objectives. b. Inclusion of open – ended problems (OEP) in each of several key, junior-level, core courses [4-5]. OEP are presented in lectures, assigned as team homework, and are included on final exams as well. c. Coaching students in the use of Wood’s Problem-Solving Methodology (PSM) [6] while solving OEP. This process includes seven steps: engage, define, explore, plan, implement, check, and reflect. d. Development of rubrics to evaluate student performance at each step of the PSM [7].
Evidence for Impact: What is the evidence that the actions taken above impacted student learning for this outcome?
The introduction of the rubrics made a significant difference in student performance compared to previous years when teaching of problem – solving was done in a more ad-hoc fashion. Details are given below. The author collected and analyzed data from two courses he taught, ME111 and AE162 with the following statistics:
ME111 – Fluid Mechanics
o F08: 62 students, of whom 38 (61%) received passing grades (C- or higher)
o S09: 64 students, of whom 53 (82%) received passing grades.
AE162 – Aerodynamics
o S08: 28 students, of whom 25 (89%) received passing grades
o S09: 24 students, of whom 22 (92%) received passing grades.
The rubric for measuring student engagement (Step 1 of the PSM) was used for the first time in S09. The survey was distributed in both courses at the end of the semester, after completion of the last OEP and included questions related to student confidence in their cognitive skills as well as student attitudes and habits during problem solving.
Students were asked to include two separate reflections (Step 7 of the PSM) in their report for each OEP. The first involves the technical aspects of the problem itself and is performed by the team. The second involves each member’s personal problem-solving process and is carried out individually. As part of this personal reflection, students were reminded to answer the following questions in their report for the last OEP in each class. A qualitative analysis of student responses was conducted.
(a) What was the greatest challenge you faced in solving OEP in this class?
(b) What other difficulties did you experience in solving OEP?
(c) What general skills did you learn (applicable to other classes / situations) from solving OEP in this class?

Program Assessment Report
Page 3 of 11
(d) Do you have any specific suggestions for the instructor on how he can help students improve their problem-solving skills?
(e) Do you have any specific suggestions for students who try to solve OEP?
Assessment of Student Ability to Follow the PSM
Step 1: Engage
Survey results [7] showed a fairly good level of student engagement with both the ME111 and the AE162 problems (students averaged 6 – 7 hours on each OEP). In AE162 they averaged 38 hours on their open-ended project, which represents a significant investment of time. There are three possible explanations for this: (a) the project requires integration of two subjects, aerodynamics (AE162) and flight mechanics (AE165), hence it affected student grades in more than one course; (b) the project carries a greater weight towards the course grade (20% vs. 5% for each of the rest OEP); (c) a much higher level of engagement is achieved when students work on a problem of their choice.
It is also worth noting that 54% of the ME111 students and 32% of the AE162 students found the course material difficult. The main reason for this perception, especially in ME111, is inadequate preparation in the course prerequisites (primarily calculus and physics). This is confirmed by the poor test scores of ME111 students on the Force Concept Inventory [8] and AE162 students on the Fluid Mechanics Concept Inventory [9]. Students typically average 45-50% on these tests at the beginning of ME111 and AE162 respectively.
Step 2: Define In Step 2 students try to understand the problem and re-state it in their own terms. They make a comprehensive list of what is given but also what may be known from other sources, and determine any applicable constraints. This step requires some research to gain background information about the problem. Students are expected to draw a sketch of how they visualize the problem including any parameters they think are relevant. The most important outcome of this step is the criterion to be used in answering the question. For example, in the soccer problem (ME111) students decide what “measure” to use to determine if the ball feels noticeably softer (ex. % of air mass escaped, % of pressure lost, etc.). Figure 1 presents student performance in Step 2 using a specially designed rubric for this step.

Program Assessment Report
Page 4 of 11
Figure 1a – Student performance on Step 2 of the PSM in ME111 [*42 of the 63 students chose to work on an OEP of their own design]
Figure 1b – Student performance on Step 2 of the PSM in AE162
ME111 (F08) students performed significantly better as a class on the second problem, despite its greater difficulty (Figure 1a). Specifically, 97% received passing scores, with 81% receiving scores 7 or higher in OEP-2 compared with 84% and 50% respectively in OEP-1. The results were similar in S09: 83% received passing grades in Step 2 with 70% receiving scores 7 or

Program Assessment Report
Page 5 of 11
higher in OEP-2 compared with 50% in OEP-1. This indicates that students were able to improve their skills in “problem definition” as they gained experience with each OEP.
In contrast, Figure 1b shows that AE162 (S08) students performed better in Step 2 in OEP-1 (89% scored 7 or higher vs. 61% for OEP-2). However, OEP-1 was team homework while OEP-2 was a final exam problem. In S09, 67% received passing scores in OEP-1 and 100% in OEP-2. In fact, all students scored 7 or higher in Step 2. Students also performed very well in the much more challenging OEP-3, although 25% did not receive a passing grade in Step 2.
Thirty three (33%) percent of the students in ME111 and 41% of the students in AE162 identified Step 2 as the greatest challenge in solving OEP, expressing discomfort with the fact that so little information was given about each problem, unlike typical homework problems and exam questions.
Step 3: Explore In this step students explore relevant questions and brainstorm possible ways to model the physical situation described in the problem by making appropriate assumptions. To develop intuition, students also attempt to predict the answer to the problem. Figure 2 presents student performance in Step 3 using a specially designed rubric for this step.
Figure 2a – Student performance on Step 3 of the PSM in ME111 [*42 of the 63 students chose to work on an OEP of their own design]

Program Assessment Report
Page 6 of 11
Figure 2b – Student performance on Step 3 of the PSM in AE162
Figure 2a shows that, overall, students “explored” OEP-2 better than OEP-1 (in F08 only 3% did not perform adequately in OEP-2 compared with 29% in OEP-1; the corresponding numbers for S09 are 21% and 44% respectively). Again, students seem to perform better in their second opportunity to solve an OEP despite the increased level of difficulty. Figure 2b shows that student performance benefited from the team-effort in OEP-1 (S08) while 43% of the students did not perform adequately in this step in OEP-2 (individual effort, final exam). This trend, however, was reversed in S09 when 41% of the students did not receive a passing score in OEP-1 while all students performed adequately on OEP-2. As was the case with Step 2, students performed very well in the much more challenging OEP-3 although 24% did not receive a passing grade in Step 3.
Thirty (30%) percent of the students in ME111 and 9% of the students in AE162 identified Step 3 as the greatest challenge in solving OEPs. An additional 24% of students in ME111 and 18% in AE162 identified Step 3 as the second greatest challenge in tackling OEPs. By far the greatest difficulty expressed by students was making appropriate assumptions to simplify the problem. In their own words: “We didn’t know if our assumptions would lead to the right answer. We were trying to avoid making the problem too big (on one hand) versus oversimplifying it (on the other). Nevertheless students acknowledged that this ambiguity led to a better understanding of the material.
Step 4: Plan Students select an appropriate model (usually the simplest available) for developing a solution. They break down the problem into smaller sub-problems, each involving the calculation of various parameters, which serve as stepping-stones towards the final answer. It is important that students develop an algorithm (flow chart) for the solution of the problem and not substitute any numerical values. This algorithm may involve, for example, identifying appropriate equations or graphs for calculating various parameters in each sub-problem. Figure 3 presents student performance in Step 4 using a specially designed rubric for this step.
Program Assessment Report
Page 7 of 11
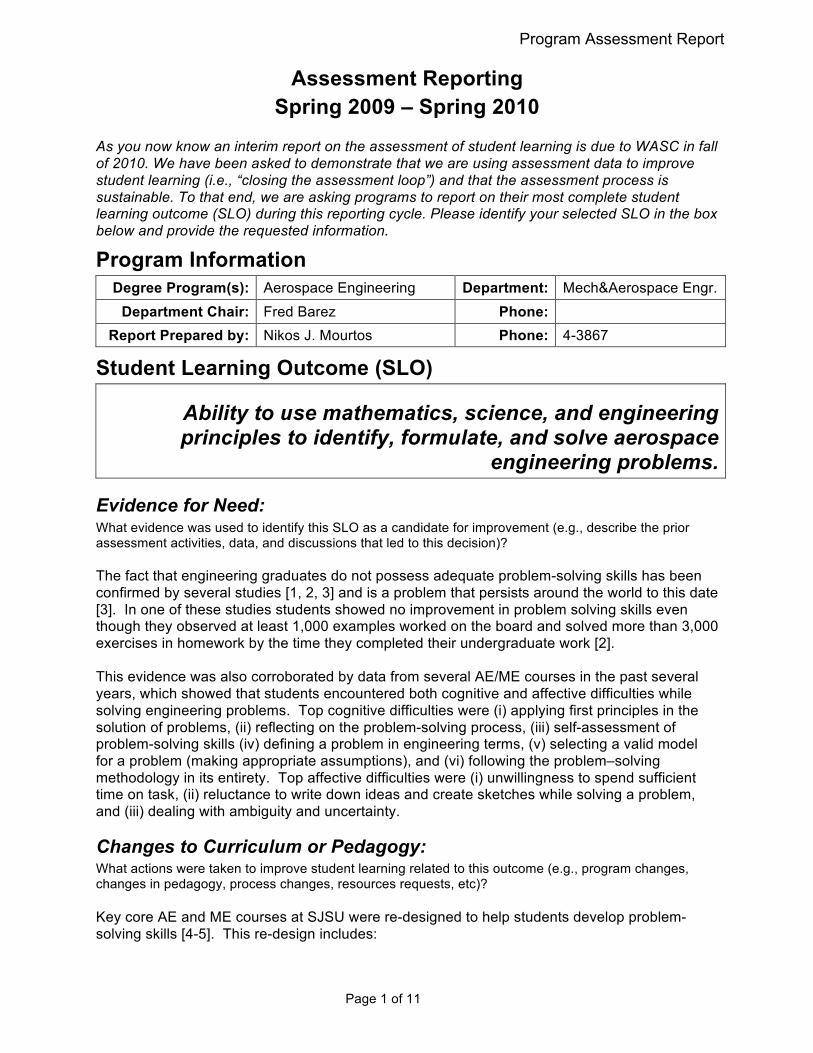
Figure 3a – Student performance on Step 4 of the PSM in ME111
Figure 3b – Student performance on Step 4 of the PSM in AE162
Figure 3a shows that in Step 4, as in previous steps, students performed better in their second opportunity to solve an OEP. Figure 3b (Spring 2008) shows again that performance may improve when students work in teams. This trend is again reversed in S09 when students
Program Assessment Report
Page 8 of 11
performed significantly better on OEP-2 on the final exam. However, a larger percentage of students (50%) performed poorly in Step 4 of OEP-3. Seventeen (17%) percent of the students in ME111 and 14% of the students in AE162 identified Step 4 as the greatest challenge in solving OEPs. An additional 19% (ME111) and 5% (AE162) identified this step as the second greatest challenge in tackling OEP. Students find it difficult “figuring out which equations/principles to use”. Step 5: Implement
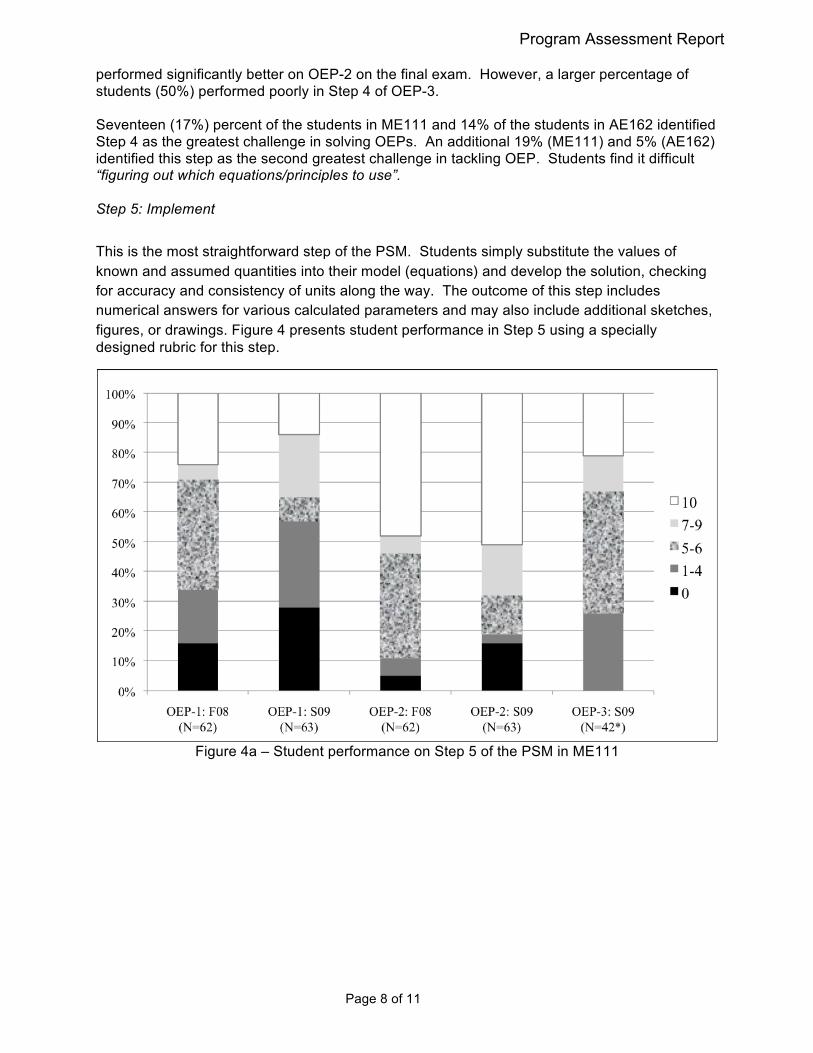
This is the most straightforward step of the PSM. Students simply substitute the values of known and assumed quantities into their model (equations) and develop the solution, checking for accuracy and consistency of units along the way. The outcome of this step includes numerical answers for various calculated parameters and may also include additional sketches, figures, or drawings. Figure 4 presents student performance in Step 5 using a specially designed rubric for this step.
Figure 4a – Student performance on Step 5 of the PSM in ME111
Program Assessment Report
Page 9 of 11
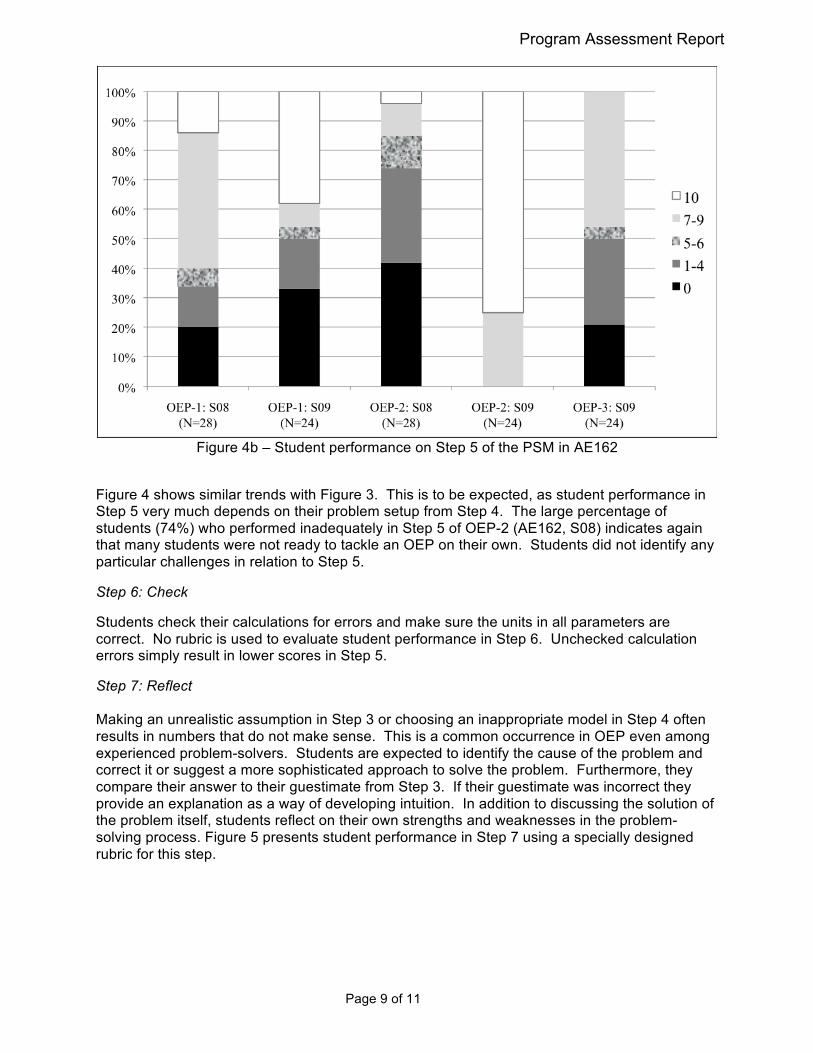
Figure 4b – Student performance on Step 5 of the PSM in AE162
Figure 4 shows similar trends with Figure 3. This is to be expected, as student performance in Step 5 very much depends on their problem setup from Step 4. The large percentage of students (74%) who performed inadequately in Step 5 of OEP-2 (AE162, S08) indicates again that many students were not ready to tackle an OEP on their own. Students did not identify any particular challenges in relation to Step 5.
Step 6: Check
Students check their calculations for errors and make sure the units in all parameters are correct. No rubric is used to evaluate student performance in Step 6. Unchecked calculation errors simply result in lower scores in Step 5.
Step 7: Reflect Making an unrealistic assumption in Step 3 or choosing an inappropriate model in Step 4 often results in numbers that do not make sense. This is a common occurrence in OEP even among experienced problem-solvers. Students are expected to identify the cause of the problem and correct it or suggest a more sophisticated approach to solve the problem. Furthermore, they compare their answer to their guestimate from Step 3. If their guestimate was incorrect they provide an explanation as a way of developing intuition. In addition to discussing the solution of the problem itself, students reflect on their own strengths and weaknesses in the problem-solving process. Figure 5 presents student performance in Step 7 using a specially designed rubric for this step.

Program Assessment Report
Page 10 of 11
Figure 5a – Student performance on Step 7 of the PSM in ME111
Figure 5b – Student performance on Step 7 of the PSM in AE162
The reflection step is usually not done very well, if done at all. Yet, this step is critical for self-assessment and self-improvement. The large number of students who receive non-passing scores (0 – 4) on Step 7 confirms that students have great difficulty with this final step. Nevertheless, very few students mentioned reflection as one of their major challenges.

Program Assessment Report
Page 11 of 11
REFERENCES
1. J.D. Lang, S. Cruise, F.D. McVey and J. McMasters, Industry expectations of new engineers: A survey to assist curriculum designers. J. of Engineering Education, 88 (1), 43-51 (1999).
2. D.R. Woods, A.N. Hrymak, R.R. Marshall, P.E. Wood, C.M. Crowe, T.W. Hoffman, J.D. Wright, P.A. Taylor, K.A. Woodhouse and C.G.K. Bouchard, Developing problem solving skills: The McMaster Problem Solving Program, ASEE J. of Engineering Education, 86 (2), 75-91 (1997).
3. Many engineering students lack employable skills, The Hindu, Online Edition, Feb. 11 (2009). <http://www.thehindu.com/2009/02/11/stories/2009021159130300.htm> retrieved Aug. 15, 2009.
4. N.J. Mourtos, N. DeJong-Okamoto and J. Rhee, Open-ended problem solving skills in thermal-fluids engineering, Invited Paper, UICEE Global J. of Engineering Education, 8 (2), 189-199 (2004).
5. N.J. Mourtos, P. Papadopoulos and P. Agrawal, A flexible, problem-based, integrated aerospace engineering curriculum, 36th ASEE / IEEE Frontiers in Education Conference (2006).
6. D.R. Woods, Problem-based learning: How to gain the most from PBL, D.R. Woods, Waterdown, ON, (1994).
7. N.J. Mourtos, Challenges students face when solving open - ended problems. International J. of Engineering Education, Special Issue on Applications of Engineering Education Research, 26 (2010).
8. D. Hestenes, M. Wells and G. Swackhamer, Force concept inventory, The Physics Teacher, 30 (3), 141-151 (1992).
9. J. Martin, J. Mitchell and T. Newell, Development of a concept inventory for fluid mechanics, 33rd ASEE/IEEE Frontiers in Education Conference (2003).


![[Report] Digital Habits of School Students in India](https://img.dokumen.tips/doc/110x75/5492f1ccac7959182e8b474d/report-digital-habits-of-school-students-in-india.jpg)