Embed Size (px)
Citation preview


PROGRAM & ABSTRACTS
DAY 1 Sunday 4th December 2016 8:00am - 12:30pm REGISTRATION at the Woodward Conference Centre
9:00am - 10:30am *WORKSHOP PART 1: FROM MODELS TO DECISIONS: Translating biomechanics research to the clinical setting Organisers: Morgan Sangeux (Murdoch Childrens Research Institute), Anna Murphy (Monash Health)
9:00am *INTRODUCTION & OBJECTIVES: BIOMECHANICS DRIVEN CLINICAL DECISIONS Morgan Sangeux, Murdoch Childrens Research Institute
9:20am
BIOMECHANICS ANALYSIS CAN ASSIST RETURN TO SPORT DECISIONS IN ELITE ATHLETES Jodie McClelland, La Trobe University
9:32am KINEMATICS AND KINETICS DURING STAIR ASCENT IN INDIVIDUALS WITH SYMPTOMATIC GLUTEAL TENDINOPATHY Kim Allison, University of Melbourne
9:44am CHARACTERISATION OF LOWER LEG MUSCLE MORPHOLOGY AND FUNCTION: IMPLICATIONS FOR MEDIAL TIBIAL STRESS SYNDROME - WORK IN PROGRESS Josh Mattock, University of Wollongong
9:56am DOES FRONTAL PLANE KNEE MOTION INFLUENCE OSTEOARTHRITIS TREATMENT OUTCOMES? EXPLORATORY ANALYSES FROM THE INTENSIVE DIET AND EXERCISE FOR ARTHRITIS (IDEA) TRIAL Michelle Hall, University of Melbourne
10:08am Panel discussion on biomechanics informed clinical decisions
10:30am - 11:00am Morning Tea
Biomechanics analysis can assist return to sport decisions in elite athletes
Jodie A. McClelland1, Julian A. Feller2, Kate E. Webster1 1 School of Allied Health, La Trobe University, Melbourne, VIC, Australia
2 OrthoSport Victoria, Epworth HealthCare, Richmond, VIC, Australia
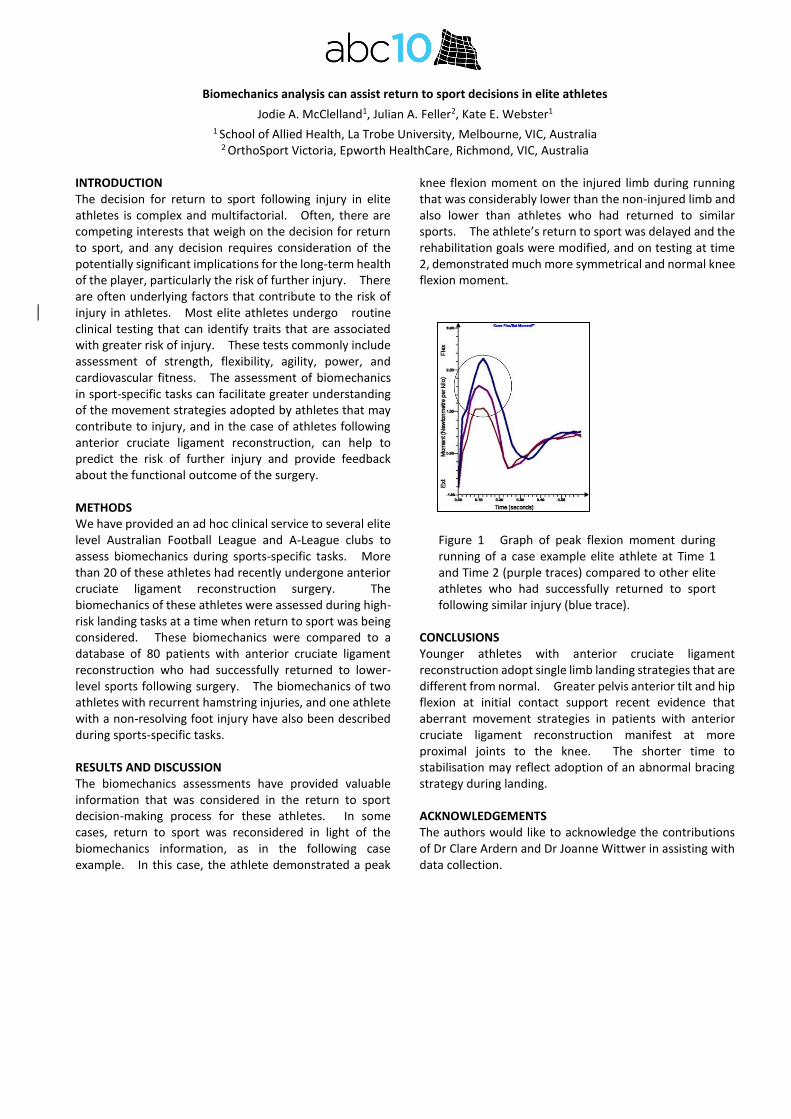
INTRODUCTION The decision for return to sport following injury in elite athletes is complex and multifactorial. Often, there are competing interests that weigh on the decision for return to sport, and any decision requires consideration of the potentially significant implications for the long-term health of the player, particularly the risk of further injury. There are often underlying factors that contribute to the risk of injury in athletes. Most elite athletes undergo routine clinical testing that can identify traits that are associated with greater risk of injury. These tests commonly include assessment of strength, flexibility, agility, power, and cardiovascular fitness. The assessment of biomechanics in sport-specific tasks can facilitate greater understanding of the movement strategies adopted by athletes that may contribute to injury, and in the case of athletes following anterior cruciate ligament reconstruction, can help to predict the risk of further injury and provide feedback about the functional outcome of the surgery. METHODS We have provided an ad hoc clinical service to several elite level Australian Football League and A-League clubs to assess biomechanics during sports-specific tasks. More than 20 of these athletes had recently undergone anterior cruciate ligament reconstruction surgery. The biomechanics of these athletes were assessed during high-risk landing tasks at a time when return to sport was being considered. These biomechanics were compared to a database of 80 patients with anterior cruciate ligament reconstruction who had successfully returned to lower-level sports following surgery. The biomechanics of two athletes with recurrent hamstring injuries, and one athlete with a non-resolving foot injury have also been described during sports-specific tasks. RESULTS AND DISCUSSION The biomechanics assessments have provided valuable information that was considered in the return to sport decision-making process for these athletes. In some cases, return to sport was reconsidered in light of the biomechanics information, as in the following case example. In this case, the athlete demonstrated a peak
knee flexion moment on the injured limb during running that was considerably lower than the non-injured limb and also lower than athletes who had returned to similar sports. The athlete’s return to sport was delayed and the rehabilitation goals were modified, and on testing at time 2, demonstrated much more symmetrical and normal knee flexion moment.
Figure 1 Graph of peak flexion moment during running of a case example elite athlete at Time 1 and Time 2 (purple traces) compared to other elite athletes who had successfully returned to sport following similar injury (blue trace).
CONCLUSIONS Younger athletes with anterior cruciate ligament reconstruction adopt single limb landing strategies that are different from normal. Greater pelvis anterior tilt and hip flexion at initial contact support recent evidence that aberrant movement strategies in patients with anterior cruciate ligament reconstruction manifest at more proximal joints to the knee. The shorter time to stabilisation may reflect adoption of an abnormal bracing strategy during landing. ACKNOWLEDGEMENTS The authors would like to acknowledge the contributions of Dr Clare Ardern and Dr Joanne Wittwer in assisting with data collection.

KINEMATICS AND KINETICS DURING STAIR ASCENT IN INDIVIDUALS WITH SYMPTOMATIC GLUTEAL TENDINOPATHY
Kim Allison1,*, Bill Vicenzino2, Kim Bennell1, Tim Wrigley1, Alison Grimaldi2 and Paul Hodges2 1 Department of Physiotherapy, University of Melbourne, VIC, Australia,* [email protected]
2 School of Health & Rehabilitation Sciences, University of Queensland, QLD, Australia
INTRODUCTION Gluteal tendinopathy (GT) is a debilitating cause of lateral hip pain most prevalent in middle-age women [1]. Although pain and disability during stair climbing are typical features of GT [1] no studies have evaluated biomechanics during stair ascent in GT.
METHODS Three-dimensional gait analysis of a reciprocal step-up task (2 steps) was conducted on 35 asymptomatic controls (ASC) and 35 individuals with unilateral GT. Using a Vicon MX system, kinematic and kinetic data were calculated from skin marker triads and ground reaction forces from the first step, using inverse dynamics. Stance phase on the first step (symptomatic limb) was analysed during: (1) vertical thrust (0-50% stance) and (2) forward continuance (50-100% stance)[2].Normalized(Nm/BW.Ht%) peak external hip adduction (HADM), flexion, internal rotation moments and positive impulses were averaged over 3 trials, for 0-50 and 50-100% stance. Maximum hip adduction, flexion, internal rotation angles, contralateral pelvic drop, lateral pelvic translation and lateral trunk lean were quantified at: (1) foot contact (FC); (2) between FC and reciprocal toe off (RTO); and (3) RTO - 100% stance. ANOVA compared data between groups, and secondary analyses performed on the basis that multiple step-up strategies are possible [2].
RESULTS AND DISCUSSION The GT and ASC groups were comparable in age (54±8 vs 53±9 years) and sex (females=26). The GT group had a greater BMI (GT=26±4 kg/m2, ASC=24±3 kg/m2, P<0.05). Median (IQR) duration of GT symptoms was 18±28 months, and pain experienced over the past week was 4± 1 on an 11-point numeric-scale. Participants with GT exhibited a greater peak HADM moment and impulse during stair ascent (most apparent from 50-100% stance), greater internal rotation impulse during vertical thrust and greater contralateral trunk lean throughout stance (all P<0.05) (Fig.1). Three HADM waveforms were identified which contributed to large variability in the HADM during 50-100% stance (Fig.1). To investigate, a cluster analysis was performed using the dependent variable HADM positive impulse during 50-100% stance, and ensemble curves generated for each cluster (Fig.2a). Cluster-1 exhibited a low HADM impulse during 50-100% stance and Cluster-2 the highest impulse (Fig.2a,b). A significant association was found between group and cluster codes (Pearson’s chi square=7.0,P=0.03).The Newcombe-Wilson method identified GT as 4.5 times more likely to be in Cluster-2 (high HADM impulse) and less likely (0.3 times) in Cluster-1 (low HADM impulse); allocation to Cluster-2 increased relative risk of GT by 22%; Cluster-1 reduced risk by 44%. To compare kinematics between clusters (1-3) and groups (GT, ASC); a 3 x 2 ANOVA (post-hoc LSD)
Figure 1: Group averages (+/-SD) for kinematic and kinetic variables during stance phase of stair ascent for GT (red [light]) and control (black [dark]) participants
Figure 2a: Ensemble averages of Cluster-1 (black),-2(red) and -3 (grey) 2b: cluster centres (Nm.sec/BW.Ht(%))
was performed. Cluster-1 (ASC-dominant) demonstrated greater pelvic obliquity at foot contact than Clusters-2 (GT-dominant) (mean-difference 5.0˚, P<0.001) and -3
(even distribution GT/ASC)(mean-difference 2.9˚, P=0.01) Cluster-2 exhibited greater pelvic translation (foot placement (FP) closer to midline) than Cluster-1 at foot contact (mean-difference -15FP: 1 /
2 inter-ASIS%, P=0.03). A greater external HADM in those with GT during
stair ascent (established by two analyses) implies greater requirement for internal abductor moment generation by the hip abductor muscles, including the gluteus minimus and medius implicated in GT. This finding is consistent with findings in walking in this group [3], however a larger HADM may have greater clinical relevance for overload of the gluteal tendons and the development and/or perpetuation of GT, given (1) increased moment demands and hip range associated with stair ascent [2] and (2) kinematic patterns associated with GT (pelvic shift/trunk lean) identified here.
CONCLUSIONS Individuals with GT exhibit greater HADM and differences in frontal plane pelvic / trunk kinematics during stair ascent than ASCs. Longitudinal research is needed to evaluate whether these movement patterns contribute to the development of GT.
REFERENCES [1] Segal et al. Arch Phys Med 88: 988-92, 2007 [2] McFayden et al. J Biomech 21:733-44, 1988 [3] Allison et al. Clin Biomech 32: 56-63, 2016
10th
Australasian Biomechanics Conference, University of Melbourne, Australia, 4 – 6 Dec 2016
CHARACTERISATION OF LOWER LEG MUSCLE MORPHOLOGY AND FUNCTION: IMPLICATIONS FOR MEDIAL TIBIAL STRESS SYNDROME – WORK IN PROGRESS
Joshua Mattock1, Karen Mickle
2, and Julie R. Steele
1
1Biomechanics Research Laboratory, University of Wollongong, NSW, Australia
2Institute of Sport, Exercise & Active Living, College of Sport and Exercise Science, Victoria University, VIC, Australia
Email: [email protected]
INTRODUCTION Medial tibial stress syndrome (MTSS) is an overuse injury with a prevalence rate between 4-35% that predominately affects military personal and distance runners [1]. Imaging studies suggest bone stress is the most likely cause of MTSS as it is hypothesised that bony adaptations of the tibia are unable to keep pace with repetitive loading of the lower limb [1]. To date, however, research has failed to find a management strategy for MTSS that is more effective than prolonged rest, necessitating the need for further research to elucidate possible causative factors of the injury [2].
Several risk factors have been reported to contribute to the development of MTSS. These include female gender, previous history of MTSS, fewer years running experience, increased navicular drop, increased external hip rotation, a body mass index greater than 21 and lean lower leg girth [3]. Lean lower leg girth, however, is reported as a risk factor based solely upon measurements of overall lower leg circumference at its largest girth and skin fold measures [4, 5]. As a result there is a lack of evidence to describe the composition of lower leg musculature and how that contributes to changes in overall lower leg girth and the development of MTSS. Therefore, the purpose of this study is to identify differences in lower leg muscle morphology and function of individuals with and without MTSS symptoms, and to ascertain which factors contribute to the development of MTSS. METHODS Twenty-five individuals with a history of MTSS symptoms and 160 asymptomatic individuals will be recruited for this study. All participants will be distance runners, aged 18 years and older, who run an average of 30 km per week or are training for a long distance running event. After assessing his or her height and weight, each participant’s bone quality will be assessed using a Mini-Omni ultrasound bone sonometer (BeamMed Ltd, Israel). Muscle morphology of the tibialis anterior, peroneals, flexor digitorum longus, flexor halluces longus, medial gastrocnemius, lateral gastrocnemius and soleus will then be assessed using a B-mode ultrasound (SonoSite, Inc., Bothell, WA, USA). Lower leg function will be characterised using the knee-to-wall test to determine ankle range of motion, Foot Posture Index and a maximal voluntary contraction of the previously listed muscles. Participants will then complete a treadmill running protocol during which their neuromuscular activity will be quantified using a wireless system (2000 Hz) (Delsys Inc.,
Boston, USA). Kinematic data characterising running technique will be collected using an Optotrak Certus motion capture system (100 Hz) (Northern Digital Inc., Ontario, Canada) and plantar pressure distributions during running will be quantified using Pedar-X insoles (100 Hz) (Novelgmbh, Munich, Germany). Finally, each participant’s lower limb muscular endurance will be assessed using a maximal single leg heel raise protocol.
Once baseline data are collected for both symptomatic and asymptomatic individuals, the asymptomatic participants will be tracked longitudinally to assess any runners who develop MTSS over the course of the next 12 months. Descriptive statistics for the two groups will be calculated at baseline. If the data are normally distributed, independent samples t-tests will be conducted to identify any between group differences (p < 0.05). A regression analysis will then be used to determine which variables are likely to predict the development of MTSS, for the 160 participants who were followed longitudinally for 12 months. RESULTS AND DISCUSSION The results of this study will allow us to identify characteristics of individuals who develop MTSS symptoms and, in turn, identify modifiable risk factors that can be targeted in an attempt to prevent individuals developing this syndrome. ACKNOWLEDGEMENTS Funding for this study has been provided by the Australian Podiatry Education and Research Foundation. REFERENCES [1] Brukner P & Khan K, Brukner and Khan's clinical
sports medicine (4th ed.). McGraw-Hill, Sydney, 2012.
[2] Newman P et al. Journal of Sports Medicine, 4: 229-241, 2013.
[3] Reshef N & Guelich D R. Clinics in Sports Medicine, 31: 273-290, 2012.
[4] Bennell K L et al. Journal of Sports Medicine, 24: 810-818 1996.
[5] Burne S G et al. British Journal of Sports Medicine, 38: 441-445, 2004.
10th Australasian Biomechanics Conference, University of Melbourne, Australia, 4 – 6 Dec 2016
Does frontal plane knee motion influence osteoarthritis treatment outcomes? Exploratory analyses from the Intensive
Diet and Exercise for Arthritis (IDEA) trial
Michelle Hall1, Kim L Bennell1, Daniel P Beavers2, Tim V Wrigley1, Paul DeVita3 and Stephen P. Messier4 1 Centre for Health, Exercise and Sports Medicine, University of Melbourne, VIC, Australia
2 Division of Public Health Sciences, Wake Forest School of Medicine, Winston-‐Salem, NC, USA 3 Department of Kinesiology, College of Health and Human Performance, East Carolina University, Greenville, NC, USA
4Department of Health and Exercise Science, Wake Forest University, Winston-‐Salem, NC, USA [email protected]
INTRODUCTION Although diet and/or exercise interventions
provide pain relief and improvement in physical function for patients with knee osteoarthritis (OA) [1], tailoring interventions to patient-‐specific characteristics may enhance these outcomes. Patient-‐specific characteristics related to knee kinematics in the frontal knee plane during walking may influence treatment outcomes. Preliminary evidence suggests that frontal plane knee motion moderates pain following a 12-‐week exercise intervention in patients with knee OA [2]. A recent RCT comparing neuromuscular and quadriceps strengthening exercise found similar improvements in pain [3]. However, in exploratory sub-‐group analyses those with a visually-‐observed varus thrust obtained greater pain relief with neuromuscular exercise than with quadriceps strengthening [2] despite similar knee strength gains [3]. Varus thrust did not mediate physical function [2]. Peak varus knee angular velocity is related to a varus thrust assessed subjectively [4], and thus is of clinical relevance given that frontal plane motion can be assessed clinically by simple visual assessment. The aim of this study was to determine if baseline peak varus knee angular velocity was a predictor of change in pain and physical function subsequent to 18 month interventions of exercise and/or diet or exercise alone. METHODS
387 participants (65±6yrs; 33.6±3.7 kg/m2; male 24%) underwent 3D gait analysis at baseline. Frontal plane knee joint motion during walking was measured as peak varus angular velocity (i.e., varus thrust). Participants completed the Western Ontario and McMaster Universities Osteoarthritis Index (WOMAC)
questionnaire at baseline and follow-‐up. Linear regression was used to determine the association between baseline peak varus angular velocity (independent variable) and 18-‐month change in self-‐reported pain and function (dependent variables) for each intervention (exercise, diet, exercise + diet). RESULTS AND DISCUSSION
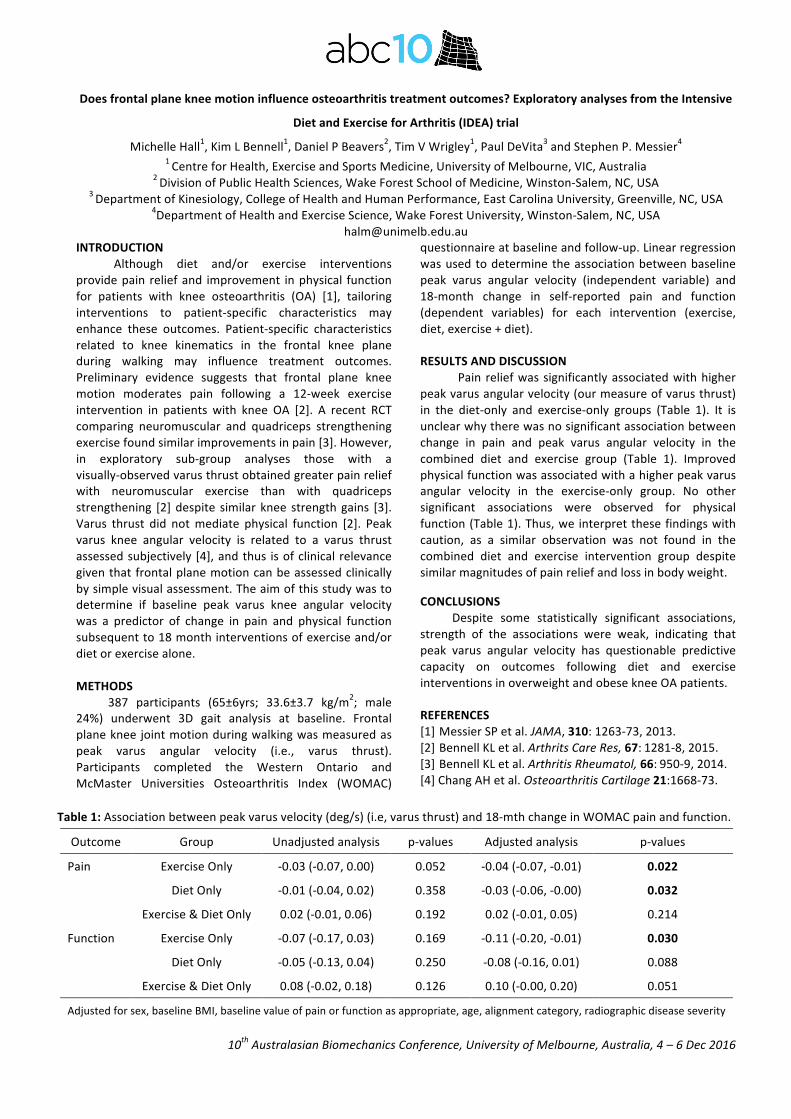
Pain relief was significantly associated with higher peak varus angular velocity (our measure of varus thrust) in the diet-‐only and exercise-‐only groups (Table 1). It is unclear why there was no significant association between change in pain and peak varus angular velocity in the combined diet and exercise group (Table 1). Improved physical function was associated with a higher peak varus angular velocity in the exercise-‐only group. No other significant associations were observed for physical function (Table 1). Thus, we interpret these findings with caution, as a similar observation was not found in the combined diet and exercise intervention group despite similar magnitudes of pain relief and loss in body weight. CONCLUSIONS
Despite some statistically significant associations, strength of the associations were weak, indicating that peak varus angular velocity has questionable predictive capacity on outcomes following diet and exercise interventions in overweight and obese knee OA patients. REFERENCES [1] Messier SP et al. JAMA, 310: 1263-‐73, 2013. [2] Bennell KL et al. Arthrits Care Res, 67: 1281-‐8, 2015. [3] Bennell KL et al. Arthritis Rheumatol, 66: 950-‐9, 2014. [4] Chang AH et al. Osteoarthritis Cartilage 21:1668-‐73.
Table 1: Association between peak varus velocity (deg/s) (i.e, varus thrust) and 18-‐mth change in WOMAC pain and function.
Outcome Group Unadjusted analysis p-‐values Adjusted analysis p-‐values
Pain Exercise Only -‐0.03 (-‐0.07, 0.00) 0.052 -‐0.04 (-‐0.07, -‐0.01) 0.022
Diet Only -‐0.01 (-‐0.04, 0.02) 0.358 -‐0.03 (-‐0.06, -‐0.00) 0.032
Exercise & Diet Only 0.02 (-‐0.01, 0.06) 0.192 0.02 (-‐0.01, 0.05) 0.214
Function Exercise Only -‐0.07 (-‐0.17, 0.03) 0.169 -‐0.11 (-‐0.20, -‐0.01) 0.030
Diet Only -‐0.05 (-‐0.13, 0.04) 0.250 -‐0.08 (-‐0.16, 0.01) 0.088
Exercise & Diet Only 0.08 (-‐0.02, 0.18) 0.126 0.10 (-‐0.00, 0.20) 0.051
Adjusted for sex, baseline BMI, baseline value of pain or function as appropriate, age, alignment category, radiographic disease severity

DAY 1 Sunday 4th December 2016 (continued) 11:00am - 12:30pm WORKSHOP PART 2: FROM MODELS TO DECISIONS:
Translating biomechanics research to the clinical setting Organisers: Morgan Sangeux (Murdoch Childrens Research Institute), Anna Murphy (Monash Health)
11:00am OBJECTIVES: DATA-INFORMED CLINICAL DECISIONS AND CLINICAL MEASUREMENTS Anna Murphy, Monash Health
11:15am DATA-DRIVEN MODEL TO IMPROVE DECISION-MAKING IN AFO PRESCRIPTION AND DESIGN FOR CHILDREN WITH CEREBRAL PALSY: A PRELIMINARY STUDY Julie Choisne, University of Auckland
11:27am HOW CAN THE GAIT PATTERNS OF CHILDREN WITH CHARCOT-MARIE-TOOTH DISEASE DETERMINE THE DESIGN REQUIREMENTS OF 3D PRINTED ANKLE FOOT ORTHOSES Elizabeth Wojciechowski, Sydney Children’s Hospitals Network
11:39am Panel discussion on data-driven clinical decisions
11:51am MEASURING PELVIC TILT IN FEMOROACETABULAR IMPINGEMENT USING AN ACCELEROMETER Joe Lynch, Australian National University
12:03pm TESTING THE TEKSCAN 9833E PRESSURE SENSOR SYSTEM FOR MEASUREMENT OF PRESSURE DISTRIBUTION DELIVERED BY LYMPHOEDEMA COMPRESSION SLEEVES Daniel Hageman, University of New South Wales
12:15pm CUSTOMISING OPENSIM MODELS USING THE MUSCULOSKELETAL ATLAS PROJECT Thor Besier, University of Auckland
12:30pm - 1:30pm Lunch
DATA-DRIVEN MODEL TO IMPROVE DECISION-MAKING IN AFO PRESCRIPTION AND DESIGN FOR CHILDREN WITH CEREBRAL PALSY: A PRELIMINARY STUDY
Julie Choisne1, Geoffrey Handsfield1, Nada Signal2, Denise Taylor2, Nichola Wilson3, Susan Stott3 and Thor Besier1 1 Auckland Bioengineering Institute, University of Auckland, Auckland, New Zealand
2 Health and Rehabilitation Research Institute, Auckland University of Technology, Auckland, New Zealand 3 Starship Children’s Hospital, Auckland District Health Board, Auckland, New Zealand
Corresponding author’s email: [email protected]
INTRODUCTION Ankle-foot orthoses (AFOs) are frequently prescribed to help children with cerebral palsy (CP) maintain independent mobility with the aim of providing a stable base of support, improving gait mechanics and reducing metabolic cost. However, the clinical outcomes from AFOs are variable due to differences in design, fitting, and patient pathology. Currently, prescription of AFOs relies on clinical assessments and observation of walking pattern. Consequently, the prescription and design of AFOs is subjective, depending heavily on the expertise and knowledge of the orthotist or presrcibing clinician and requires a process of trial and error.
3D gait analysis (3DGA) is state-of-the-art technique in the diagnosis of gait pathology in CP and is used to inform orthopaedic surgery, prescription of orthoses, and ongoing rehabilitation. To date, interpretation of 3DGA data is subjective and it is not clear if any combination of clinical assessment and 3DGA parameters can quantitatively inform the prescription and design of AFOs. Data-driven modelling approaches have the potential to reveal non-intuitive relationships between 3DGA, clinical measurements, and AFO design [1]. Previous data-driven modelling applied to CP determined traits associated with good surgical outcomes from large and complex data, providing support for the approach [2].
The aim of the study is to develop a bioengineering tool to inform decision-making and improve the process of prescription and design of AFOs for children with CP. METHODS The study consists of two steps: 1) Build a model based on retrospective data from >100 children with cerebral palsy that underwent 3DGA barefoot and with an existing orthosis prescription, 2) Evaluate the potential benefit of the model in prescribing AFOs by applying the model to a representative sample of patients that are not included in the training set.
Modelling: Support Vector Machine (SVM) is a powerful machine learning classification technique that we
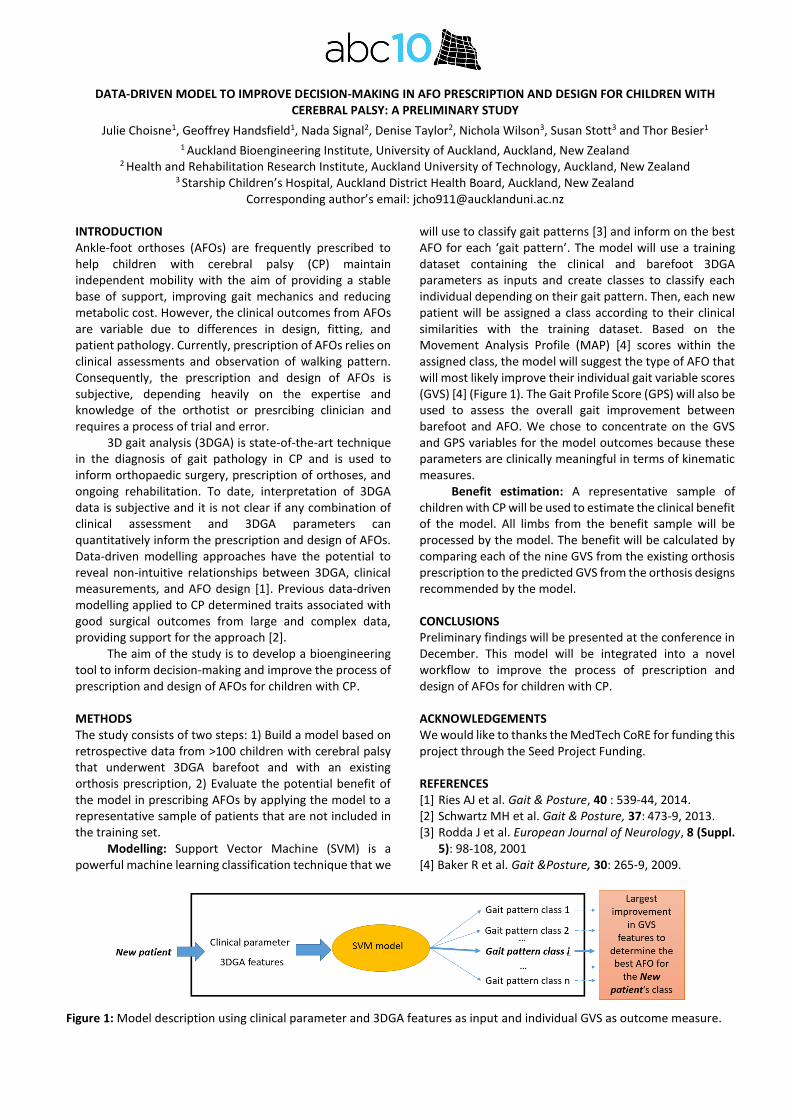
will use to classify gait patterns [3] and inform on the best AFO for each ‘gait pattern’. The model will use a training dataset containing the clinical and barefoot 3DGA parameters as inputs and create classes to classify each individual depending on their gait pattern. Then, each new patient will be assigned a class according to their clinical similarities with the training dataset. Based on the Movement Analysis Profile (MAP) [4] scores within the assigned class, the model will suggest the type of AFO that will most likely improve their individual gait variable scores (GVS) [4] (Figure 1). The Gait Profile Score (GPS) will also be used to assess the overall gait improvement between barefoot and AFO. We chose to concentrate on the GVS and GPS variables for the model outcomes because these parameters are clinically meaningful in terms of kinematic measures.
Benefit estimation: A representative sample of children with CP will be used to estimate the clinical benefit of the model. All limbs from the benefit sample will be processed by the model. The benefit will be calculated by comparing each of the nine GVS from the existing orthosis prescription to the predicted GVS from the orthosis designs recommended by the model. CONCLUSIONS Preliminary findings will be presented at the conference in December. This model will be integrated into a novel workflow to improve the process of prescription and design of AFOs for children with CP. ACKNOWLEDGEMENTS We would like to thanks the MedTech CoRE for funding this project through the Seed Project Funding. REFERENCES [1] Ries AJ et al. Gait & Posture, 40 : 539-44, 2014. [2] Schwartz MH et al. Gait & Posture, 37: 473-9, 2013. [3] Rodda J et al. European Journal of Neurology, 8 (Suppl.
5): 98-108, 2001 [4] Baker R et al. Gait &Posture, 30: 265-9, 2009.
Figure 1: Model description using clinical parameter and 3DGA features as input and individual GVS as outcome measure.
10th
Australasian Biomechanics Conference, University of Melbourne, Australia, 4 – 6 Dec 2016
HOW CAN THE GAIT PATTERNS OF CHILDREN WITH CHARCOT-MARIE-TOOTH DISEASE DETERMINE THE DESIGN REQUIREMENTS OF 3D PRINTED ANKLE FOOT ORTHOSES
Elizabeth Wojciechowski1, Sean Hogan
2, David Little
2, Manoj Menzes
2 and Joshua Burns
1,3
1 Paediatric Gait Analysis Service of New South Wales, Sydney Children’s Hospital Network, Australia
2The Children’s Hospital at Westmead, New South Wales, Australia
3Faculty of Health Sciences, The University of Sydney, New South Wales, Australia
INTRODUCTION The most common gait abnormalities reported in children with Charcot-Marie-Tooth disease (CMT) include foot-drop, reduced ankle push-off and increase knee and hip flexion or ‘steggage’ gait for swing clearance. However, several other deviations at the ankle and related compensatory mechanisms have been reported [1]. This suggests that children with CMT do no fit a single gait profile and may require more personalised orthotic devices.
Ankle-foot orthoses (AFOs) are commonly prescribed orthoses for children with CMT. AFOs are usually handmade by plaster cast followed by thermoplastic mouldlng. This traditional approach provides limited design options, can be costly, with long outpatient wait times. 3D printing, also known as additve manufacturing, has the potential to transform the way AFOs are prescribe, designed and manufactured.
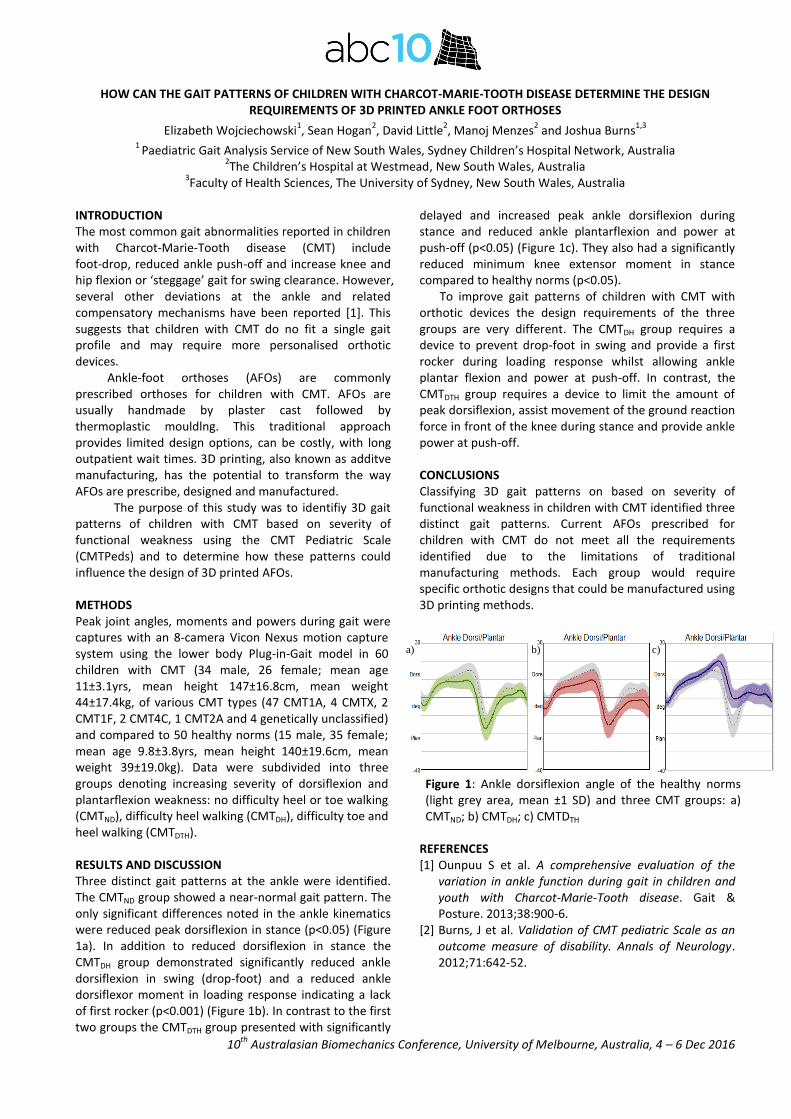
The purpose of this study was to identifiy 3D gait patterns of children with CMT based on severity of functional weakness using the CMT Pediatric Scale (CMTPeds) and to determine how these patterns could influence the design of 3D printed AFOs. METHODS Peak joint angles, moments and powers during gait were captures with an 8-camera Vicon Nexus motion capture system using the lower body Plug-in-Gait model in 60 children with CMT (34 male, 26 female; mean age 11±3.1yrs, mean height 147±16.8cm, mean weight 44±17.4kg, of various CMT types (47 CMT1A, 4 CMTX, 2 CMT1F, 2 CMT4C, 1 CMT2A and 4 genetically unclassified) and compared to 50 healthy norms (15 male, 35 female; mean age 9.8±3.8yrs, mean height 140±19.6cm, mean weight 39±19.0kg). Data were subdivided into three groups denoting increasing severity of dorsiflexion and plantarflexion weakness: no difficulty heel or toe walking (CMTND), difficulty heel walking (CMTDH), difficulty toe and heel walking (CMTDTH). RESULTS AND DISCUSSION Three distinct gait patterns at the ankle were identified. The CMTND group showed a near-normal gait pattern. The only significant differences noted in the ankle kinematics were reduced peak dorsiflexion in stance (p<0.05) (Figure 1a). In addition to reduced dorsiflexion in stance the CMTDH group demonstrated significantly reduced ankle dorsiflexion in swing (drop-foot) and a reduced ankle dorsiflexor moment in loading response indicating a lack of first rocker (p<0.001) (Figure 1b). In contrast to the first two groups the CMTDTH group presented with significantly
delayed and increased peak ankle dorsiflexion during stance and reduced ankle plantarflexion and power at push-off (p<0.05) (Figure 1c). They also had a significantly reduced minimum knee extensor moment in stance compared to healthy norms (p<0.05). To improve gait patterns of children with CMT with orthotic devices the design requirements of the three groups are very different. The CMTDH group requires a device to prevent drop-foot in swing and provide a first rocker during loading response whilst allowing ankle plantar flexion and power at push-off. In contrast, the CMTDTH group requires a device to limit the amount of peak dorsiflexion, assist movement of the ground reaction force in front of the knee during stance and provide ankle power at push-off. CONCLUSIONS Classifying 3D gait patterns on based on severity of functional weakness in children with CMT identified three distinct gait patterns. Current AFOs prescribed for children with CMT do not meet all the requirements identified due to the limitations of traditional manufacturing methods. Each group would require specific orthotic designs that could be manufactured using 3D printing methods.
REFERENCES [1] Ounpuu S et al. A comprehensive evaluation of the
variation in ankle function during gait in children and youth with Charcot-Marie-Tooth disease. Gait & Posture. 2013;38:900-6.
[2] Burns, J et al. Validation of CMT pediatric Scale as an outcome measure of disability. Annals of Neurology. 2012;71:642-52.
Figure 1: Ankle dorsiflexion angle of the healthy norms (light grey area, mean ±1 SD) and three CMT groups: a) CMTND; b) CMTDH; c) CMTDTH
a) b) c)
10th
Australasian Biomechanics Conference, University of Melbourne, Australia, 4 – 6 Dec 2016
Measuring pelvic tilt in femoroacetabular impingement using an accelerometer
Tom Ward1, Matthew Lim
2, Joe Lynch
1, Diana Perriman
1,2 and Paul Smith
1,2
1 Trauma and Orthopaedic Research Unit, Canberra Hospital, Australia 2
Australian National University Medical School, Canberra, Australia
INTRODUCTION Femoroacetabular impingement (FAI) is considered a common mechanism leading to early cartilage and labral damage in the hip joint [1]. FAI encompasses structural deformities on the femoral neck (cam lesions), acetabular rim (pincer lesions) or a mixed pattern of these lesions. While arthroscopic surgery is increasingly being employed to resect impinging bone, it may be possible to reduce the incidence and severity of impingement by optimising non-operative measures, such as by altering pelvic tilt to avoid impingement.
Pelvic tilt has a significant effect on the acetabulum’s coverage of the femoral head [2]. Anterior tilt of the pelvis is likely to exacerabate anterior overcoverage and subsequent impingement, while posterior tilt is likely to reduce it.
Currently, little is known regarding how pelvic tilt changes during daily activities, such as lying, standing and sitting in FAI subjects. Standard methods to measure pelvic tilt include using lateral xrays, which have the disadvantage of significant radiation exposure to a young cohort, or using camera-based systems with skin markers, which have the disadvantage of skin artefact.
In this study, the feasibility of using a skin-mounted accelerometer to measure pelvic tilt was investigated and implemented in an FAI cohort. METHODS 18 subjects diagnosed with FAI on clinical and radiographic criteria, who were awaiting arthroscopic surgery, were recruited, along with 18 age and sex matched normal subjects with no known hip pathology. Each subject had a triaxial accelerometer/ gyroscope/ compass (MPU-9125, Invensence) mounted on the skin between the posterior superior iliac spines, and the signal was transmitted via bluetooth to a PC. Inclination of the accerometer in the sagittal plane was measured during standing, lying, sitting on the edge of a bed and sitting on a chair. The relationship between the inclination of the accelerometer and the anterior pelvic plane was calibrated using a custom rig with three plastic limbs which were pressed against three bony landmarks defining the anterior pelvic plane: each ASIS and the pubic symphysis. An inclinometer (Dualer IQ digital, JTech Biomedical) attached to the rig enabled the tilt of the accelerometer to be referenced to the anterior pelvic plane.
The accuracy of this method was validated in 10 subjects against CT scans. With each subject lying down on the CT gantry, pelvic tilt was measured using the accelerometer, and compared with pelvic tilt measured directly from bony landmarks (ASIS and pubic symphysis) identified on CT. RESULTS AND DISCUSSION Mean differences between the pelvic tilt measured using the accelerometer and CT was -4.8
o (SD 5.3
o). The main
reason for this difference was due to greater thickness in soft tissue covering the pubic symphysis compared to the ASIS.
Early results for the first 20 recruited FAI and normal subjects revealed mean pelvic tilt were 4.0
o (SD
4.5o) and 4.1
o (SD 9.6
o) while lying and standing,
respectively, in the FAI group, and -5.6o (SD 2.8
o) and -1.8
o
(SD 0.6o) in the normal group. Mean pelvic tilt while
sitting on a hard backed chair and on the side of a bed were -17.4
o (SD 16
o) and -12.8
o (SD 13.9
o), respectively, in
the FAI group and -36.8 (SD 1.5o) and -24.1
o (SD 2.5
o) in
the normal group. This trend, while not statistically significant due to small normal cohort, may suggest that FAI subjects are more anteriorly tilted when sitting on a chair, which increases the chance of impingement between the anterior acetabular rim and femoral neck.
CONCLUSIONS Measuring pelvic tilt without irradiating young patients is desirable, although the CT validation of the proposed method indicated a systematic error of almost 5 degrees compared with direct CT measurements. This study only validated the method with subjects in a supine position, and made the assumption that the relationship between the skin mounted accelerometer and underlying bone remained constant as the pelvis tilted when sitting, which requires further investigation. Early clinical results suggest a trend towards increased anterior tilt in FAI subjects when sitting, which may exacerbate impingement. REFERENCES [1] Ganz, R., et al., Femoroacetabular impingement: a cause for osteoarthritis of the hip. Clin Orthop Relat Res, 2003(417): p 112-20. [2] DiGioia et al, Functional Pelvic Orientation Measured from Lateral Standing and Sitting Radiograph, CORR, 2006 (453): p 272-276
10th
Australasian Biomechanics Conference, University of Melbourne, Australia, 4 – 6 Dec 2016
TESTING THE TEKSCAN 9833E PRESSURE SENSOR SYSTEM FOR MEASUREMENT OF PRESSURE DISTRIBUTION DELIVERED BY LYMPHOEDEMA COMPRESSION SLEEVES
Daniel Hageman1, Karen Virdi
1, Melissa Knothe Tate
1
1Dept. Biomedical Engineering, University of New South Wales, NSW, Australia
INTRODUCTION Up to 20% of breast cancer patients will be diagnosed with lateral lymphoedema subsequent to axillary lymph node resection for prevention of metastasis. Lymphoedema presents itself as a build-up of lymphatic fluid and swelling of lateral tissues, which can result in tissue hardening, loss of function, and psychosocial consequences over time [1]. Currently, there is no cure for lymphoedema. A range of empirical treatments are used to prevent and/or mitigate the symptoms of lymphoedema, from compression sleeves to lymph drainage massage. The unknown etiology of lymphoedema combined with lack of efficacy testing and protocols for side-by-side comparison of treatment modalities confounds the development of ‘best standards’ for lymphoedema treatment. As a first step toward testing efficacy of pressure application via compression sleeves for management of lymphoedema, this study aims to quantitatively measure the pressure distribution delivered by compression sleeves. METHODS Our approach was to implement a new pressure sensing technology that utilises sensor electrodes within a flexible polyester sheet (Tekscan Inc.) to measure pressure gradients between the arm and compression sleeve. First, we tested the efficacy of the sensor itself within target pressure ranges. A 2-point calibration was implemented on the Tekscan 9833E sensor at a range of 10—55 mmHg, as this is the standard pressure range for all classes of lymphoedema compression sleeves. A set area (45.39 cm
2) of delivered force was applied to the centre of the
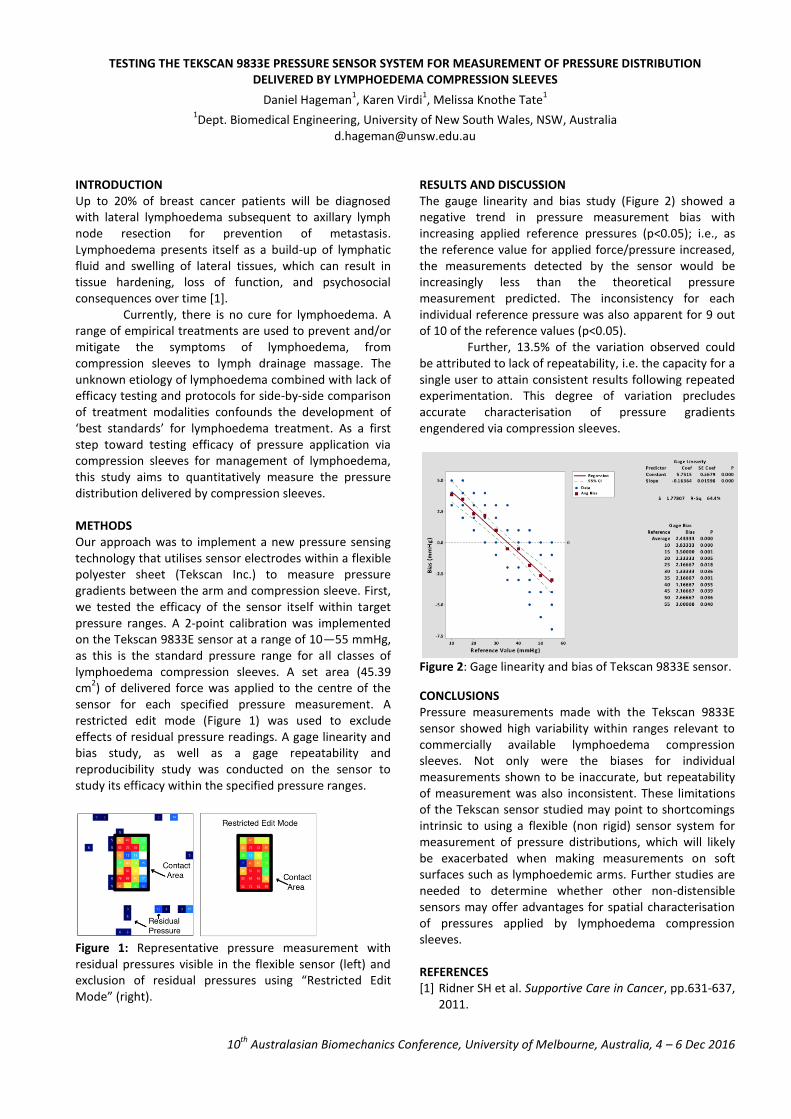
sensor for each specified pressure measurement. A restricted edit mode (Figure 1) was used to exclude effects of residual pressure readings. A gage linearity and bias study, as well as a gage repeatability and reproducibility study was conducted on the sensor to study its efficacy within the specified pressure ranges.
Figure 1: Representative pressure measurement with residual pressures visible in the flexible sensor (left) and exclusion of residual pressures using “Restricted Edit Mode” (right).
RESULTS AND DISCUSSION The gauge linearity and bias study (Figure 2) showed a negative trend in pressure measurement bias with increasing applied reference pressures (p<0.05); i.e., as the reference value for applied force/pressure increased, the measurements detected by the sensor would be increasingly less than the theoretical pressure measurement predicted. The inconsistency for each individual reference pressure was also apparent for 9 out of 10 of the reference values (p<0.05). Further, 13.5% of the variation observed could be attributed to lack of repeatability, i.e. the capacity for a single user to attain consistent results following repeated experimentation. This degree of variation precludes accurate characterisation of pressure gradients engendered via compression sleeves.
Figure 2: Gage linearity and bias of Tekscan 9833E sensor.
CONCLUSIONS Pressure measurements made with the Tekscan 9833E sensor showed high variability within ranges relevant to commercially available lymphoedema compression sleeves. Not only were the biases for individual measurements shown to be inaccurate, but repeatability of measurement was also inconsistent. These limitations of the Tekscan sensor studied may point to shortcomings intrinsic to using a flexible (non rigid) sensor system for measurement of pressure distributions, which will likely be exacerbated when making measurements on soft surfaces such as lymphoedemic arms. Further studies are needed to determine whether other non-distensible sensors may offer advantages for spatial characterisation of pressures applied by lymphoedema compression sleeves. REFERENCES [1] Ridner SH et al. Supportive Care in Cancer, pp.631-637,
2011.

10thAustralasianBiomechanicsConference,UniversityofMelbourne,Australia,4–6Dec2016
CUSTOMISINGOPENSIMMODELSUSINGTHEMUSCULOSKELETALATLASPROJECT
ThorBesier1,2,GeoffreyHandsfield1,ThorbenPauli1,AlexCarleton1,MarkTaylor3andJuZhang11AucklandBioengineeringInstitute,UniversityofAuckland,Auckland,NewZealand2DepartmentofEngineeringScience,UniversityofAuckland,Auckland,NewZealand
3SchoolofComputerScience,FlindersUniversity,Adelaide,AustraliaCorrespondingauthor’semail:[email protected]
INTRODUCTIONThe clinical impact of musculoskeletal modelling iscurrently limited, due to the difficulty in generatingsubject-specific parameters, such as muscle-tendonproperties and anatomical geometry [1]. Accuraterepresentationofbonegeometry iscritical forpredictingmuscle and joint contact forces, as it influences themuscles’length,momentarm,andlineofaction.Customising musculoskeletal models from medicalimaging data is time-consuming and not feasible forroutine clinical use. It is more common to use simplelength scaling of a template model to match a set ofanatomical landmarks (i.e. retroreflectivemarkersplacedonbodysegments)andthus,generatea‘patient-specific’model.However,linear,isotropicscalingdoesnotcapturevariationinboneshapeandthescalingprocesscanresultinbonedimensionsthatarenon-physiological. Here we illustrate the use of an articulated statisticalshapemodeltocustomisethelowerlimbbones,muscles,and joints of an OpenSim musculoskeletal model. Themethod is developed within the Musculoskeletal AtlasProject(MAP),aPython-basedopen-sourceframework.
METHODSA combined statistical shapemodel of thepelvis, femur,patella,tibia,andfibulawascreatedfromatrainingsetof26left lowerlimbbonesmanuallysegmentedCTimages.Muscleand ligamentattachmentswere identifiedfromaSOMSO model (www.somso.de, Sonneberg, Germany)andembeddedontotheparametricbonemeshes(Figure1a). Anatomical landmarkswere also embedded in eachbone’sreferencemeshtogenerateconsistentanatomicalcoordinateframes(Figure1b). Customisation was performed via an optimisationprocedurethatadjustedtheprincipalcomponentsoftheshape model (n=5), along with translation of the pelvis(3DOF) and rotational degrees of freedom of the hip(3DOF) and knee (2DOF) [2]. The hip joint centre wasconstrainedtofitwithintheacetabulumofthepelvisand
thekneejointaxiswasalteredtoensurecontactbetweenthe femur and tibia throughout knee flexion. Musclevolumes were scaled by subject height*mass using theregressionprovidedbyHandsfieldetal.[3].Tendonslacklengthswerethenoptimisedtoensurethatmusclefibreswereontheplateauoftheforce-lengthrelationship.We tested the ability of the model-based shapeestimation to predict lower limb geometry using only 7motion capture markers. A leave-one-out analysis wasused to determine the accuracy of the predicted bonegeometrycomparedtosegmentedmodels.
RESULTSANDDISCUSSIONShape model scaling of lower limb geometry using 7markerswasaccurate to<5mmRMSerror.Comparedtolinearisotropicscaling,ourmethodreducedsurfaceerrorestimation (p<0.001) and provided a feasible set ofmuscle-tendonparametersthatwereconsistentwiththescaledbonegeometry.
CONCLUSIONSWe have presented an articulated shape model tocustomisea lower limbOpenSimmusculoskeletalmodel.The method has been implemented in an open-sourcesoftware framework, The Musculoskeletal Atlas Project,whichcanbeeasilysharedandprovidesuserswithaccesstoOpenSim’sPythonAPI.
ACKNOWLEDGEMENTSWe would like to thank the US Food and DrugAdministration(HHSF223201310119C)andtheAustralianResearch Council (LP130100122) for their financialsupport. We would also like to thank the VictorianInstituteofForensicMedicine(VIFM)forprovidingtheCTimagestogeneratethestatisticalshapemodels.
REFERENCES[1]BlemkerSetal.JMRI,25:441-51,2007.[2]Zhangetal.CMBBE,Accepted,2016.[3]Handsfieldetal.JBiomech,47:631-638,2014.
Figure1:Parametricmeshoffemur(a)illustratingregionsofmuscleattachmentsitesand(b)articulatedlowerlimbmodel.MAPClientinterfaceshowingscalingofmodeltomatchmotioncapturemarkers.

DAY 1 Sunday 4th December 2016 (continued) 1:30pm - 2:00pm OPENING CEREMONY at the Woodward Conference Centre
Moderated by Dr. Tam Nguyen, St Vincent’s Hospital Hon. Frank McGuire, Parlimentary Secretary for Medical Research; A/Prof. Peter Pivonka, ABC10 Chair & Dr. Elizabeth Clarke, ANZSB President
2:00pm - 4:00pm
Session 1 · TISSUE ENGINEERING Chairs: Peter Pivonka (University of Melbourne), Peter Lee (University of Melbourne)
2:00pm KEYNOTE SPEAKER
ADVANCED LIMB RECONSTRUCTION: PIECING IT TOGETHER Professor Peter Choong, University of Melbourne
2:30pm INVITED SPEAKER
EXPERIMENTAL AND NUMERICAL INVESTIGATION OF STRAIN-RATE DEPENDENT MECHANICAL PROPERTIES OF SINGLE LIVING CELLS YuanTong Gu, Queensland University of Technology
2:45pm OPTIMIZED SELECTION OF 3D CERAMIC SCAFFOLDS FOR LARGE SEGMENTAL BONE DEFECTS BASED ON MECHANICAL AND FLUID DYNAMICAL CHARACTERIZATION - APPLICATION TO BAGHDADITE SCAFFOLDS Romane Blanchard, University of Melbourne
3:00pm MECHANICAL PROPERTIES OF LATTICE STRUCTURES FOR IMPLANT APPLICATIONS MANUFACTURED BY SELECTIVE LASER MELTING Martin Leary, RMIT University
3:15pm TAILORING THE MECHANICAL PROPERTIES OF HYDROGELS FOR CARTILAGE TISSUE ENGINEERING Cathal O'Connell, University of Wollongong
3:30pm DAMAGE AND FRACTURE EVALUATION OF BIOLOGICAL SOFT TISSUE BY BALL INDENTATION TECHNIQUE Atsushi Sakuma, Kyoto Institute of Technology
3:45pm EXPERIMENTAL AND NUMERICAL INVESTIGATIONS OF FRACTURE BEHAVIORS OF CERAMIC TISSUE SCAFFOLDS Ali Entezari, University of Sydney
4:00pm - 4:30pm Afternoon Tea
10thAustralasianBiomechanicsConference,UniversityofMelbourne,Australia,4–6Dec2016
ADVANCEDLIMBRECONSSTRUCION–PIECINGITTOGETHERPeterChoong
StVincent’sDepartmentofSurgery,UniversityofMelbourne,VIC,Australia StVincent’sHospital,DepartmentofOrthopaedics,VIC,Australia
Bone&SofttissuesarcomaService,PeterMacCallumCancerCentre,VICAustralia
Musculoskeletal disorders are globally the highest causeof life years lost through disability after mental healthdisorders.Injury,degeneration,deformityandmalignancyare themost importantcontributors to thisdisability.St.Vincent’s Hospital Melbourne is the designated Statecenter for arthroplasty and is a National referral centerfor the treatment of bone and soft tissue malignancies.ThesetwoimportantservicesunderpintheMSKresearchprogram at St. Vincent’swhich focuses on (i) preventingosteoarthritis, (ii) improving outcomes after jointreplacement surgery, and (iii) returning function afterlimb amputation through advanced reconstructivetechniques.The MSK research program at St. Vincent’s HospitalMelbourne isdrivenbyamultidisciplinaryapproach thatbrings together a coalition of cell biologists, polymerscientists, metallurgists, biomedical engineers andsurgeons into an arena that combines a number ofplatform technologies including stem cell biology,biomaterials, advanced bio-fabrication (including 3Dprinting and electro-spinning), additive manufacturing,mechano-biologyandadvancedmedicalimaging. The products of such a research endeavour includecartilage, bone, osteochondral, ligamentous andtendinous devices. Other outcomes includepatient-specific implants, specialized implants thatactasvehiclesfordrugdelivery,dissolvable/degradabledevices,
enhanced fixation of metallic devices andimage-guided/robotassistedsurgicaltechniques.Thelongtermvisionexploresthepossibilityofrebuildinglostlimbsand manufacturing same-day surgery just-in-timeimplants. By leveraging advances in technology, and connectingscientists with clinicians at the coal face of activity, thisprogram of research aims to drive translation towardsproducing clinically and cost-effective solutions for theincreasing burden of MSK disorders. The assembly ofexpert collaborators (Department of Orthopaedics andSurgery, St. Vincent’s Hospital; Intelligent PolymerResearchInstittute,UniversityofWollongong;Aerospace,Mechanical and Manufacturing Engineering, RoyalMelbourne Institute of Technology; Mechanical andBiomedicalEngineering,UniversityofMelbourne;andtheFaculty of Science, Technology and Engineering,Swinburne Technical University, and their networks)linked with St. Vincent’s through theBioFab3D@Aikenhead Centre for Medical Discoverycreates a unique opportunity for industry to establish aknowledgead research resource thatwill lead to furtheradvances and commercialization of implantable andapplicable devices, and for patients to receive themostcutting edge advances when scientist and clinicianscollide.

INVESTIGATING THE EFFECT OF NANOPARTICLE UPTAKE ON THE ADHESION PROPERTY OF HUMAN CELL Md Alim Iftekhar Rasel1, Trung Dung Nguyen 2, YuanTong Gu1,
1 School of Chemistry, Physics and Mechanical Engineering, Queensland University of Technology, Brisbane, QLD, Australia 2 Dept. of Aerospace and Mechanical Engineering, College of Engineering, University of Notre Dame, Notre Dame, IN
46556
INTRODUCTION As a potential biomaterial for medical engineering, boron nitride nanoparticle (BN NP) and Hydroxylapatite (HAP) have drawn significant interest. Their superior physcial and chemical properties give them an edge over other nanoparticles [1-2]. However, there are limited studies investigaing effect of nanoparticles uptake on the physical properties of cells. For successfull utilization of nanoparticles in biomedical engineering applications, normal cellular function as well as mechanical integrity have to be retained. The ability of cells to ahere to its subtrate is a crucial feature of human cells. A number of important cellular activities such as cell orientaion, motility, morphogenesis, mitosis, embroyogebesis etc. depends on cells ability to adhere to neighbouring cells [3]. In this study, we investigate the effect of BN NP and HAP uptake on the adhesion property of human bone marrow stem cells using Atomic Forced Microscopy (AFM). METHODS The cells were cultured in proper environment (using Dulbecco’s Modified Eagle’s Medium, incubated in 37°C with 6% CO2) for 24 h . They were then further cultured with the nanoparticles (BN NP and HAP) with varying concentrations for 24h. Finally they were washed in PBS and tested in AFM.
In AFM, a flexible cantilever of microscopic dimension can be used to displace samples from the substrate and record the deflection. Taking advantage of this zhang et al. developed a method to quantify the detachment force of bacteria [4]. In this study, a similar approach is taken to quantify the lateral detachment force (adhesion property) of human bone marrow stem cells. The ACSTG-20 with a spring constant of 7.8 N/m was used as the cantilever which was supplied by AppNano. The AFM cantilever was placed near to the cell periphery (at the centre) by lateral and vertical movement of the cantilever. Once the cantilever is in its proper place, the cell was scanned in contact mode. While scanning, the cell is detached from the substrate and the deflection is recorded. From the deflection curve, the required lateral force is quantified (details in ref [2]).
RESULTS AND DISCUSSION Initial results show, for a concentration of 50 µg/ml, the adhesion force of cells increases over time for both BN NP
and HAP. This means, cells are happily growing and the nanoparticles do not have any impact on the adhesion force. However, once the concentration is increased to 100 µg/ml, the adhesion force of cells seems to decrease significantly. The nanoparticle uptake seems to have a strong impact on the adhesion property of the cells. Further increase of the concentration causes the cells to die and they simply detach from the substrate and starts floating in the medium.
This makes it clear that both BN NP and HAP have significant impact on the adhesion property of the human bone marrow stem cells. Therefore, researchers must be very careful while choosing the appropriate nanoparticle and their quantity in future nano engineering applications.
Figure 1: Lateral detachment force of human bone marrow stem cells after being cultured with BN NP and HAP for 24h. CONCLUSIONS A noble method is developed to quantify the adhesion property of cells after being cultured with nanoparticles (BN NP and HAP). The method is an alternate way of evaluating biological materials and their mechanical safety. Results confirm the effect of both BN NP and HAP uptake on the adhesion property of tested cells. Further study is needed to identify the reasons behind the adhesion force reduction and unravel the underlying mechanism. ACKNOWLEDGEMENTS Acknowledgments are optional. REFERENCES [1] Rasel M et al. J Nanopart Res, 17. 1-13, 2015. [2] Motskin M et al. Biomaterials, 30. 3307-17, 2009 [3] Sagvolden G et al. P Natl Acad Sci, 96: 471-76,1999. [4] Zhang T et al. Ultramicroscopy, 111: 131-9, 2011.
OPTIMIZED SELECTION OF 3D CERAMIC SCAFFOLDS FOR LARGE SEGMENTAL BONE DEFECTS BASED ON MECHANICAL
AND FLUID DYNAMICAL CHARACTERIZATION – APPLICATION TO BAGHDADITE SCAFFOLDS
Romane Blanchard1, Christian Daish1, Isman Roohani2, Hala Zreiqat2, Dalton Harvie3 and Peter Pivonka1 1 St Vincent’s Department of Surgery, The University of Melbourne, VIC, Australia
2 Biomaterials and Tissue Engineering Research Unit, University of Sydney, NSW, Australia 3Department of Chemical Engineering, The University of Melbourne, VIC, Australia
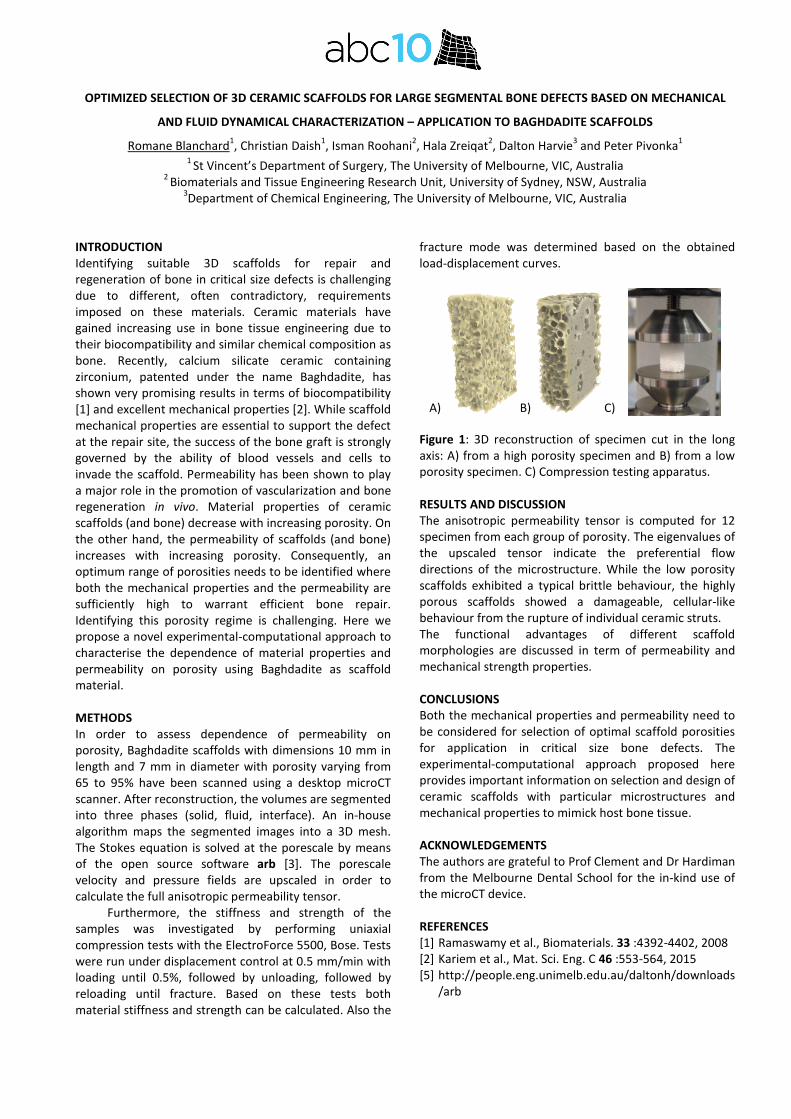
INTRODUCTION Identifying suitable 3D scaffolds for repair and regeneration of bone in critical size defects is challenging due to different, often contradictory, requirements imposed on these materials. Ceramic materials have gained increasing use in bone tissue engineering due to their biocompatibility and similar chemical composition as bone. Recently, calcium silicate ceramic containing zirconium, patented under the name Baghdadite, has shown very promising results in terms of biocompatibility [1] and excellent mechanical properties [2]. While scaffold mechanical properties are essential to support the defect at the repair site, the success of the bone graft is strongly governed by the ability of blood vessels and cells to invade the scaffold. Permeability has been shown to play a major role in the promotion of vascularization and bone regeneration in vivo. Material properties of ceramic scaffolds (and bone) decrease with increasing porosity. On the other hand, the permeability of scaffolds (and bone) increases with increasing porosity. Consequently, an optimum range of porosities needs to be identified where both the mechanical properties and the permeability are sufficiently high to warrant efficient bone repair. Identifying this porosity regime is challenging. Here we propose a novel experimental-computational approach to characterise the dependence of material properties and permeability on porosity using Baghdadite as scaffold material. METHODS In order to assess dependence of permeability on porosity, Baghdadite scaffolds with dimensions 10 mm in length and 7 mm in diameter with porosity varying from 65 to 95% have been scanned using a desktop microCT scanner. After reconstruction, the volumes are segmented into three phases (solid, fluid, interface). An in-house algorithm maps the segmented images into a 3D mesh. The Stokes equation is solved at the porescale by means of the open source software arb [3]. The porescale velocity and pressure fields are upscaled in order to calculate the full anisotropic permeability tensor.
Furthermore, the stiffness and strength of the samples was investigated by performing uniaxial compression tests with the ElectroForce 5500, Bose. Tests were run under displacement control at 0.5 mm/min with loading until 0.5%, followed by unloading, followed by reloading until fracture. Based on these tests both material stiffness and strength can be calculated. Also the
fracture mode was determined based on the obtained load-displacement curves.
Figure 1: 3D reconstruction of specimen cut in the long axis: A) from a high porosity specimen and B) from a low porosity specimen. C) Compression testing apparatus. RESULTS AND DISCUSSION The anisotropic permeability tensor is computed for 12 specimen from each group of porosity. The eigenvalues of the upscaled tensor indicate the preferential flow directions of the microstructure. While the low porosity scaffolds exhibited a typical brittle behaviour, the highly porous scaffolds showed a damageable, cellular-like behaviour from the rupture of individual ceramic struts. The functional advantages of different scaffold morphologies are discussed in term of permeability and mechanical strength properties. CONCLUSIONS Both the mechanical properties and permeability need to be considered for selection of optimal scaffold porosities for application in critical size bone defects. The experimental-computational approach proposed here provides important information on selection and design of ceramic scaffolds with particular microstructures and mechanical properties to mimick host bone tissue. ACKNOWLEDGEMENTS The authors are grateful to Prof Clement and Dr Hardiman from the Melbourne Dental School for the in-kind use of the microCT device. REFERENCES [1] Ramaswamy et al., Biomaterials. 33 :4392-4402, 2008 [2] Kariem et al., Mat. Sci. Eng. C 46 :553-564, 2015 [5] http://people.eng.unimelb.edu.au/daltonh/downloads
/arb
A) B) C)

MECHANICALPROPERTIESOFLATTICESTRUCTURESFORIMPLANTAPPLICATIONSMANUFACTUREDBYSELECTIVELASERMELTING
MaciejMazur1,MartinLeary1,PeterPivonka2,MilanBrandt1,1RMITCentreforAdditiveManufacturing,RMITUniversity,VIC,Australia
2StVincent’sDepartmentofSurgery,UniversityofMelbourne,VIC,AustraliaINTRODUCTIONReplacementofbonetissuewithmetalimplantprosthesisisacommonsurgicalprocedure for treatingbonetraumaorillnesssuchasosteosarcoma.Theinvasivenatureofsurgerywithconventionalimplantsimposesmany limitations, including: long hospital stays,postoperativepain,andpost-surgerycomplications[1].Common post-surgery complications are associatedwithimplant loosening attributable to standard implantlimitationsin:matchingbonemechanicalproperties;bone-implant integration due to limited bone ingrowth;andnot replicatingoriginal bone geometry [2].Amismatch between the implant and bonemechanicalproperties (particularly stiffness) is especially problematicas itcan leadtothephenomenonofstressshielding(i.e.,transfer of mechanical loads from bone regions to theimplant)andsubsequentboneweakeningduetothebone adaptation characteristic of Wolff’s law [3]. Theabilitytoaddressthislimitationbycontrollingthestiffness of standard solid metal implants is limited byconstraints associated with conventional manufacturing.However,emergingAdditiveManufacturing(AM)techniques such as Selective Laser Melting (SLM) canenable customisation of complex implants based oncellular lattice structures optimised to matchpatient-specific bone geometry and stiffness; potentiallyavoiding stress shielding by tuning implant stiffness. Themechanical properties of lattices depend on a numberfactorswhichrequireexperimentalevaluationtofacilitateeffective implant design, including: cell topology, relativedensityandloadingconditions[4].Thisworkreportsontheexperimentalinvestigationofstiffness properties of SLM manufactured Titanium(Ti6Al4V)latticestructuresofvaryingcellconfigurations.METHODSArangeoflatticecellspecimenswereSLMmanufacturedand tested under quasi static compressive loading tomeasure associated stiffness. The stiffnesswasmeasuredat initial loading (Young’s modulus) and after reloading(2%strainmodulus).Thespecimensvariedincelltopology(Fig.1)andcellsize(2and3mm).RESULTSANDDISCUSSIONCurrent literature typically uses bone tissue Young’sModulus as the objective function for minimising stressshielding.Anumberofpublications focusedonadditivelymanufactured latticesalsoassociate theYoung’smoduluswiththeexpectedin-situstiffnessoflatticestructures,forexample [4-5]. However, tests showed that the Young’smodulus isalways lower than thereloadingmoduliat2%strain (Fig.2). This observation indicates that localisedplasticity isoccurring in the lattice specimensat stressesbelow the compressive strength. This outcome is
compatible with observations for metallic foams [4], butthis work confirms this phenomenon in AM latticestructures. The results indicate that effective latticeimplant design needs to target the reloading modulusratherthantheYoung’smodulusvalue.CONCLUSIONSThediscrepancybetween loadingandreloadingmoduluscan be pronounced for SLM manufactured latticestructures. Consequently, the reloading modulus of AMlattice structures should be used as the optimisationcriterion for bone replacementmaterials. Furtherwork iscurrently beingundertake to evaluate abroader rangeoflattice topologies and cell geometries in order to targetspecificbonestiffnessrequirements.REFERENCES[1]Balke,M.,etal.(2009).ModilarEndoprostheticReconstructionin Malignant Bone Tumours: Indications and Limitations.TreatmentofBoneandSoftTissueSarcomas.RecentResults inCancerResearch.Springer-Verlag.[2]Jeys,L.M.,etal.(2003).Riskofamputationfollowinglimbsalvage surgery with endoprosthetic replacement, in aconsecutive series of 1261 patients. Int. Orthopaedics 27:160-163.[3]WolffJ.(1892),DasGesetzderTransformationderKnochen.Reprint:ProBusiness,Berlin2010[4]Gibson,L.J.andAshby,M.F.,(1999).Cellularsolids:structureandproperties.Cambridgeuniversitypress.[5] Wieding, J., et al. (2014). Numerical optimization ofopen-porous bone scaffold structures to match the elasticproperties of human cortical bone. Journal of the MechanicalBehaviorofBiomedicalMaterials,37,56–68.[6]Yan,C.,etal.(2012).Evaluationsofcellularlatticestructuresmanufactured using selective laser melting. Int. Journal ofMachineToolsandManufacture,62,32–38.
Figure1:Latticeunitcells(left)andtestspecimens(right).
Figure 2: Example stress-strain response (left) andmodulusvalues(right)oftestedlatticespecimens
10thAustralasianBiomechanicsConference,UniversityofMelbourne,Australia,4–6Dec2016

10thAustralasianBiomechanicsConference,UniversityofMelbourne,Australia,4–6Dec2016
TAILORINGTHEMECHANICALPROPERTIESOFHYDROGELSFORCARTILAGETISSUEENGINEERINGCathalDO’Connell1,PeterPivonka3,
BinbinZhang1,IreneYu,3EmilyLiu,3ClaudiaDiBella2,3,SerenaDuchi3,CarmineOnofrillo3,AnitaQuigley1,4,5,RomaneBlanchard3,JustinBourke,1,4,5RobertKapsa,1,4,5PeterChoong2,3,GordonG.Wallace1
1ARCCentreofExcellenceforElectromaterialsScience,UniversityofWollongong2DepartmentofOrthopaedic,StVincent’sHospital,Melbourne
3DepartmentofSurgery,StVincent’sHospital,UniversityofMelbourne4DepartmentofMedicine,UniversityofMelbourne,Melbourne
5DepartmentofClinicalNeurosciences,StVincent’sHospital,Melbourne
INTRODUCTION Osteoarthritis(OA)isoneofthemostdebilitatingdiseasesinthedevelopedworld,affecting80%ofpeopleover65,and costing the Australian economy over $2 billion peryear.[1] The precursor to OA in the knee joint is achondral defect(s) which can manifest and grow over aperiod of decades, but for which there is currently noeffective clinical strategy to repair.[2] One excitingpossibilitytopreventonsetofOAistoregeneratenaturalhyaline cartilage in situ by filling in the chondral defectwithbiomaterialsandchondrogeniccellsderivedfromthepatient.[3] This approach is dependent on identifyingsuitable scaffolding materials that allow cells todifferentiate along the desired lineage, which can beremodelled to form regenerative cartilage tissue, andwhich match the native mechancial environment. Thechallenge is compounded in articular cartilage by thedepth dependent change inmechanical properties, suchas a 7 fold increase in compressive modulus within 1.5mmdepth.[5]Thisstudydevelopsamethodologytotunethe mechanical properties of hydrogels towards newscaffold materials able to fulfill the requirements forsuccessfulcartilagetissueengineering. METHODSGelatinmethacylate(GelMa)isnaturallyderivedhydrogelwhich is crossinkable through free radicalpolymerisationinitiated by the exposure of a photoinitiator toUV light.Our thesis is that the mechanical properties of thesehydrogels can be controlled through the degree ofcrosslinking. The study begins with a calculation of therateoffreeradicalproductionfromUVdegradationofthephotoinitiator Irgacure-2959 as measured by UV-visspectroscopy. In situ rheologicalmeasurementsareusedtoquantify the rateof reactionofGelMahydrogels as afunction of light intensity, exposure time andphotoinitiator concentration. Final elastic moduli areobtained from mechanical indentation measurements.These empirical data are then generalised through amodel derived from the kinetics of free radicalpolymerisation. RESULTSANDDISCUSSIONOur results demonstrate how the rate of crosslinking ofGelMa can be controlled through manipulation of thephotocuring conditions (light intensity, exposure time,photoinitiator concentration, and GelMa concentration)
to predictably achieve elasticmoduli ranging two ordersof magnitude (from less than 1 kPa to more than 200kPa). Thesematerials can thus be tailored tomatch themechanical environment of a range of human tissuesfrom neuronal cells to muscle, skin, and cartilage. Thefundamental materials understanding developed in thiswork is also used to design bespoke biomechanicalstructures.Forexample,amechanicalgradientpresentingan eight-fold drop in stiffness was established throughtranslating a mask across the sample while photocuring[Figure1].
Figure1:Translatingamaskcontrolsthelightexposureacrossthesample,andhencethemechanicalpropertiesofthehydrogel(asmeasuredbyAFMnanoindentation).CONCLUSIONSThe mechanical properties of photocrosslinkablehydrogels canbe tailored throughrationalcontrolof thedegree of crosslinking. Marrying this strategy withadvanced biofabrication techniques, such as 3Dbioprinting, promises bespoke 3D structures withdistributed mechanical properties while alsoincorporating encapsulated cells.[6] These structurescould provide a unique proving ground fornext-generation cartilage repair strategies, such as thedifferentiation of zonal populations of chondrocytes in alayeredstructureofgradedstiffness. REFERENCES[1]Arthritis Australia, Painful Realities: The economic
impactofarthritisinAustralia,2007.[2]SmithGDeta.,J.BoneJointSurg.Br.87445–9,2005.[3]DiBellaCetal.,Front.Surg.21–7,2015.[4]DischerDE,JanmeyPandWangY.Science3101139–
43,2005.[5]ChenSS,etal.Osteoarthr.Cartil.9561–9,2001. [6]C.D.O’Connelletal.,Biofabrication,8,015019,2016
DAMAGE AND FRACTURE EVALUATION OF BIOLOGICAL SOFT TISSUE BY BALL INDENTATION TECHNIQUE
Atsushi Sakuma1 and Katsuya Igarashi2 1 Dept. of Advanced Fibro-Science, Kyoto Institute of Technology, Kyoto, Japan 2 Graduate School, Tokyo Institute of Agriculture and Technology, Tokyo, Japan
INTRODUCTION Mechanical behavior of biological soft tissue is complex because of the internal structure of cells, fiber, intracellular fluid, and so on. Damage and fracture behaviors of soft tissue are especially important to the evaluation of various phenomena in the areas of surgery, sports injury and traffic accidents. For accurate evaluation of the behaviors, objective observation procedure of mechanical test is needed for the development of the methods. However, fundamental tensile testing of soft tissue has many difficulties, including specimen-profile control, chucking of specimens, strain-quantification, and so on. The technique of indentation testing [1] has been developed by extending Hertzian contact theory [2]. However, the fracture of soft tissue has not been studied because of the difficulties of observation and formulation of deformation behavior of the soft tissue. Therefore, the observation of deformation behavior has been considered in this study. In particular, quantification of the fracture of soft tissue is introduced by using the technique of indentation testing.
OBSERVATION OF MECHANICAL BEHAVIOR The dynamic behavior of the tissue was observed by a test system using airsoft guns. The test system, shown in Figure 1, has an airsoft gun, which shoots plastic balls vertically downward into specimens placed on top of a load cell. The reaction force caused by the ball can be analyzed by strain waves that propagate in the load cell.
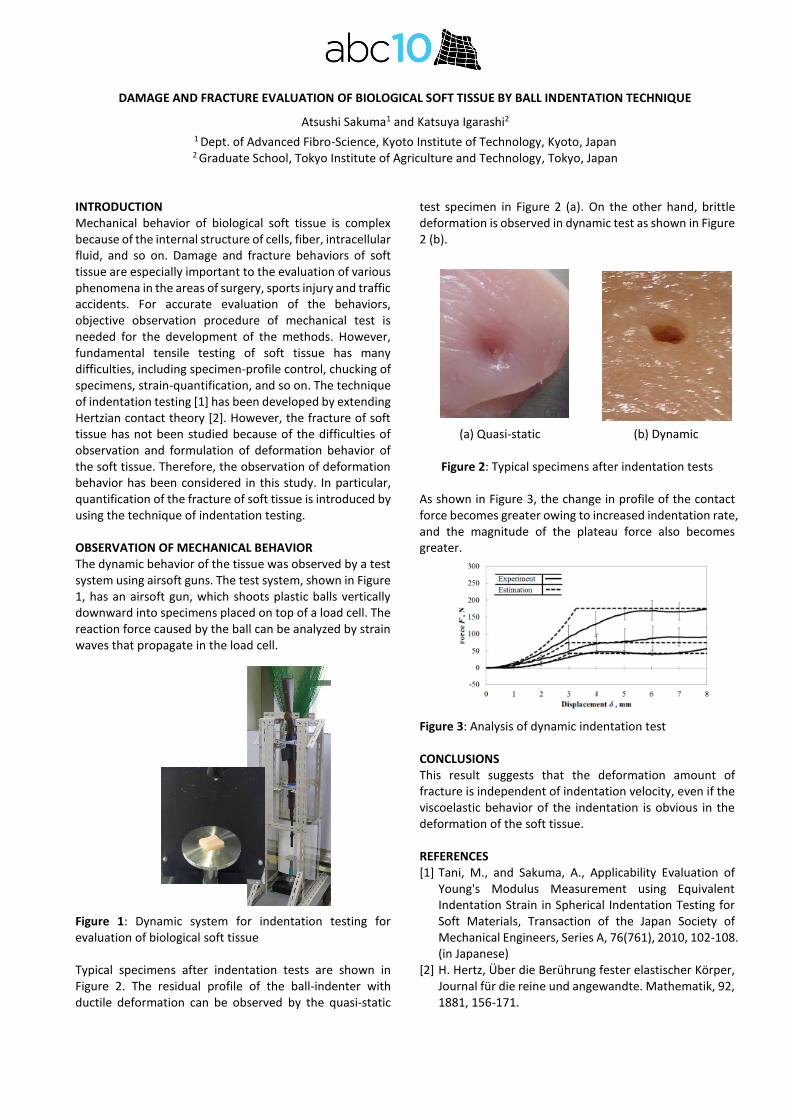
Figure 1: Dynamic system for indentation testing for evaluation of biological soft tissue Typical specimens after indentation tests are shown in Figure 2. The residual profile of the ball-indenter with ductile deformation can be observed by the quasi-static
test specimen in Figure 2 (a). On the other hand, brittle deformation is observed in dynamic test as shown in Figure 2 (b).
(a) Quasi-static (b) Dynamic
Figure 2: Typical specimens after indentation tests
As shown in Figure 3, the change in profile of the contact force becomes greater owing to increased indentation rate, and the magnitude of the plateau force also becomes greater. Figure 3: Analysis of dynamic indentation test CONCLUSIONS This result suggests that the deformation amount of fracture is independent of indentation velocity, even if the viscoelastic behavior of the indentation is obvious in the deformation of the soft tissue. REFERENCES [1] Tani, M., and Sakuma, A., Applicability Evaluation of
Young's Modulus Measurement using Equivalent Indentation Strain in Spherical Indentation Testing for Soft Materials, Transaction of the Japan Society of Mechanical Engineers, Series A, 76(761), 2010, 102-108. (in Japanese)
[2] H. Hertz, Über die Berührung fester elastischer Körper, Journal für die reine und angewandte. Mathematik, 92, 1881, 156-171.

10th Australasian Biomechanics Conference, University of Melbourne, Australia, 4 – 6 Dec 2016
EXPERIMENTAL AND NUMERICAL INVESTIGATIONS OF FRACTURE BEHAVIORS OF CERAMIC TISSUE SCAFFOLDS
Ali Entezari1, Seyed‐Iman Roohani‐Esfahani1, Zhongpu Zhang1, Hala Zreiqat1, Colin R Dunstan1 and Qing Li1 1 School of Aerospace, Mechanical and Mechatronic Engineering, The University of Sydney, Sydney, NSW 2006, Australia
INTRODUCTION Excellent biological properties of ceramic scaffolds place them amongst the main candidates for applications of bone and cartilage repair. However, their uses in load‐bearing applications have been limited because of their inherent brittleness and relatively low fracture strength. Hence, effective and reliable uses of such scaffolds in clinic or in‐vivo models necessitate an insightful analysis of the fracture behavior under critical conditions.
While substantial experimental studies have been conducted to evaluate the fracture strength of tissue scaffolds, little work has been reported in the literature concerning the computational modeling and analysis of fracture behaviors of ceramic scaffolds with the exception for some typical stress analyses using conventional finite element methods (FEM) [1]. Nevertheless, the stress analyses based on the conventional FEM are not able to model cracking process under loading, compromising their capability and reliability for fracture analyses of ceramic structures. In this study, a relatively new numerical method, namely extended finite element method (XFEM) [2], capable of modeling time‐dependent cracking process was used to simulate fracture in robocast Sr‐HT‐Gahnite scaffolds. Moreover, experimental tests were also conducted on fabricated Sr‐HT‐Gahnite scaffolds to validate the effectiveness of this numerical technique. METHODS The Sr‐HT‐Gahnite scaffolds were fabricated by depositing the formulated in‐house Sr‐HT‐Gahnite inks [3] through a customized nozzle using a robotic deposition device (Hyrel 3D, USA). The scaffolds were composed of orthogonal layers of Sr‐HT‐Gahnite rods with different porosities. The compressive strength of the scaffolds was tested in the direction parallel to the pore channels (clinically relevant position for the in‐vivo implantation).
XFEM was employed using commercial code ABAQUS 6.13 (SIMULIA, Providence, RI, USA) to simulate crack initiation and propagation in the scaffolds. Crack initiation was determined based on the maximum principal stress‐based damage criterion, and the crack propagation was modeled based upon energy release rate within the material [2]. In addition to post‐fabrication computer aided design (CAD) based modeling analyses,
XFEM was also conducted on the micro‐computed tomography (μCT) based models of the fabricated scaffolds. For this purpose, each fabricated scaffold was scanned using SkyScan 1172 (Kontich, Belgium). The image‐processing software ScanIP (Simpleware Ltd, Exeter, UK) was used to generate mesh in four‐node linear tetrahedral elements based on the +FE Free algorithm in ScanFE (Simpleware Ltd, Exeter, UK). Furthermore, Field emission scanning electron microscopy (FE‐SEM) images of specimens were obtained to validate the crack initiation and propagation paths simulated by XFEM. RESULTS AND DISCUSSION The results proved that the XFEM solution was significantly more realistic for predicting fracture strength of the scaffolds compared with conventional FEM counterpart; because unlike the conventional FEM, the XFEM enabled the modeling of scaffolds’ structural resistance to crack propagation in line with energy release rate within the material [2]. Moreover, μCT‐based numerical analyses predicted more realistic results than post fabrication CAD‐based simulations because the μCT‐based models better captured the actual specimens by modeling all details of geometric variation resulted from the fabrication process. Furthermore, the capability of XFEM to predict the correct fracture path in ceramic scaffolds was demonstrated through correlating with the field‐emission scanning electron microscopy analysis. CONCLUSIONS This study showed that XFEM can be used as an effective and reliable tool to model the fracture behaviors of ceramic scaffolds, thereby providing a robust framework for further optimization of load bearing tissue scaffolds in silico. ACKNOWLEDGEMENTS The support from Australian Research Council is grateful. REFERENCES [1] Miranda, P et al. Acta Biomaterialia, 4(6): 1715‐1724,
2008. [2] Entezari, A. et al. Scientific Reports, 6: 28816, 2016. [3] Roohani‐Esfahani, SI et al. Scientific Reports, 6: 19468,
2016.

DAY 1 Sunday 4th December 2016 (continued)
4:30pm - 6:30pm
Session 2 · CLINICAL & SPORTS BIOMECHANICS Chairs: Morgan Sangeux (Murdoch Childrens Research Institute), Adam Bryant (University of Melbourne)
4:30pm KEYNOTE SPEAKER
YOUNG PEOPLE WITH OLD KNEES: BIOMECHANICS OF KNEE JOINT DEGENERATION FOLLOWING ACL RECONSTRUCTION Associate Professor Adam Bryant, University of Melbourne
5:00pm VALIDITY AND RELIABILITY OF TRIAXIAL ACCELEROMETERS DURING RUNNING Suzi Edwards, University of Newcastle
5:15pm VALIDATION OF IMU SPRINT DATA: REASSESSING THE ACCERLERATION PHASE OVER THE FIRST 30M Ethan Moore, Swinburne University / University of Adelaide
5:30pm TIME TO STABILISATION DURING SINGLE LIMB LANDING IS SHORTER IN PATIENTS WITH ANTERIOR CRUCIATE LIGAMENT RECONSTRUCTION Jodie McClelland, La Trobe University
5:45pm PELVIS BIOMECHANICS ARE ALTERED DURING STEP ASCENT IN SYMPTOMATIC FEMOROACETABULAR IMPINGEMENT Laura Diamond, Griffith University
6:00pm MUSCLE CONTRIBUTIONS TO KNEE JOINT MOMENTS IN CHILDREN WITH CEREBRAL PALSY: A TWIN CASE STUDY Giorgio Davico, Griffith University
6:15pm SIMULATING THE EFFECT OF MUSCLE WEAKNESS AND CONTRACTURE ON NEUROMUSCULAR CONTROL OF NORMAL GAIT IN TYPICALLY DEVELOPING CHILDREN Aaron Fox, University of Queensland
6:30pm - 7:00pm Free Time
7:00pm - 8:30pm WELCOME RECEPTION & NETWORKING SESSION at Melbourne Town Hall
10thAustralasianBiomechanicsConference,UniversityofMelbourne,Australia,4–6Dec2016
YOUNGPEOPLEWITHOLDKNEES:BIOMECHANICSOFKNEEJOINTDEGENERATIONFOLLOWINGACLRECONSTRUCTION
AdamL.BryantCentreforHealth,Exercise&SportsMedicine,DepartmentofPhysiotherapy,
UniversityofMelbourne,VIC,Australia
Ruptureoftheanteriorcruciate ligament(ACL)results inmechanical and neurophysiological deficits 1 that, incombination, lead to aberrant tibiofemoral (TFJ)kinematicsandkinetics2.EarlyACLreconstruction(ACLR)is commonly performed to improve knee stability andfunction; however, ACLR is no more successful atpreventing knee osteoarthritis (OA) than conservativetreatment3.Indeed,morethan30%ofACLRpatientswillshowsignsofkneeOAat5yearspost-surgery4andover50%at 10-20 years post-surgery 5.Given thatACL injurypredominantly occurs in individuals between 15 and 25yearsofage6,manyACLRpatientswillexhibit‘oldknees’wellbeforemiddle-age.So what biomechanical factors contribute to thedevelopment of premature knee OA following ACLR?Compositionalintegrityofthekneecartilage-subchondralbone unit depends upon a balance between tissuesynthesis and degradation – an interrelationshipcontingent(inpart)uponappropriatejointloadingduringgait-relatedactivities.AgrowingnumberofACLR-relatedstudieshaveincorporatedcomputationalmusculoskeletalmodels to predict TFJ contact forces during differentwalking and sporting tasks 7, 8, 9. In combination with
quantitative and semi-quantitative analyses of TFJmagnetic resonance images, several of these studies 9have also attempted to elucidate the relationshipbetween TFJ contact loading and cartilage-subchondralbone unit structure in the years following ACLR. ResultsfromourACLRstudiesandotherswillbepresented.REFERENCES1. Kaprelietal.(2009)AmJSportsMed,37(12):2419-26.
2. Rudolphetal.(2000)KneeSurgSportsTraumatolArthrosc,8(5):
262-9.
3. Lohmanderetal.(2007)AmJSportsMed,35(10):1756-69.
4. Frobelletal.(2013)BritishMedicalJ,346:f232.
5. Lohmanderetal.(2004)ArthritisRheum,50(10):3145-52.
6. Hewettetal.(2013)AmJSportsMed,41(1):216-24.
7. Saxbyetal.(2016)MedSciSportsExerc.(inpress)
8. Tsaietal.(2012)JOrthoRes, 30(12):2007-2014.
9. Wellsandtetal.(2016)AmJSportsMed,44(1): 143-51.

VALIDITY AND RELIABILITY OF TRIAXIAL ACCELEROMETERS DURING RUNNING
Suzi Edwards1,2, Seaton Humphries2, Sam White1, Robert Robergs2,3 and Nicholas O’Dwyer2,4 1 School of Environmental and Life Sciences, University of Newcastle, Ourimbah, NSW, Australia 2 School of Exercise Science, Sport and Health, Charles Sturt University, Bathurst, NSW, Australia 3 School of Exercise and Nutrition Sciences, Queensland University of Technology, QLD, Australia
4 Dept. Exercise and Sports Science, University of Sydney, Sydney, NSW, Australia
INTRODUCTION Triaxial accelerometers embedded in global positioning system (GPS) units are currently increasing in popularity as an alternative method to quantify field sports performance. The reliability of GPS accelerometers has been established when attached to a rigid body [1]. Nevertheless when attached to non-rigid bodies, the reliability of these GPS accelerometer derived variables are questionable as it consistently over-estimates the magnitude of acceleration [2], most likley due to the attachment method of the GPS unit on the body. The superior location of the GPS unit (between T1-T6) and the role of acceleration attentuation also questions the validity of using GPS devices to estimate variables based on the acceleration of the centre of gravity of the body (COG) such as energy expenditure or vertical ground reaction force. Therefore, the aim of this study was to determine the validity and reliability of GPS unit accelerometer to estimate peak vertical COG and thoracic acceleration when compared to the gold standard measure of a three-dimensional (3D) motion capture system. METHODS Eleven amateur rugby union players performed 10 successful linear running trials at three different running speeds (slow=3.3m·s-1, medium=5.0m·s-1, fast=6.7m·s-1) wearing a Catapult Optimeye S5 GPS unit (CAT). Kinematic and kinetic data were recorded by a 10-camera Qualisys motion capture system and two Kistler force platforms, respectively. Markers were placed on the limbs, torso, pelvis, head and GPS device to estimate the COG (Model-COG), thoracic (UpTrunk) and 3D-GPS unit segment accelerations. Two Delsys accelerometers were attached laterally to the GPS device on the harness (Harness-Accel) and skin (Skin-Accel). Stance phase was defined from initial contact, to the first vertical acceleration peak (AccMAX1), to the second peak in vertical acceleration (AccMAX2) to toe-off. Validity was assessed with a repeated measures factorial analysis of variance (P<0.05). Reliability was measured by the change in mean, typical effort of measurement (TEM) and intraclass correlation (ICC). RESULTS AND DISCUSSION Both AccMAX1 and AccMAX2 displayed a main effect of type (F5,55=69, P<0.01; F5,55=33, P<0.01), speed (F2,22=9, P<0.01; F2,2=29, P<0.01) and interactions between type x speed (F10,110=11, P<0.01; F1,110=17, P<0.01; respectively, Figure 1). Whilst most post-hoc tests were significantly different, there was no significant difference between the 3D-GPS and Harness-Accel with excellent reliability for ICC (0.82-0.97), low TEM (6%-17%) and change in mean (2%-10%) for AccMAX2 for all speeds. Nevertheless, all speeds of AccMAX1.displayed poor reliability for ICC (0.01-0.25), high
TEM (19%-39%) and change in mean (29%-66%). Low reliability was observed between the UpTrunk and Accel-harness or Accel-Skin with poor ICC (0.01-0.37), high TEM (13%-97%) and change in mean (13%-66%). Together these findings indicates a substantial inconsistent effects of the movement of the harness and skin relative to the UpTrunk and the CAT within the harness pouch, highlighting the critical need to develop a new attachment method.
Figure 1: Means ± SE of (A) AccMAX1 and (B) AccMAX2.during running.
The only other non-significant post-hoc tests were
CAT and Harness-Accel at medium speed and, Model-COG and UpTrunk at fast speed, highlighting that the validity was depended on running speed. Whilst peak acceleration increased with increased speed (e.g. Model-COG), thoracic derived acceleration variables did not reflect this pattern, most likely due to the changing effect of the limbs with gait speed to magnitude of the COG [3]. The CAT displayed poor reliability to estimate Model-COG for AccMAX1 (except slow) and AccMAX2 with poor ICC (0.03-0.36), high TEM (17%-53%) and change in mean (2%-102%), suggesting CAT is not a reliable nor valid indicator of vertical COG acceleration.
The effect of sampling rate (CAT 100 Hz vs 3D-GPS 300 Hz) on the reliability of AccMAX1 and AccMAX2 showed there was excellent to good-to-fair reliability for ICC (0.68-0.97), suggesting no effect of sampling rate on the reliability of the magnitude of peak acceleration. However, this was not reflected in the poor validity nor high TEM (6%-40%) and change in mean (10%-68%) for all speeds. CONCLUSIONS GPS unit accelerometer demonstrated poor reliability and validity to estimate both peak vertical COG and thoracic, highlighting the critical need to develop a new attachment method. Using peak vertical thoracic acceleration to estimate of peak vertical COG acceleration is not valid nor reliable and warrants the development of algorithms to account for the superior location of thoracic-mounted accelerometers to quantify field sports performance. REFERENCES [1] Boyd LJ et al. Int J Sports Physiol Perform, 6:311-321,
2001. [2] Wundersitz D et al. Sports Biomech, 12:4,403-412,2013. [3] Lee CR & Farley C. J Exp Biol, 201: 21, 2935-2944, 1988.
[A] [B]
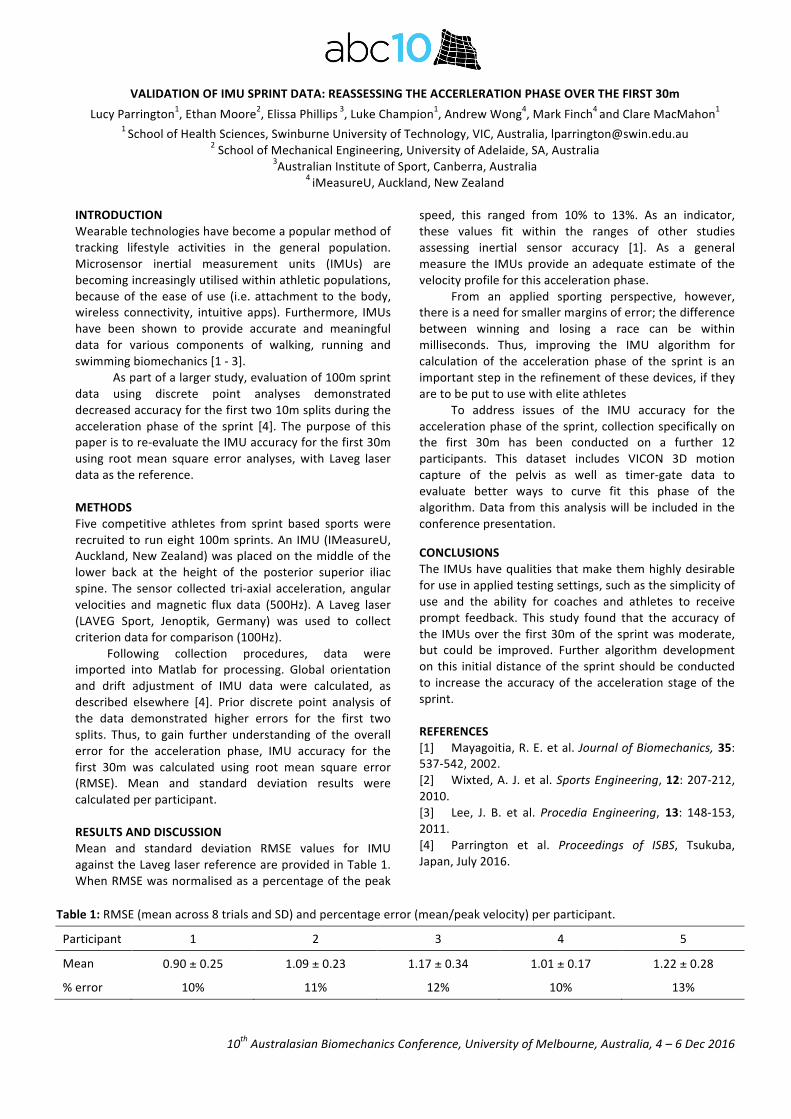
10thAustralasianBiomechanicsConference,UniversityofMelbourne,Australia,4–6Dec2016
VALIDATIONOFIMUSPRINTDATA:REASSESSINGTHEACCERLERATIONPHASEOVERTHEFIRST30mLucyParrington1,EthanMoore2,ElissaPhillips3,LukeChampion1,AndrewWong4,MarkFinch4andClareMacMahon1
1SchoolofHealthSciences,SwinburneUniversityofTechnology,VIC,Australia,[email protected],UniversityofAdelaide,SA,Australia
3AustralianInstituteofSport,Canberra,Australia4iMeasureU,Auckland,NewZealand
INTRODUCTIONWearabletechnologieshavebecomeapopularmethodoftracking lifestyle activities in the general population.Microsensor inertial measurement units (IMUs) arebecomingincreasinglyutilisedwithinathleticpopulations,becauseof theeaseofuse (i.e. attachment to thebody,wireless connectivity, intuitive apps). Furthermore, IMUshave been shown to provide accurate and meaningfuldata for various components of walking, running andswimmingbiomechanics[1-3].
Aspartofalargerstudy,evaluationof100msprintdata using discrete point analyses demonstrateddecreasedaccuracyforthefirsttwo10msplitsduringtheacceleration phase of the sprint [4]. The purpose of thispaperistore-evaluatetheIMUaccuracyforthefirst30musing rootmean square error analyses,with Laveg laserdataasthereference.METHODSFive competitive athletes from sprint based sports wererecruitedtoruneight100msprints.AnIMU(IMeasureU,Auckland,NewZealand)wasplacedonthemiddleofthelower back at the height of the posterior superior iliacspine. The sensor collected tri-axial acceleration, angularvelocities andmagnetic flux data (500Hz). A Laveg laser(LAVEG Sport, Jenoptik, Germany) was used to collectcriteriondataforcomparison(100Hz). Following collection procedures, data wereimported into Matlab for processing. Global orientationand drift adjustment of IMU data were calculated, asdescribed elsewhere [4]. Prior discrete point analysis ofthe data demonstrated higher errors for the first twosplits. Thus, to gain further understanding of the overallerror for the acceleration phase, IMU accuracy for thefirst 30m was calculated using root mean square error(RMSE). Mean and standard deviation results werecalculatedperparticipant.RESULTSANDDISCUSSIONMean and standard deviation RMSE values for IMUagainsttheLaveglaserreferenceareprovidedinTable1.WhenRMSEwasnormalisedasapercentageofthepeak
speed, this ranged from 10% to 13%. As an indicator,these values fit within the ranges of other studiesassessing inertial sensor accuracy [1]. As a generalmeasure the IMUs provide an adequate estimate of thevelocityprofileforthisaccelerationphase.
From an applied sporting perspective, however,thereisaneedforsmallermarginsoferror;thedifferencebetween winning and losing a race can be withinmilliseconds. Thus, improving the IMU algorithm forcalculation of the acceleration phase of the sprint is animportantstepintherefinementofthesedevices,iftheyaretobeputtousewitheliteathletes
To address issues of the IMU accuracy for theaccelerationphaseofthesprint,collectionspecificallyonthe first 30m has been conducted on a further 12participants. This dataset includes VICON 3D motioncapture of the pelvis as well as timer-gate data toevaluate better ways to curve fit this phase of thealgorithm.Data fromthisanalysiswillbe included in theconferencepresentation.CONCLUSIONSTheIMUshavequalitiesthatmakethemhighlydesirableforuseinappliedtestingsettings,suchasthesimplicityofuse and the ability for coaches and athletes to receiveprompt feedback. This study found that the accuracy ofthe IMUsover the first30mof thesprintwasmoderate,but could be improved. Further algorithm developmenton this initialdistanceof thesprint shouldbeconductedto increase theaccuracyof theacceleration stageof thesprint.REFERENCES[1] Mayagoitia,R.E.etal.JournalofBiomechanics, 35:537-542,2002.[2] Wixted,A. J.etal.SportsEngineering,12:207-212,2010.[3] Lee, J. B. et al. Procedia Engineering, 13: 148-153,2011. [4] Parrington et al. Proceedings of ISBS, Tsukuba,Japan,July2016.
Table1:RMSE(meanacross8trialsandSD)andpercentageerror(mean/peakvelocity)perparticipant.
Participant 1 2 3 4 5
Mean 0.90±0.25 1.09±0.23 1.17±0.34 1.01±0.17 1.22±0.28
%error 10% 11% 12% 10% 13%

10thAustralasianBiomechanicsConference,UniversityofMelbourne,Australia,4–6Dec2016
TIMETOSTABILISATIONDURINGSINGLELIMBLANDINGISSHORTERINPATIENTSWITHANTERIORCRUCIATELIGAMENTRECONSTRUCTION
JodieA.McClelland1,MichaelMaes2,JulianA.Feller2,KateE.Webster11SchoolofAlliedHealth,LaTrobeUniversity,Melbourne,VIC,Australia2OrthoSportVictoria,EpworthHealthCare,Richmond,VIC,Australia
INTRODUCTIONPeople with reconstruction of the anterior cruciateligament (ACL) are at a greater risk of subsequent kneeinjury than the general athletic population. For youngerathletes and males, this risk is further elevated. Thereasons for this elevated risk of knee injury aremultifactorial,however,themovementstrategiesadoptedbytheseathletesarelikelytoplayasignificantroleinthedevelopmentof knee injury subsequentto the initial ACLreconstruction.ACLinjuries are commonly sustained during sportsparticipationwhentheathlete’sweight is supportedbyasingle limb,eitherwhen landing froman elevatedheight,orwhenchangingdirection.Biomechanicalanalyseshave described that patients with anterior cruciateligament reconstruction demonstrate knee biomechanicsthat are different from normal during tasks that requirelanding on a single limb (REF). For more accurateevaluationofkneeinjuryrisk,itmaybemoreimportanttoidentifywhethertherearedifferencesinthebiomechancisofthewholebodyduringsinglelimblandings. Thetimethat it takesforpatientstostablisetheirbodyweightmaybeanappropriateindicationofwholebodyneuromuscularcontrol. Recently, the time to stabilisation has beendescribed as the sole predictive factor in people whosustainACL injuries. Yet, thishasnotbeendescribedinpeoplewithapreviousreconstructionThe aim of this study was to compare the time tostabilisation during a single limb landing task betweenyoung athletes with ACL reconstuction and age-matchedcontrols. Asecondaryaimof thestudywastocomparethe biomechanics of lower limb joints, pelvis and trunkduringthesametask.METHODSThirty-oneparticipantswere included:18 had undergoneACLreconstructionatleast18monthspriortotestingandhad returned to play in theirmain sport, and13wereofsimilar age and activity level without knee injury.Participants were asked to perform a single hop wheretheytravelledinaforwardsdirectionthedistanceoftheirleg length and the height of half of the maximum jumpheight. Following a familiarisation period, participantsrepeatedthetaskuntil theyhadcompletedsix successfulattemptswheretheymaintainedtheirbalanceforatleast3secondsonlanding.
Thegroundreactionforceof the landingphasewasrecordedusinganAMTIforceplatform(AMTI,Watertown,MA,USA)atasamplingrateof4000Hz. Simultaneously,a10cameraViconMotionAnalysisSystem(Vicon,Oxford,
UK) recorded trajectory data from 33 passive reflectivemarkersattachedtobony landmarks. JointangleswereestimatedbasedonthemodifiedHelenHayesmodel(REF)andacustomtrunkmodel(describedrelativetotheglobalcoordinate system) (REF), and joint moments werecalculatedusingtheprinciplesof inversedynamics. Thebiomechanicsofthelowerlimbandtrunkatinitialcontact,aswellasthepeakbiomechanicsduringthefirstsecondoflanding were identified. Time to stabilisation wasquantifiedasthetimerequiredfortheverticalcomponentof thegroundreactionforceto reachandremainwithin±5%oftheparticipant’sbodyweightonlanding. Alldatawerecomparedbetweentheoperatedlimbofpatientsanda randomly assigned limb of control participants usingindependentt-tests.RESULTSANDDISCUSSIONParticipantswithACLreconstructionwerenotsignificantlydifferent fromcontrols in age (17.4±2.1yearsvs18.6±1.2years; p=0.06), height (176.0±7.9cm vs 175.8±9.1cm,p=0.95)orweight(76.5±12.17kgvs67.7±10.1kg,p=0.08).The time to stabilisationwasquicker in theACLreconstructionthancontrolgroup(0.57±0.11secs vs0.66±0.12secs,p=0.04). At initial contactwith the forceplatform,patientswithACLreconstructionhadgreaterhipflexion(34.7±5.8vs27.0±6.3,p<0.01)andgreateranteriorpelvic tilt (19.1±4.5 vs 13.1±5.7, p<0.01). The peakbiomechanics and lower limb joint moments were notdifferentbetweengroups.CONCLUSIONSYoungerathleteswith anterior cruciate ligamentreconstructionadoptsinglelimblandingstrategiesthataredifferentfromnormal.Greaterpelvisanteriortiltandhipflexion at initial contact support recent evidence thataberrant movement strategies in patients with anteriorcruciate ligament reconstruction manifest at moreproximal joints to the knee. The shorter time tostabilisationmay reflect adoptionof an abnormalbracingstrategyduringlanding.ACKNOWLEDGEMENTSTheauthorswishtothankMrGustafGauffinandMsAnnaNilssonfortheirassistancewithdatacollection.
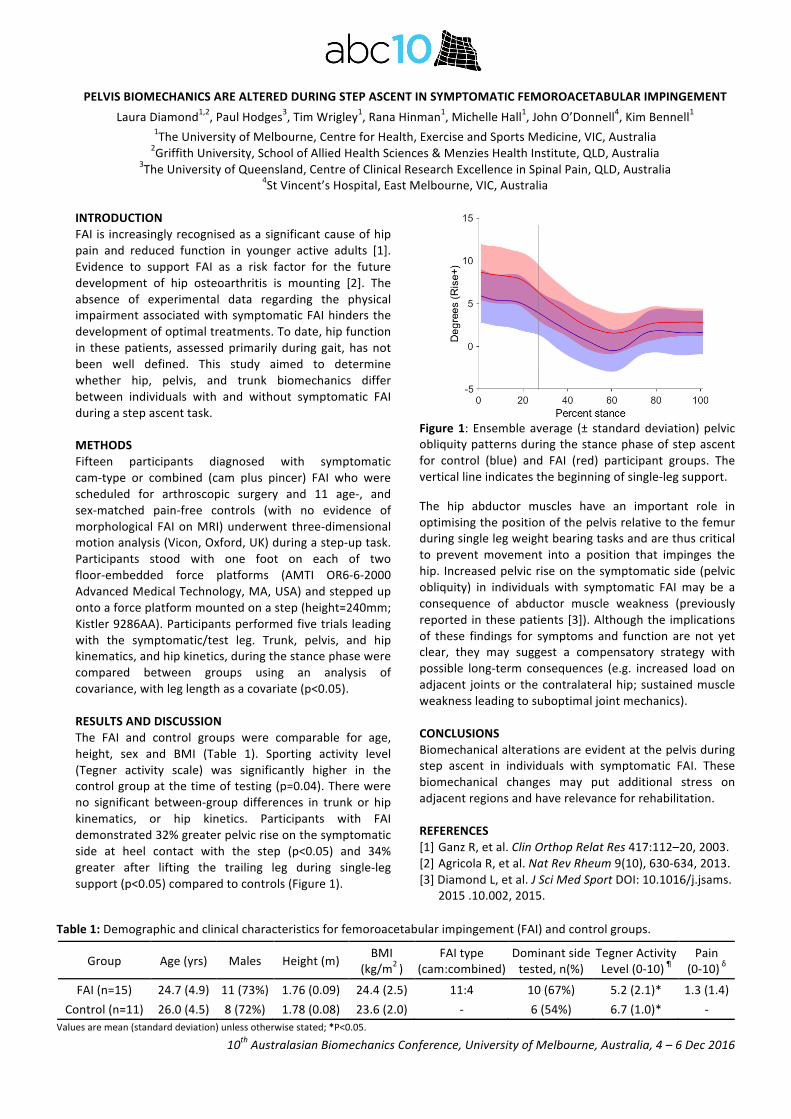
10thAustralasianBiomechanicsConference,UniversityofMelbourne,Australia,4–6Dec2016
PELVISBIOMECHANICSAREALTEREDDURINGSTEPASCENTINSYMPTOMATICFEMOROACETABULARIMPINGEMENTLauraDiamond1,2,PaulHodges3,TimWrigley1,RanaHinman1,MichelleHall1,JohnO’Donnell4,KimBennell1
1TheUniversityofMelbourne,CentreforHealth,ExerciseandSportsMedicine,VIC,Australia2GriffithUniversity,SchoolofAlliedHealthSciences&MenziesHealthInstitute,QLD,Australia
3TheUniversityofQueensland,CentreofClinicalResearchExcellenceinSpinalPain,QLD,Australia4StVincent’sHospital,EastMelbourne,VIC,Australia
INTRODUCTIONFAIisincreasinglyrecognisedasasignificantcauseofhippain and reduced function in younger active adults [1].Evidence to support FAI as a risk factor for the futuredevelopment of hip osteoarthritis is mounting [2]. Theabsence of experimental data regarding the physicalimpairmentassociatedwithsymptomaticFAIhindersthedevelopmentofoptimaltreatments.Todate,hipfunctionin thesepatients, assessedprimarily during gait, has notbeen well defined. This study aimed to determinewhether hip, pelvis, and trunk biomechanics differbetween individuals with and without symptomatic FAIduringastepascenttask. METHODSFifteen participants diagnosed with symptomaticcam-type or combined (cam plus pincer) FAI who werescheduled for arthroscopic surgery and 11 age-, andsex-matched pain-free controls (with no evidence ofmorphologicalFAIonMRI)underwent three-dimensionalmotionanalysis(Vicon,Oxford,UK)duringastep-uptask.Participants stood with one foot on each of twofloor-embedded force platforms (AMTI OR6-6-2000AdvancedMedicalTechnology,MA,USA)andsteppedupontoaforceplatformmountedonastep(height=240mm;Kistler9286AA).Participantsperformedfivetrials leadingwith the symptomatic/test leg. Trunk, pelvis, and hipkinematics,andhipkinetics,duringthestancephasewerecompared between groups using an analysis ofcovariance,withleglengthasacovariate(p<0.05). RESULTSANDDISCUSSIONThe FAI and control groups were comparable for age,height, sex and BMI (Table 1). Sporting activity level(Tegner activity scale) was significantly higher in thecontrolgroupatthetimeoftesting(p=0.04).Therewereno significant between-group differences in trunk or hipkinematics, or hip kinetics. Participants with FAIdemonstrated32%greaterpelvicriseonthesymptomaticside at heel contact with the step (p<0.05) and 34%greater after lifting the trailing leg during single-legsupport(p<0.05)comparedtocontrols(Figure1).
Figure1: Ensembleaverage (± standarddeviation)pelvicobliquitypatternsduringthestancephaseofstepascentfor control (blue) and FAI (red) participant groups. Theverticallineindicatesthebeginningofsingle-legsupport. The hip abductor muscles have an important role inoptimisingthepositionofthepelvisrelativetothefemurduringsinglelegweightbearingtasksandarethuscriticalto prevent movement into a position that impinges thehip. Increasedpelvicriseonthesymptomaticside(pelvicobliquity) in individuals with symptomatic FAI may be aconsequence of abductor muscle weakness (previouslyreportedinthesepatients[3]).Althoughtheimplicationsof these findings for symptoms and function arenot yetclear, they may suggest a compensatory strategy withpossible long-term consequences (e.g. increased load onadjacent jointsorthecontralateralhip;sustainedmuscleweaknessleadingtosuboptimaljointmechanics).CONCLUSIONSBiomechanicalalterationsareevidentatthepelvisduringstep ascent in individuals with symptomatic FAI. Thesebiomechanical changes may put additional stress onadjacentregionsandhaverelevanceforrehabilitation.REFERENCES[1]GanzR,etal.ClinOrthopRelatRes417:112–20,2003.[2]AgricolaR,etal.NatRevRheum9(10),630-634,2013. [3]DiamondL,etal.JSciMedSportDOI:10.1016/j.jsams.
2015.10.002,2015.
Table1:Demographicandclinicalcharacteristicsforfemoroacetabularimpingement(FAI)andcontrolgroups.
Group Age(yrs) Males Height(m) BMI (kg/m2)
FAItype(cam:combined)
Dominantsidetested,n(%)
TegnerActivityLevel(0-10)
Pain(0-10)δ
FAI(n=15) 24.7(4.9) 11(73%) 1.76(0.09) 24.4(2.5) 11:4 10(67%) 5.2(2.1)* 1.3(1.4)Control(n=11) 26.0(4.5) 8(72%) 1.78(0.08) 23.6(2.0) - 6(54%) 6.7(1.0)* -
Valuesaremean(standarddeviation)unlessotherwisestated;*P<0.05.

MUSCLE CONTRIBUTIONS TO KNEE JOINT MOMENTS IN CHILDREN WITH CEREBRAL PALSY: A TWIN CASE STUDY Giorgio Davico1, Claudio Pizzolato1, Steve Obst1, David Lloyd1, Christopher Carty1
1 School of Allied Health Sciences and Menzies Health Institute Queensland, Griffith University, QLD, Australia
INTRODUCTION Cerebral palsy (CP) is a non-progressive disorder of the neuromuscular system caused by damage to the brain during early development. Compared to typically developed children, those with CP have impaired gait due to their abnormal motor control and altered muscle growth [1].
Musculoskeletal (MSK) modelling is emerging as a useful clinical tool, providing insight into the mechanisms that contribute to pathological gait. Muscle force contributions to gait are of particular interest in the evaluation of MSK disorders and can also be used to quantify joint loading [2]. Static optimisation is commonly used to resolve muscle force contributions in MSK models; however, this method may not be appropriate for pathological gait when minimising the sum of squared muscle activations, since muscle activations in CP are quite aberrant with high levels of co-contraction.
We recently assessed the gait of two identical twins, one who was typically developed and the other with CP. The aim of this case study was to determine muscle force contributions at their knees during gait using both static optimisation and an electromyogram (EMG)-driven approach with a specific focus of muscles that actuate the knee joint. We hypothesised that muscle force contributions would be similar between the twins when using static optimisation but larger in the CP twin when adopting the EMG-driven approach. METHODS Two twin brothers (13 yo), one typically developed (height = 169.0 cm, mass = 59 kg) and one with CP (height = 171.8 cm, mass = 59 kg) were recruited as part of a larger study approved by the Griffith University Human Research Ethics Committee.
Reflective markers were attached to the trunk, pelvis and lower limbs in accordance with [3] and EMG electrodes were placed on the Gastrocnemii, Soleus, Tibialis Anterior, Semimembranosus, Biceps Femoris, Sartorius, Tensor Fasciae Latae, Gracilis, Vastus Medialis and Lateralis and Rectus Femoris muscles. Participants first walked on a treadmill at three speeds and then performed overground walking at preferred walking speed, maximal vertical jump and calf raise trials.
Marker trajectory reconstruction and labelling were performed in Vicon Nexus (v2.3). EMG signal processing and definition of the maximal muscle activation was performed in MOtoNMS. MSK model scaling (Gait2392), inverse kinematics, inverse dynamics, muscle analysis and static optimisation was performed in OpenSim (v3.3)) and EMG-driven analysis was performed using CEINMS [4]. Musculotendon and activation parameters were calibrated prior to the
EMG-driven analysis [5]. Dependent variable included ankle and knee joint kinematics and kinetics, and summed muscle force contributions to the knee joint moment using static optimisation and CEINMS.
RESULTS AND DISCUSSION The results are for one walking trial at preferred walking speed on the treadmill. The twin with CP had increased ankle plantarflexion and knee flexion during mid-stance with associated increased ankle plantarflexion and knee extension moments compared to his twin brother.
Static optimisation results showed a large contribution from the knee extensor muscles during mid-stance in the twin with CP to overcome the internal knee extension moment (Figure 1A). In comparison, EMG-driven muscle simulations revealed an overall increased forces produced by both knee flexors and extensors throughout the stance phase of the gait for both twins, with the CP twin again demonstrating a larger contribution from the knee extensors during mid-stance (Figure 1B).
CONCLUSIONS The summed force contribution of the knee extensor and flexor muscles in typical developed and CP gait may be underestimated using static optimisation. Thus, the corresponding joint contact forces calculated may also be underestimated. Moreover, our results demonstrate the ability of CEINMS to account for additional muscle co-contraction in both typical paediatric and CP gait, which would be expected for both when walking on a treadmill. REFERENCES [1] Barber L. et al., Dev Med Child Neurol, 55: 202, 2013. [2] Graham D. et al., J Biomech, 2016 (In press). [3] Kainz H. et al., J Biomech, 49: 1658-69, 2016. [4] Pizzolato C. et al., J Biomech, 48: 3929-36, 2015.
[5] Modenese L et al., J Biomech, 49: 141-8, 2016.
Figure 1: Knee extensor and flexor muscles contributions to the knee joint moment throughout gait estimated using (A) static optimisation, and (B) EMG-driven approaches. Typically developed = solid line, CP = dashed line.
-1.25
-0.75
-0.25
0.25
0.75
1.25
0 50 100Torq
ues
[N
-m/k
g]
Gait cycle (%)
-1.25
-0.75
-0.25
0.25
0.75
1.25
0 50 100
Gait cycle (%)
A B

SIMULATING THE EFFECT OF MUSCLE WEAKNESS AND CONTRACTURE ON NEUROMUSCULAR CONTROL OF NORMAL GAIT IN TYPICALLY DEVELOPING CHILDREN
Aaron Fox1, Christopher Carty2, Luca Modenese2,3 and Glen Lichtwark1 1 Centre for Sensorimotor Performance, University of Queensland, QLD, Australia
2 School of Allied Health Sciences and Menzies Institute Queensland, QLD, Australia 3 Department of Mechanical Engineering, University of Sheffield, United Kingdom
INTRODUCTION Cerebral palsy (CP) is caused by a lesion to the brain at or near the time of birth. Patients with hemiplegic CP often demonstrate an equinus gait pattern (i.e. toe-walking) during the stance and/or swing phase of gait [1]. Musculoskeletal modelling and simulation have become useful tools for evaluating pathological control of gait [2]. Muscle weakness and contracture are two common musculoskeletal deficiencies linked to CP [3,4]. Conducting simulations with muscle properties that resemble these deficiencies may elicit further understanding of the control strategies required, or factors that limit normal gait in this population. This may assist in developing targeted interventions aimed at improving gait function in children with CP. The purpose of this study was to examine the effect of simulated muscle weakness and contracture on the neuromuscular requirements for achieving normal walking gait. METHODS Nine typically developing children (10.0 ± 2.1 yrs; 140.2 ± 22.13 cm; 28.8 ± 10.5 kg) with no known gait abnormalities participated in this study. Three-dimensional kinematics and kinetics were collected during three trials of overground walking at a self-selected speed. Muscle-driven simulations of a representative gait cycle for the right leg were generated from each trial using OpenSim 3.3. The segment lengths and muscle strength of a generic musculoskeletal model of the pelvis and lower limbs were scaled to each participant. Joint angles and moments were calculated using inverse kinematics and dynamics, with dynamic inconsistencies resolved via application of a residual reduction algorithm. The muscle excitations required to drive the simulation were then estimated using computed muscle control.
Additional muscle-driven simulations of gait were generated for each participants trials using altered muscle parameters. The medial and lateral gastrocnemius, soleus and tibialis anterior were progressively weakened by reducing the maximal isometric force by 15% and 30%. The tendon slack lengths of the medial and lateral gastrocnemius, and soleus were shortened by 1.5% and 3.0% to simulate muscle contracture (i.e. increased effective stiffness). All combinations of muscle weakness and contracture were tested, resulting in nine muscle-driven simulations per trial. Reserve actuators were included for each degree of freedom to ensure simulations ran where the muscles could not generate sufficient torques. Muscle activations and forces from the simulations were examined and compared.
RESULTS AND DISCUSSION Muscle activations and forces generated by the muscles crossing the hip and knee were largely unaffected by the simulated changes in muscle strength and stiffness, and large contributions (i.e. > 5% of the peak joint moment) of reserve actuators at the hip and knee were not required across any simulations.
Shorter tendon slack lengths without a concomitant reduction in muscle strength was the major limiting factor in being able to achieve normal gait within the activation constraints of the calf muscles. Large reserve torques were required at the ankle during the initial swing phase of gait under these simulation conditions. The increased resistance to stretch combined with normal strength resulted in larger passive forces from the plantarflexors during the initial swing phase and prevented the ankle from shifting to a dorsiflexed position without additional assistance from reserve actuators. Strengthening of the plantarflexors may need to be balanced by reductions in stiffness or simultaneous strengthening of the dorsiflexors to promote normal gait in children with CP.
The maintenance of normal gait appeared robust to muscle weakness in isolation or when combined with shorter tendon slack lengths. The main compensation for isolated muscle weakness was to increase the activation of the weakened muscle, similar to previous findings [5]. Combined muscle weakness and contracture resulted in reduced activation of the gastrocnemi during the stance phase of gait, with lower activations required with greater effective stiffness. The passive tension generated by the stiffened plantarflexors through mid-stance likely reduced the need to generate active force during this phase of gait. While neuromuscular adaptations to maintain normal gait were identified, children with CP may be unable to employ these. Across all simulations, the activation patterns and levels used may not be voluntarily achievable by children with CP [1,4]. CONCLUSIONS Normal gait may be attainable with weak and contractured muscles. However, improvements in neuromotor control of the lower limb are likely required for this to be achievable by children with CP. REFERENCES [1] Romkes J & Brunner R. Gait Posture, 26: 577-86, 2007. [2] Steele K et al. J Biomech, 45: 2564-69, 2012. [3] Barber L et al. J Biomech, 44: 2496-500, 2011. [4] Stackhouse S et al. Muscle Nerve, 31: 594-601, 2005. [5] van der Krogt M et al. Gait Posture, 36: 113-9, 2012.
LIST OF PARTICIPANTS
First Name Last Name Institution / Organisation
David Ackland University of Melbourne
N. Ekin Akalan Istanbul University
Kim Allison University of Melbourne
Morris Ark University of Sydney
Thiranja Babarenda Gamage University of Auckland
Jasvir Bahl University of South Australia
Sarah Barns Queensland University of Technology
Rod Barrett Griffith University
Martina Barzan Griffith University
Christian Bauer Event Photographer
Thor Besier University of Auckland
Lynne Bilston Neuroscience Research Australia
Samantha Birse La Trobe University
Stephanie Blair Victoria University
Carina Blaker University of Sydney
Romane Blanchard University of Melbourne
Pavel Bogachko Qualisys
Bart Bolsterlee Neuroscience Research Australia
Sara Brice James Cook University
Warren Brooks Kistler
Adam Bryant University of Melbourne
Pascal Buenzli Monash University
Dianne Cameron Monash Health
Christopher Carty Griffith University
Luke Champion Swinburne University
Aaron Chin Vicon
Rachel Choi University of Sydney
Julie Choisne University of Auckland
Peter Choong University of Melbourne
Alexander Christov St Vincent's Hospital Melbourne
Elizabeth Clarke University of Sydney
Matt Clarke I Measure U
John Clement University of Melbourne
Gino Coates University of Melbourne
Eduardo Cofré Lizama University of Melbourne
Celeste Coltman University of Wollongong
David Cooper University of Saskatchewan
Max Cowen Logemas
Loyola D'Silva Springer
Arkiev D'Souza Neuroscience Research Australia
Christian Daish University of Melbourne
First Name Last Name Institution / Organisation
Giorgio Davico Griffith University
Alasdair Dempsey Murdoch University
Laura Diamond Griffith University
Stephen Dickins Head to Foot Orthotics
Ami Drory Australian National University
Suzi Edwards University of Newcastle
Ali Entezari University of Sydney
Ferryanto Ferryanto Tokyo Institute of Technology / Institut Teknologi Bandung
David Findlay University of Adelaide
Aaron Fox University of Queensland
Catherine Galvin University of Canberra
Georgia Giblin Queensland Academy of Sport
Wendy Gilleard Southern Cross University
James Graham AIMedical
Desney Greybe University of Auckland
YuanTong Gu Queensland University of Technology
Daniel Hageman University of New South Wales
Michelle Hall University of Melbourne
Christopher Hall Australian Synchrotron
Shigeto Hayashi Kyoto Institute of Technology
Pendar Hazrati University of Sydney
Rob Herbert Neuroscience Research Australia
Peta Hitchens University of Melbourne
Ben Hoffman University of Southern Queensland
Adrienne Hunt University of Sydney
Jennifer Jackson Technic Pty Ltd
Tim Jarrot Head to Foot Orthotics
Corey Joseph Monash Health
Crystal Kean Central Queensland University
Azadeh Kian University of Melbourne
Bryce Killen Griffith University
Hiroshi Kinoshita Osaka University
Melissa Knothe Tate University of New South Wales
Fred Koshir TA Instruments
Martin Leary RMIT University
Gökçe Leblebici Istanbul University
Peter Lee University of Melbourne
Gavin Lenton Griffith University
Chloe Lerebours Monash University
Amy Lewis University of Adelaide
Qing Li University of Sydney
Zihui Li ETH Zürich
Glen Lichtwark University of Queensland

First Name Last Name Institution / Organisation
Bernard Liew Curtin University
Joe Lynch Australian National University
Jayishni Maharaj University of Queensland
Saulo Martelli Flinders University
Joshua Mattock University of Wollongong
Maciej Mazur RMIT University
Jodie McClelland La Trobe University
Chris McCosker Queensland Academy of Sport
Frank McGuire MP Parlimentary Secretary for Medical Research, Victoria
Patrick McLaughlin Novel
Aaron Melrose Victoria University
Karen Mickle Victoria University
Emma Millett New South Wales Institute of Sport
Patricio Miranda University of Queensland
Ethan Moore Swinburne University / University of Adelaide
Alex Muir Logemas
Chris Muir Logemas
Ralph Müller ETH Zürich
Anna Murphy Monash Health
Kevin Netto Curtin University
Joanna Ng University of Wollongong
Lucy Ngo University of New South Wales
Tam Nguyen University of Melbourne
Leila Nuri Griffith University
Cathal O'Connell University of Wollongong
Andrea O'Connor University of Melbourne
Damien O'Meara New South Wales Institute of Sport
Marcus Pandy University of Melbourne
Elyse Passmore University of Melbourne
Andrew Pearce AIMedical
Simon Pearson Queensland Academy of Sport
Andre Pereira University of New South Wales
Elissa Phillips Australian Institute of Sport
Peter Pivonka University of Melbourne
Claudio Pizzolato Griffith University
Leanne Purcell Paediatric Gait Analysis Service of NSW
Timo Rantalainen Deakin University
Aaqil Rifai RMIT University
Bryant Roberts Flinders University
Will Robertson University of Adelaide
Dale Robinson University of Melbourne
Marcel Rossi University of Western Australia
Atsushi Sakuma Kyoto Institute of Technology

First Name Last Name Institution / Organisation
Morgan Sangeux The Royal Children's Hospital Melbourne
Avik Sarker RMIT University
David Saxby Griffith University
Andrew Schaefer Chales Sturt University
Corey Scholes EBM Analytics
Sarah Shultz Massey University
Prasanna Sritharan University of Melbourne
Julie Steele University of Wollongong
Kathryn Stok University of Melbourne
Christopher Sutton Tracklab
David Thomas University of Melbourne
Doreen Thomas University of Melbourne
Cassandra Thompson Western Sydney University
Alessandro Timmi University of Melbourne
Silvia Trichilo University of Melbourne
Logan Wade University of Queensland
Sarah Ward University of Melbourne
Amy Waters Australian Institute of Sport
Lindsay Welch James Cook University
Benchawan Wiwatanapataphee Curtin University
Elizabeth Wojciechowski Sydney Children’s Hospitals Network
Carolina Wood 'Talk Me Up' Marketing
Tim Wrigley University of Melbourne
Alex Lei Zhao University of Auckland


