Embed Size (px)
Citation preview


Annual Report 2008-2009 BASF India Limited
2003-04 2004-05 2005-06 2006-07 2007-08 2008-09
Sales 6533 7402 7716 8750 10306 12381
Profit before tax 513 601 706 781 930 1080
Profit after tax 341 380 454 501 594 686
Total assets 4046 4138 3986 4594 5246 6509
Borrowings 670 100 13 5 — —
Shareholders’ equity 2318 2535 2764 3034 3397 3852
Depreciation 212 244 221 109 136 152
Capital expenditure 47 76 143 451 309 416
Exports 511 564 252 320 373 571
R & D cost 16 20 37 48 76 96
Personnel cost (Total) 456 486 572 684 817 887
Dividend amount 169 169 197 197 197 197
Dividend in % 60 60 70 70 70 70
Number of employees 917 833 817 801 836 858
Number of shareholders 32831 29493 29684 33042 29631 25606
BASF India Limited Financial Highlights – At a glance
Rs. in Million
Message from the Chairman & Managing Director
Dear Shareholders,
The global financial crisis and its implications on the developed
world are still unravelling. However, India, with its robust
domestic-oriented economy, coupled with well-timed fiscal
and monetary measures taken by the government, is already
rebounding. At BASF, although sales and profitability of some
of our segments got affected during 2008-2009, our balanced
portfolio helped us remain resilient. With a strong business
foundation and one of the best teams on board, we have been
operating with excellent cost efficiency and budget discipline.
Your company derived opportunities from the current situation
and the sales and profit have grown by 20% and 16%
respectively.
Our focus on nurturing Partnerships and Excellence has won
us accolades across platforms. Being rated as the World’s
Most Admired Chemical Company by the Fortune Magazine
has not only made us all proud but also further motivated us
to raise our standards of performance. BASF Kids’ Lab aboard
the Science Express is now part of the Limca Book of Records
2009 for hosting a mobile laboratory, where 15,000 students
performed live experiments.
Employee engagement has been taken a notch higher, by
launching the C.A.R.E. initiative, which emphasized the
importance of Behavioral Safety at all times.
Together, we are confident of setting higher standards for
ourselves and the Chemical industry.
Thank you for your trust and confidence and I look forward to
your continued interest and support.
Warm Wishes,
Prasad Chandran
BASF Kids’ Lab aboard Science Express enters the Limca Book of Records 2009.
Cover 2&3.indd, Spread 2 of 2 - Pages (2, 3) 6/27/2007 12:32 PM

BASF India Limited 1
Friday, 21st August, 2009 at 3.00 p.m. at Yashwantrao Chavan Pratishthan Auditorium, Y. B. Chavan Centre, General Jagannath Bhosale Marg, Nariman Point, Mumbai - 400 021.
Agenda
1. Presentation of Financial Statements and the Directors’/Auditors’ Report
2. Declaration of Dividend
3-4. Appointment of Directors
5. Appointment of Auditors
6-9. Special Business
The Notice of the Meeting is enclosed.
BASF India LimitedRegistered Office: RBC, Mahindra Towers, 1st Floor, ‘A’ Wing, Dr. G.M. Bhosale Marg, Worli, Mumbai - 400 018. Phone : 6661 8000 www.basf-india.com
Works
Thane-Belapur Road, Turbhe, Navi Mumbai - 400 705, Maharashtra.
Bala/Thokur Village, Surathkal-Bajpe Road, Mangalore Taluka, Dakshina Kannada District, Karnataka - 575 030.
83/2, Demni Village, Dena Bank Road, Dadra - 396 191. Union Territory of Dadra & Nagar Haveli
Branches
Ahmedabad, Chennai, Delhi, Kolkata
Registrar and Share Transfer Agents
Sharepro Services (India) Private Ltd., Unit : BASF India Limited, 13AB, Samhita Warehousing Complex, 2nd Floor, Sakinaka Telephone Exchange Lane, Off. Andheri Kurla Road, Andheri (East), Mumbai - 400 072 Tel. No. : 022-2851 1872, 6772 0300, 6772 0400 Fax No. : 022-2859 1568 Email : [email protected]
65th Annual General Meeting
Contents
Page
Board of Directors 2
Directors’ Report 3
Management Discussion and Analysis Report 10
Report on Corporate Governance 15
Auditors’ Report 25
Balance Sheet 28
Profit & Loss Account 29
Cash Flow Statement 30
Schedules to Balance Sheet 31
Schedules to Profit & Loss Account 34
Accounting Policies and Notes to Accounts 36
Balance Sheet Abstract and General Business Profile 51
Information pertaining to BASF Polyurethanes India Limited (Subsidiary)
Directors’ Report 52
Auditors’ Report 57
Balance Sheet 60
Profit & Loss Account 61
Cash Flow Statement 62
Schedules to Balance Sheet 63
Schedules to Profit & Loss Account 66
Accounting Policies and Notes to Accounts 68
Balance Sheet Abstract and General Business Profile 78
Information pertaining to Consolidated Financial Statements
Auditors’ Report 79
Balance Sheet 80
Profit & Loss Account 81
Cash Flow Statement 82
Schedules to Balance Sheet 83
Schedules to Profit & Loss Account 87
Accounting Policies and Notes to Accounts 89

2 Annual Report 2008-2009
Mr. Prasad Chandran Chairman and Managing Director
Dr. Rainer Diercks
Mr. R.Y. Vaidya Alternate to Dr. Rainer Diercks
Dr. Tilman Krauch
Mr. Deepak Thuse Alternate to Dr. Tilman Krauch
Mr. Hermann Althoff
Mr. S. Ramnath Alternate to Mr. Hermann Althoff
Mr. K.R. Coorlawala
Mr. R.R. Nair
Mr. Pradip P. Shah
Mr. R.A. Shah
Executive Committee
Mr. Prasad Chandran
Mr. P.M. Balakrishnan
Mr. M.R. Iyer
Mr. Narayan Krishnamohan
Mr. P. Ganguly
Mr. Sandeep Gadre
Dr. G. Ramaseshan
Mr. S. Ramnath
Mr. Deepak Thuse
Mr. R.Y. Vaidya
Mr. Vivek Bapat
Mr. Murli Ramalingam
Mr. Mandar Joshi
Company Secretary
Mr. M.R. Iyer
Auditors
Messrs B S R & Co., Chartered Accountants
Solicitors
Messrs Crawford Bayley & Co.Messrs Udwadia & Udeshi
Bankers
Citibank N.A
Deutsche Bank
HDFC Bank Limited
Standard Chartered Bank
Internal Auditors
Messrs Mahajan & Aibara Chartered Accountants
Board of Directors

BASF India Limited 3
Your Directors have pleasure in presenting their Report for the financial year ended 31st March, 2009.
Financial Results
(Rs. in Million)
Year ended 31.3.2009
Year ended 31.3.2008
Sales 12381.1 10360.2
Profit before tax 1080.1 930.0
Tax 393.7 336.3
Profit after tax 686.4 593.7
Balance brought forward 264.0 231.0
Available for appropriation 950.4 824.7
This has been appropriated as follows:
Proposed Dividend 197.3 197.3
Corporate Tax on Dividend 33.6 33.6
General Reserve 455.5 329.8
Balance carried forward 264.0 264.0
Activities
The performance of your Company during the year under report registered an improvement over the previous year. Sales at Rs. 12381 million and Profit before tax at Rs. 1080 million during the year ended 31st March, 2009 represent an increase of 20% and 16% respectively, over the previous year. This increase was mainly on account of higher capacity utilization, improved operating results of the Agricultural Solutions, Performance Products and Chemicals businesses.
Profit after tax at Rs. 686.4 million was higher by 16% compared to the previous year.
The Agricultural Solutions business recorded higher sales and profits during the year ended 31st March, 2009 mainly due to higher realizations, effective working capital management and marketing initiatives, undertaken during the year under report.
The Plastics business registered marginal increase in sales as compared to the previous year. The Performance Products segment which include textiles, dispersions, specialty and leather chemical businesses registered increase in sales, both in volume and value terms. Dispersions business registered substantial increase in sales and profits as compared to previous year.
The Chemical business registered improved results, compared to the previous year.
Directors’ Report
Mr. Prasad Chandran inaugurates Chemspec India 2009, the annual exhibition organized by Chemical Weekly.

4 Annual Report 2008-2009
Capacity utilization in all segments of business was higher compared to the previous year. The global economic slowdown resulted in weak demand and pressure on sale prices and margins. The export sales at Rs. 570.7 million during the year under report represented an increase of 53% over the previous year.
During the year under report, the Company has initiated steps to set up Engineering Plastics compounding plant at its existing site at Navi Mumbai. This plant will have the capacity of 9000 TPA which will cater to automobile, electrical switchgear and telecommunication industries. A Computer Aided Engineering laboratory was also set up to design & optimize new engineering plastics parts in close co-ordination with customers.
Dividend
Your Directors recommend payment of dividend on the equity shares @70% (Rs. 7/-per share) for the financial year ended 31st March, 2009. The dividend will absorb Rs. 197.3 million.
Consolidation of holding
BASF SE, the parent Company of your Company, has increased its stake from the present 52.69% to 71.18% of the voting capital of your Company through open offer process during the year under report.
Finance & Accounts
With focus on cash flows and working capital management, your Company continued to restrict the bank borrowing to absolute minimum during the year. Internal cash accruals were effectively used for funding working capital needs and capital expenditure requirements of the Company.
Capital Expenditure
Capital Expenditure incurred during the year aggregated to Rs. 415.6 million.
Fixed Deposits
Your Company continued to maintain the highest rating of ‘FAAA’ awarded by CRISIL. Your Company did not accept any fixed deposits during the year under report. There were no overdue deposits except unclaimed deposits of Rs. 0.6 million as at 31st March 2009.
Your Company transferred unclaimed fixed deposit of Rs. 0.1 million during the year to the Investor Education and Protection Fund.
Management Discussion & Analysis Report
In terms of Clause 49 of the Listing Agreement with the Stock Exchanges, the Management Discussion & Analysis Report is appended to this Report.
Wholly owned Subsidiary
BASF Polyurethanes India Limited (BPIL), the wholly owned subsidiary of your Company, recorded Sales at Rs. 2185.4 million as against Rs. 1567.7 million in the previous year. However, BPIL posted a loss of Rs. 200.5 million during the year ended 31st March, 2009 mainly on account of high fluctuations in raw material prices.
BASF SE had a discretion to acquire the Company’s holding in BPIL. During the year under report, BASF SE had exercised its discretion to acquire the entire equity shareholding in BPIL vide its letter dated 30th October, 2008 subject to conditions detailed therein. A committee constituted by the Board is examining the matter and would recommend further course of action.
The Audited Accounts of the Subsidiary and the Auditors’ report thereon form part of this Annual Report.
Financial Ratios2008-09 2007-08
Equity vs Total Assets (%) 59.20 64.75
Return on Capital Employed (%) 30.21 29.30
before interest and taxes
Profitability of total income (%) 8.78 9.11
before interest and taxes
Current Ratio 2.02 2.38
current assets :
short term liabilities and provisions
Acid Test Ratio 1.20 1.62
short term receivables plus
cash and cash items:
short term liabilities and provisions

BASF India Limited 5
Corporate Governance
Your Company always strived to incorporate appropriate standards for good corporate governance. Your Company has complied with the Corporate Governance requirements as per Clause 49 of the Listing Agreements with the Stock Exchanges.
A separate report on Corporate Governance along with a Certificate of Compliance from the Auditors, forms part of this report.
Directors’ Responsibility Statement
Your Directors confirm:
(i) that in the preparation of the annual accounts, the applicable accounting standards have been followed;
(ii) that the Directors have selected such accounting policies and applied them consistently and made judgements and estimates that are reasonable and prudent so as to give a true and fair view of the state of affairs of your Company at the end of the financial year ended 31st March, 2009 and of the profits of your Company for that year;
(iii) that the Directors had taken proper and sufficient care for the maintenance of adequate accounting records in accordance with the provisions of the Companies Act, 1956, for safeguarding the assets of your Company and for preventing and detecting fraud and other irregularities;
(iv) that the Directors have prepared the annual accounts on a going concern basis.
Conservation of Energy, Technology Absorption and Foreign Exchange Earnings and Outgo:
Information pursuant to Section 217(1)(e) of the Companies Act, 1956, read with the Companies (Disclosure of Particulars in the Report of Board of Directors) Rules, 1988, is given in the annexure to this Report.
Directors
Dr. Tilman Krauch and Mr. Pradip P. Shah retire by rotation at the ensuing Annual General Meeting and being eligible, offer themselves for re-appointment.
As required under Clause 49 of the Listing Agreement with the Stock Exchanges, the details of Directors seeking reappointment at the ensuing Annual General Meeting is provided in the Corporate Governance Report, forming part of this Annual report.
Auditors
M/s. B S R & Co., Chartered Accountants, Mumbai retire at the forthcoming Annual General Meeting and are eligible for re-appointment.
Cost Audit
The Board of Directors in pursuance of an order under Section 233B of the Companies Act, 1956, issued by the Government have appointed M/s. R. Nanabhoy & Co., Cost Accountants, Mumbai as Cost Auditors of your Company for conducting audit of the cost accounts maintained by the Company in respect of Insecticides for the financial year 2009-10.
Particulars of Employees
The particulars of employees required to be furnished under Section 217(2A) of the Companies Act, 1956, read with the Companies (Particulars of Employees) Rules, 1975, forms part of this Report. However, as per the provisions of Section 219(1)(b)(iv) of the Companies Act, 1956, the Report and Accounts are being sent to all shareholders, excluding the statement of particulars of employees. Any shareholder interested in obtaining a copy may write to the Company Secretary at the Registered Office of the Company.

6 Annual Report 2008-2009
Personnel and Welfare
Industrial relations in the Mangalore, Navi Mumbai & Dadra factories remained cordial.
Your Directors express their sincere appreciation for the dedicated efforts put in by all the employees and for their continued contribution for ensuring higher performance of the Company during the year.
General
The Consolidated Financial Statements of your Company in this Annual Report are inclusive of the results of its subsidiary, BASF Polyurethanes India Limited.
On behalf of the Board of Directors
PRASAD CHANDRANChairman & Managing Director
Mumbai Dated : 16th April, 2009.
Dr. Martin Brudermueller, Member of the Board of Executive Directors – BASF SE, discusses the way forward with the Senior Management of BASF India in July 2008.

BASF India Limited 7
Annexure to the Directors’ Report Statement containing particulars pursuant to the Companies (Disclosure of Particulars in the Report of Board of Directors) Rules, 1988 and forming part of the Directors’ Report.
A. Conservation of Energy
The Company continued its policy of giving priority to energy conservation measures including regular review of energy generation, distribution and consumption and effective control on utilization of energy, in its manufacturing facilities at Navi Mumbai, Mangalore & Dadra.
During the year under report, various energy saving measures were implemented in the Company’s factories, which include:
• Installationofanewenergyefficientsteamboiler • Installationofcapacitorbankstoimprovepower. • Installationofenergyefficientsplitandwindowair-conditionersinplaceofexistingoldair-conditioners. • Installationofenergyefficientsteamtraps. • Installationofenergyefficientmotorsatsomeplaces. • Rationaliseprocessparameterstoreducebatchcycletimeofcertainprocesses. • Replacementofoldaircompressorsinaplantbyenergyefficientones. • Reducingworkinghoursbyimprovingmachineefficiencies.
• Reduction inspecificpowerconsumption inaplantby incorporatingfollowingmeasures/carryingoutmodificationsviz.,:
• Incorporatingmeasuresforswitchingcertainequipmentasperbatchrequirements. • Reducingrunhoursofanequipment,soastohavecampaignproduction. • Rationaliseprocessparameterstoreducebatchcycletimeofenergyintensiveproductionprocesses. • Reduceworkinghoursbyimprovingmachineefficienciesandnewpackingmodules/process. • InstallationofVFDsinutilitiessectionandoptimizingcompressedairinnitrogenusage. • InstallationofnewPLlampsforreductioninpowerconsumptioninwarehouses. • Rationalisethesystembyoptimizingtheburnernozzle. • Optimizingthecoolingwatercircuit.
• Reductionofenergyconsumptioninaplantby: • Installationofasteammetersforclosemonitoringandbettersteamtraps. • InstallationofpowersavingCFLights. • Installationofvariablespeeddrives.
• Reductioninprocesswaterconsumptioninaplantbyinstallationofflowmetersatdifferentlocations.The above measures not only resulted in significant savings in the total energy consumed but also had a positive impact on the environment.
In addition, the Company plans to implement the following energy conservation measures: • Introductionofexpressfeedertorationalizepowerdistributionsystem. • Replacementofwindowair-conditionerswithenergyefficientCFCfreesystem. • Recyclingofwaterandposttreatmentofeffluentfromaplant. • InstallationofN2plantwithnewaircompressor. • Installationofsteammetersandbettertrapstorationalisesteamconsumption. • Conversionofspraydryerandboilerintogasfiringinsteadofoilfiring, • Creatingawarenessforselfdisciplineinenergyconservation.
Requisite data in respect of Energy Consumption are given below:
Current Year 1.4.2008 to
31.3.2009
Previous Year 1.4.2007 to
31.3.2008
(a) Power & Fuel Consumption 1. Electricity (a) Purchased Units (in '000 kwh) 14517 15421 Total amount (Rs. in million) 69.06 73.96 Rate per unit (Rs.) 4.76 4.80

8 Annual Report 2008-2009
Current Year 1.4.2008 to
31.3.2009
Previous Year 1.4.2007 to
31.3.2008 (b) Own generation • Throughdieselgenerator Units (in '000 kwh) 1005 1205 Units per litre of oil 3.18 3.22 Cost per unit (Rs.) 11.36 11.36 • ThroughSteamTurbine/Generatorunits Units per litre of fuel N.A. N.A. Oil/gas Cost per unit 2. Coal (specify quality and where used) N.A. N.A Qty. (tonnes) Total cost Average rate 3. Furnace oil/fuels Qty. (k.litres) 3262 3665 Total Amount (Rs. in million) 87.22 69.52 Average rate (Rs./litre) 26.74 18.97 4. Others/Internal Generation (Qty.) N.A. N.A. Total cost rate/unit(b) Consumption per unit of production Products Expandable polystyrene Unit M.T. Electricity (kwh) 82 87 Furnace oil/fuels (litres) 33 26 Coal (specify quality) N.A. N.A. Others (specify) N.A. N.A. Leather chemicals, auxiliaries, pigments tanning and finishing agents
including metal complex dyes, acrylic polymers and carboxylated styrene butadiene lattices
Unit M.T. Electricity (kwh) 249 275 Furnace oil/fuels (litres) 44 42 Coal (specify quality) N.A. N.A. Others (specify) N.A. N.A. Pesticides
Unit M.T. Electricity (kwh) N.A. 58 Furnace oil/fuels (litres) N.A. 105 Coal (specify quality) N.A. N.A. Others (specify) N.A. N.A.
B. Technology Absorption RESEARCh & DEvELOPMENT (R&D): 1. Specific Areas in which R&D was carried out by the company. During the year, the R&D centre of the company was engaged in supporting all the businesses through
innovations and undertook multifold research activities including: • BasicResearch. • Developmentofnewproducts/formulations. • Developingcosteffectiveprocessesandstreamliningexistingprocessesintheareasofpaperchemicals,
leather chemicals, textile chemicals and other speciality chemicals/auxiliaries. • Optimizingeffulenttreatmentprocesses • Supportindentingactivities. The facilities at the R&D Centre were further augmented. A state of art new Pharma excipients formulations
research and application laboratory was established to carry out research on new Pharma formulations. Work on Global Research projects include: • Collaborative research with BASF SE in the areas of performance chemicals, intermediates and other
organic materials, ionic liquids etc. • Neworganicchemicalintermediatesforspecificapplications. • Textileauxiliaries. • Isolationofpotentialpesticidesfromnaturalsources.

BASF India Limited 9
2. Benefits derived as a result of the above R&D: With its endeavour to explore and apply new and innovative chemistry for the benefit of customers, the R&D
Centre developed new products during the year. Some of these new products were introduced in the market. Four new textile auxiliaries and one new agro formulation was developed as part of Global Research projects.
3. Future Plan of Action: Future plan of action of the R&D Centre include: • EnhancingglobalcollaborativeresearchwithBASFSE. • FocusondevelopmentalprojectsforIndiaandtheSouth-Asianregion. • FurthermodernizingofR&Dfacilities. • Developmentofinnovativeproductsandprocesses.
4. Expenditure on R&D:
Rs. in million
(a) Capital 5.90(b) Recurring 96.10(c) Total 102.00(d) Total R&D Expenditure as a percentage of total turnover 0.9%
TEChNOLOGY ABSORPTION, ADAPTATION AND INNOvATION:
1. Efforts in brief, towards technology absorption, adaptation and innovation: The R&D Centre of the Company is recognized by the Ministry of Science and Technology, Government of India.
The Centre is ISO 9000 and 9014 certified and undertake research in the areas including: • Neworganicchemicalintermediatesforvariousapplications. • Processdevelopmentandscale-up. • AgriculturalSolutions • Textileauxiliaries. • Leatherchemicals • Otherspecialitychemicals. The centre is also engaged in developmental activities including new cost effective technologies for existing
and new products, reduction in batch cycle time, etc., as also research activities pertaining to the adaptation of process technologies received from BASF SE.
2. Benefits derived and the results of the above efforts:
New products were developed and commercialized during the year. Efforts in process optimization led to cost reduction. This helped the businesses to remain cost competitive. Batch sizes and cycle times were optimized for better efficiency and manufacturing equipments were modified for overall improved productivity.
3. Imported Technology:
During the last 5 years, the Company entered into agreements with BASF SE for sourcing the following technical know-how:
• In2004formanufactureofnewproducts. • In2004formanufactureofexpandablepolystyrene. • In2006formanufactureofenginecoolant. • In2007formanufactureofperformanceproducts. • In2008formanufactureofEngineeringPlastics. The Company has excellent interaction with its parent Company BASF SE and receives on an ongoing basis,
valuable technical information and support. As a result, the Company introduced a range of new products in different business segments.
C. Foreign Exchange Earnings and Outgo
The particulars with regard to foreign exchange earnings and outgo appear on page 46 and 47 of the Annual Report and Accounts.
On behalf of the Board of Directors
PRASAD CHANDRAN Chairman & Managing Director
Mumbai Dated : 16th April, 2009.

10 Annual Report 2008-2009
Management Discussion and Analysis Report
After registering a healthy GDP growth of 9% in the last fiscal year, the Indian economy witnessed a deceleration in growth, since the third quarter of 2008-09, mainly due to the global economic slowdown. Estimates by various agencies indicate that the economy in the year 2008-09 is expected to grow between 6.5% -7.0%.
Consequent to the economic slowdown, growth in manufacturing sector had started tapering off since the first quarter of fiscal year 2008-09. The growth further declined in the second quarter and registered negative growth in the third quarter. Overall, the manufacturing sector is expected to grow at 3.4% in the fiscal year.
The products manufactured by the Company serve many end-use industries including agriculture, textiles, paper, pharmaceuticals, consumer durables, automobiles etc. Healthy growth of end-use industries is essential for performance of your Company. The end-use industries growth showed a mixed trend i.e. some showed substantial decline in growth rates compared to previous year; whereas others managed to register lower, but positive growth, compared to previous year.
Export dependent industries such as textile and leather bore the brunt of the global economic slowdown. Due to the tight monetary environment, demand for the automotive industry witnessed a drastic reduction. High inventory built-up at the customers’ end led to substantial reduction in petrochemicals demand. Consumer driven industries such as personal care, pharmaceuticals, paper and consumer durables however maintained positive growth rates, albeit at a slower rate, compared to previous year.
Various analysis suggests that the global economic slowdown is likely to continue during 2009-10, and possibly even beyond. Being a domestic focused economy, the impact for India is limited with reduced exposures to sub-prime lendings, adequately capitalized banks and the positive response by the Government including announcement of stimulus packages to boost economic growth. Ease in monetary policy would boost consumer sentiment. These measures are expected to have a positive impact in the industrial growth in 2009-10.
Plastics
The plastics division comprises of expandable polystyrene (Styropor) and performance polymers (engineering plastics).
Styropor is primarily used in the areas of packaging and insulation. The major end-user in the packaging segment include consumer electronics, white goods, fruits and vegetables export packaging. In the insulation segment, major consumers include cold storage and air-conditioned buildings.
Performance plastics are primarily used in the automotive, electrical switchgear and accessories and barrier films for packaging.
The expandable polystyrene (EPS) market is catered mainly by four manufacturers.
EPS customers, the processors (molders), convert raw material into finished product – expanded polystyrene. Many of these processors are now up-grading their facilities to achieve productivity and cost effectiveness. Electronics and consumer durables packaging is a major segment for EPS business.
The consumer durable industry had shown a healthy growth trend during first half of the year; however this growth got negated during the second half.
Dr. Tilman Krauch, President, Regional Functions and Country Management Asia Pacific along with Mr. Prasad Chandran and Mr. Vaidya at the release of 7th Annual EHS Report in August 2008.

BASF India Limited 11
The weakening rupee and under utilized capacities in Asia could impact the margins.
The Styropor business recorded volume growth. This enabled the business to sustain its position in the market.
During second half of the year, due to global recession, styrene monomer prices dropped drastically impacting the operations. However, adroit customer management initiatives coupled with inventory management stabilized the situation.
The outlook for plastics business is favourable.
Performance Products
The performance products business include performance chemicals and functional polymers. This business cater to the requirement of a wide spectrum of industries including textile, leather, plastics and coatings, specialities, detergent formulators, automobile and oil.
In the leather chemical business, turnover and volume was lower compared to the previous year. The leather industry during the financial year witnessed weak global demand, drop in production, unprecedented increase in input costs, idling labour due to lack of orders from Europe & US.
Global demand at the retail level was weak and wide fluctuation in foreign exchange rates was detrimental to long term contracts in leather industry. The prices of raw materials and its availability was of concern and the entry of medium and small companies made the competition intense in the market place.
Performances of most of the product groups of the business other than the Dyes Solution segment were lower compared to the previous year. Dyes Solution grew significantly due to Eukesolar exports.
The South Asia Technical Centre for Leather set up at the Navi Mumbai factory to meet the technical requirements of the market was well utilized. Imports of finished leather are expected to grow, due to demand for good quality leather.
Despite difficult market situation, this business generally maintained its market share in the segments it operated.
The global turmoil in the financial market significantly slowed down retailer buying activities. With consumer confidence in developed markets at an all time low, Indian textile exporters are facing lull in orders and lower capacity utilization.
Most of the capacity expansion plans and greenfield projects by textile mills have been deferred or kept in abeyance.
The industry also witnessed introduction and strengthening of strict environmental norms. New opportunities are expected in following segments – Home textiles, Technical Textiles.
The textile chemicals market comprises of diverse players in terms of size, from single product suppliers to suppliers offering chemicals for the entire value chain along with added services such as specialized fabric testing and certification.
The Indian textile chemicals market valued at around Rs. 15,500 Mio is expected to be stagnant during 2009. The fluctuation in input costs have resulted in lower margins for textile chemical suppliers.
The acrylics and dispersion businesses cater to an array of industries including paper, paints, construction and adhesives. All market segments registered significant growth during the year. Investments in construction segment, both infrastructure and real estate, and overall growth in private consumption contributed to the performance of this business.
The thrust on infrastructure development was maintained by the Government during the year. As a result, significant growth was witnessed in the construction and paint industry.
The dispersions demand witnessed high growth in the first half of the year. In quarter 3, there was a general slowdown, especially in the paint and construction segments.
During the year, the business significantly increased sales due to the timely expansion of production facilities at Mangalore, coupled with higher technical service. Overall, the business achieved a satisfactory volume growth.
The Styropor Deluxe Grade makes a grand entrance! Mr. Prasad Chandran, Dr. Giorgio Greening and Mr. Deepak Thuse launch this innovative new product at Chandigarh.

12 Annual Report 2008-2009
The business achieved significant growth during the year, despite competition from both domestic and international players. The volatility in petrochemical feedstock pricing coupled with sharp depreciation of the rupee during the year were unexpected developments which were managed with prudent management of inventories.
During the year, this business launched innovative new products and increased technical services. New products were launched for paper and architectural coatings.
The construction and paper businesses maintained steady growth on a year on year basis. This growth could be achieved as a result of introduction of innovative products coupled with strong technical service. The architectural coatings business witnessed good growth during the year. Exports to South Asian countries and the Middle East registered strong growth during the year.
The major players in the paper industry have expanded production capacity in line with the growing demand in the country. The new machines being installed are of higher capacities. The major producers are also employing the latest technologies which enable them to compete on cost as well as quality, in the global arena.
BASF, being the world leading supplier of products to the paper industry is perfectly placed to meet the growing needs of the Indian paper industry, with its expanded capacity and innovative product range.
Volatility in pricing of feed stocks and exchange rates are potential threats to this business. Overcapacities in international markets amidst the global slowdown gave rise to potential increase in imports, which could have a detrimental effect on the dispersions business.
The dispersion business is expected to grow further in the coming year, thereby increasing the capacity utilization of the expanded plant at Mangalore. Strong demand growth from the paper industry and a recovery in demand from the paint and construction segments are supporting the growth of this business.
Turnover and volume grew significantly over the previous year. While margins are expected to remain under pressure on account of volatile raw material prices and exchange rates, higher plant utilization rates are expected to contribute positively to the bottom line.
Demand for pigments, resins and UV stabilizers were lower in quarter 3 and 4 of the financial year. To respond quickly to customer needs and make its customers more successful, an application laboratory to enhance technical services was started at Navi Mumbai. Also, the general slowdown in the automotive industry, since the last quarter 2008 affected sale of automotive fluids. However, sale of refinery chemicals improved.
Care Chemicals business grew compared to the previous year. Personal Care Ingredients/Aroma chemicals business maintained its growth pace. Nutrition business with its balanced portfolio had a successful year. Growth areas have been identified in segments like food fortification and vitamins for dietary supplements. The Pharma sector witnessed growth and BASF has been successful in making new chemistries for Pharma. An application laboratory was opened at Navi Mumbai to cater to the application demands of the Pharma industry for BASF products. New products launched have been well accepted.
The Detergents and Formulators activity witnessed good growth. To improve profitability, locally produced “Sokalan" polymers will be promoted to new areas of application.
Chemicals
The chemicals supplied by BASF Group cater to the requirement of a wide range of user industries including crop protection, pharma, food and feed, plastics and fibers, refining, water treatment and coatings. These industries produce industrial and consumer products in the primary and secondary sectors. Sectors like textile, rubber, coatings have been impacted adversely because of global economic downturn and consequent impact on the business environment.
During the financial year 2008-09, with the robust performance of Indian agriculture, the intermediates chemicals division witnessed involved activity and buoyancy. The intermediates going into agrochemicals sector saw substantial growth. Another growth area during the year was in specialities segment, the applications of which include pharmaceuticals and coatings. Coatings sector for the commodities was marked by significant slowdown in the industry due to automotive manufacturing dip in 3rd and 4th quarter of this year.
Dr. Wolfgang Hapke, President, Market and Business Development, Asia Pacific (centre) along with Mr. Chandran and Mr. Hermann Althoff, Group Vice President, Engineering Plastics, Asia Pacific, at a Press Conference organized by Team Automotive India, BASF’s integrated approach to the Automotive Industry.

BASF India Limited 13
During the coming financial year, chemical intermediates used for agrochemicals as well as pharma applications are expected to increase. Pharmaceutical customers are re-aligning their strategies and the intermediates division is well positioned to support them, with a wide array of products made all over the globe, as well as support with R & D inputs from BASF group.
Demand for coatings is expected to revive in construction (infrastructure) and white goods segments. Food and feed industry, as well as leather and textiles industry will remain a growth avenue for intermediates.
The business had engaged in customer focused activities, in emerging areas of agrochemicals, new pharmaceuticals, textile related applications and is poised to utilize its resources to register growth in the coming year.
Performance of plasticizers and solvent segment was lower compared to the earlier year. The catalyst business which include refinery/polyolefin/absorbent/petrochemical catalysts was satisfactory. The inorganic business performance was lower compared to the previous year.
Agricultural Solutions
The Agricultural Solutions business include insecticides, herbicides, fungicides and specialties.
Food grain production in 2008/09 estimated at 228 million tons registered increase compared to the previous year. The forecast for Agricultural growth in 2009 is also positive.
The agro chemicals industry witnessed a year of mixed results. The first three quarters witnessed robust price increases in agricultural produce and agro chemicals products. The last quarter witnessed softening of generic product prices that left many players with high priced inventories. The financial meltdown led to price dips in commodity prices during the second half of 2008.
The Agricultural Solutions business grew significantly by consolidating and building on the various strategic measures initiated in the earlier years. Demand for quality agricultural produce led to increase in the use of fungicides. Herbicides and fungicides are the two segments in which your Company has products to offer to the market.
Along with the business strategy of profitable growth and generating demand, the business added two focus areas viz. striving for the grower’s prosperity – Samruddhi and process standardization. The Samruddhi concept is a yield enhancement programme, where BASF is seen as a partner working for the progress of farmers. The farmers are educated about fertilization, seed rate, spacing and timely usage of agrochemical inputs.
Led by excellent growth in soybean herbicide business, agro chemicals business registered good growth in fungicides – in vegetable crops such as potato and tomato. As has been the trend for last two years, the herbicides and fungicides market witnessed good growth, offsetting the stagnation in the insecticides market. During the year, ground was prepared for new product introductions which started with the launch of “Insignia” in quarter 4. Innovative launches were well received by the farming community.
Efforts to expand the product portfolio continued alongwith the strengthening of the development, technical services and marketing teams.
With the Government’s commitment to safeguard Intellectual Property Rights and the steps initiated to provide Data Protection, the business environment for research & development based agrochemical companies, remain favorable.
Turnover and net realization in agrochemicals increased significantly compared to the previous year. Exports during the year was marginally higher compared to the previous year.
Technical Management
The efforts for optimum utilization of assets at all manufacturing sites continued during the year under report. This ensured optimal utilization of manpower and resources. These steps coupled with energy conservation measures undertaken by the Company, resulted in cost reduction, high yield, lower batch cycle time, better quality products and enhanced capacities. These measures also led to reduction in pollution load.
At Navi Mumbai factory a number of technical initiatives and energy conservation measures were implemented.
Mr. Chandran and the BASF Agricultural Products team meet farmers in Bangalore. Luquasorb, a Super Absorbent Polymer is being tested for its agricultural use.

14 Annual Report 2008-2009
The Mangalore factory continued to work efficiently and achieved record production in dispersions. The Eukesolar production achieved optimum production efficiency.
Safety, Health and Environment management continued to receive priority at all sites.
Industrial relations in all the factories continue to remain cordial.
Research and Development
During the year, the research team was engaged in supporting the technology platforms of BASF with multifold activities which include research in the area of :
• performancechemicals,intermediatesandfinechemicals
• processdevelopmentforactiveingredientsandionicliquids
• neworganicchemicalintermediatesforspecificapplications
Future plans include :
• furtherstrengthenthecollaborationwiththeglobaltechnologyplatforms
• integrationofnewIndianresearchactivitiesintotheglobalresearchnetwork
• furthermodernizationofequipmentandfacilities
• contributiontothedevelopmentofnewandinnovativeproductswithintheglobalnetwork
Internal Control Systems and their Adequacy
The Company has established proper and adequate system of internal control to ensure that all resources are put to optimum use and are well protected against loss and all transactions are authorized, recorded and reported correctly.There was proper adherence to policies, processes and guidelines in terms of efficiencies and effectiveness. The Company’s internal control systems are supplemented by an extensive programme of internal audit by an independent firm of Chartered Accountants. In line with BASF group policies, the group internal auditors also perform audits in specific areas of operations. The principles of risk avoidance, such as segregation of duties and dual control of important processes are the basic foundation of internal monitoring.
The Company’s internal control systems are periodically tested by the internal auditors. The Audit Committee constituted by the Board constantly reviews the internal control systems.
Developments in human Resources and Industrial relations front
The success of Company in India would largely depend on the talent that the Company is able to attract and retain. Understanding this need as primary, the Company initiated a project to understand the key factors that young graduates and professionals look forward to, when they join a Company. Based on the surveys conducted internally and externally, the Employer Value Proposition was defined and the various processes for recruitment were looked into by adopting a customer centric approach. Various initiatives such as launch of career web-site supported by a recruitment system have been initiated.
The GROW programme was launched with emphasis on capability development of young managers.
An employee survey was conducted and the survey results were communicated to all employees in the organization. Focused group meetings were conducted with employees to determine factors and elicit suggestions from employees to design interventions to improve on areas identified during the survey. Initiatives are now underway to address those issues.
Industrial Relations were cordial at all the sites of the Company during the year under report.
The Company employed 858 persons as on 31st March, 2009.
On behalf of the Board of Directors
PRASAD CHANDRANChairman & Managing Director
Mumbai Dated : 16th April, 2009.

BASF India Limited 15
Report onCorporate Governance
The Company has complied with the requirements of Corporate Governance in terms of the revised Clause 49 of the Listing Agreement.
1. COMPANY’S PHILOSOPHY ON CODE OF GOVERNANCE
The Company’s philosophy on Corporate Governance is aimed at assisting the management in the efficient conduct of its business and in meeting its obligations to its stakeholders and is guided by a strong emphasis on transparency, accountability and integrity.
The commitment to good Corporate Governance is embodied in its Values Statement, comprising of the following:
• SustainableProfitablePerformance • InnovationfortheSuccessofCustomers • Safety,Health&EnvironmentalResponsibility • PersonalandProfessionalCompetence • MutualRespectandOpenDialogue • Integrity For several years, the Company has shown a high level of commitment towards effective Corporate Governance
and has been at the forefront of benchmarking its internal systems and policies with global standards. The Company maintains highest business ethics and complies with all statutory and regulatory requirements.
The Company’s philosophy on Corporate Governance envisages attainment of higher levels of transparency, accountability and equity in all facets of its operations and its interactions with its stakeholders including shareholders, employees, customers, suppliers, government, lenders and the community at large. It aims to increase and sustain its corporate value through growth and innovation.
The Company believes that its operations and actions must serve the underlying goal of enhancing the interests of its stakeholders over a sustained period of time, in a socially responsible way.
All employees are bound by a Code of Conduct that sets forth the Company’s policies on important issues.
2. BOARD OF DIRECTORS AS ON 16TH APRIL, 2009
A. CompositionandcategoryoftheBoardofDirectorsareasfollows:
EXECUTIVE DIRECTORS
Name DateofAppointment
Designation No. ofMeetingsheld during theLast Financial Year
No. of MeetingsAttended
Number of MembershipsinBoardsofOtherCompanies*
No. of Memberships/Chairmanships in other Committees
Mr.PrasadChandran April 2, 2000(re-appointed on 2nd April 2005)
Chairman&ManagingDirector
5 5 2 NIL
Mr.DeepakThuseAlternate to Dr.TilmanKrauch
January 23, 2006 ChiefExecutive–Plastics
5 5 $ 1 NIL
Mr.S.Ramnath,Alternate to Mr.HermannAlthoff
April 1, 2006 ChiefExecutive— Finance&InformationTechnology
5 5 $ 1 1
Mr.R.Y.Vaidya,Alternate to Dr.RainerDiercks
April 16, 2008 ChiefExecutive—Manufacturing
5 5 $ 1 NIL
* Excludes Directorships in Private Limited Companies, Foreign Companies, Section 25 Companies, and Memberships of Managing Committees ofvariousChambers/Bodies..
$ WerepresentattheMeetingheldon12th August, 2008 as invitees.
BASF India introduced the Skill Development Programme for spouses ofemployeesatMangalore.Creativitywasat itspeak,at the tailoringcourse,resulting in many ideas and designs.

16 Annual Report 2008-2009
NON-EXECUTIVE DIRECTORS
Name DateofAppointment
Designation No. ofMeetingsheld during theLast Financial Year
No. of MeetingsAttended
Number of Membershipsin Boards ofOtherCompanies**
No. of Memberships/Chairmanships in other Committees
Dr.TilmanKrauch April 17, 2006 Director 5 1 1 NIL
Dr.RainerDiercks January 23, 2006 Director 5 1 1 NIL
Mr.HermannAlthoff April 16, 2008 Director 5 1 1 NIL
**ExcludesDirectorshipsinPrivateLimitedCompanies,ForeignCompanies,Section25CompaniesandBodiesCorporate.
INDEPENDENT NON-EXECUTIVE DIRECTORS
Name DateofAppointment
Designation No. ofMeetingsheld during the Last Financial Year
No. of MeetingsAttended
Number of Membershipsin Boards ofOtherCompanies*
No. of Memberships/Chairmanships in other Committees
Mr.K.R.Coorlawala February 10, 1975 Director 5 2 1 Membership–1Chairmanship–Nil
Mr.PradipP.Shah January 31, 2000 Director 5 3 14 Membership–5Chairmanship–3
Mr.R.A.Shah April 25, 1968 Director 5 4 14 Membership–4Chairmanship–5
Mr.R.R.Nair March30,2001 Director 5 4 3 Membership–NilChairmanship–1
* ExcludesDirectorshipsinPrivateLimitedCompanies,ForeignCompanies,Section25Companies,BodiesCorporate,MembershipsofManagingCommitteesofvariousChambers/BodiesandAlternateDirectorships.
• Number of Board Meetings held during the financial year alongwith the dates of the meetings:
FiveBoardMeetingswereheldduringtheyear2008-09.
ThedatesonwhichthesaidMeetingswereheldareasfollows:
(1) Wednesday, 16th April, 2008 (2) Thursday, 31st July, 2008
(3) Tuesday, 12thAugust,2008 (4) Monday,13thOctober,2008
(5) Monday,19th January, 2009
B. All pecuniary relationship or transactions of the non-executive Directors vis-à-vis, the Company.
Mr. K.R. Coorlawala, Mr. R.A. Shah, Mr. Pradip P. Shah and Mr. R.R. Nair, non-executive independentDirectorsoftheCompanydonothaveanymaterialpecuniaryrelationshipwiththeCompanyotherthanthecommissionpayabletothem.DetailsofcommissionpaidaregivenatSerialNo.4ofthisreport.
Dr.TilmanKrauch,Dr.RainerDiercksandMr.HermannAlthoffwerenot paidany commissionduring thefinancialyear2008-09.Dr.TilmanKrauch,Dr.RainerDiercksandMr.HermannAlthoffrepresentBASFSE(“holding Company” of the Company).
3. AUDIT COMMITTEE
TheBoardofDirectorsof theCompany constitutedanAuditCommitteeon1stMarch2001 comprisingof threeindependent non-executive Directors viz. Mr. K.R. Coorlawala as Chairman, Mr. R.A. Shah and Mr. Pradip P.ShahasMembersandMr.M.R. Iyer asSecretaryof theCommittee.Mr.S.Ramnath,ChiefExecutive,Finance& InformationTechnology was nominated as a Permanent Invitee on 25th September 2001. Mr. R.R. Nair wasappointedastheChairmanoftheAuditCommittee,bytheBoardofDirectorsonandfrom12th July, 2006 in place ofMr.K.R.Coorlawala.TheconstitutionofAuditCommitteealsomeetswiththerequirementsofSection292Aofthe Companies Act, 1956.
The terms of reference stipulated by the Board to the Audit Committee contained under the revised Clause 49 of the Listing Agreement are as follows:
l OverseeingtheCompany’sfinancialreportingprocessandthedisclosureofitsfinancialinformationtoensurethat the financial statement is correct, sufficient and credible.

BASF India Limited 17
l Recommending to the Board, the appointment, re-appointment and if required, replacement or removal of statutoryauditor,fixationofauditfeesandalsoapprovalforpaymentforanyotherservices.
l Reviewing with the management, the quarterly, half-yearly and annual financial statements before submission to the Board for approval, focusing primarily on:
Matters required tobe included in theDirector’sResponsibilityStatement tobe included in theBoard’sreport in terms of clause (2AA) of Section 217 of the Companies Act, 1956.
Changes, if any in accounting policies and practices and reasons for the same.
Majoraccountingentriesbasedonexerciseofjudgementbythemanagement.
Significantadjustmentsmadeinthefinancialstatementsarisingoutofauditfindings.
Compliancewithlisting&otherlegalrequirementsconcerningfinancialstatements.
Disclosureofanyrelatedpartytransactions.
Qualification in draft audit report.
l Reviewing the following information
Managementdiscussionandanalysisoffinancialconditionandresultsofoperations.
Statement of significant related party transactions submitted by the management.
Managementletters/lettersofinternalcontrolweaknesses.
Internal Audit reports relating to internal control weaknesses.
Financial statements, in particular, the investments made by the unlisted Subsidiary Company.
Appointment,removal&termsofremunerationoftheChiefInternalAuditor.
l Reviewing with the management, performance of statutory and internal auditors and the adequacy of the internal control systems.
l Reviewing the adequacy of internal audit function, including if applicable, the structure of the internal audit department, staffing and seniority of the official heading the department, reporting structure, coverage and frequency of internal audit.
l Discussionwiththeinternalauditorsonanysignificantfindingsandfollowupthereon.
l Reviewing the findings of any internal investigations by the internal auditors into matters where there is suspected fraud or irregularity or a failure of internal control systems of a material nature and reporting the matter to the Board.
l Discussionwith thestatutoryauditorsbefore theauditcommences,about thenatureandscopeofauditaswell as post audit discussion to ascertain any area of concern.
l Reviewing the Company’s financial and risk management policies.
l Looking into the reasons for substantial defaults, if any, in the payments to the depositors, debenture holders, shareholders (in case of non-payment of declared dividends) and creditors.
Audit Committee meetings were held on 16th April, 2008, 31st July, 2008, 13th October, 2008, and 19th January, 2009 during the financial year 2008-09. Mr. S. Ramnath, Permanent Invitee and Mr. M.R. Iyer,Secretaryof theCommitteewerepresentatall themeetings.Mr.R.R.NairandMr.PradipShah,Membersof the Committee, were not present at the meeting held on 16th April, 2008.Mr. K.R.Coorlawala,Memberof the Committee, was not present at the meetings held on 31st July, 2008 and 13th October, 2008. Mr.R.A.Shahwasnot present at themeetingheld on31st July, 2008.
TheMinutesoftheAuditCommitteeMeetingswerenotedattheBoardMeetings.TheChairmanoftheAuditCommittee was present at the 64thAnnualGeneralMeetingheld onAugust 12, 2008.
The Statutory Auditors, Cost Auditors and Internal Auditors, as needed, were invitees to the meetings.
4. REMUNERATION
l Remuneration Committee As the Remuneration Committee is non-mandatory, the Board decided that the formation of this Committee
be taken at an appropriate time.
l Remuneration of Non-Executive Directors Theremunerationofnon-executiveDirectorsisdecidedbytheBoardofDirectorsoftheCompanywithinthe
limitsapprovedbytheMembers.
l Criteria for payment of remuneration to the Non-Executive Directors The remuneration to Non-Executive Directors comprises of fixed commission. The criteria for payment of
commissionisbroadlybasedonthetimespentbytheNon-ExecutiveDirectorsattheAuditCommitteeandBoardMeetings, periodic advice givenby theseDirectors to themanagement and the commission paid bycomparable Companies.

18 Annual Report 2008-2009
l DetailsofremunerationpaidtoalltheDirectorsduringtheyear2008-2009.
(a) EXECUTIVEDIRECTORS(Amount in Rupees per annum)
Remuneration Mr.PrasadChandran Mr.DeepakThuse Mr.S.Ramnath *Mr.R.Y.Vaidya Total #Salary&Benefits@ 13,931,374 5,391,936 5,236,191 5,253,492 29,812,993PerformanceLinkedIncentive 5,850,000 1,110,000 1,237,040 1,110,000 9,307,040Total 19,781,374 6,501,936 6,473,231 6,363,492 39,120,033
@ Salary & Benefits includes Salary, Benefits, Provident Fund and Superannuation but excluding provision forcontribution to Gratuity Fund and Group Insurance and long service awards.
# PerformanceLinkedIncentiveisbasedonachievementsagainstpre-agreedtargets.
* Mr.R.Y.VaidyawasappointedasaWhole-timeDirectorw.e.f.16th April, 2008.
The agreements in respect of Mr. Prasad Chandran, Chairman and Managing Director, Mr. Deepak Thuse(appointed w.e.f. 23rdJanuary,2006)andMr.S.Ramnath(appointedw.e.f.1stApril,2006),Whole-timeDirectors,are for a period of five years. The agreement in respect of Mr. R.Y.Vaidya (appointed w.e.f. 16th April, 2008), Whole-time Director, is for a period from 16th April, 2008 to 31st August, 2010. Either of the parties to theseagreementsisentitledtoterminatetheagreementsbygivingsixmonths’noticeinwriting.
Presently,theCompanydoesnothaveaSchemeforgrantofstockoptionstotheDirectors.
(b) INDEPENDENTNON-EXECUTIVEDIRECTORS TheCommissionduetotheindependentnon-executiveDirectorsforthefinancialyearended31stMarch,2009is
as follows:
Mr.K.R.Coorlawala Mr.R.A.Shah# Mr.PradipP.Shah Mr.R.R.Nair
Rs.5,00,000/- Rs.5,00,000/- Rs.5,00,000/- Rs.5,00,000/-
# M/s. Crawford Bayley &Co., one of the Solicitors of theCompany in whichMr. R.A. Shah is a Senior Partnerrenders professional services to the Company.
IndependentNon-ExecutiveDirectorsdonotholdanysharesintheCompany.
(c) NoremunerationwaspaidtoNon-ExecutiveForeignDirectorsduringthefinancialyear2008-09.
5. SHAREHOLDERS’/INVESTORS’ GRIEVANCE COMMITTEE
TheBoardofDirectorsoftheCompanyconstitutedaShareholders’/Investors’GrievanceCommitteeon1stMarch,2001 currently comprising of Mr. K.R. Coorlawala as Chairman, Mr. Prasad Chandran andMr. S. Ramnath asMembers.Mr.R.R.Nairwasnominated/appointedasmemberoftheShareholders’/Investors’GrievanceCommittee,bytheBoardofDirectorson7thMay,2008.
TheCommittee looks into redressal of shareholders’ and investors’ complaints/grievances.TheCommittee alsolooks into complaints concerning transfer of shares, non-receipt of balance sheet, non-receipt of dividends etc. The Committee oversees the performance of the Registrar and Share Transfer Agent and recommends measures for overall improvement in the quality of investor service.
TheBoardhasdesignatedMr.M.R.Iyer,ChiefExecutive,Legal&CompanySecretaryastheComplianceOfficer.
The Company has a Share Transfer Committee comprising of Mr. Prasad Chandran as Chairman, Mr.K.R.CoorlawalaandMr.S.Ramnathasmemberswhichapproveallmattersrelatedtosharesvis-à-vistransfers,deletions,transmissions,dematerializationandrematerializationofsharesetc.TheCommitteemeetsfromtimetotimeand approves the transfers and transmission of shares and deletion of names, issue of duplicate share certificates etc.
Duringtheyear,6complaintswerereceivedfromtheshareholdersandthesehavebeenresolvedtodate.
Outstandingcomplaintsason31stMarch,2009wereNil.
Therewas1requestfordematerialization/transferofsharespendingason31stMarch,2009.Thereare95sharespending to be transferred as on 31stMarch,2009.
SUBSIDARY COMPANY
TheCompanymonitorstheperformanceof its100%subsidiary,BASFPolyurethanesIndiaLimited(BPIL), inter-alia, by the following means:
TheFinancialStatements, in particular, the investments, if any,madebyBPIL, are reviewedby theAuditCommittee of the Company.
TheMinutesoftheBoardMeetingsofBPILarenotedattheBoardMeetingsoftheCompany.
DetailsofsignificanttransactionsandarrangementsenteredintobytheBPILareplacedbeforetheBoardofthe Company as and when applicable.

BASF India Limited 19
CEO/CFO Certificate: AcertificatefromtheChiefExecutiveOfficer(ManagingDirector)andtheChiefFinancialOfficer,onthefinancial
statements and other matters of the Company for the financial year ended 31stMarch,2009,wasplacedbeforethe Board at its meeting held on 16th April, 2009.
6. GENERAL BODY MEETINGS
Duringthelastthreeyears,yourCompany’sAnnualGeneralMeetings(AGMs)wereheldatYashwantraoChavanPratishthanAuditorium,Y.B.ChavanCentre,GeneralJagannathBhosaleMarg,NarimanPoint,Mumbai400021on the following dates:
1. Tuesday 12th August, 2008 at 3.00 p.m. 2. Tuesday 31st July, 2007 at 3.00 p.m. 3. Thursday 10th August, 2006 at 3.00 p.m. AllresolutionsincludingthespecialresolutionsatAGMsaregenerallypassedbywayofshowofhands.Nopostal
ballots were used for voting at these meetings.
Attendance of Directors at AGM during the last financial year: 12thAugust,2008(AGM)AllDirectorsexceptMr.K.R.Coorlawalawerepresent.
7. DETAILS OF DIRECTORS SEEKING APPOINTMENT/ RE-APPOINTMENT BriefresumesoftheDirectorsseekingappointmentorre-appointmentareasfollows: l Dr.TilmanKrauchhasstudiedchemistryattheUniversityofFreiburg,GermanyandatETHZurich,Switzerland.
HehasdonehisdoctorateandspenthispostdoctorateperiodsattheShemiakinInstitute,Moscow,RussiaandKyotoUniversity,Japan.Dr.KrauchjoinedBASFAG’sPlasticsLaboratoryin1990.HeworkedasanAssistantto theChairman of the Board of Executive Directors of BASFAG in 1995. In the year 2001, he becameGroupVicePresident,FiberIntermediates,Europe,PerformancePolymersDivisionandin2004,hebecameGroupVicePresident,GlobalBusinessUnit,PolyamideandIntermediates,PerformancePolymersDivision.In2006,Dr.TilmanKrauchwasthePresident,RegionalFunctionsandMarketEfficiency,AsiaPacific.Presently, Dr.TilmanKrauch is thePresident, Regional Functions andCountryManagement, Asia Pacific. Dr.TilmanKrauch has been a Director of the Company and its wholly-owned subsidiary BASF Polyurethanes IndiaLimited, since 17th April, 2006.
l Mr. Pradip P. Shah has been aDirector on the Board of theCompany since 31st January, 2000.Mr. Shahholds anMBA from the Harvard Business School and a Bachelor’s degree in Commerce from SydenhamCollege,Mumbai.HeisaqualifiedCharteredAccountantandaCostAccountantandrankedfirstinIndiaintheCharteredAccountancyexaminations.
HeisthefounderManagingDirectorofCRISIL,India’sfirstandlargestcreditratingagency.HehasservedasamemberofvariouscommitteesoftheGovernmentonmattersconcerningFinance.Mr.ShahistheChairmanofIndAsiaFundAdvisorsPrivateLtd.,aprivateequityinvestmentandcorporatefinanceadvisoryCompany.
Presently,Mr.PradipP.ShahisalsotheChairman/Directorofthefollowingpubliclimitedcompaniesviz.
1. Shah Foods Limited Chairman 2. Sonata Software Limited Chairman 3. AssetReconstructionCompany(India)Limited Director 4. Godrej&BoyceMfg.Limited Director 5. GrindwellNortonLimited Director 6. KansaiNerolacPaintsLimited Director 7. PfizerLimited Director 8. PatniComputerSystemsLimited Director 9. PanasonicEnergyIndiaCo.Ltd. Director 10. WartsilaIndiaLtd. Director 11. TataInvestmentCorporationLimited Director 12. WockhardtHospitalsLimited Director 13. MukundLimited Director 14. KSBPumpsLimited Director Presently,Mr.PradipP.Shah isalso theChairman/Memberof the followingAuditCommittees/Shareholders’
GrievanceCommitteeofpubliclimitedcompaniesviz.,
Audit Committee
1. KansaiNerolacPaintsLimited Chairman 2. Wartsila India Ltd. Chairman 3. WockhardtHospitalsLimited Chairman 4. PanasonicEnergyIndiaCo.Ltd. Member 5. PfizerLimited Member 6. PatniComputerSystemsLimited Member 7. SonataSoftwareLimited Member

20 Annual Report 2008-2009
Shareholders’ Grievance Committee
1. PfizerLimited Member
TheNon-ExecutiveDirectorsseeking re-appointmentdonotholdanyshares in theCompanyeither in theirown name or for any other person on a beneficial basis.
8. DISCLOSURES
(a) There were no materially significant related party transactions made by the Company with its promoters, directors or relatives or the management, their subsidiaries etc., which have potential conflict with the interests oftheCompanyatlarge.TheregisterofcontractscontainingthetransactionsinwhichDirectorsareinterestedisplacedbeforetheBoardateveryBoardMeetingforapproval.
Transactions with related parties are disclosed in Note No. 22 of Schedule 19 to the Accounts in the Annual Report.
(b) Duringthelastthreeyears,therewerenostricturesorpenaltiesimposedontheCompanyeitherbySEBIortheStockExchangesoranyotherstatutoryauthorityfornon-complianceofanymatterrelatedtothecapitalmarket.
(c) The Company has complied with the mandatory requirements of the Code of Corporate Governance as stipulated under Clause 49 of the Listing Agreement.
(d) RiskManagement
TheCompanyhas in place amechanism to inform theBoard about the risk assessment andminimizationprocedures and periodical review to ensure that management controls risk through means of a properly defined framework.
(e) TheManagementDiscussion&AnalysisReportformspartofthisAnnualReport.
9. MEANS OF COMMUNICATION
l TheQuarterly and Half-yearly Unaudited Financial results are generally published in the widely circulatingnationaland localnewspaperssuchas‘TheEconomicTimes’ (inEnglish),‘MaharashtraTimes’ (inMarathi).These results are not sent to each household of shareholders.
l TheCompany’sFinancial results/official news releasesandother important Investor related informationareperiodicallydisplayedandupdatedontheCompany’swebsite,viz.,www.basf-india.com.
l EDIFARfiling:
As requiredunder clause51of theListingAgreementswithStockExchanges,all data relating toquarterlyfinancialresults,shareholdingpatternetc.arebeingelectronicallyfiledontheEDIFARwebsite,www.sebiedifar.nic.in within the timeframe prescribed in this regard.
10. GENERAL SHAREHOLDERS INFORMATION
(a) The Annual General Meeting of the Company will be held on Friday, 21st August, 2009 at 3.00 p.m. at Yashwantrao Chavan Pratishthan Auditorium, Y.B. Chavan Centre, General Jagannath Bhosale Marg,NarimanPoint,Mumbai-400021.
(b) The Company’s financial year begins on 1st April and ends on 31stMarch.
FinancialCalendar— ResultsforquarterendingJune30,2009 3rd/4th week of July, 2009
(tentative) AnnualGeneralMeeting 21st August, 2009
Results for quarter ending September 30, 2009 2nd/3rdweekofOctober,2009
ResultsforquarterendingDecember31,2009 3rd/4th week of January, 2010
ResultsfortheyearendingMarch31,2010 3rd/4th week of April, 2010
(c) Dateofbookclosure:12th August, 2009 to 21st August, 2009 (both days inclusive) for the purposes of Annual GeneralMeetingandpaymentofdividend.
(d) Dividendpaymentdate:25th August, 2009.
(e) ListingonStockExchanges:Theequitysharesof theCompanyare listedonTheStockExchange,Mumbai(BSE)andTheNationalStockExchangeofIndiaLimited(NSE).TheCompanyhaspaidtheannuallistingfeesforthefinancialyear2009-10toboththeStockExchanges.
(f) Stock Code : 500042
SYMBOL : BASF
DematISINNo.inNSDL : INE373A01013
DematISINNo.inCDSL : INE373A01013

BASF India Limited 21
(g) Market PriceData:High/lowmarket price of theCompany’s equity shares traded onTheStockExchange,Mumbai and theNational Stock Exchange of India during eachmonth in the last FinancialYear ended on 31stMarch,2009isfurnishedbelowalongwithagraphindicatingtheperformanceofCompany’ssharepriceincomparisonwiththeBSESensex:
SHAREPRICES(HIGH/LOW)OFBASFINDIALIMITEDFORTHEPERIODAPRIL2008TOMARCH2009
AT BSE AT NSE
MONTH HIGH(DATE) LOW(DATE) MONTH HIGH(DATE) LOW(DATE)
April 215.25(22.04.2008)
185.30(08.04.2008)
April 215.45(21.04.2008)
184.35(08.04.2008)
May 256.95(20.05.2008)
209.85(08.05.2008)
May 256.90(21.05.2008)
209.50(08.05.2008)
June 264.05(26.06.2008)
251.00(04.06.2008)
June 263.90(26.06.2008)
251.05(03.06.2008)
July 288.95(24.07.2008)
262.30(04.07.2008)
July 289.40(24.07.2008)
262.45(03.07.2008)
August 286.85(13.08.2008)
276.85(29.08.2008)
August 286.25(13.08.2008)
277.85(29.08.2008)
September 275.45(01.09.2008)
236.35(30.09.2008)
September 275.35(05.09.2008)
239.00(30.09.2008)
October 245.95(01.10.2008)
203.85(27.10.2008)
October 243.60(01.10.2008)
200.05(27.10.2008)
November 229.50(06.11.2008)
210.85(20.11.2008)
November 230.40(10.11.2008)
213.50(20.11.2008)
December 233.70(15.12.2008)
222.55(12.12.2008)
December 237.00(15.12.2008)
221.50(12.12.2008)
January 226.60(05.01.2009)
185.70(29.01.2009)
January 226.00(05.01.2009)
183.90(30.01.2009)
February 188.00(02.02.2009)
171.85(27.02.2009)
February 187.35(02.02.2009)
171.00(27.02.2009)
March 180.00(25.03.2009)
164.50(13.03.2009)
March 183.15(23.03.2009)
165.80(13.03.2009)
22 Annual Report 2008-2009
(h) Registrar&ShareTransferAgent:Sharepro Services (India) Private Ltd. (Sharepro)
Registered Office Investors Relation Centre Sharepro Services (India) Private Ltd., Unit:BASFIndiaLimited, 13AB,SamhitaWarehousingComplex, 2ndFloor,SakinakaTelephoneExchangeLane, Off.AndheriKurlaRoad,Andheri(East), Mumbai-400072. Tel. No. : 022-2851 1872, 6772 0300, 6772 0400 FaxNo. : 022-28591568 Email : [email protected]
Sharepro Services (India) Private Ltd., Unit:BASFIndiaLimited,912,RahejaCentre,FreePressJournalRoad,NarimanPoint,Mumbai-400021.Tel. No. : 022-6613 4700, 2288 1568FaxNo. : 022-22825484Email : [email protected]
The details of contact persons of Sharepro are as follows:
Name PhoneNo. FaxNo.
Mr.G.R.Rao 022-28215169,67720301/0302 022-2859 1568
Mrs.IndiraP.Karkera/Mr.Gopal 022-67720360/67720300 022-2859 1568
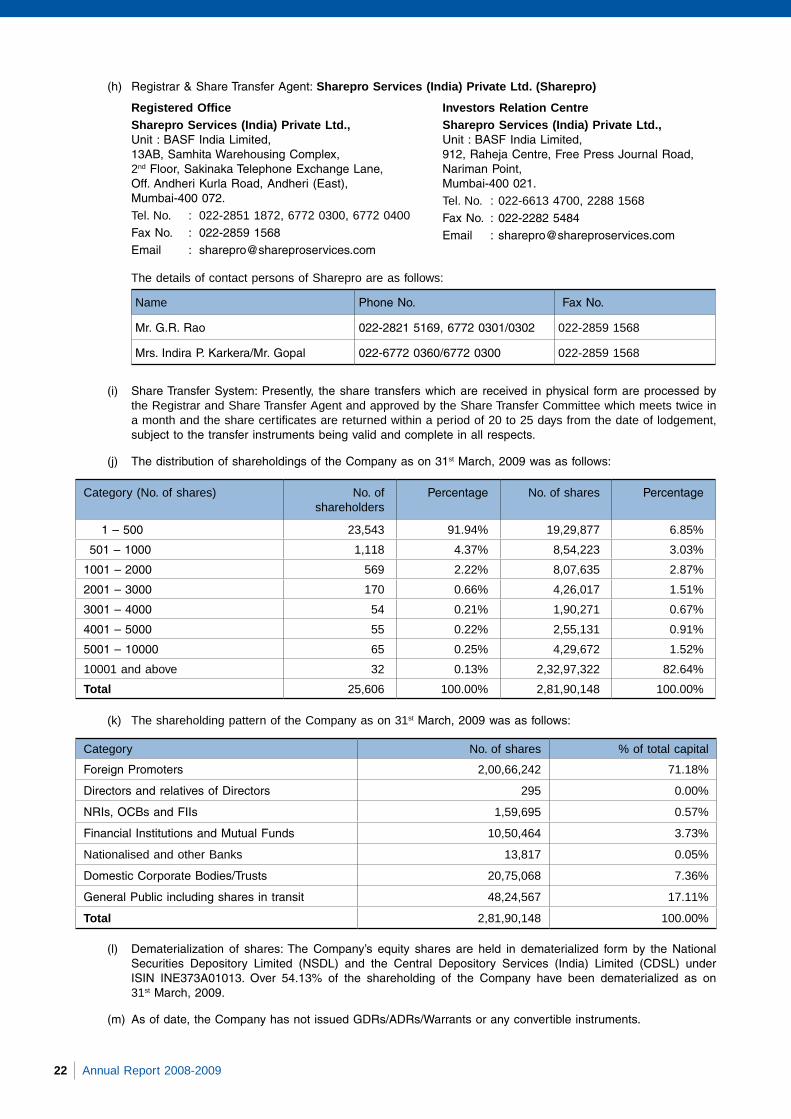
(i) ShareTransferSystem:Presently, theshare transferswhichare received inphysical formareprocessedbythe Registrar and Share Transfer Agent and approved by the Share Transfer Committee which meets twice in a month and the share certificates are returned within a period of 20 to 25 days from the date of lodgement, subjecttothetransferinstrumentsbeingvalidandcompleteinallrespects.
(j) ThedistributionofshareholdingsoftheCompanyason31stMarch,2009wasasfollows:
Category (No. of shares) No. ofshareholders
Percentage No. of shares Percentage
1–500 23,543 91.94% 19,29,877 6.85%
501–1000 1,118 4.37% 8,54,223 3.03%
1001–2000 569 2.22% 8,07,635 2.87%
2001–3000 170 0.66% 4,26,017 1.51%
3001–4000 54 0.21% 1,90,271 0.67%
4001–5000 55 0.22% 2,55,131 0.91%
5001–10000 65 0.25% 4,29,672 1.52%
10001 and above 32 0.13% 2,32,97,322 82.64%
Total 25,606 100.00% 2,81,90,148 100.00%
(k) The shareholding pattern of the Company as on 31stMarch,2009wasasfollows:
Category No. of shares % of total capital
ForeignPromoters 2,00,66,242 71.18%
DirectorsandrelativesofDirectors 295 0.00%
NRIs,OCBsandFIIs 1,59,695 0.57%
FinancialInstitutionsandMutualFunds 10,50,464 3.73%
Nationalised and other Banks 13,817 0.05%
DomesticCorporateBodies/Trusts 20,75,068 7.36%
GeneralPublicincludingsharesintransit 48,24,567 17.11%
Total 2,81,90,148 100.00%
(l) Dematerialization of shares:TheCompany’s equity shares are held in dematerialized form by theNationalSecurities Depository Limited (NSDL) and the Central Depository Services (India) Limited (CDSL) underISIN INE373A01013. Over 54.13% of the shareholding of the Company have been dematerialized as on 31stMarch,2009.
(m) Asofdate,theCompanyhasnotissuedGDRs/ADRs/Warrantsoranyconvertibleinstruments.

BASF India Limited 23
(n) Plantlocations: Navi Mumbai Mangalore Dadra ThaneBelapurRoad, Bala/ThokurVillage, 83/2,DenaBankRoad, Turbhe, Surathkal-BajpeRoad, DemniVillage, NaviMumbai400705 MangaloreTaluka, Dadra396191 Maharashtra. DakshinaKannadaDistrict, UnionTerritoryofDadra& Karnataka575030. NagarHaveli.
(o) Address for correspondence: Mr.PradeepChandan/Mr.ManoharKamath BASF India Limited, RBC,MahindraTowers, 1st Floor, A Wing, Dr.G.M.BhosaleMarg, Worli,Mumbai400018. Tel : 6661 8000 Fax : 24950512 Email : [email protected] [email protected] [email protected]
(p) Top Ten Shareholders of the Company as on 31stMarch,2009
Sl. No. Name of the shareholder(s) Holdings % in the total capital
1. BASFSE 2,00,66,242 71.18% 2. UnitedIndiaInsuranceCompanyLimited 7,66,771 2.72% 3. LICofIndia-MarketPlus 7,05,000 2.50% 4. General Insurance Corporation of India 5,95,602 2.11% 5. LICofIndia-MoneyPlus 3,42,504 1.21% 6. The New India Assurance Company Limited 2,68,488 0.95% 7. National Insurance Company Limited 1,22,883 0.44% 8. Vikram Tannan 68,000 0.24% 9. Religare Securities Limited 52,967 0.19%10. RajniBahl 43,000 0.15%
(q) Shareprice:Rs.217.70/-pershareonTheStockExchange,Mumbaiason16th April, 2009.
11. CODE OF CONDUCT TheCompanyhasestablishedCodeofConductforitsBoardMembersandSeniorManagementpersonnel.
TheCode ofConduct for theBoardMembers andSeniorManagement personnel is posted on theCompany’s web site, www.basf-india.com.
All the Board members and senior management personnel have complied with the Code of Conduct.
OnbehalfoftheBoardofDirectors
PRASADCHANDRAN Chairman & Managing DirectorMumbai,Dated: 16th April, 2009
BASFrunsforacauseintheMumbaiMarathoninJanuary2009.

24 Annual Report 2008-2009
Certificate of compliance with the Corporate Governance requirements under Clause 49 of the Listing Agreement.
To
TheMembersofBASFIndiaLimited
Wehaveexamined thecomplianceofconditionsofCorporateGovernancebyBASFIndiaLimited (‘theCompany’) forthe year ended on 31stMarch2009,asstipulated inClause49of theListingAgreemententered intobytheCompanywithStockExchanges.
ThecomplianceofconditionsofCorporateGovernance is theresponsibilityof theManagement.Ourexaminationwaslimited to procedures and implementation thereof, adopted by the Company for ensuring the compliance of the conditions of the Corporate Governance. It is neither an audit nor an expression of opinion on the financial statements of theCompany.
In our opinion, and to the best of our information and according to the explanations given to us, we certify that theCompany has complied with the conditions of Corporate Governance as stipulated in the above mentioned Listing Agreement.
We state that such compliance is neither an assurance as to the future viability of the Company nor the efficiency or effectivenesswithwhichtheManagementhasconductedtheaffairsoftheCompany.
ForBSR&Co.Chartered Accountants
AkeelMasterMumbai, PartnerDate: 16 April 2009. MembershipNo.046768
BASFbags theOutstandingStallAwardatPlastindia2009,world’ssecondlargestplasticsexhibition.

BASF India Limited 25
Auditors’ Report to the Members of BASF India LimitedWe have audited the attached Balance Sheet of BASF India Limited (‘the Company’) as at 31 March 2009, and the related Profit and Loss Account and Cash Flow Statement for the year ended on that date annexed thereto. These financial statements are the responsibility of the Company’s management. Our responsibility is to express an opinion on these financial statements based on our audit.We conducted our audit in accordance with auditing standards generally accepted in India. Those Standards require that we plan and perform the audit to obtain reasonable assurance about whether the financial statements are free of material misstatement. An audit includes examining, on a test basis, evidence supporting the amounts and disclosures in the financial statements. An audit also includes assessing the accounting principles used and significant estimates made by management, as well as evaluating the overall financial statement presentation. We believe that our audit provides a reasonable basis for our opinion.1. As required by the Companies (Auditor’s Report) Order, 2003 (‘the Order’) issued by the Central Government of
India in terms of sub-section (4A) of Section 227 of the Companies Act, 1956 (‘the Act’), we enclose in the Annexure a statement on the matters specified in paragraphs 4 and 5 of the said Order.
2. Further to our comments in the Annexure referred to above, we report that: (a) we have obtained all information and explanations, which to the best of our knowledge and belief were necessary
for the purposes of our audit; (b) in our opinion, proper books of account as required by law have been kept by the Company so far as appears
from our examination of those books; (c) the Balance Sheet, Profit and Loss Account and Cash Flow Statement dealt with by this report are in agreement
with the books of account; (d) in our opinion, the Balance Sheet, Profit and Loss Account and Cash Flow Statement dealt with by this report
comply with the Accounting Standards referred to in sub-section (3C) of Section 211 of the Act; (e) on the basis of written representations received from the directors of the Company, as on 31 March 2009, and
taken on record by the Board of Directors, we report that none of the directors is disqualified as on 31 March 2009 from being appointed as a director in terms of clause (g) of sub-section (1) of Section 274 of the Act; and
(f) in our opinion, and to the best of our information and according to the explanations given to us, the said accounts give the information required by the Act, in the manner so required, and give a true and fair view in conformity with the accounting principles generally accepted in India:
i. in the case of the Balance Sheet, of the state of affairs of the Company as at 31 March 2009; ii. in the case of the Profit and Loss Account, of the profit of the Company for the year ended on that date;
and iii. in the case of the Cash Flow Statement, of the cash flows of the Company for the year ended on that
dateFor B S R & Co.Chartered AccountantsAkeel Master Partner Membership No.: 046768MumbaiDate: 16 April 2009
Annexure to Auditors’ Report – 31 March 2009With reference to the Annexure referred to in our report of even date, we report that:1. (a) The Company has maintained proper records showing full particulars, including quantitative details and situation
of fixed assets. (b) The Company has a regular programme of physical verification of its fixed assets by which all fixed assets are
verified in a phased manner over a period of two years. In our opinion, this periodicity of physical verification is reasonable having regard to the size of the Company and the nature of its assets. No material discrepancies were noticed on such verification.
(c) Fixed assets disposed off during the year were not substantial, and therefore, do not affect the going concern assumption.
2. (a) The inventory, except goods-in-transit and stocks lying with third parties, has been physically verified by the management during the year. In our opinion, the frequency of such verification is reasonable. For stocks lying with third parties at the year-end, written confirmations have been obtained.
(b) The procedures for the physical verification of inventories followed by the management are reasonable and adequate in relation to the size of the Company and the nature of its business.
(c) The Company is maintaining proper records of inventory. The discrepancies noticed on verification between the physical stocks and the book records were not material.
3. The Company has neither granted nor taken any loans, secured or unsecured, to or from companies, firms or other parties covered in the register maintained under Section 301 of the Act.

26 Annual Report 2008-2009
4. In our opinion and according to the information and explanations given to us, and having regard to the explanation that purchases of certain items of inventories and fixed assets are for the Company’s specialised requirements and similarly certain goods sold and services rendered are for the specialised requirements of the buyers and suitable alternative sources are not available to obtain comparable quotations, there is an adequate internal control system commensurate with the size of the Company and the nature of its business with regard to purchase of inventories and fixed assets and with regard to the sale of goods and services. We have not observed any major weakness in the internal control system during the course of the audit.
5. (a) In our opinion and according to the information and explanations given to us, the particulars of contracts or arrangements referred to in Section 301 of the Act have been entered in the register required to be maintained under that section.
(b) In our opinion and according to the information and explanations given to us, the transactions made in pursuance of contracts and arrangements referred to in (a) above and exceeding the value of Rs 5 lakh with any party during the year have been made at prices which are reasonable having regard to the prevailing market prices at the relevant time, except for purchases of certain items of inventories and fixed assets which are for the Company’s specialised requirements and similarly sale of certain goods and services rendered which are for the specialised requirements of the buyers and suitable alternative sources are not available to obtain comparable quotations. However, on the basis of information and explanations provided, the same appear reasonable.
6. In our opinion and according to the information and explanations given to us, the Company has complied with the provisions of Section 58A, Section 58AA or other relevant provisions of the Act, and the rules framed thereunder with regard to deposits accepted from the public. Accordingly, there have been no proceedings before the Company Law Board or National Company Law Tribunal (as applicable) or Reserve Bank of India or any Court or any other Tribunal in this matter and no order has been passed by any of the aforesaid authorities.
7. In our opinion, the Company has an internal audit system commensurate with the size and the nature of its business.
8. We have broadly reviewed the books of account maintained by the Company pursuant to the rules prescribed by the Central Government for maintenance of cost records under Section 209(1)(d) of the Act in respect of manufacture of insecticides and are of the opinion that prima facie, the prescribed accounts and records have been made and maintained. However, we have not made a detailed examination of the records.
9. (a) According to the information and explanations given to us and on the basis of our examination of the records of the Company, amounts deducted/accrued in the books of account in respect of undisputed statutory dues including Provident Fund, Employees’ State Insurance, Income-tax, Sales-tax, Wealth tax, Service tax, Customs duty, Excise duty, Investor Education and Protection Fund and other material statutory dues have been generally regularly deposited during the year by the Company with the appropriate authorities.
According to the information and explanations given to us, there were no dues on account of Cess under Section 441A of the Act since the date from which the aforesaid section comes into force has not been notified by the Central Government.
According to the information and explanations given to us, no undisputed amounts payable in respect of Provident Fund, Employees’ State Insurance, Income-tax, Sales-tax, Wealth tax, Service tax, Customs duty, Excise duty, Investor Education and Protection fund and other material statutory dues were in arrears as at 31 March 2009 for a period of more than six months from the date they became payable.
(b) According to the information and explanations given to us, there are no dues of Income-tax, Sales-tax, Wealth tax, Service tax, Customs duty and Excise duty which have not been deposited with the appropriate authorities on account of any dispute other than those mentioned in the appendix to this report.
10. The Company does not have any accumulated losses at the end of the financial year and has not incurred cash losses in the financial year and in the immediately preceding financial year.
11. In our opinion and according to the information and explanations given to us, the Company has not defaulted in repayment of dues to its bankers. The Company did not have any outstanding debentures or dues to financial institutions during the year.
12. The Company has not granted any loans and advances on the basis of security by way of pledge of shares, debentures and other securities.
13. In our opinion and according to the information and explanations given to us, the Company is not a chit fund or a nidhi/mutual benefit fund/society.
14. According to the information and explanations given to us, the Company is not dealing or trading in shares, securities, debentures and other investments.
15. According to the information and explanations given to us, the Company has not given any guarantee for loans taken by others from banks or financial institutions.
16. The Company did not have any term loans outstanding during the year. 17. According to the information and explanations given to us and on an overall examination of the Balance Sheet of
the Company, we are of the opinion that the funds raised on short-term basis have not been used for long-term investment.
18. The Company has not made any preferential allotment of shares to companies/firms/parties covered in the register maintained under Section 301 of the Act.
19. The Company did not have any outstanding debentures during the year. 20. The Company has not raised any money by public issues during the year.21. According to the information and explanations given to us, no fraud on or by the Company has been noticed or
reported during the course of our audit.
For B S R & Co.Chartered AccountantsAkeel Master Partner Membership No.: 046768MumbaiDate: 16 April 2009

BASF India Limited 27
Appendix
Name of the Statute Nature of the Dues
Amounts (Rs million)
Period Forum where the dispute is pending
Central Excise Act, 1944 Duty, Interest and Penalty
2.24 2001 Customs, Excise, Service Tax Appellate Tribunal
States and Central Sales Tax Acts
Tax, Interest and Penalty
1.67 1997-1998 Assistant Commissioner
16.51 2002-2003 Deputy Commissioner
0.67 2003-2004 Deputy Commissioner
0.98 2004-2005 Deputy Commissioner
Mr. Oscar Fernandes, Hon. Minister of State for Labour & Employment, hands over the Safety Award of the National Safety Council – The Prashansa Patra to Mr. P. P. Shetty, General Manager, Mangalore Works in the presence of Mr. Anand Mahindra, Managing Director, Mahindra & Mahindra.

28 Annual Report 2008-2009
For Accounting Policies and Notes to Accounts — Refer Schedule 19
The Schedules referred to above form integral part of the Balance Sheet.
As per our report of even dated attached Prasad Chandran K. R. CoorlawalaChairman & Managing Director R. R. Nair
For B S R & Co. R. Y. VaidyaChartered Accountants M. R. Iyer S. Ramnath
Company Secretary R. A. ShahAkeel Master Pradip P. ShahPartner Deepak ThuseMembership No.: 046768 Directors
Mumbai, 16th April 2009 16th April 2009
Balance Sheet as at March 31, 2009
Rs. in million
Schedule March 31, 2009 March 31, 2008
SOURCES OF FUNDS
Shareholders’ Funds:
Share Capital 1 281.9 281.9
Reserves and Surplus 2 3,570.4 3,114.9
Total 3,852.3 3,396.8
APPLICATION OF FUNDS
Fixed Assets: 3
Gross Block 3,636.4 3,411.1
Less: Depreciation 2,377.0 2,242.5
Net Block 1,259.4 1,168.6
Capital Work-in-Progress 211.5 40.0
1,470.9 1,208.6
Investments 4 90.0 119.0
Deferred Tax Assets (net) 5 2.5 23.6
Current Assets, Loans and Advances:
Inventories 6 2,009.8 1,249.2
Sundry Debtors 7 1,372.8 1,586.9
Cash and Bank Balances 8 277.0 81.6
Loans and Advances 9 1,285.5 977.1
4,945.1 3,894.8
Less:
Current Liabilities and Provisions:
Current Liabilities 10 2,311.7 1,513.1
Provisions 11 344.5 336.1
2,656.2 1,849.2
Net Current Assets 2,288.9 2,045.6
Total 3,852.3 3,396.8

BASF India Limited 29
For Accounting Policies and Notes to Accounts — Refer Schedule 19
The Schedules referred to above form integral part of the Profit and Loss Account.
As per our report of even dated attached Prasad Chandran K. R. CoorlawalaChairman & Managing Director R. R. Nair
For B S R & Co. R. Y. VaidyaChartered Accountants M. R. Iyer S. Ramnath
Company Secretary R. A. ShahAkeel Master Pradip P. ShahPartner Deepak ThuseMembership No.: 046768 Directors
Mumbai, 16th April 2009 16th April 2009
Profit and Loss Account for the year ended March 31, 2009
Rs. in million
Schedule March 31, 2009 March 31, 2008
Income:
Sales and Services 12 12,381.1 10,360.2
Less: Excise Duty 1,225.1 1,233.5
11,156.0 9,126.7
Other Income 13 85.5 46.9
11,241.5 9,173.6
Expenditure:
Materials Consumed 14 6,072.0 4,971.3
Purchase of Finished Goods 1,527.1 900.1
Other Expenses 15 2,633.5 2,307.4
Depreciation 3 151.6 136.0
Interest 16 14.9 12.8
10,399.1 8,327.6
Increase in Stocks 17 237.7 84.0
Profit Before Tax 1,080.1 930.0
Tax 18 393.7 336.3
Profit After Tax 686.4 593.7
Surplus Brought Forward 264.0 231.0
Available for Appropriation 950.4 824.7
Appropriations:
Proposed Dividend 197.3 197.3
Corporate Tax on Dividend 33.6 33.6
General Reserve 455.5 329.8
686.4 560.7
Balance Carried Forward 264.0 264.0
Weighted average number of equity shares outstanding during the year 28,189,466 28,189,466
Basic and diluted earnings per share (in Rs.) 24.35 21.06
Face value per share (in Rs.) 10.00 10.00

30 Annual Report 2008-2009
Cash Flow Statement for the year ended March 31, 2009
Rs. in million
March 31, 2009 March 31, 2008
A. Cash flow from operating activities
Net Profit Before Tax 1,080.1 930.0
Adjustments for:
Depreciation 151.6 136.0
Interest expense 14.9 12.8
Loss/(Profit) on sale of fixed assets (net) (1.9) 1.3
Interest income (20.1) (17.3)
Unrealised (Gain)/Loss on foreign exchange (net) 7.3 9.3
Provision for Doubtful Debts (16.7) 135.1 5.1 147.2
Operating profit before working capital changes 1,215.2 1,077.2
(Increase)/Decrease in:
Trade and Other Receivables 344.3 (253.0)
Inventories (760.6) (96.6)
Trade and Other Liabilities (779.6) 363.3 (274.8) (74.8)
Cash generated from operations 1,578.5 1,002.4
Direct taxes paid (net) (386.7) (342.0)
Net cash from operating activities 1,191.8 660.4
B. Cash flow from investing activities:
Acquisition of fixed assets (408.4) (300.6)
Realisation on sale of fixed assets 3.6 8.2
Interest received 20.2 17.0
ICD placed with – BASF Polyurethanes India Limited (net) (366.0) (79.0)
Net cash used in investing activities (750.6) (354.4)
C. Cash flow from financing activities
Repayment of loan funds (net) — (5.1)
Interest paid (14.9) (12.8)
Dividend paid (197.3) (197.3)
Tax paid on above dividend (33.6) (33.6)
Net cash used in financing activities (245.8) (248.8)
Net increase in cash and cash equivalents 195.4 57.2
Cash and cash equivalents (opening balance) 81.6 24.4
Cash and cash equivalents (closing balance) 277.0 81.6
Restricted cash and cash equivalents 5.6 5.5
As per our report of even dated attached Prasad Chandran K. R. CoorlawalaChairman & Managing Director R. R. Nair
For B S R & Co. R. Y. VaidyaChartered Accountants M. R. Iyer S. Ramnath
Company Secretary R. A. ShahAkeel Master Pradip P. ShahPartner Deepak ThuseMembership No.: 046768 Directors
Mumbai, 16th April 2009 16th April 2009

BASF India Limited 31
Schedules to Balance Sheet as at March 31, 2009
1. Share Capital Rs. in million
March 31, 2009 March 31, 2008
Authorised:30,000,000 (Previous Year – 30,000,000) Equity Shares of Rs.10/- each 300.0 300.0 Issued:28,190,148 (Previous Year – 28,190,148) Equity Shares of Rs.10/- each 281.9 281.9 Subscribed and Paid-up:28,189,466 (Previous Year – 28,189,466) Equity Shares of Rs.10/- each fully paid 281.9 281.9 Of the above–
– 700 Equity Shares were allotted as fully paid pursuant to a contract without payment being received in cash and 15,771,400 Equity Shares were allotted as fully paid Bonus Shares by way of capitalisation of Reserves.
– 4,035,948 shares were allotted to the erstwhile shareholders of Cyanamid Agro Limited (CAL) consequent to the amalgamation w.e.f. April 1, 2001
– 20,066,242 (Previous Year – 14,853,020) Equity Shares are held by BASF SE, the holding company.
281.9 281.9
2. Reserves and Surplus Balance
as on April 1, Additions
during the year Balance
as on March 31,2008 2007 2008-09 2007-08 2009 2008
Share Premium Account 621.0 621.0 — — 621.0 621.0 Amalgamation Reserve 0.5 0.5 — — 0.5 0.5 General Reserve 2,229.4 1,899.6 455.5 329.8 2,684.9 2,229.4 Surplus as per Profit & Loss Account 264.0 231.0 — 33.0 264.0 264.0
3,114.9 2,752.1 455.5 362.8 3,570.4 3,114.9
3. Fixed AssetsFreehold
LandLeasehold
LandBuildings* Plant &
Machinery and
Computers #
Furniture,Fixtures
and Equipment
Vehicles Total PreviousYear
Gross Block:As at April 1, 2008 24.1 50.4 626.9 2,562.4 136.7 10.6 3,411.1 3,265.9 Additions — — 102.8 117.1 23.4 0.8 244.1 319.1 Deductions — 0.2 0.1 12.6 3.7 2.2 18.8 173.9 As at March 31, 2009 24.1 50.2 729.6 2,666.9 156.4 9.2 3,636.4 3,411.1 Depreciation:As at April 1, 2008 — 2.5 218.5 1,935.4 76.6 9.5 2,242.5 2,270.9 Depreciation for the year — 2.2 22.7 110.3 15.5 0.9 151.6 136.0 Deductions — — 0.1 12.3 2.5 2.2 17.1 164.4 As at March 31, 2009 — 4.7 241.1 2,033.4 89.6 8.2 2,377.0 2,242.5 Net Block:As at March 31, 2009 24.1 45.5 488.5 633.5 66.8 1.0 1,259.4 1,168.6 As at March 31, 2008 24.1 47.9 408.4 627.0 60.1 1.1 1,168.6 995.0 Capital work in progress**As at March 31, 2009 — — 47.5 163.8 0.2 — 211.5 40.0 As at March 31, 2008 — — 19.1 16.0 4.9 — 40.0 49.9
* Buildings include Rs. 0.03 million (Previous Year Rs. 0.03 million) being the value of shares in various co-operative societies.
** Capital work in progress includes capital advances Rs. 20.2 million (Previous Year Rs. 19.0 million) – Considered good.
# Plant & Machinery includes Gross Block Rs. 73.1 million (Previous Year Rs. 73.1 million), Accumulated Depreciation – Rs. 73.1 million (Previous Year Rs. 73.1 million) and Net Block Rs. Nil (Previous Year Rs. Nil) being the Company’s share of an asset jointly owned with another company.

32 Annual Report 2008-2009
Schedules to Balance Sheet as at March 31, 2009
4. Investments Rs. in million
March 31, 2009 March 31, 2008
(Non-Trade) — Unquoted — Long Term
Investment in 100% Subsidiary Company at cost (Ref. note 2)
BASF Polyurethanes India Limited— 9,000,000 Equity shares (Previous Year — 9,000,000) of Rs. 10 each fully paid
90.0 90.0
Other Investments
National Bank for Agriculture & Rural Development— Nil Bonds (Previous Year — 2900) of Rs. 10,000 each
— 29.0
90.0 119.0
5. Deferred Tax Assets (net)
March 31, 2009 March 31, 2008
(Ref. note 8)
Deferred tax assets 68.4 77.7 Deferred tax liabilities (65.9) (54.1)
2.5 23.6
6. Inventories
March 31, 2009 March 31, 2008
Raw Materials 1,078.0 565.1Finished Goods 856.0 611.4Stock-in-Process 21.3 28.2Packing Materials 49.4 41.8Fuel Oil 5.1 2.7
2,009.8 1,249.2
7. Sundry Debtors
March 31, 2009 March 31, 2008
Debts outstanding for a period exceeding six months Considered good: Secured — — Unsecured 12.7 31.9
12.7 31.9Considered doubtful 73.7 103.8 Other debtsConsidered good: Secured 54.2 47.5 Unsecured 1,305.9 1,507.5
1,360.1 1,555.0Considered doubtful 17.6 4.2
1,464.1 1,694.9Less: Provision for doubtful debts 91.3 108.0
1,372.8 1,586.9
(Ref. note 10 — Dues from companies under the same management)

BASF India Limited 33
Schedules to Balance Sheet as at March 31, 2009
8. Cash and Bank Balances Rs. in million
March 31, 2009 March 31, 2008
Cash on hand 0.2 0.4
Balances with Scheduled Banks :
— In Current Accounts 275.8 79.8
— In Deposit Accounts 1.0 1.4
277.0 81.6
9. Loans and Advances (Unsecured) — Considered Good
March 31, 2009 March 31, 2008
Advances recoverable in cash or in kind or for value to be received Includes due from
558.0 632.9
— Directors Rs. 0.71 million (Previous Year Rs. 0.78 million) Maximum amount outstanding during the year Rs. 0.78 million (Previous Year Rs. 0.85 million).
In the case of Directors, it represents loans given to them before they became Directors.
ICD to wholly owned subsidiary — BASF Polyurethanes India Limited Maximum amount during the year Rs. 605 million (Previous Year Rs. 450.0 million) 605.0 239.0
Interest accrued on ICD to subsidiary — not due 0.2 0.3
Duty Drawback receivable 4.4 5.6
Balances with Excise authorities 7.2 2.7
Balances with Income Tax authorities (Net of Provisions) 110.7 96.6
1,285.5 977.1
10. Current Liabilities
March 31, 2009 March 31, 2008
Sundry Creditors
— Micro & Small Enterprises (Refer Note 9) 1.3 1.4
— Others 2,198.3 1,394.2
Deposits 98.3 106.0
Unclaimed Dividend* 4.6 4.3
Unclaimed matured fixed deposits* 0.6 0.7
Unclaimed Interest warrants* 0.4 0.5
* (There are no amounts due and outstanding to be credited to Investor Education and Protection fund)
Other Liabilities 8.2 6.0
2,311.7 1,513.1
11. Provisions
March 31, 2009 March 31, 2008
Proposed Dividend 197.3 197.3
Corporate Tax on Dividend 33.6 33.6
Provision for Long Service Award 16.8 14.4
Provision for Leave Encashment 95.7 90.8
Provision for Gratuity 1.1 —
344.5 336.1

34 Annual Report 2008-2009
Schedules to Profit & Loss account for the year ended March 31, 2009
12. Sales and Services Rs. in million
March 31, 2009 March 31, 2008
Sale of Goods 11,638.6 9,813.3
Indent Commission/Technical/Service Charges 742.5 546.9
12,381.1 10,360.2
13. Other Income
March 31, 2009 March 31, 2008
Interest (Gross)— Interest on ICD to subsidiary Tax deducted at source Rs. 4.2 million
(Previous Year Rs. 3.5 million)
18.3
15.6
— Interest on Investments (Gross) — Non-Trade and Long Term Tax deducted at source Rs. Nil (Previous Year Rs. Nil)
1.6 1.6
— Others Tax deducted at source Rs. 6.1 million
(Previous Year Rs. 2.8 million)
21.0 13.1
Profit on sale of Fixed Assets (net) 1.9 —
Sale of Scrap 13.2 13.1
Sundries 29.5 3.5
85.5 46.9
14. Materials consumed
March 31, 2009 March 31, 2008
Raw Materials :
Stock at Commencement 565.1 558.8
Purchases 6,307.1 4,735.7
Stock at Close (1,078.0) (565.1)
5,794.2 4,729.4
Packing Materials consumed 277.8 241.9
6,072.0 4,971.3

BASF India Limited 35
Schedules to Profit & Loss account for the year ended March 31, 2009
15. Other Expenses Rs. in million
March 31, 2009 March 31, 2008
Salaries, Wages, Bonus and Commission (Ref. note 11) 697.1 578.5 Workmen and Staff Welfare (Ref. note 11) 111.4 143.1 Contribution to Provident and Other Funds (Ref. note 11) 78.9 95.6 Consumption of Stores and Spare Parts 45.1 49.2 Power and Fuel 231.8 208.9 Rent [Ref. note 7(b)] 185.9 109.5 Rates and Taxes — Excise Duty (10.6) 3.4 — Others 6.2 4.0 Repairs — Machinery 31.5 31.8 — Buildings 23.4 19.7 — Others 14.2 14.5 Insurance 22.6 23.7 Bad Debts Written off /(Recovered) 13.1 (5.0)Provision for Doubtful Debts (Net) (16.7) 5.1 Loss on Sale of Fixed Assets (Net) — 1.3 Service Fees 38.7 52.9 Travelling 159.1 155.7 Freight and Handling Charges 296.9 270.3 Communication/System Expenses 166.4 117.5 Sales Promotion Expenses 142.6 89.0 Professional Charges 75.6 57.0 Royalty 34.6 26.8 Voluntary Retirement Scheme 14.1 14.7 Sundry Expenses 271.6 240.2
2,633.5 2,307.4
16. Interest
March 31, 2009 March 31, 2008
On Short Term Loans 2.9 — On Others 12.0 12.8
14.9 12.8
17. Increase in Stocks
March 31, 2009 March 31, 2008
Stock at Close Finished Goods 856.0 611.4 Stock-in-Process 21.3 28.2 Sub-total 877.3 639.6 Stock at commencement Finished Goods (611.4) (527.4) Stock-in-Process (28.2) (28.2) Sub-total (639.6) (555.6)
Increase in stocks 237.7 84.0
18. Tax
March 31, 2009 March 31, 2008
Current Tax Expense (includes wealth tax Rs. 2.0 million Previous year Rs. 2.0 million) 347.8 319.7 Deferred Tax Charge/(Credit) 21.1 (3.7)Fringe Benefit Tax 24.8 20.3
393.7 336.3

36 Annual Report 2008-2009
19. Accounting Policies and Notes to Accounts (Amounts are shown in Millions of Rupees, abbreviated as Rs. Mio.)
1. Accounting Policies
(a) Basis of Accounting The financial statements are prepared under the historical cost convention, on accrual basis, in accordance
with provisions of Companies Act,1956 and the accounting principles generally accepted in India and comply with the Accounting Standards prescribed in the Companies (Accounting Standards) Rules, 2006 issued by the Central Government, in consultation with the National Advisory Committee on Accounting Standards, to the extent applicable. The financial statements are presented in Millions of Indian Rupees.
(b) Use of estimates The presentation of financial statements in conformity with the generally accepted accounting principles
requires estimates and assumptions to be made that affect the reported amount of assets and liabilities and disclosure of contingent liabilities as on the date of the financial statements and the reported amount of revenues and expenses during the reporting period. Difference between the actual result and estimates are recognised in the period in which the results are known/materialise.
(c) Revenue Recognition Sales of products and Indent Commission are recognised when risk and rewards of ownership of the
products are passed on to the customers, which is generally on despatch of goods. Revenue from technical and service charges are recognised as and when the services are provided. Sales include excise duty but exclude trade discounts, rebates and sales tax. Interest on investments is booked on a time proportion basis taking into account the amounts invested and the rate of interest.
(d) Fixed Assets Fixed Assets are recorded at cost net of Cenvat credit wherever eligible. Cost includes all expenses and
interest attributable to the project till the date it is ready to use. The carrying amounts of assets are reviewed at each Balance Sheet date if there is any indication of impairment based on internal / external factors. Impairment is recognised when the carrying amount of the asset exceeds its recoverable amount. Impairment loss is charged to the Profit and Loss Account in the year in which an asset is identified as impaired. An impairment loss recognised in prior accounting periods is reversed if there has been a change in the estimate of the recoverable amount.
(e) Depreciation Depreciation is charged on straight-line basis at the following rates:
Buildings — 3.34%
Plant & Machinery — 10.34% - 20%
Computers — 25.00%
Vehicles — 25.00%
Furniture, Fixtures & Equipment — 12.50%
Assets Individually costing Rs. 5,000 or below — 100.00%
Depreciation on additions/deletions is calculated on a monthly pro-rata basis. Accelerated depreciation is charged on certain assets based on periodic review of estimated useful life.
Leasehold land is amortised over the period of lease.
(f) Borrowing costs Borrowing costs that are attributable to the acquisition or construction of qualifying assets are capitalised.
Other borrowing costs are recognised as an expense in the period in which they are incurred.
(g) Investments Long-term Investments are stated at cost. Provision is made to recognise a decline, other than temporary, in
the value of Long-term Investments. Current Investments are stated at lower of cost or fair value.
(h) Inventories Inventories are valued at cost or net realisable value, whichever is lower. The costs are worked out on
weighted average basis. Fixed production overheads are allocated on the basis of normal capacity of production facilities. Excise duty on goods manufactured by the Company and remaining in inventory is included as a part of valuation of finished goods.
(i) Foreign Currency Transactions in foreign currencies are recorded at the exchange rates prevailing on the date of transaction.
Monetary items in foreign currencies are stated at the closing exchange rate. The forward exchange contracts are backed by underlying transactions, the premium or discount arising at the inception of such a forward exchange contract is amortised as expense or income over the life of the contract and the difference between the year end rate and rate on the date of the contract is recognised as exchange difference in the Profit and Loss Account. Gains/losses on conversion/translation have been recognised in the Profit and Loss Account.

BASF India Limited 37
(j) Employee Benefits
(A) Short-Term Employee Benefits All employee benefits payable wholly within twelve months of rendering the service are classified as
short term employee benefits and are recognized in the Profit and Loss Account as an expense at the undiscounted amount on an accrual basis.
(B) Post Employment Employee Benefits Company’s contributions to defined contribution plans such as Superannuation Fund, Family Pension
Fund, Group Mediclaim Insurance Policy, Employee State Insurance and Labour Welfare Fund are recognized in the Profit and Loss Account on an accrual basis.
Company’s liability towards Gratuity, which is a defined benefit plan, is determined on the basis of valuations, as at balance sheet date, carried out by an independent actuary using Projected Unit Credit Method. Actuarial gains and losses comprise experience adjustments and the effects of changes in actuarial assumptions and are recognised immediately in the Profit and Loss Account.
Company’s contribution to Provident Fund is recognised in the Profit and Loss Account on accrual basis.
(C) Other Long-Term Employee Benefits Company’s liabilities towards Compensated Absences & Long Service Awards to employees are
determined on the basis of valuations, as at balance sheet date, carried out by an independent actuary using Projected Unit Credit Method. Actuarial gains and losses comprise experience adjustments and the effects of changes in actuarial assumptions and are recognised immediately in the Profit and Loss Account.
(D) Termination Benefits Compensation paid to employees under Voluntary Retirement Scheme is recognised as an expense
when incurred.
(k) Assets taken on lease Lease rentals payable as per agreements for assets taken on operating lease are charged as expenditure
on Straight Line basis over the lease term.
(l) Taxes on Income Current tax is determined as the amount of tax payable in respect of taxable income for the period computed
in accordance with relevant provisions of Income Tax Act, 1961. Deferred tax charge or credit and correspondingly deferred tax asset or liability is recognised using tax rates
that have been enacted or substantively enacted at the Balance Sheet date. Deferred tax is recognised, subject to the consideration of prudence, on timing differences, being the difference between taxable income and accounting income that originate in one period and are capable of reversal in one or more subsequent periods. Deferred tax assets are not recognised on unabsorbed depreciation and carry forward of losses unless there is virtual certainty that sufficient future taxable income will be available against which such deferred tax assets can be realised. Deferred tax assets are reviewed at each Balance Sheet date and written down or written up to reflect the amount i.e. reasonable/virtually certain (as the case may be) to be realised.
(m) Fringe benefit tax Provision for fringe benefit tax (FBT) has been recognised on the basis of harmonious contextual interpretation
of the provisions of Income Tax Act, 1961.
(n) Provisions, Contingent Liabilities and Contingent Assets Provisions are recognised only when there is a present obligation as a result of past events it is more likely
than not that an outflow of resources will be required to settle the obligation and when a reliable estimate of the amount of the obligation can be made.
Contingent Liability is disclosed for (i) Possible obligations which will be confirmed only by future events not wholly within the control of the Company or (ii) Present obligations arising from past events where it is not probable that an outflow of resources will be required to settle the obligation or a reliable estimate of the amount of the obligation cannot be made.
Contingent Assets are not recognised in the financial statements.
(o) Research & Development Expenditure Revenue expenditure is recognised as an expense in the period in which it is incurred and the expenditure
on capital assets is depreciated over the useful lives of the assets.
(p) Earning per share The basic and diluted earnings per share is computed by dividing the net profit attributable to equity
shareholders for the year, by the weighted average number of equity shares outstanding during the year.
2. BASF SE, vide agreement dated 1st July, 2006, has discretion to acquire the Company’s investment in its wholly owned subsidiary BASF Polyurethanes India Limited (‘BPIL’). During the current year, BASF SE has communicated its intent to acquire the shareholding in BPIL subject to certain conditions. Management is in the process of assessing the feasibility of these conditions.

38 Annual Report 2008-2009
3. Contingent Liabilities not provided for: (a) Claims against the Company not acknowledged as debts: Rs. 26.0 Mio. (Previous Year Rs. 25.9 Mio.) in
respect of which the Company has counter claims of Rs. 67.0 Mio. (Previous Year Rs. 67.0 Mio.). (b) Demands for taxes and duties in respect of which the Company has preferred appeals with appropriate
authorities – a. Income tax : Rs. 61.0 Mio. (Previous Year Rs. 45.3 Mio.) b. Others : Rs. 2.2 Mio. (Previous Year Rs. 3.3 Mio.)
4. Estimated amount of contracts remaining to be executed on capital account and not provided (net of advances) for Rs. 83.2 Mio. (Previous Year Rs. 27.4 Mio.).
5. The exchange loss of Rs. 75.0 Mio. (Previous Year loss of Rs. 8.0 Mio) has been included in the Profit and Loss Account for the year.
6. Expenditure on Research and Development charged to Profit and Loss Account Rs. 96.1 Mio. (Previous Year Rs. 76.4 Mio.).
7. The Company has taken certain assets under operating leases.(a) Total minimum lease payments in this respect are as follows:
Rs. Mio.
2008-09 2007-08DueNot later than one year 14.3 16.4Later than one year but not later than five years 12.5 18.4Later than five years 1.4 2.0Total 28.2 36.8
(b) Lease rent of Rs. 26.9 Mio. (Previous Year Rs. 23.4 Mio.) has been included under ‘Rent’ in the Profit and Loss Account.
8. Deferred Tax: The break up of Deferred Tax Assets (Net) as at March 31, 2009 is as under: Rs. Mio.
2008-09 2007-08
Deferred Tax Assets
Timing differences on account of:Provision for doubtful debts 31.0 36.7Expenditure under Voluntary Retirement Scheme 12.2 12.0Others 25.2 29.0Total Deferred Tax Assets 68.4 77.7Deferred Tax LiabilitiesTiming difference on account of:Fixed Assets (65.9) (54.1)Total Deferred Tax Liabilities (65.9) (54.1)Deferred Tax Assets (Net) 2.5 23.6
9. Micro, Small and Medium Enterprises Development Act, 2006 (MSME). On the basis of the information and records available with the Management, the following disclosures pursuant to
the above Act are made for the amounts due to the Micro and Small enterprises, who have registered with the competent authorities:
Rs. Mio.
Particulars 2008-09 2007-08
The principal amount and the interest due thereon remaining unpaid to any Micro/Small supplier. 1.3 1.4
The interest paid by the buyer as above, along with the amount of payments made beyond the appointed date during each accounting year. — —
The amount of interest due and payable for the period of delay in making payment (which has been paid but beyond the appointed day during the year) but without adding the interest specified. — —
The amount of interest accrued and remaining unpaid at the end of each accounting year. 0.2 0.3
The amount of further interest remaining due and payable even in the succeeding years, until such date when the interest dues as above are actually paid to the small/micro enterprise. 0.5 0.3

BASF India Limited 39
10. Sundry debtors, unsecured and considered good, include the following amounts due from companies under the same management:
Rs. Mio.
2008-09 2007-08
BASF Construction Chemicals (India) Private Ltd. 77.2 67.4
BASF Coatings (India) Private Ltd. 43.5 49.4
BASF Styrenics Private Limited 10.0 10.4
BASF Kanoo Gulf FZE 5.4 —
BASF Catalysts India Pvt. Ltd. 5.1 2.0
BASF Polyurethanes India Ltd. 4.4 —
BASF East Asia Regional Headquarters Limited 4.3 5.7
BASF Asia-Pacific (India) Pvt. Ltd. 2.5 —
BASF China Limited 1.6 4.3
BASF Fine Chemicals Switzerland S.A. 1.5 2.2
BASF Corporation 1.3 0.2
BASF Espanola, S.L. 0.7 —
BASF Polyurethanes (Taiwan) Co. Ltd. 0.6 0.6
BASF JCIC Neopentylglycol Co. Ltd. 0.6 0.6
BASF-Finlay (Private) Limited 0.5 0.5
BASF (China) Company Ltd. 0.1 —
BASF Chemicals and Polymers Pakistan (Pvt.) Ltd. 0.1 —
BASF SE — 23.0
BASF Asia Pacific Service Centre Sdn. Bhd. — 8.2
BASF Curtex S.A. — 0.8
BASF (Thai) Ltd. — 0.7
BASF Company Ltd. — 0.5
Total 159.4 176.5
11. Employees Benefits: Defined contribution plans
Company’s contribution to defined contribution funds amounting to Rs. 60.6 Mio. (Previous year Rs. 66.3 Mio.) has been charged to the Profit & Loss Account.
Defined benefit plans and other Long term employee benefits.
Gratuity is payable to all eligible employees of the Company on superannuation, death, permanent disablement and resignation in terms of provisions of the Payment of Gratuity Act, 1972, or as per the Company’s scheme whichever is more beneficial. The Company irrevocably contributes funds to a separate Gratuity Trust which is recognised by Income Tax authorities.
Eligible employees can carry forward and encash leave on superannuation, death, permanent disablement and resignation as per Company’s policy.
Long Service Awards are payable to employees on completion of specified years of service at the rate of 0.5 month to 1.5 months eligible salary.
Rs. Mio.
Gratuity (Funded)
2008-09
Gratuity(Funded) 2007-08
A. Expense recognized in the Profit & Loss Account for the year ended 31st March
1. Current Service Cost 11.0 12.2
2. Interest 10.8 8.2
3. Expected Return on Plan Assets (12.8) (10.1)
4. Actuarial (Gain)/Loss 10.7 18.8
5. Past service cost — —
6. Total Expense 19.7 29.1

40 Annual Report 2008-2009
Gratuity (Funded)
2008-09
Gratuity(Funded) 2007-08
B. Net Asset/(Liability) recognized in the Balance Sheet as at 31st March
1. Present Value of Defined Benefit Obligation as at 31st March
173.3 146.0
2. Fair Value of Plan assets as at 31st March 172.2 158.1
3. Funded Status [Surplus / (Deficit)] (1.1) 12.1
4. Net Asset / (Liability) as at 31st March (1.1) 12.1
C. Change in obligation during the year ended 31st March
1. Present value of the defined benefit obligation at the beginning of the year
146.0 112.8
2. Current Service Cost 11.0 12.2
3. Interest Cost 10.8 8.2
4. Actuarial (Gain) / Loss 18.1 19.7
5. Benefits Paid (12.6) (6.9)
6. Present value of the defined benefit obligation at the end of the year
173.3 146.0
D. Change in fair value of assets during the year ended 31st March
1. Fair Value of Plan assets at the beginning of the year 158.1 112.8
2. Expected Return on plan assets 12.8 10.1
3. Contributions by the Employer 6.5 41.2
4. Actual Benefits Paid (12.6) (6.9)
5. Actuarial Gain / (Loss) on Plan Assets 7.4 0.9
6. Fair Value of Plan assets at the end of the year 172.2 158.1
Total Actuarial gain / (loss) to be recognised (10.7) 18.8
E. Actual Return on Plan Assets
1. Expected Return on plan assets 12.8 10.1
2. Actuarial Gain/(Loss) on Plan Assets 7.4 0.9
3. Actual return on Plan Assets 20.2 11.0
F. Movement in net liability recognised in the Balance Sheet
1. Opening Net Liability / (Asset) (12.1) —
2. Expenses 19.7 29.1
3. Contribution (6.5) (41.2)
Closing Net Liability / (Asset) 1.1 (12.1)
Rs. Mio.
Leave (Unfunded)
2008-09
Leave(Unfunded)
2007-08
A. Expense recognized in the Profit & Loss Account for the year ended 31st March
1. Current Service Cost 2.6 2.3
2. Interest 6.7 4.7
3. Expected Return on Plan Assets — —
4. Actuarial (Gain) / Loss 3.7 24.3
5. Past service cost — —
6. Total Expense 13.0 31.3
Rs. Mio.

BASF India Limited 41
Leave (Unfunded)
2008-09
Leave(Unfunded)
2007-08
B. Net Asset/(Liability) recognized in the Balance Sheet as at 31st March
1. Present Value of Defined Benefit Obligation as at 31st March
95.7 90.8
2. Fair Value of Plan assets as at 31st March — —
3. Funded Status [Surplus / (Deficit)] (95.7) (90.8)
4. Net Asset/(Liability) as at 31st March (95.7) (90.8)
C. Change in obligation during the year ended 31st March
1. Present value of the defined benefit obligation at the beginning of the year
90.8 64.9
2. Current Service Cost 2.6 2.3
3. Interest Cost 6.7 4.7
4. Actuarial (Gain) / Loss 3.7 24.3
5. Benefits Paid (8.1) (5.4)
6. Present value of the defined benefit obligation at the end of the year
95.7 90.8
D. Change in fair value of assets during the year ended 31st March
1. Fair Value of Plan assets at the beginning of the year — —
2. Expected Return on plan assets — —
3. Contributions by the Employer 8.1 5.4
4. Actual Benefits Paid (8.1) (5.4)
5. Actuarial Gain / (Loss) on Plan Assets — —
6. Fair Value of Plan assets at the end of the year — —
Total Actuarial gain / (loss) to be recognised (3.7) (24.3)
E. Actual Return on Plan Assets
1. Expected Return on plan assets — —
2. Actuarial Gain / (Loss) on Plan Assets — —
3. Actual return on Plan Assets — —
F. Movement in net liability recognised in the Balance Sheet
1. Opening Net Liability / (Asset) 90.8 64.9
2. Expenses 13.0 31.3
3. Contribution (8.1) (5.4)
Closing Net Liability / (Asset) 95.7 90.8
Rs Mio.
Long Service Awards
(Unfunded)2008-09
Long Service Awards
(Unfunded) 2007-08
A. Expense recognized in the Profit & Loss Account for the year ended 31st March
1. Current Service Cost 0.5 0.6
2. Interest 0.8 0.9
3. Expected Return on Plan Assets — —
4. Actuarial (Gain)/Loss 1.1 1.4
5. Past service cost — 12.4
6. Total Expense 2.4 15.3
Rs. Mio.

42 Annual Report 2008-2009
Long Service Awards
(Unfunded)2008-09
Long Service Awards
(Unfunded) 2007-08
B. Net Asset/(Liability) recognized in the Balance Sheet as at 31st March
1. Present Value of Defined Benefit Obligation as at 31st March
16.8 14.4
2. Fair Value of Plan assets as at 31st March — —
3. Funded Status [Surplus / (Deficit)] (16.8) (14.4)
4. Net Asset / (Liability) as at 31st March (16.8) (14.4)
C. Change in obligation during the year ended 31st March
1. Present value of the defined benefit obligation at the beginning of the year
14.4 12.4
2. Current Service Cost 0.5 0.6
3. Interest Cost 0.8 0.9
4. Actuarial (Gain) / Loss 1.1 1.4
5. Benefits Paid — (0.9)
6. Present value of the defined benefit obligation at the end of the year
16.8 14.4
D. Change in fair value of assets during the year ended 31st March
1. Fair Value of Plan assets at the beginning of the year — —
2. Expected Return on plan assets — —
3. Contributions by the Employer — 0.9
4. Actual Benefits Paid — (0.9)
5. Actuarial Gain / (Loss) on Plan Assets — —
6. Fair Value of Plan assets at the end of the year — —
Total Actuarial gain / (loss) to be recognised (1.1) (1.4)
E. Actual Return on Plan Assets
1. Expected Return on plan assets — —
2. Actuarial Gain / (Loss) on Plan Assets — —
3. Actual return on Plan Assets — —
F. Movement in net liability recognised in the Balance Sheet
1. Opening Net Liability / (Asset) 14.4 12.4
2. Expenses 2.4 2.9
3. Contribution — (0.9)
Closing Net Liability / (Asset) 16.8 14.4
The plan assets under the Gratuity scheme are deposited under approved securities. The major categories of plan assets as a percentage of total plan assets are provided below:
2008-09 2007-08GOI Securities 27% 42%State Government Securities 15% 15%PSU Bonds 58% 39%Private Sector Bonds — 4%Total 100% 100%
The assumptions used for actuarial valuation as at 31st March, 2009 are as follows:
2008-09 2007-08Expected rate of return on plan assets 7.7% p.a. 7.5% p.a.Discount Rate 7.7% p.a. 7.5% p.a.Expected salary increase rate 6% – 8% p.a. 6% – 8% p.a.In-service mortality rates LIC 1994-96 ultimate table LIC 1994-96 ultimate table
Rs. Mio.

BASF India Limited 43
The expected rate of return on assets is based on the expectation of the average long term rate of return on investment of the fund, during the estimated term of obligation.
The obligations are measured at the present value of estimated future cash flows by using a discount rate that is determined with reference to the market yields at the Balance Sheet date on Government Bonds which is consistent with the estimated terms of the obligation.
The estimate of future salary increase, considered in the actuarial valuation, takes account of inflation, security, promotion and other relevant factors such as supply and demand in the employment market.
The Guidance Note on implementing AS 15, Employee Benefits (revised 2005) issued by the Accounting Standards Board (ASB) states that provident funds set up by employers, which requires interest shortfall to be met by the employer, needs to be treated as defined benefit plan. Pending the issuance of the Guidance Note from Actuarial Society of India, the required information can not be exhibited.
12. Managerial Remuneration under Section 198 of the Companies Act, 1956, (excluding provision for contribution to Gratuity Fund, Group Insurance and Long Service Awards) is Rs. 41.1 Mio. (Previous Year Rs. 35.6 Mio.).
Rs. Mio.
2008-09 2007-08
Salaries 30.2 25.8
Contribution to Provident and Superannuation Funds 4.5 3.7
Monetary Value of other perquisites 4.4 4.1
Commission to non-whole time directors 2.0 2.0
Total 41.1 35.6
13. Computation of Net Profit in accordance with Section 349 of the Companies Act, 1956:
Rs. Mio.
2008-09 2007-08
Profit before Tax 1,080.1 930.0
Add: Provision for doubtful debts — 5.1
Loss on sale of assets — 1.3
Managerial remuneration 41.1 35.6
41.1 42.0
Less: Profit on sale of assets 1.9 —
Provision for doubtful debts written back 16.7 —
18.6 —
Net profit u/s 349 for the purpose of Directors’ Commission 1,102.6 972.0
Maximum remuneration permissible to whole-time directors under the Act at 10%
110.3 97.2
Commission payable to non-whole time directors at 1% 11.0 9.7
Commission restricted as determined by the Board of Directors 2.0 2.0
14. Auditors’ Remuneration (excluding service tax):
Rs. Mio.
2008-09 2007-08
As Auditors 4.2 3.8
In other capacity (limited reviews, tax audit and certification) 2.3 2.4
Reimbursement of out of pocket expenses 0.6 0.6
Total 7.1 6.8

44 Annual Report 2008-2009
15. Segment Information for the year ended March 31, 2009:
(a) PRIMARY SEGMENT INFORMATION (by Business Segments)
The previous year’s figures are given in light type below each item Rs. Mio.
Agricultural
Solution Performance
Products Plastics Chemicals Others Un-
allocated Total
Segment Revenue 3,702.1 5,348.0 1,480.6 349.1 276.2 — 11,156.0 2,446.2 4,744.6 1,463.2 319.3 153.4 — 9,126.7Less: Inter-segment revenue — — — — — — —
Sales/Income from 3,702.1 5,348.0 1,480.6 349.1 276.2 — 11,156.0operations 2,446.2 4,744.6 1,463.2 319.3 153.4 — 9,126.7Segment Result 643.0 361.1 23.3 136.2 15.1 — 1,178.7 519.6 337.3 79.4 109.4 8.4 — 1,054.1Interest Expense 14.9 14.9 12.8 12.8Interest Income 40.9 40.9 30.3 30.3Other un-allocable expenditure 124.6 124.6net of un-allocable income 141.6 141.6Profit Before Tax 1,080.1 930.0Tax 393.7 393.7
336.3 336.3Profit After Tax 686.4 593.7
OTHER INFORMATION
Segment Assets 1,614.4 3,062.4 615.1 97.3 5.0 1,114.3 6,508.5 770.0 3,158.0 652.7 105.2 — 560.1 5,246.0Segment Liabilities 1,181.4 907.6 297.9 31.4 — 237.9 2,656.2 664.3 672.4 245.5 29.0 — 238.0 1,849.2Capital Expenditure 46.0 233.2 130.1 6.3 — — 415.6 23.5 182.1 97.4 6.2 — — 309.2Depreciation 17.9 112.9 17.4 3.4 — — 151.6 19.1 103.9 10.3 2.7 — — 136.0
(b) SECONDARY SEGMENT INFORMATION (by Geographic Segments)Rs. Mio.
Domestic Exports Total
Revenues 9,928.3 1,227.7 11,156.08,248.4 878.3 9,126.7
Total Assets 6,447.8 60.7 6,508.55,136.7 109.3 5,246.0
Capital Expenditure 415.6 — 415.6309.2 — 309.2
Notes on Segment Information:
1. Segments have been identified in accordance with the Accounting Standard on Segment Reporting (AS-17). Business Segments have been considered as primary segments.
2. Details of type of products included in each segment — — Agricultural Solution — Agrochemicals like pesticides and herbicides. — Performance Products – Tanning agents, Leather Chemicals, Textile Chemicals, Dispersion Chemicals,
Speciality Chemicals and high-value fine chemicals for the food, pharmaceuticals, animal feed and cosmetics industries.
— Plastics – Expandable Polystyrene (EPS) and engineering plastics. — Chemicals – Chemicals includes inorganic chemicals, intermediates and petrochemicals. — Others – Indent Commission income not relating to any of the above segments, Technical and Service
charges. 3. Un-allocable Corporate Assets include Investments, Net Deferred Tax Assets and other un-allocable assets. 4. Un-allocable Corporate Liabilities include Proposed dividend and other un-allocable liabilities.

BASF India Limited 45
16. Capacities, Production, Purchases turnover and Stocks: The previous year’s figures are given in light type below each item
Class of Goods Quantitative denomi-nation
Capacity Production/ Purchases
Quantity
Stock at Commen-
cementQuantity
Stock at Close
Quantity
TurnoverLicensed Installed Quantity Amount
(Mio.)
(a) Manufactured goods:
Expandable Polystyrene
(Styropor)
M.T. ** 30,00030,000
18,38014,672
38170
6838
18,35014,804
1,313.21,095.3
Leather Auxiliaries (Organic
Chemicals)
M.T. ** 15,00015,000
12,23712,808
493791
448493
12,28213,106
838.0854.5
Leather Auxiliaries, Finishing Agents
and Pigments
M.T. ** 7,3507,350
6,0907,327
665698
617665
6,1387,360
1,118.71,181.4
Leather Chemicals and Auxiliaries including Metal Complex Dyes & Acrylic Polymers and Carboxylated Styrene Butadiene Lattices
M.T. ** 67,22567,225
36,99031,218
3,1461,575
2,3783,146
37,75829,647
2,629.21,909.2
Pesticides
– Formulation M.T. * 1,2691,574
198129
166198
1,3011,505 2,630.4
2,433.6K.L. * 6,4616,802
640525
714640
6,3876,687
(b) Traded Goods:
Agro and Other Chemicals
M.T./K.L. Not Applicable 7,3158,831
1,4371,714
1,3941,437
7,3589,108
1,884.01,105.8
Value of Purchases – Rs. 1,527.1 Mio. (Previous year Rs. 900.1 Mio.)
* The capacity varies depending on the product mix. ** Delicensed vide Gazette Notification No. S.O.477(E) dated 25.07.91.
Notes: (a) Value of stocks in Rs. Mio.:
2008-09 2007-08
Closing Stock 856.0 611.4
Opening Stock 611.4 527.4
(b) The installed capacity has been certified by Technical Management of the Company and not verified by the Auditors, this being a technical matter.
(c) The figures of production are excluding captive consumption and the figures of stocks are after adjustment of shortages/excesses.
(d) The Company has licenses to manufacture 300 M.T. of Expanded Polystyrene (Thermocole) and 200 M.T. of Dimethoate.

46 Annual Report 2008-2009
117. Consumption of Raw Materials, Components and Spare Parts:
(a) Raw Materials:
2008-09 2007-08% Rs. Mio. % Rs. Mio.
Imported 72.9 4,225.2 64.6 3,053.6Indigenous 27.1 1,569.0 35.4 1,675.8
100.0 5,794.2 100.0 4,729.4
M.T. Rs. Mio. M.T. Rs. Mio.Monomer 39,243 2,240.8 24,727 1,457.5Agro Technical 1,575 1,136.3 388 585.1Napthalene 3,826 198.2 2,860 155.4Phenol 1,051 69.2 880 67.2Caustic Soda Lye 6,447 75.9 5,173 52.5Formaldehyde 3,901 42.4 4,316 49.3Vegetable Oil 389 15.8 291 18.2Others 2,015.6 — 2,344.2
5,794.2 4,729.4
(b) Components and Spare Parts:
2008-09 2007-08% Rs. Mio. % Rs. Mio.
Imported 1.8 0.8 2.0 1.0Indigenous 98.2 44.3 98.0 48.2
100.0 45.1 100.0 49.2
18. Value of direct import on C.I.F. basis during the year (including in-transit):Rs. Mio.
2008-09 2007-08Raw Materials 3,858.3 2,451.0Capital Goods 101.8 27.6Components and Spare Parts 0.8 1.0Finished Goods 762.3 754.6
4,723.2 3,234.2
19. Expenses in foreign currencies during the year (on accrual basis):Rs. Mio.
2008-09 2007-08Royalty (net of tax) 31.4 23.9Communication/System Expenses (net of tax) 150.3 111.2Foreign Travel 16.2 18.7Commission 10.1 11.0Consultancy charges 6.2 2.8Others 117.9 83.0
332.1 250.6
20. Amount remitted in foreign currencies during the year on account of dividends (after tax):Rs. Mio.
2008-09 2007-08Equity Shares:Amount remitted (Rs. Mio.) 104.0 104.0Number of non-resident shareholders 1 1Number of Equity Shares of Rs. 10/- each held by non-resident on which dividends were due 14,853,020 14,853,020Year to which dividend relates 2007-2008 2006-2007

BASF India Limited 47
21. Earnings in foreign currencies during the year (on accrual basis): Rs. Mio.
2008-09 2007-08
Exports of goods calculated on FOB basis (Excludes Rupee Exports to Nepal & Bhutan – Rs. 4.6 Mio. – Previous Year Rs. 3.0 Mio.)
566.1 370.3
Indent Commission/Technical/Service Charges 608.8 492.2
Others (Freight / Insurance / Claims) 48.2 12.8
1,223.1 875.3
22. Related Party Disclosures:
(a) Parties where control exists
BASF SE Holding Company (holds 71.18% of the equity share capital as on March 31, 2009)
BASF Polyurethanes India Ltd. 100% Subsidiary
(b) Other related parties with whom transactions have taken place during the year
Fellow Subsidiaries
BASF S.A. BASF Espanola, S.L.
BASF (China) Company Ltd. BASF Japan Ltd. (BJL)
BASF (Malaysia) Sdn. Bhd BASF JCIC Neopentylglycol Co. Ltd.
BASF (Thai) Ltd. BASF Pakistan (Private) Ltd.
BASF Agro B.V. Arnhem (NL) BASF Petronas Chemicals Sdn. Bhd.
BASF Agri Production SAS BASF Philippines, Inc.
BASF Asia Pacific Service Centre Sdn. Bhd. BASF Polyurethanes (Malaysia) Sdn Bhd
BASF Auxiliary Chemicals Co. Ltd. BASF Polyurethanes (Taiwan) Co. Ltd.
BASF Bangladesh Ltd. BASF South East Asia Pte. Ltd.
BASF Chemtrade GmbH BASF Styrenics Private Limited*
BASF Chemicals and Polymers Pakistan (Pvt.) Ltd. BASF Tuerk Kimya Sanayi Ve Ticaret Ltd. Sti.
BASF China Limited BASF-Finlay (Private) Limited
BASF Coatings (India) Private Ltd. BTC Speciality Chemical Distribution GmbH
BASF Company Ltd. Elastogran GmbH
BASF Construction Chemicals (India) Private Ltd. BASF Italia SPA
BASF Corporation K+S Kali GmbH
BASF Curtex S.A. P.T. BASF Indonesia
BASF East Asia Regional Headquarters Limited BASF Antwerpen N. V.
BASF Construction Chemicals, Dubai BASF Agrochemical Products B.V.
BASF IT Services Holding GmbH BASF Australia Ltd.
BASF Kanoo Gulf FZE BASF South Africa (Pty) Ltd.
BASF Catalysts India Pvt. Ltd. BASF Asia-Pacific (India) Pvt. Ltd.
BASF Polyurethane Specialties (China) Company Ltd. BASF Fine Chemicals Switzerland S.A.
* Group company 100% held by BASF Styrenics Holding Company, Mauritius which is 100% held by BASF SE.
(c) Key Management Personnel
Chairman & Managing Director
Mr. Prasad Chandran
Whole-Time Directors
Mr. S. Ramnath (Alternate to Mr. Hermann Althoff)
Mr. R. Y. Vaidya (Alternate to Dr. Rainer Diercks)
Mr. Deepak Thuse (Alternate to Dr. Tilman Krauch)

48 Annual Report 2008-2009
(d) Details of transactions of Holding Company/Subsidiary and Fellow subsidiaries for the year ended March 31, 2009:
Rs. Mio.
Nature of Transactions Holding Company/ Subsidiary
Fellow Subsidiaries Total
2008-09 2007-08 2008-09 2007-08 2008-09 2007-08
Sale of Goods
BASF SE 21.0 19.0 — — 21.0 19.0BASF Polyurethanes India Ltd. 0.8 — — — 0.8 —BASF South East Asia Pte. Ltd. — — 207.7 113.4 207.7 113.4BASF Coatings (India) Private Ltd. — — 127.3 145.4 127.3 145.4BASF Construction Chemicals (India) Private Ltd.
— — 300.2 152.2 300.2 152.2
Others — — 66.9 28.8 66.9 28.8Sub-Total 21.8 19.0 702.1 439.8 723.9 458.8
Services Rendered(including reimbursements)
BASF SE 197.7 125.7 — — 197.7 125.7BASF Polyurethanes India Ltd. 52.1 33.8 — — 52.1 33.8BASF South East Asia Pte. Ltd. — — 382.7 265.0 382.7 265.0BASF Petronas Chemicals Sdn. Bhd. — — 71.2 94.1 71.2 94.1Others — — 146.3 25.6 146.3 25.6Sub-Total 249.8 159.5 600.2 384.7 850.0 544.2
Interest Income on Loans
BASF Polyurethanes India Ltd. 18.3 15.6 — — 18.3 15.6
Purchase of Goods/Materials
BASF SE 163.9 99.1 — — 163.9 99.1BASF South East Asia Pte. Ltd. — — 1,733.6 1,665.1 1,733.6 1,665.1BASF AGRO B.V. Arnhem (NL) — — 670.7 317.3 670.7 317.3BASF Agrochemical Products B.V. — — 1,180.0 269.3 1,180.0 269.3Others — — 464.4 557.1 464.4 557.1Sub-Total 163.9 99.1 4,048.7 2,808.8 4,212.6 2,907.9
Services Received
BASF SE 58.8 47.1 — — 58.8 47.1BASF South East Asia Pte. Ltd. — — 155.0 77.5 155.0 77.5BASF Asia-Pacific Service Centre — — 68.3 36.7 68.3 36.7Others — — 12.0 11.1 12.0 11.1Sub-Total 58.8 47.1 235.3 125.3 294.1 172.4
Purchase of Assets
BASF SE 7.0 1.0 — — 7.0 1.0BASF South East Asia Pte. Ltd. — — 34.6 — 34.6 —BASF Philippines Inc. — — — 0.1 — 0.1Others — — 0.4 — 0.4 —Sub-Total 7.0 1.0 35.0 0.1 42.0 1.1
Royalty and Technical Fees
BASF SE 34.6 26.8 — — 34.6 26.8
Dividend
BASF SE 104.0 104.0 — — 104.0 104.0
ICD Placed
BASF Polyurethanes India Ltd. 8,725.0 8,512.0 — — 8,725.0 8,512.0
ICD Recovered
BASF Polyurethanes India Ltd. 8,359.0 8,433.0 — — 8,359.0 8,433.0

BASF India Limited 49
Nature of Transactions Holding Company/ Subsidiary
Fellow Subsidiaries Total
2008-09 2007-08 2008-09 2007-08 2008-09 2007-08
Interest accrued on loan to subsidiary – not due
BASF Polyurethanes India Ltd. 0.2 0.3 — — 0.2 0.3
Outstanding Receivables
BASF SE — 23.0 — — — 23.0BASF Polyurethanes India Ltd. 4.4 — — — 4.4 —BASF Construction Chemicals Private Ltd. — — 77.2 67.4 77.2 67.4BASF Coatings (India) Private Ltd. — — 43.5 49.4 43.5 49.4Others — — 34.3 36.9 34.3 36.9Sub-Total 4.4 23.0 155.0 153.7 159.4 176.7
Payables
BASF SE 0.9 — — — 0.9 —BASF Agrochemical Products B.V. — — 533.2 — 533.2 —BASF Agro B.V., Arnhem (NL) — — 219.4 34.6 219.4 34.6BASF South East Asia Pte Ltd — — 161.4 242.8 161.4 242.8Others — — 94.5 187.7 94.5 187.7Sub-Total 0.9 — 1,008.5 465.1 1,009.4 465.1
ICD Outstanding
BASF Polyurethanes India Ltd. 605.0 239.0 — — 605.0 239.0
(e) Details of transactions of Key Management Personnel: Rs. Mio.
Nature of Transactions Key Management Personnel
2008-09 2007-08
Interest Income on Loans 0.1 0.1
Remuneration 39.1 33.6
Outstanding :Receivable 0.7 0.8
Details of remuneration to Directors are given in Note 12.
Amounts due from directors and interest recovered thereon have been included under Schedule 9 of the Balance Sheet and Schedule 13 of the Profit and Loss Account under Interest – Others respectively.
23. As on 31st March, 2009 the Company has 20 forward contracts totaling to USD 17.5 Mio (Rs. 900.2 Mio.) for the purposes of hedging its foreign exposure. The unamortized premium of Rs. 7.7 Mio. pertaining to the same will be recognized subsequently. Foreign currency exposure that is not hedged as at 31st March is as follow:
2008-09
Receivable Payable
Foreign Currency Foreign Currency Amount
Rs. in Mio. Foreign Currency Amount
Rs. in Mio.
EURO 376,643 25.1 187,733 12.9
AUD 64,770 2.3
USD 1,801,430* 95.5
SGD 115,494 4.0
CHF 4,850 0.2
GBP 219 —
HKD 5,586 —
* Covered subsequently
Rs. Mio.

50 Annual Report 2008-2009
Foreign Currency
2007-08
Receivable Payable
Foreign Currency Amount
Rs in Mio Foreign Currency Amount
Rs in Mio
EURO 366,189 22.8 148,122 9.4
USD 133,248 5.3
GBP 231 —
JPY 950,000 0.4
MYR 888 —
SGD 83,650 2.4
HKD 6,498 —
AUD 690 —
24. The Previous Year’s figures have been regrouped and rearranged wherever necessary.
Signatures to Schedules 1 to 19
Prasad Chandran K. R. CoorlawalaChairman & Managing Director R. R. Nair
R. Y. VaidyaM. R. Iyer S. RamnathCompany Secretary R. A. Shah
Pradip P. ShahDeepak ThuseDirectors
Mumbai, 16th April, 2009
Mr. Prasad Chandran and Mr. Martin Widmann, Group Vice President, Pharma Ingredients & Services inaugurate the Pharma Application Laboratory, at Navi Mumbai factory, a world-class laboratory, which facilitates enhanced customer support.

BASF India Limited 51
Balance Sheet Abstract and General Business ProfileI. Registration Details :
Registration No. : 3972 State Code : 11Balance Sheet Date : 31.03.2009
II. Capital Raised during the Period :(Amount in Rs. million)Public Issue : Nil Rights Issue : Capital raised : NilBonus Issue : Nil Private Placement : Nil
III. Position of Mobilisation and Deployment of Funds :(Amount in Rs. million)Total Liabilities : 3,852.3 Total Assets : 3,852.3Sources of Funds :Paid Up Capital : 281.9 Reserves & Surplus : 3,570.4Secured Loans : — Unsecured Loans : —Application of Funds :Net Fixed Assets : 1,470.9 Investments : 90.0Net Current Assets : 2,288.9 Deferred Tax Assets – Net 2.5 Accumulated Losses: Nil
IV. Performance of Company :(Amount in Rs. million)Turnover (including Other Income) : 11,241.5 Total Expenditure 10,161.4Profit Before Tax : 1,080.1 Profit After Tax 686.4Earning Per Share in Rs. : 24.35 Dividend Rate % 70
V. Generic Names of Principal Products of the Company :(As per monetary terms)Item Code No. Product Description(ITC Code)32021000 Synthetic Organic Tanning Substances39031100 Expansible Polystyrene38089390 Others
Statement pursuant to Section 212 of the Companies Act, 1956Name of the Subsidiary Company
Financial Year ending of the Subsidiary
Number of equity shares held
Extent of holding
For the Financial Year of the Subsidiary For the Previous Financial Years since it became a Subsidiary
Profit/(losses) so far as it concerns the members of the holding Company and not dealt with in the holding Company’s accounts
Profit/(losses) so far as it concerns the members of the holding Company and dealt with in the holding Company’s accounts
Profit/(losses) so far as it concerns the members of the holding Company and not dealt with in the holding Company’s accounts
Profit/(losses) so far as it concerns the members of the holding Company and dealt with in the holding Company’s accounts
(Rs. in million) (Rs. in million) (Rs. in million) (Rs. in million)
BASF Polyurethanes India Limited
31.03.2009 9,000,000 shares of Rs. 10 each
100% (200.5) — (18.5) —
Prasad Chandran K. R. Coorlawala R. A. ShahChairman & Managing Director R. R. Nair Pradip P. Shah
R. Y. Vaidya Deepak ThuseM.R. Iyer S. RamnathCompany Secretary Directors
Mumbai, 16th April, 2009
Prasad Chandran K. R. Coorlawala R. A. ShahChairman & Managing Director R. R. Nair Pradip P. Shah
R. Y. Vaidya Deepak ThuseM.R. Iyer S. RamnathCompany Secretary Directors
Mumbai, 16th April, 2009

52 Annual Report 2008-2009
Directors’ Report
BASF Polyurethanes India Limited
Your Directors have pleasure in presenting their Report for the financial year ended 31st March 2009.
Activities
Your Company recorded increase in sales at Rs.2185.4 million during the year ended 31st March, 2009 registering significant increase, both in volume and value terms, over the previous year. However, your Company incurred an operating loss of Rs. 200.5 million for the year under report which was mainly on account of high fluctuations in raw material prices.
Your Company maintained its market share in the Appliances and Footwear segments. However, due to slowdown in global economy and overall reduction in demand, margins of Appliances and Footwear segments were under pressure. The Appliances, Automotive and Footwear segments in India are on the path of recovery.
During the year, your Company participated in the first underground crude pipeline project in India by supplying insulation materials.
The Company has initiated measures to optimize inventory costs and receivables to overcome the difficult economic environment.
A footwear technical laboratory was made operational during the year.
Your Company has become ISO 140001 certified during the year under report.
Dividend
In view of the loss incurred for the year under report, your Directors do not recommend any dividend on the equity shares for the financial year ended 31st March, 2009.
Capital Expenditure
Capital Expenditure incurred during the year aggregated to Rs.19.1 million.
Directors
Mr. Prasad Chandran was appointed as the Managing Director of your Company for a period of 3 years with effect from 23rd January, 2009. No remuneration is payable to him.
Dr. Tilman Krauch and Dr. Rainer Diercks retire by rotation at the ensuing Annual General Meeting and being eligible, offer themselves for re-appointment.
Audit Committee
In terms of the provisions of Section 292A of the Companies Act, 1956, the Board of Directors of the Company constituted an Audit Committee on 11th July, 2006 comprising of four Directors including three independent non-executive Directors viz. Mr. R.R. Nair as Chairman, Mr. R.A. Shah, Mr. K.R. Coorlawala and Mr. S. Ramnath as Members and Mr. Pradeep Chandan as Secretary of the Committee. Mr. M.R. Iyer was nominated as a Permanent Invitee. The functions of the Audit Committee inter-alia include:
To discuss with the Auditors periodically about internal control systems, the scope of the Audit including observations of the Auditors and review of half yearly and annual financial statements before submission to the Board.
To ensure compliance of internal control systems of the Company.
To investigate into any matter referred to it by Board and for this purpose, to have full access to information contained in the records of the Company and external professional advice, if necessary.
To recommend to the Board any matter relating to financial management including audit report.
Conservation of Energy, Technology Absorption and Foreign Exchange Earnings and Outgo
Information pursuant to Section 217(1)(e) of the Companies Act, 1956, read with the Companies (Disclosure of Particulars in the Report of Board of Directors) Rules, 1988, is given in the annexure to this Report.

BASF Polyurethanes India Limited 53
Directors’ Responsibility Statement
Your Directors confirm:
(i) that in the preparation of the annual accounts, the applicable accounting standards have been followed;
(ii) that the Directors have selected such accounting policies and applied them consistently and made judgements and estimates that are reasonable and prudent so as to give a true and fair view of the state of affairs of your Company at the end of the financial year ended 31st March 2009 and of the losses of your Company for that year;
(iii) that the Directors had taken proper and sufficient care for the maintenance of adequate accounting records in accordance with the provisions of the Companies Act, 1956, for safeguarding the assets of your Company and for preventing and detecting fraud and other irregularities;
(iv) that the Directors have prepared the annual accounts on a going concern basis.
Auditors
M/s. B S R & Co., Chartered Accountants, Mumbai retire at the forthcoming Annual General Meeting and are eligible for re-appointment.
Particulars of Employees
The particulars of employees required to be furnished under Section 217(2A) of the Companies Act, 1956, read with the Companies (Particulars of Employees) Rules, 1975, forms part of this Report.
Personnel and Welfare
Industrial relations in the Navi Mumbai factory remained cordial.
Your Directors express their sincere appreciation for the dedicated efforts put in by all the employees and for their continued contribution for ensuring higher performance of the Company during the year.
On behalf of the Board of Directors
PRASAD CHANDRANChairman & Managing Director
MumbaiDated: 16th April, 2009
Mr. Jacques Delmoitiez, Global President Polyurethanes and Mr. Chandran with the Polyurethanes team in India.

54 Annual Report 2008-2009
Annexure to the Directors’ ReportStatement containing particulars pursuant to the Companies (Disclosure of Particulars in the Report of Board of Directors) Rules, 1988 and forming part of the Directors’ Report.
A. Conservation of Energy
The Company continued its policy of giving priority to energy conservation measures including regular review of energy generation, distribution and consumption and control on utilization of energy, in its facility at Navi Mumbai.
During the year under report, various energy saving measures were implemented in the Company’s factory at Navi Mumbai, which include:
Reduction in energy consumption by adopting the following measures viz.,
• Insulationofhotwaterlinesandstoragetanks. • Installationofblenderstoreduceproductiontimeandincreaseplantcapacity. • Reducingrunhoursofequipment. • Rationaliseprocessparameterstobringdownthebatchcycletime. • Maintainingoptimumbatchsize. • Increasingsettemperatureofair-conditioners. • Installationofswitchingfacilitiestoreducepowerconsumption
The above measures not only resulted in significant savings in the total energy consumed but also had a positive impact on improvement in the environment.
In addition, the Company plans to implement the following energy conservation measures:
• Tocarryoutfeasibilitystudiesfor: — Installation of auto switching system in a plant — Installation of energy efficient gear boxes in reactors.
Requisite data in respect of Energy Consumption are given below:
Current Year 1.4.2008 to
31.3.2009
Previous Year 1.4.2007 to
31.3.2008
(a) Power & Fuel Consumption 1. Electricity (a) Purchased Units (in '000 kwh) 550 556 Total amount (Rs. in million) 2.94 2.57 Rate per unit (Rs.) 5.34 4.62 (b) Own generation N.A. N.A. • Throughdieselgenerator Units (in '000 kwh) Units per litre of oil Cost per unit (Rs.) • ThroughSteamTurbine/Generatorunits Units per litre of fuel Oil/gas Cost per unit 2. Coal (specify quality and where used) N.A. N.A Qty. (tonnes) Total cost Average rate 3. Furnace oil/fuels Qty. (k.litres) 133 117 Total Amount (Rs. in million) 3.55 1.99 Average rate (Rs./litre) 26.72 16.99 4. Others/Internal Generation (Qty.) N.A. N.A. Total cost rate/unit(b) Consumption per unit of production Polyurethane’s System Products Unit M.T.

BASF Polyurethanes India Limited 55
Current Year 1.4.2008 to
31.3.2009
Previous Year 1.4.2007 to
31.3.2008
Electricity (kwh) 58 84 Furnace oil/fuels (litres) 14 18 Coal (specify quality) N.A. N.A. Others (specify) N.A. N.A.
B. Technology Absorption
RESEARCh & DEvElOPmENT (R&D):
1. Specific Areas in which R&D was carried out by the Company.The R&D Centre of the Company is engaged in supporting businesses through innovations and undertook multifold research activities including:
• Developmentoftailoredmadeproducts/formulations.
• Developing cost effective processes and streamlining existing processes in the area of polyurethanesystem.
2. Benefits derived as a result of the above R&D : NIL
3. Future Plan of Action:
Future plan of action of the R&D Centre include:
• Installationofblenderstoincreaseproductioncapacity.
• Installationofpre-polymerreactor.
• Installationofadipicacidsqueezerstopreventdusting.
4. Expenditure on R&D : NIL
TEChNOlOGY ABSORPTION, ADAPTATION AND INNOvATION:
1. Efforts in brief, towards technology absorption, adaptation and innovation : Under Process 2. Benefits derived and the results of the above efforts : In process 3. Imported Technology:
The Company has entered into agreements with BASF Polyurethane Licensing GmbH, Germany for sourcing the following technical know-how:
• In2006and2007formanufactureofPolyesters&additivesetc.
• In2008formanufactureofPolyesterols.
C. Foreign Exchange Earnings and Outgo
The particulars with regard to foreign exchange earnings and outgo appear on page 75 of the Annual Report and Accounts.
On behalf of the Board of Directors
PRASAD CHANDRANChairman & Managing Director
Mumbai Dated : 16th April, 2009.

56 Annual Report 2008-2009
Annexure to the Directors’ ReportInformation as per Section 217(2A) of the Companies Act, 1956 read with the Companies (Particulars of Employees) Rules, 1975 and forming part of the Directors’ Report for the financial year ended 31st March, 2009
Name of employee Designation and Nature of Duties
Gross Remuneration
Rupees
Qualification Date of Commencement of employment
Age/ Experience Years
Particulars of last employment, last employer, Post last held, No. of years
(a) Employed throughout the Financial Year under review and were in receipt of remuneration for the Financial Year in the aggregate of not less than Rs. 24,00,000/-.
Mr Mandar Joshi General Manager – Polyurethanes
2,419,540.00 B.Tech., MMM 01-08-1996 34/13 BASF India Limited, Manager – Process Development (5)
(b) Employed for part of the Financial Year under review and were in receipt of remuneration for any part of the year, at a rate of not less than Rs. 2,00,000/- per month.
Mr. Gian Luca Celli Manager Technical Services, Footwear
1,912,860 Engineer – Chemistry
01.05.2006 41/16 Elastogran Italia spa-techician R&D footwear department (8)
Mr. Udo Schilling General Manager 11,513,590 Engineer – Chemistry
01.06.2005 54/32 BASF Elastogran GmbH, Lemforde (2), Manager – Technical Service Marine Applications (1)
(i) All appointments are/were contractual and terminable by notice on either side.
(ii) The employments are subject to the rules and regulations of the Company in force from time to time.
(iii) Gross remuneration includes Salary, allowances, leave encashment on retirement, the Company’s contribution to provident and Superannuation Funds, monetary value of perquisite calculated in accordance with the Income Tax Act/Rules but excludes Medical Expenses and Group Insurance Premium.
(iv) None of the employees is related to any Director of the Company. None of the employees hold more than 2% of the paid-up equity capital of the Company.
On behalf of the Board of Directors
PRASAD CHANDRANChairman & Managing Director
MumbaiDated: 16th April, 2009

BASF Polyurethanes India Limited 57
Auditors’ Report to the Members of BASF Polyurethanes India LimitedWe have audited the attached Balance Sheet of BASF Polyurethanes India Limited (‘the Company’) as at 31 March 2009 and the related Profit and Loss Account and Cash Flow Statement for the year ended on that date, annexed thereto. These financial statements are the responsibility of the Company’s management. Our responsibility is to express an opinion on these financial statements based on our audit.
We conducted our audit in accordance with auditing standards generally accepted in India. Those Standards require that we plan and perform the audit to obtain reasonable assurance about whether the financial statements are free of material misstatement. An audit includes examining, on a test basis, evidence supporting the amounts and disclosures in the financial statements. An audit also includes assessing the accounting principles used and significant estimates made by management, as well as evaluating the overall financial statement presentation. We believe that our audit provides a reasonable basis for our opinion.
1. As required by the Companies (Auditor’s Report) Order, 2003 (‘the Order’) issued by the Central Government of India in terms of sub-section (4A) of Section 227 of the Companies Act, 1956, (‘the Act’), we enclose in the Annexure a statement on the matters specified in paragraphs 4 and 5 of the said Order.
2. Further to our comments in the Annexure referred to above, we report that:
(a) we have obtained all the information and explanations which to the best of our knowledge and belief were necessary for the purposes of our audit;
(b) in our opinion, proper books of account as required by law have been kept by the Company so far as appears from our examination of those books;
(c) the Balance Sheet, Profit and Loss Account and Cash Flow Statement dealt with by this report are in agreement with the books of account;
(d) in our opinion, the Balance Sheet, Profit and Loss Account and Cash Flow Statement dealt with by this report comply with the Accounting Standards referred to in sub-section (3C) of Section 211 of the Act;
(e) on the basis of written representations received from the directors as at 31 March 2009 and taken on record by the Board of Directors, we report that none of the directors is disqualified as on 31 March 2009 from being appointed as a director in terms of clause (g) of sub-section (1) of Section 274 of the Act; and
(f) in our opinion and to the best of our information and according to the explanations given to us, the said accounts give the information required by the Act, in the manner so required, and give a true and fair view in conformity with the accounting principles generally accepted in India:
(i) in the case of the Balance Sheet, of the state of affairs of the Company as at 31 March 2009;
(ii) in the case of the Profit and Loss Account, of the loss for the year ended on that date; and
(iii) in the case of the Cash Flow Statement, of the cash flows for the year ended on that date.
For B S R & Co. Chartered Accountants
Akeel Master Mumbai PartnerDate: 16 April 2009 Membership No. 046768

58 Annual Report 2008-2009
Annexure to the Auditors’ Report – March 31 2009With reference to the annexure referred to in the report of even date, we report that:
(i) (a) The Company has maintained proper records showing full particulars, including quantitative details and situation of fixed assets.
(b) The Company has a regular programme of physical verification of its fixed assets by which all fixed assets are verified in a phased manner over a period of two years. In our opinion, this periodicity of physical verification is reasonable having regard to the size of the Company and the nature of its assets. No material discrepancies were noticed on such verification.
(c) Fixed assets disposed off during the year were not substantial, and therefore, do not affect the going concern assumption.
(ii) (a) The inventory, except goods-in-transit and stocks lying with third parties, has been physically verified by the management during the year. In our opinion, the frequency of such verification is reasonable. For stocks lying with third parties at the year-end, written confirmations have been obtained.
(b) The procedures for the physical verification of inventories followed by the management are reasonable and adequate in relation to the size of the Company and the nature of its business.
(c) The Company is maintaining proper records of inventory. The discrepancies noticed on verification between the physical stocks and the book records were not material.
(iii) According to the information and explanations given to us, we are of the opinion that there are no companies, firms or other parties covered in the register required under Section 301 of the Act. Accordingly, paragraph 4 (iii) of the order is not applicable.
(iv) In our opinion and according to the information and explanations given to us, there is an adequate internal control system commensurate with the size of the Company and the nature of its business with regard to purchase of inventories and fixed assets and with regard to the sale of goods and services. We have not observed any major weakness in the internal control system during the course of the audit.
(v) In our opinion, and according to the information and explanations given to us, there are no contracts and arrangements, the particulars of which need to be entered into the register maintained under Section 301 of the Act.
(vi) The Company has not accepted any deposits from the public.
(vii) In our opinion, the Company has an internal audit system commensurate with the size and the nature of its business.
(viii) The Central Government has not prescribed the maintenance of cost records under Section 209(1)(d) of the Act for any of the products manufactured/services rendered by the Company.
(ix) (a) According to the information and explanations given to us and on the basis of our examination of the records of the Company, amounts deducted/accrued in the books of account in respect of undisputed statutory dues including Provident Fund, Employees’ State Insurance, Income-tax, Sales-tax, Service tax, Customs duty, Excise duty and other material statutory dues have been generally regularly deposited during the year by the Company with the appropriate authorities. As explained to us, the Company did not have any dues on account of Investor Education and Protection Fund and Wealth tax.
According to the information and explanations given to us there were no dues on account of Cess under Section 441A of the Act since the date from which the aforesaid section comes into force has not been notified by the Central Government.
According to the information and explanations given to us no undisputed amounts payable in respect of Provident Fund, Employees’ State Insurance, Income-tax, Sales-tax, Service tax, Customs duty, Excise duty and other material statutory dues were in arrears as at 31 March 2009 for a period of more than six months from the date they became payable.
(b) According to the information and explanations given to us, there are no dues of Income-tax, Sales-tax, Service tax, Customs duty and Excise duty which have not been deposited with the appropriate authorities on account of any dispute.
(x) The Company was incorporated on 6 April 2005 and has not completed five years since registration. Consequently, paragraph 4(x) of the Order relating to accumulated losses is not applicable to the Company.
(xi) In our opinion and according to the information and explanations given to us, the Company has not defaulted in repayment of dues to its bankers. The Company did not have any outstanding debentures or dues to financial institutions during the year.
(xii) The Company has not granted any loans and advances on the basis of security by way of pledge of shares, debentures and other securities.
(xiii) In our opinion and according to the information and explanations given to us, the Company is not a chit fund or a nidhi/ mutual benefit fund/ society.

BASF Polyurethanes India Limited 59
(xiv) The Company is not dealing or trading in shares, securities, debentures and other investments.
(xv) According to the information and explanations given to us, the Company has not given any guarantee for loans taken by others from banks or financial institutions.
(xvi) In our opinion and according to the information and explanations given to us, the term loans taken by the Company have been applied for the purpose for which they were raised.
(xvii) According to the information and explanations given to us and on an overall examination of the Balance Sheet of the Company, we are of the opinion that the funds raised on short-term basis have not been used for long-term investment.
(xviii) As stated in paragraph (v) above, there are no companies/firms/parties covered in the register required to be maintained under Section 301 of the Act.
(xix) The Company did not have any outstanding debentures during the year.
(xx) The Company has not raised any money by public issues during the year.
(xxi) According to the information and explanations given to us, no fraud on or by the Company has been noticed or reported during the course of our audit
For B S R & Co. Chartered Accountants
Akeel Master Mumbai PartnerDate: 16 April 2009 Membership No. 046768

60 Annual Report 2008-2009
Balance Sheet as at march 31, 2009Rs. in million
For Accounting Policies and Notes to Accounts – Refer Schedule 19
The Schedules referred to above form integral part of the Balance Sheet.
As per our report of even dated attached Prasad Chandran K. R. Coorlawala
For B S R & Co. Chairman & Managing Director R. R. NairChartered Accountants R. Y. Vaidya
S. RamnathAkeel Master R. A. ShahPartner Pradeep Chandan Deepak ThuseMembership No.: 046768 Company Secretary Directors
Mumbai, 16th April 2009 16th April 2009
Schedule march 31, 2009 March 31, 2008
SOURCES OF FUNDS
Shareholders’ Funds:Share Capital 1 90.0 90.0 Reserves and Surplus 2 — —
90.0 90.0
loan Funds:Unsecured Loans 3 824.4 511.7
824.4 511.7
Total 914.4 601.7
APPlICATION OF FUNDS
Fixed Assets: 4
Gross Block 153.7 136.5 Less: Depreciation 33.1 20.1 Net Block 120.6 116.4 Capital Work-in-Progress 1.1 0.7
121.7 117.1
Deferred Tax Assets (net) 5 — — Current Assets, loans and Advances:Inventories 6 215.4 264.8 Sundry Debtors 7 426.8 346.9 Cash and Bank Balances 8 25.7 24.5 Loans and Advances 9 165.1 92.9
833.0 729.1
Less:Current liabilities and Provisions:Current Liabilities 10 254.2 258.5 Provisions 11 5.1 4.5
259.3 263.0
Net Current Assets 573.7 466.1
Profit & loss Account 219.0 18.5
Total 914.4 601.7

BASF Polyurethanes India Limited 61
Profit and loss Account for the year ended march 31, 2009Rs. in million
Schedule march 31, 2009 March 31, 2008
Income:
Sales and Services 12 2,185.4 1,567.7
Less: Excise Duty 133.4 103.3
2,052.0 1,464.4
Other Income 13 0.5 0.9
2,052.5 1,465.3
Expenditure:
Materials Consumed 14 1,012.3 667.5
Purchase of Finished Goods 808.7 604.3
Other Expenses 15 284.2 206.6
Depreciation 4 14.0 11.6
Interest 16 69.2 38.7
2,188.4 1,528.7
Increase / (Decrease) in Stocks 17 (64.1) 46.1
loss Before Tax (200.0) (17.3)
Tax 18 0.5 2.1
loss After Tax (200.5) (19.4)
(Deficit)/Surplus Brought Forward (18.5) 0.9
Balance Carried Forward (219.0) (18.5)
Weighted average number of equity shares outstanding during the year 9,000,000 9,000,000
Basic and diluted earnings per share (in Rs.) (22.28) (2.16)
Face value per share (in Rs.) 10.00 10.00
For Accounting Policies and Notes to Accounts – Refer Schedule 19
The Schedules referred to above form integral part of the Profit and Loss Account.
As per our report of even date attached Prasad Chandran K. R. Coorlawala
For B S R & Co. Chairman & Managing Director R. R. NairChartered Accountants R. Y. Vaidya
S. RamnathAkeel Master R. A. ShahPartner Pradeep Chandan Deepak ThuseMembership No.: 046768 Company Secretary Directors
Mumbai, 16th April 2009 16th April 2009

62 Annual Report 2008-2009
Cash Flow Statement for the year ended march 31, 2009
Rs. in million
As per our report of even date attached Prasad Chandran K. R. Coorlawala
For B S R & Co. Chairman & Managing Director R. R. NairChartered Accountants R. Y. Vaidya
S. RamnathAkeel Master R. A. ShahPartner Pradeep Chandan Deepak ThuseMembership No.: 046768 Company Secretary Directors
Mumbai, 16th April 2009 16th April 2009
march 31, 2009 March 31, 2008
A. Cash flow from operating activities
Net Loss Before Tax (200.0) (17.3)
Adjustments for:
Depreciation 14.0 11.6
Interest expense 69.2 38.7
Loss on sale of fixed assets (net) 0.4 0.1
Unrealised (Gain) / Loss on foreign exchange (net) 3.0 1.0
Provision for Doubtful Debts written back 6.6 93.2 (0.4) 51.0
Operating profit before working capital changes (106.8) 33.7
(Increase) / Decrease in:
Trade and Other Receivables (151.0) (95.7)
Inventories 49.4 (39.1)
Trade and Other Liabilities 7.1 (108.7) (96.3) (38.5)
Cash used in operations (215.5) (4.8)
Direct taxes paid (net) (1.5) (1.2)
Net cash used in operating activities (217.0) (6.0)
B. Cash flow from investing activities:
Acquisition of fixed assets (19.0) (20.7)
Realisation on sale of fixed assets 0.1 —
Net cash used in investing activities (18.9) (20.7)
C. Cash flow from financing activities
Proceeds from loan funds (net) 307.8 41.6
Interest paid (70.7) (39.1)
Net cash generated from financing activities 237.1 2.5
Net (decrease)/increase in cash and cash equivalents 1.2 (24.2)
Cash and cash equivalents (opening balance) 24.5 48.7
Cash and cash equivalents (closing balance) 25.7 24.5

BASF Polyurethanes India Limited 63
Schedules to Balance Sheet as at march 31, 2009
1. Share Capital Rs. in million
2. Reserves and Surplus
Balance as on April 1,
Additions/(Deduction) during the year
Balance as onmarch 31,
2008 2007 2008-09 2007-08 2009 2008
Surplus as per Profit & Loss Account — 0.9 — (0.9) – —
— 0.9 — (0.9) – —
3. Unsecured loans
march 31, 2009 March 31, 2008
Term loan:
Loan from BASF SE
Repayable within one year Rs. Nil (Previous Year Rs. 32 million)Maximum amount outstanding at any time during the year Rs. 32 million(Previous Year Rs. 34.8 million)
— 32.0
Other loan:
Bank FacilitiesRepayable within one year Rs. 219.4 million (Previous Year Rs. 240.7 million)
219.4 240.7
ICD from BASF India Ltd. 605.0 239.0
Repayable within one year Rs. 605 million (Previous Year Rs. 239.0 million)Maximum amount outstanding at any time during the year Rs. 605 million(Previous Year Rs. 450.0 million)
824.4 511.7
march 31, 2009 March 31, 2008
Authorised:
15,000,000 (Previous Year – 15,000,000) Equity Shares of Rs. 10/- each 150.0 150.0
Issued:
9,000,000 (Previous Year – 9,000,000) Equity Shares of Rs. 10/- each 90.0 90.0
Subscribed and Paid-up:
9,000,000 (Previous Year – 9,000,000) Equity Shares of Rs. 10/- each fully paid
– All the above Equity shares are held by BASF India Limited, the holding Company and its nominees.
BASF SE is the ultimate holding company of BASF Polyurethanes India Limited
90.0 90.0
90.0 90.0

64 Annual Report 2008-2009
Schedules to Balance Sheet as at march 31, 20094. Fixed Assets Rs. in million
Buildings* Plant & machinery
andComputers
Furniture, Fixtures
and Equipment
Total Previous Year
Gross Block:
As at April 1, 2008 21.5 113.8 1.2 136.5 116.0
Additions — 18.6 0.1 18.7 20.6
Deductions — 1.5 — 1.5 0.1
As at March 31, 2009 21.5 130.9 1.3 153.7 136.5
Depreciation:
As at April 1, 2008 1.4 18.5 0.2 20.1 8.5
Depreciation for the year 0.7 13.1 0.2 14.0 11.6
Deductions: — 1.0 — 1.0 —
As at March 31, 2009 2.1 30.6 0.4 33.1 20.1
Net Block:
As at March 31, 2009 19.4 100.3 0.9 120.6 116.4
As at March 31, 2008 20.1 95.3 1.0 116.4 107.5
Capital Work-in-Progress**
As at March 31, 2009 — 1.1 — 1.1 0.7
As at March 31, 2008 — 0.7 — 0.7 0.4
* Factory building is constructed on the land taken on sub-licensing from BASF India Limited.
** Capital Work-in-Progress includes capital advances Rs. 1.1 million (Previous Year Rs. 0.7 million) – considered good.
5. Deferred tax Assets (net) Rs. in million
march 31, 2009 March 31, 2008
(Refer Note 5)
Deferred tax assets 11.0 10.1
Deferred tax liabilities (11.0) (10.1)
— —
6. Inventories
march 31, 2009 March 31, 2008
Raw Materials 109.5 95.3 Finished Goods 101.3 154.4 Stock-in-Process 3.3 14.3 Packing Materials 0.9 0.4 Fuel Oil 0.4 0.4
215.4 264.8

BASF Polyurethanes India Limited 65
Schedules to Balance Sheet as at march 31, 20097. Sundry Debtors Rs. in million
march 31, 2009 March 31, 2008
Debts outstanding for a period exceeding six monthsConsidered good:Unsecured 6.3 1.7
6.3 1.7Considered doubtful 12.2 9.6Other debtsConsidered good :Unsecured 420.5 345.2
420.5 345.2Considered doubtful 4.0 —
443.0 356.5Less : Provision for doubtful debts 16.2 9.6
426.8 346.9
(Ref. Note 7 – Dues from companies under the same management)
8. Cash and Bank Balances
march 31, 2009 March 31, 2008
Balances with Scheduled Banks:– In Current Accounts 25.7 24.5
25.7 24.5
9. loans and Advances (Unsecured) – Considered Good
march 31, 2009 March 31, 2008
Advances recoverable in cash or in kind or for value to be received 153.9 79.7 Duty Drawback receivable 6.6 9.6 Balances with Excise authorities 0.2 0.2 Balances with Income Tax authorities (Net of Provisions) 4.4 3.4
165.1 92.9
10. Current liabilities
march 31, 2009 March 31, 2008
Sundry Creditors – Micro & Small Enterprises (Ref. Note 6) — —– Others 247.0 250.8 Deposits — 0.3 Interest accrued but not due 0.3 1.8 Other Liabilities 6.9 5.6
254.2 258.5
11. Provisions
march 31, 2009 March 31, 2008
Provision for Long Service Award 0.7 0.6 Provision for Leave Encashment 2.6 2.5 Provision for Gratuity 1.8 1.4
5.1 4.5

66 Annual Report 2008-2009
march 31, 2009 March 31, 2008
Sale of Goods 2,084.0 1,481.8
Indent Commission 101.4 85.9
2,185.4 1,567.7
13. Other Income
march 31, 2009 March 31, 2008
Interest (Gross)
— Others 0.1 —
Tax deducted at source Rs. Nil (Previous Year Rs. Nil)
Sale of Scrap 0.3 0.1
Sundries 0.1 0.8
0.5 0.9
14. materials consumed
march 31, 2009 March 31, 2008
Raw Materials :
Stock at Commencement 95.3 101.9
Purchases 998.9 641.0
Stock at Close (109.5) (95.3)
984.7 647.6
Packing Materials consumed 27.6 19.9
1,012.3 667.5
Schedules to Profit & loss account for the year ended march 31, 2009
12. Sales and Services Rs. in million
BASF Pharma team at Exact Academy II, a platform to help our customers to be more successful in their business ventures.

BASF Polyurethanes India Limited 67
Schedules to Profit & loss account for the year ended march 31, 2009
15. Other Expenses Rs. in million
march 31, 2009 March 31, 2008
Salaries, Wages, Bonus and Commission (Ref. Note 8) 36.9 38.1 Workmen and Staff Welfare (Ref. Note 8) 7.9 7.5 Contribution to Provident and Other Funds (Ref. Note 8) 2.8 3.3
Directors’ Sitting Fees 0.1 0.1 Consumption of Stores and Spare Parts 3.0 1.3 Power and Fuel 6.0 3.7 Rent [Ref. Note 4(b)] 13.7 10.2 Rates and Taxes – Excise Duty (4.0) 1.5 Repairs – Machinery 2.5 2.2 – Buildings 1.0 1.6 – Others 1.5 0.2 Insurance 2.8 2.5 Provision for Doubtful Debts 6.6 (0.4)Loss on sale of Fixed Assets (Net) 0.4 0.1 Service Fees 22.3 16.9 Travelling 12.1 11.7 Freight and Handling Charges 70.6 42.9 Professional Charges 51.9 37.6 Communication/System Expenses 4.5 4.9 Royalty 14.4 8.5 Sundry Expenses 27.2 12.2
284.2 206.6
16. Interest
march 31, 2009 March 31, 2008
On Term Loans 1.0 2.1 On Others 68.2 36.6
69.2 38.7
17. Increase/(Decrease) in Stocks
march 31, 2009 March 31, 2008
Stock at Close Finished Goods 101.3 154.4 Stock-in-Process 3.3 14.3 Sub-total 104.6 168.7 Stock at commencement Finished Goods (154.4) (119.5) Stock-in-Process (14.3) (3.1) Sub-total (168.7) (122.6)
Net Increase/(Decrease) in stocks (64.1) 46.1
18. Tax
march 31, 2009 March 31, 2008
Deferred Tax Charge — 1.2 Fringe Benefit Tax 0.5 0.9
0.5 2.1

68 Annual Report 2008-2009
19. Accounting Policies and Notes to Accounts (Amounts are shown in Millions of Rupees, abbreviated as Rs. Mio.)
1. Accounting Policies:
(a) Basis of Accounting
The financial statements are prepared under the historical cost convention, on accrual basis, in accordance with provisions of Companies Act, 1956 and the accounting principles generally accepted in India and comply with the Accounting Standards prescribed in the Companies (Accounting Standards) Rules, 2006 issued by the Central Government, in consultation with the National Advisory Committee on Accounting Standards, to the extent applicable. The financial statements are presented in Millions of Indian Rupees.
(b) Use of estimates
The presentation of financial statements in conformity with the generally accepted accounting principles requires estimates and assumptions to be made that affect the reported amount of assets and liabilities and disclosure of contingent liabilities as on the date of the financial statements and the reported amount of revenues and expenses during the reporting period. Difference between the actual result and estimates are recognised in the period in which the results are known/materialise.
(c) Going Concern
During the year the Company has incurred a loss higher than its net worth. However, the financial statements have been prepared on a going-concern basis based on the financial support received from the holding company (in its capacity as principal shareholder). In addition, there is guarantee issued to bank by BASF SE (in its capacity as the ultimate holding company). This will enable the Company to meet all its liabilities, both present as well as future, as and when they fall due for payment in the normal course of business. Accordingly, these financial statements do not include any adjustments relating to the recoverability and classification of recorded assets or to amounts and classification of liabilities as the entity continues to operate on a going concern basis.
(d) Revenue Recognition
Sales of products and Indent commission are recognised when risk and rewards of ownership of the products are passed on to the customers, which is generally on despatch of goods. Sales include excise duty but exclude trade discounts, rebates and sales tax. Interest on investments is booked on a time proportion basis taking into account the amounts invested and the rate of interest.
(e) Fixed Assets
Fixed Assets are recorded at cost net of Cenvat credit wherever eligible. Cost includes all expenses and interest attributable to the project till the date it is ready to use. The carrying amounts of assets are reviewed at each Balance Sheet date if there is any indication of impairment based on internal/external factors. Impairment is recognised when the carrying amount of the asset exceeds its recoverable amount. Impairment loss is charged to the Profit and Loss Account in the year in which an asset is identified as impaired. An impairment loss recognised in prior accounting periods is reversed if there has been a change in the estimate of the recoverable amount.
(f) Depreciation
Depreciation is charged on straight-line basis at the following rates:
Buildings — 3.34%
Plant & Machinery — 10.34%
Computers — 25.00%
Furniture, Fixtures & Equipment — 12.50%
Assets individually costing Rs. 5,000 or below — 100.00%
Depreciation on additions/deletions is calculated on a monthly pro-rata basis. Accelerated depreciation is charged on certain assets based on periodic review of estimated useful life.
(g) Borrowing costs
Borrowing costs that are attributable to the acquisition or construction of qualifying assets are capitalised. Other borrowing costs are recognised as an expense in the period in which they are incurred.
(h) Inventories
Inventories are valued at cost or net realisable value, whichever is lower. The costs are worked out on weighted average basis. Fixed production overheads are allocated on the basis of normal capacity of production facilities. Excise duty on goods manufactured by the Company and remaining in inventory is included as a part of valuation of finished goods.

BASF Polyurethanes India Limited 69
(i) Foreign Currency
Transactions in foreign currencies are recorded at the exchange rates prevailing on the date of transaction. Monetary items in foreign currencies are stated at the closing exchange rate. The forward exchange contracts are backed by underlying transactions, the premium or discount arising at the inception of such a forward exchange contract is amortised as expense or income over the life of the contract and the difference between the year end rate and rate on the date of the contract is recognised as exchange difference in the Profit and Loss Account. Gains/losses on conversion/translation have been recognised in the Profit and Loss Account.
(j) Employee Benefits
(A) Short Term Employee Benefits
All employee benefits payable wholly within twelve months of rendering the service are classified as short term employee benefits and are recognized in the Profit and Loss Account as an expense at the undiscounted amount on an accrual basis.
(B) Post Employment Employee Benefits
Company’s contributions to defined contribution plans such as Superannuation Fund, Family Pension Fund, Group Mediclaim Insurance Policy, Employee State Insurance and Labour Welfare Fund are recognized in the Profit and Loss Account on an accrual basis.
Company’s liability towards Gratuity, which is a defined benefit plan, is determined on the basis of valuations, as at balance sheet date, carried out by an independent actuary using Projected Unit Credit Method. Actuarial gains and losses comprise experience adjustments and the effects of changes in actuarial assumptions and are recognised immediately in the Profit and Loss Account.
Company’s contribution to Provident Fund is recognised in the Profit and Loss Account on accrual basis.
(C) Other Long Term Employee Benefits
Company’s liabilities towards Compensated Absences & Long Service Awards to employees are determined on the basis of valuations, as at balance sheet date, carried out by an independent actuary using Projected Unit Credit Method. Actuarial gains and losses comprise experience adjustments and the effects of changes in actuarial assumptions and are recognised immediately in the Profit and Loss Account.
(D) Termination Benefits
Compensation paid to employees under Voluntary Retirement Scheme is recognised as an expense when incurred.
(k) Asset taken on lease
Lease rentals payable as per agreements for assets taken on operating lease are charged as expenditure on Straight Line basis over the lease term.
(l) Taxes on Income
Current tax is determined as the amount of tax payable in respect of taxable income for the period computed in accordance with relevant provisions of Income Tax Act, 1961.
Deferred tax charge or credit and correspondingly deferred tax asset or liability is recognised using tax rates that have been enacted or substantively enacted at the Balance Sheet date. Deferred tax is recognised, subject to the consideration of prudence, on timing differences, being the difference between taxable income and accounting income that originate in one period and are capable of reversal in one or more subsequent periods. Deferred tax assets are not recognised on unabsorbed depreciation and carry forward of losses unless there is virtual certainty that sufficient future taxable income will be available against which such deferred tax assets can be realised. Deferred tax assets are reviewed at each Balance Sheet date and written down or written up to reflect the amount i.e. reasonable/virtually certain (as the case may be) to be realised.
(m) Fringe benefit tax
Provision for fringe benefit tax (FBT) has been recognised on the basis of harmonious contextual interpretation of the provisions of Income Tax Act, 1961.
(n) Provisions, Contingent Liabilities and Contingent Assets
Provisions are recognised only when there is a present obligation as a result of past events it is more likely than not that an outflow of resources will be required to settle the obligation and when a reliable estimate of the amount of the obligation can be made.
Contingent Liability is disclosed for (i) Possible obligations which will be confirmed only by future events not wholly within the control of the Company or (ii) Present obligations arising from past events where it is not probable that an outflow of resources will be required to settle the obligation or a reliable estimate of the amount of the obligation cannot be made.
Contingent Assets are not recognised in the financial statements.

70 Annual Report 2008-2009
(o) Earnings per share
The basic and diluted earnings per share is computed by dividing the net profit attributable to equity shareholders for the year, by the weighted average number of equity shares outstanding during the year.
2. Estimated amount of contracts remaining to be executed on capital account and not provided (net of advances) for Rs. 0.6 Mio. (Previous Year Rs. 1.5 Mio.)
3. The exchange loss of Rs. 26.0 Mio. (Previous Year Rs. 3.5 Mio.) has been included in the Profit and Loss Account for the year.
4. The Company has taken certain assets under operating leases.
(a) Total minimum lease payments in this respect are as follows:Rs. Mio.
2008-09 2007-08DueNot later than one year 7.4 —Later than one year but not later than five years 30.1 —Later than five years — —Total 37.5 —
(b) Lease rent of Rs. 3.6 Mio. (Previous Year Rs. NIL) has been included under ‘Rent’ in the Profit and Loss Account
5. Deferred Tax:
The break up of Deferred Tax Assets (Net) as at March 31, 2009 is as under:
Rs. Mio.
2008-09 2007-08
Deferred Tax Assets
Timing differences on account of:
Provision for doubtful debts 5.5 3.3
Preliminary Expenses 0.2 0.2
Unabsorbed Depreciation and Accumulated Losses 4.4 5.6
Others 0.9 1.0
Total Deferred Tax Assets 11.0 10.1
Deferred Tax Liabilities
Timing difference on account of:
Fixed Assets (11.0) (10.1)
Deferred Tax Assets/(Liabilities) – Net — —
The Company has created deferred tax assets in respect of carried forward losses and unabsorbed depreciation to the extent that it has timing differences, the reversals of which will result in sufficient future taxable income.
6. Micro, Small and Medium Enterprises Development Act, 2006 (MSME):
On the basis of the information and records available with the Management, there are no dues to Micro, Small and Medium enterprises, who have registered with the competent authorities.
7. Sundry debtors, unsecured and considered good, include the following amounts due from companies under the same management:
Rs. Mio.
2008-09 2007-08
BASF China Limited 0.9 0.6
BASF Polyurethane Specialties 0.3 —
Shanghai BASF Polyurethane Company 0.2 0.2
Elastogran GmbH — 0.6
BASF Polyurethane (China) Co., Ltd. 7.0 3.8
Total 8.4 5.2

BASF Polyurethanes India Limited 71
8. Employee Defined Benefits: Defined contribution plans Company’s contribution to defined contribution funds amounting to Rs. 2.5 Mio. (Previous Year Rs. 1.9 Mio.) has
been charged to the Profit & Loss Account. Defined benefit plans and other Long term employee benefits Gratuity is payable to all eligible employees of the Company on superannuation, death, permanent disablement and
resignation in terms of provisions of the Payment of Gratuity Act, 1972, or as per the Company’s scheme whichever is more beneficial. The Company irrevocably contributes funds to a separate Gratuity Trust which is recognised by Income tax authorities.
Eligible employees can carry forward and encash leave on superannuation, death, permanent disablement and resignation as per Company’s policy.
Long Service Awards are payable to employees on completion of specified years of service at the rate of 0.5 month to 1.5 months eligible salary.
Rs Mio.
Gratuity (Funded)
2008-09
Gratuity(Funded) 2007-08
A. Expense recognized in the Profit & Loss Account for the year ended 31st March
1. Current Service Cost 0.5 0.5
2. Interest 0.4 0.3
3. Expected Return on Plan Assets (0.3) (0.3)
4. Actuarial (Gain)/Loss (0.2) 0.9
5. Past service cost — —
6. Total Expense 0.4 1.4 B. Net Asset/(Liability) recognized in the Balance Sheet as at 31st
March 1. Present Value of Defined Benefit Obligation as at 31st
March 6.3 5.5
2. Fair Value of Plan assets as at 31st March 4.5 4.1 3. Funded Status [Surplus/(Deficit)] (1.8) (1.4) 4. Net Asset/(Liability) as at 31st March (1.8) (1.4) C. Change in obligation during the year ended 31st March 1. Present value of the defined benefit obligation at the
beginning of the year 5.5 3.8
2. Current Service Cost 0.5 0.5 3. Interest Cost 0.4 0.3 4. Actuarial (Gain)/Loss (0.1) 0.9 5. Benefits Paid — — 6. Present value of the defined benefit obligation at the
end of the year6.3 5.5
D. Change in fair value of assets during the year ended 31st March
1. Fair Value of Plan assets at the beginning of the year 4.1 3.8 2. Expected Return on plan assets 0.3 0.3 3. Contributions by the Employer — — 4. Actual Benefits Paid — — 5. Actuarial Gain/(Loss) on Plan Assets 0.1 — 6. Fair Value of Plan assets at the end of the year 4.5 4.1 Total Actuarial Gain/(Loss) to be recognised 0.1 (0.9) E. Actual Return on Plan Assets
1. Expected Return on plan assets 0.3 0.3 2. Actuarial Gain/(Loss) on Plan Assets — — 3. Actual return on Plan Assets 0.3 0.3 F. Movement in net liability recognised in the Balance Sheet
1. Opening Net Liability/(Asset) 1.4 — 2. Expenses 0.4 1.4 3. Contribution — — Closing Net Liability/(Asset) 1.8 1.4

72 Annual Report 2008-2009
Rs Mio.
Leave (Unfunded)
2008-09
Leave(Unfunded)
2007-08
A. Expense recognized in the Profit & Loss Account for the year ended 31st March
1. Current Service Cost 0.2 0.2 2. Interest 0.2 0.1 3. Expected Return on Plan Assets — — 4. Actuarial (Gain)/Loss (0.1) 0.9 5. Past service cost — — 6. Total Expense 0.3 1.2 B. Net Asset/(Liability) recognized in the Balance Sheet as at 31st
March 1. Present Value of Defined Benefit Obligation as at 31st
March 2.6 2.5
2. Fair Value of Plan assets as at 31st March — — 3. Funded Status [Surplus/(Deficit)] (2.6) (2.5) 4. Net Asset/(Liability) as at 31st March (2.6) (2.5) C. Change in obligation during the year ended 31st March 1. Present value of the defined benefit obligation at the
beginning of the year 2.5 1.3
2. Current Service Cost 0.2 0.2 3. Interest Cost 0.2 0.1 4. Actuarial (Gain)/Loss (0.1) 0.9 5. Benefits Paid (0.2) — 6. Present value of the defined benefit obligation at the
end of the year2.6 2.5
D. Change in fair value of assets during the year ended 31st March 1. Fair Value of Plan assets at the beginning of the year — — 2. Expected Return on plan assets — — 3. Contributions by the Employer 0.2 — 4. Actual Benefits Paid (0.2) — 5. Actuarial Gain/(Loss) on Plan Assets — — 6. Fair Value of Plan assets at the end of the year — — Total Actuarial gain/(loss) to be recognised 0.1 (0.9) E. Actual Return on Plan Assets 1. Expected Return on plan assets — — 2. Actuarial Gain/(Loss) on Plan Assets — — 3. Actual return on Plan Assets — — F. Movement in net liability recognised in the Balance Sheet 1. Opening Net Liability/(Asset) 2.5 1.3 2. Expenses 0.3 1.2 3. Contribution (0.2) — Closing Net Liability/(Asset) 2.6 2.5
Rs. Mio.
Long Service Awards
(Unfunded)2008-09
Long Service Awards
(Unfunded) 2007-08
A. Expense recognized in the Profit & Loss Account for the year ended 31st March
1. Current Service Cost — — 2. Interest 0.1 — 3. Expected Return on Plan Assets — — 4. Actuarial (Gain)/Loss — 0.1 5. Past service cost — 0.5 6. Total Expense 0.1 0.6

BASF Polyurethanes India Limited 73
Long Service Awards
(Unfunded)2008-09
Long Service Awards
(Unfunded) 2007-08
B. Net Asset/(Liability) recognized in the Balance Sheet as at 31st March
1. Present Value of Defined Benefit Obligation as at 31st March,
0.7 0.6
2. Fair Value of Plan assets as at 31st March — — 3. Funded Status [Surplus/(Deficit)] (0.7) (0.6) 4. Net Asset/(Liability) as at 31st March (0.7) (0.6) C. Change in obligation during the year ended 31st March 1. Present value of the defined benefit obligation at the
beginning of the year 0.6 0.5
2. Current Service Cost — — 3. Interest Cost 0.1 — 4. Actuarial (Gain)/Loss — 0.1 5. Benefits Paid — — 6. Present value of the defined benefit obligation at the
end of the year0.7 0.6
D. Change in fair value of assets during the year ended 31st March 1. Fair Value of Plan assets at the beginning of the year — — 2. Expected Return on plan assets — —
3. Contributions by the Employer — — 4. Actual Benefits Paid — — 5. Actuarial Gain/(Loss) on Plan Assets — — 6. Fair Value of Plan assets at the end of the year Total Actuarial Gain/(Loss) to be recognised — (0.1) E. Actual Return on Plan Assets 1. Expected Return on plan assets — — 2. Actuarial Gain/(Loss) on Plan Assets — — 3. Actual return on Plan Assets — — F. Movement in net liability recognised in the Balance Sheet 1. Opening Net Liability/(Asset) 0.6 — 2. Expenses 0.1 0.6 3. Contribution — — Closing Net Liability/(Asset) 0.7 0.6
The plan assets under the Gratuity scheme are deposited under approved securities. The major categories of plan assets as a percentage of total plan assets are provided below:
2008-09 2007-08GOI Securities 27% 42%State Government Securities 15% 15%PSU Bonds 58% 39%Private Sector Bonds — 4%Total 100% 100%
The assumptions used for actuarial valuation as at 31st March, 2009 are as follows:
2008-09 2007-08
Expected rate of return on plan assets 7.7% p.a. 7.5% p.a.
Discount Rate 7.7% p.a. 7.5% p.a.
Expected salary increase rate 6% – 8% p.a. 6% – 8% p.a.
In-service mortality rates LIC 1994-96 ultimate table LIC 1994-96 ultimate table
The expected rate of return on assets is based on the expectation of the average long term rate of return on investment of the fund, during the estimated term of obligation.
The obligations are measured at the present value of estimated future cash flows by using a discount rate that is determined with reference to the market yields at the Balance Sheet date on Government Bonds which is consistent with the estimated terms of the obligation.
Rs Mio.
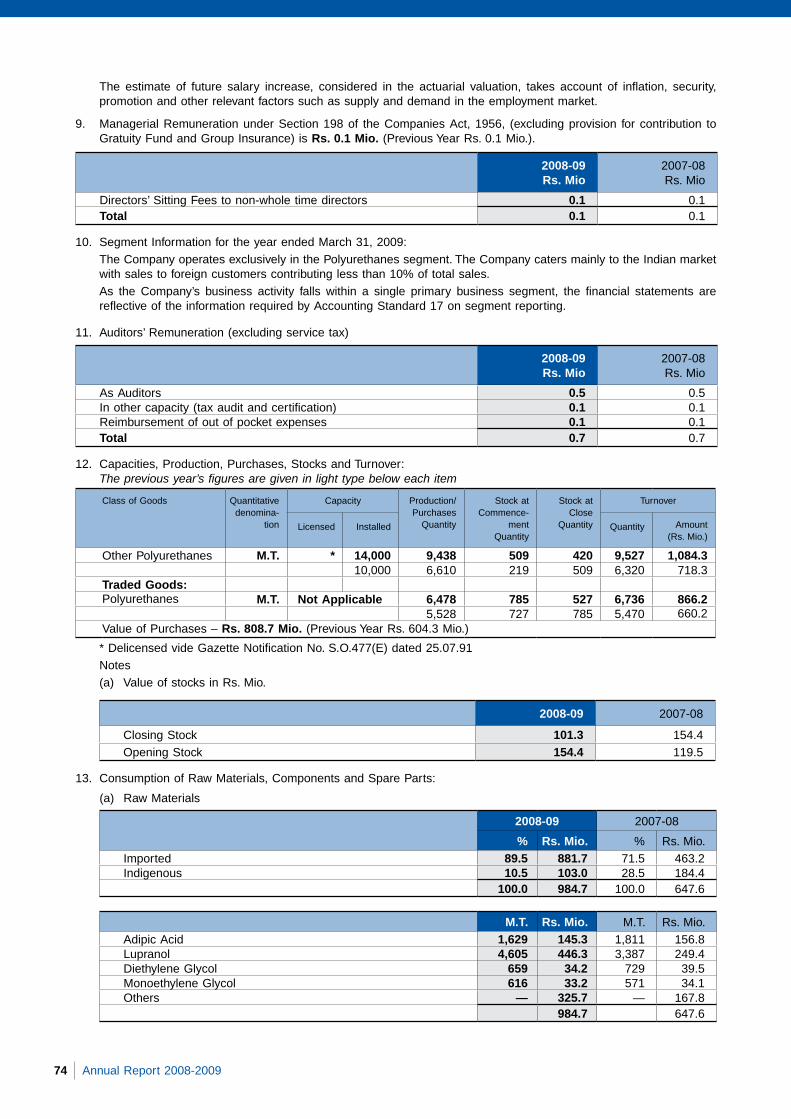
74 Annual Report 2008-2009
The estimate of future salary increase, considered in the actuarial valuation, takes account of inflation, security, promotion and other relevant factors such as supply and demand in the employment market.
9. Managerial Remuneration under Section 198 of the Companies Act, 1956, (excluding provision for contribution to Gratuity Fund and Group Insurance) is Rs. 0.1 Mio. (Previous Year Rs. 0.1 Mio.).
2008-09Rs. Mio
2007-08Rs. Mio
Directors’ Sitting Fees to non-whole time directors 0.1 0.1Total 0.1 0.1
10. Segment Information for the year ended March 31, 2009: The Company operates exclusively in the Polyurethanes segment. The Company caters mainly to the Indian market
with sales to foreign customers contributing less than 10% of total sales. As the Company’s business activity falls within a single primary business segment, the financial statements are
reflective of the information required by Accounting Standard 17 on segment reporting.
11. Auditors’ Remuneration (excluding service tax)
2008-09Rs. Mio
2007-08Rs. Mio
As Auditors 0.5 0.5In other capacity (tax audit and certification) 0.1 0.1Reimbursement of out of pocket expenses 0.1 0.1Total 0.7 0.7
12. Capacities, Production, Purchases, Stocks and Turnover: The previous year’s figures are given in light type below each item
Class of Goods Quantitative denomina-
tion
Capacity Production/ Purchases
Quantity
Stock at Commence-
mentQuantity
Stock at Close
Quantity
Turnover
Licensed Installed Quantity Amount(Rs. Mio.)
Other Polyurethanes M.T. * 14,000 9,438 509 420 9,527 1,084.310,000 6,610 219 509 6,320 718.3
Traded Goods:Polyurethanes M.T. Not Applicable 6,478 785 527 6,736 866.2
5,528 727 785 5,470 660.2Value of Purchases – Rs. 808.7 Mio. (Previous Year Rs. 604.3 Mio.)
* Delicensed vide Gazette Notification No. S.O.477(E) dated 25.07.91 Notes (a) Value of stocks in Rs. Mio.
2008-09 2007-08
Closing Stock 101.3 154.4Opening Stock 154.4 119.5
13. Consumption of Raw Materials, Components and Spare Parts:
(a) Raw Materials
2008-09 2007-08
% Rs. Mio. % Rs. Mio.Imported 89.5 881.7 71.5 463.2Indigenous 10.5 103.0 28.5 184.4
100.0 984.7 100.0 647.6
M.T. Rs. Mio. M.T. Rs. Mio.Adipic Acid 1,629 145.3 1,811 156.8Lupranol 4,605 446.3 3,387 249.4Diethylene Glycol 659 34.2 729 39.5Monoethylene Glycol 616 33.2 571 34.1Others — 325.7 — 167.8
984.7 647.6

BASF Polyurethanes India Limited 75
(b) Components and Spare Parts:
2008-09 2007-08
% Rs. Mio. % Rs. Mio.
Imported — — — —
Indigenous 100.0 3.0 100 1.3
100.0 3.0 100.0 1.3
14. Value of direct import on C.I.F. basis during the period (including in-transit):
2008-09Rs. Mio
2007-08Rs. Mio
Raw Materials 703.6 447.7
Capital Goods 0.8 —
Finished Goods 733.5 457.1
1,437.9 904.8
15. Expenses in foreign currencies during the period (on accrual basis):
2008-09Rs. Mio
2007-08Rs. Mio
Royalty (net of tax) 14.4 8.5
Foreign Travel 1.1 2.8
Interest (net of tax) 0.8 1.9
Consultancy Charges 1.5 3.2
Communication/System Expenses 4.3 3.5
Others 7.0 0.7
29.1 20.6
16. Earnings in foreign currencies during the year (on accrual basis):
2008-09Rs. Mio
2007-08Rs. Mio
Exports of goods calculated on FOB basis 31.9 50.4
Indent Commission 101.4 85.9
Freight and Insurance 0.9 2.3
134.2 138.6
17. Related Party Disclosures
(a) Parties where control exists
BASF India Limited Holding Company (holds 100% of the equity share capital as on March 31, 2009)
BASF SE Ultimate Holding Company
(b) Other related parties with whom transactions have taken place during the period
Fellow Subsidiaries
BASF Company Ltd. BASF (China) Company Ltd.
BASF Petronas Chemicals Sdn. Bhd. BASF Corporation
BASF South East Asia Pte. Ltd. BASF Polyurethanes (China) Co. Ltd.
BASF China Limited BASF Polyurethanes (Malaysia) Sdn. Bhd.
Shanghai BASF Polyurethane Company BASF Asia Pacific Service Centre Sdn. Bhd.
Elastogran GMBH Elastogran Italia Spa (Elit)
BASF Polyurethane Specialities BASF Polyurethane Licencing GmbH
BASF East Asia Regional Headquarters BASF Singapore Pte. Ltd.
BASF Bangladesh Limited BASF Polyurethanes (Taiwan) Co. Ltd.

76 Annual Report 2008-2009
(c) Details of transactions for the year ended March 31, 2009:
Rs. Mio.
Nature of TransactionsHolding & Ultimate Holding Company
Fellow Subsidiaries
Total
2008-09 2007-08 2008-09 2007-08 2008-09 2007-08
Sale of GoodsBASF Singapore Pte. Ltd. – – 6.1 – 6.1 –BASF China Limited – – 1.3 1.7 1.3 1.7BASF Company Ltd. – – 0.2 2.1 0.2 2.1BASF Polyurethanes (Malaysia) Sdn. bhd. – – – 3.3 – 3.3BASF Polyurethanes (China) Co. Ltd. – – – 7.6 – 7.6BASF Polyurethane Specialities – – – 2.1 – 2.1Others – – – 2.2 – 2.2 Sub-Total – – 7.6 19.0 7.6 19.0Services RenderedBASF South East Asia Pte. Ltd. – – 26.7 19.6 26.7 19.6BASF Company Ltd. – – 69.0 59.2 69.0 59.2Others – – 5.7 7.1 5.7 7.1 Sub-Total – – 101.4 85.9 101.4 85.9Purchase of Goods/MaterialsBASF SE 112.4 134.5 – – 112.4 134.5BASF India Limited 0.8 – – – 0.8 –BASF Company Ltd. – – 739.8 458.9 739.8 458.9BASF South East Asia Pte. Ltd. – – 80.9 105.8 80.9 105.8Elastogran Italia Spa (Elit) – – 123.1 77.4 123.1 77.8Others – – 143.4 71.7 143.4 71.7 Sub-Total 113.2 134.5 1,087.2 713.8 1,200.4 848.3Services ReceivedBASF SE 2.3 1.1 – – 2.3 1.1BASF India Limited 52.1 33.8 – – 52.1 33.8BASF South East Asia Pte. Ltd. – – 5.1 3.2 5.1 3.2BASF East Asia Regional Headquarters – – 0.8 – 0.8 –Elastogran Italia Spa (Elit) – – 0.7 0.6 0.7 0.6BASF Asia Pacific Service Centre Sdn. Bhd.
– – 5.5 2.1 5.5 2.1
Others – – – 1.8 – 1.8 Sub-Total 54.4 34.9 12.1 7.7 66.5 42.6Interest on LoansBASF SE 1.0 2.1 – – 1.0 2.1BASF India Limited 18.3 15.6 – – 18.3 15.6 Sub-Total 19.3 17.7 – – 19.3 17.7Royalty and Technical FeesBASF Polyurethane Licencing GmbH – – 14.4 8.5 14.4 8.5Repayment of Loan/ ICDBASF SE 32.0 – – – 32.0 –BASF India Limited 8,359.0 8,433.0 – – 8,359.0 8,433.0ICD ReceivedBASF India Limited 8,725.0 8,512.0 – – 8,725.0 8,512.0Interest accrued – not dueBASF India Limited 0.2 0.3 – – 0.2 0.3OutstandingReceivablesBASF Polyurethanes (China) Co. Ltd. – – 7.0 3.8 7.0 3.8BASF China Limited – – 0.9 0.6 0.9 0.6Others – – 0.5 0.8 0.5 0.8 Sub-Total – – 8.4 5.2 8.4 5.2

BASF Polyurethanes India Limited 77
Rs. Mio.
Nature of TransactionsHolding & Ultimate Holding Company
Fellow Subsidiaries
Total
2008-09 2007-08 2008-09 2007-08 2008-09 2007-08
OutstandingPayablesBASF SE 1.4 21.2 – – 1.4 21.2BASF India Limited 4.4 – – – 4.4 –BASF Company Limited – – 64.2 87.3 64.2 87.3BASF South East Asia Pte. Ltd. – – 32.1 20.7 32.1 20.7Elastogran Italia Spa (Elit) – – 29.7 12.1 29.7 12.1Others – – 30.8 45.1 30.8 45.1 Sub-Total 5.8 21.2 156.8 165.2 162.6 186.4Loans/ICD OutstandingBASF SE – Loan – 32.0 – – – 32.0BASF India Limited – ICD 605.0 239.0 – – 605.0 239.0
Details of remuneration to Directors are given in Note 9.
Transfer Pricing regulations:
The management is of the opinion that the company’s international transaction are at an arm’s length so that aforesaid legislation will not have any impact on the financial statements, particularly on the amount of tax expense and that of provision for taxation.
18. As on 31st March, 2009, the Company has 10 forward contracts totalling to USD 2.5 Mio. (Rs 130.3 Mio.) for the purposes of hedging its foreign exposure. The unamortized premium of Rs. 0.7 Mio. pertaining to the same will be recognized subsequently. Foreign currency exposure that is not hedged as at 31st March is as follow:-
2008-09
Receivable Payable
Foreign Currency Foreign Currency Amount
Rs. in Mio. Foreign Currency Amount
Rs. in Mio.
EURO — — 194,954 13.3
HKD — — 590 —
2007-08
Receivable Payable
Foreign Currency Foreign Currency Amount
Rs. in Mio. Foreign Currency Amount
Rs. in Mio.
EURO — — 129,197 8.2
USD — — 238,287 10.0
19. The Previous Year’s figures have been regrouped and rearranged wherever necessary.
Signatures to Schedules 1 to 19 Prasad Chandran K. R. CoorlawalaChairman & Managing Director R. R. Nair
R. Y. VaidyaS. RamnathR. A. Shah
Pradeep Chandan Deepak ThuseCompany Secretary Directors
Mumbai, 16th April 2009

78 Annual Report 2008-2009
Prasad Chandran K. R. CoorlawalaChairman & Managing Director R. R. Nair
R. Y. VaidyaS. RamnathR. A. Shah
Pradeep Chandan Deepak ThuseCompany Secretary Directors
Mumbai, 16th April 2009
Balance Sheet Abstract and General Business Profile
I Registration Details :
Registration No. : 152467 State Code : 11
Balance Sheet Date : 31.03.2009
II Capital Raised during the Period :(Amount in Rs. Million)
Public Issue : Nil Rights Issue : Capital Raised : Nil
Bonus Issue : Nil Private Placement : Nil
III Position of Mobilisation and Deployment of Funds :(Amount in Rs. Million)
Total Liabilities : 914.4 Total Assets : 914.4
Sources of Funds :
Paid Up Capital : 90.0 Reserves & Surplus : –
Secured Loans : – Unsecured Loans : 824.4
Application of Funds :
Net Fixed Assets : 121.7 Investments : –
Net Current Assets : 573.7 Deferred Tax Assets – Net –
Accumulated Losses : Nil
IV Performance of Company(Amount in Rs. Million)
Turnover (including Other Income) : 2,052.5 Total Expenditure 2,252.5
Profit Before Tax : (200.0) Profit After Tax (200.5)
Earning Per Share in Rs. –22.28 Dividend Rate % –
V Generic Names of Principal Products of the Company :(As per monetary terms)
Item Code No. Product Description
(ITC Code)
29291090 Isocyanate – Others
39072090 Other Polyurethanes

Consolidated Financial Statements 79
Auditors’ Report to the Board of Directorsof BASF India Limited GroupWe have examined the attached consolidated Balance Sheet of BASF India Limited (‘the Company’) and its subsidiary, BASF Polyurethanes India Limited (collectively referred to as ‘the BASF Group’), as at 31 March 2009 and the related consolidated Profit and Loss Account and the consolidated Cash Flow Statement for the year ended on that date, annexed thereto. These consolidated financial statements are the responsibility of the BASF Group’s management. Our responsibility is to express an opinion on these consolidated financial statements based on our audit.
We conducted our audit in accordance with the auditing standards generally accepted in India. These Standards require that we plan and perform the audit to obtain reasonable assurance whether the consolidated financial statements are prepared, in all material respects, in accordance with an identified financial reporting framework and are free of material misstatement. An audit includes, examining on a test basis, evidence supporting the amounts and disclosures in the consolidated financial statements. An audit also includes assessing the accounting principles used and significant estimates made by management, as well as evaluating the overall consolidated financial statements presentation. We believe that our audit provides a reasonable basis for our opinion.
We report that the consolidated financial statements have been prepared by the BASF Group management in accordance with the requirements of Accounting Standards (AS) 21. Consolidated financial statements, specified in the Companies (Accounting Standards) Rules, 2006 and on the basis of the separate audited financial statements of the Company and its subsidiary as listed in Note 1 (b) of Accounting Policies and Notes to Accounts included in the consolidated financial statements.
In our opinion and to the best of our information and according to the explanations given to us, the consolidated financial statements give a true and fair view in conformity with the accounting principles generally accepted in India:
(a) in case of the consolidated Balance Sheet, of the consolidated state of affairs of the BASF Group as at 31 March 2009;
(b) in case of the consolidated Profit and Loss Account, of the consolidated results of operations of the BASF Group for the year ended on that date; and
(c) in case of the consolidated Cash Flow Statement, of the consolidated cash flows of the BASF Group for the year ended on that date.
For B S R & Co. Chartered Accountants
Akeel Master Partner Membership No: 046768
Mumbai Date: 16 April 2009

80 Annual Report 2008-2009
Consolidated Balance Sheet of BASF India Limited and its Subsidiary as at March 31, 2009
Rs. in million
Schedule March 31, 2009 March 31, 2008
SOURCES OF FUNDS
Shareholders’ Funds:
Share Capital 1 281.9 281.9
Reserves and Surplus 2 3,349.5 3,094.3
3,631.4 3,376.2
Loan Funds:
Unsecured Loans 3 219.4 272.7
219.4 272.7
Total 3,850.8 3,648.9
APPLICATION OF FUNDS
Fixed Assets: 4
Gross Block 3,787.4 3,544.9
Less: Depreciation 2,409.3 2,262.1
Net Block 1,378.1 1,282.8
Capital Work-in-Progress 212.6 40.7
1,590.7 1,323.5
Investments 5 — 29.0
Deferred Tax Assets (net) 6 2.5 23.6
Current Assets, Loans and Advances:
Inventories 7 2,225.2 1,514.1
Sundry Debtors 8 1,795.1 1,933.8
Cash and Bank Balances 9 302.7 106.1
Loans and Advances 10 845.3 830.8
5,168.3 4,384.8
Less:
Current Liabilities and Provisions:
Current Liabilities 11 2,561.1 1,771.4
Provisions 12 349.6 340.6
2,910.7 2,112.0
Net Current Assets 2,257.6 2,272.8
Total 3,850.8 3,648.9
For Accounting Policies and Notes to Accounts — Refer Schedule 20
The Schedules referred to above form integral part of the Balance Sheet.
As per our report of even date attached Prasad Chandran K. R. CoorlawalaChairman & Managing Director R. R. Nair
For B S R & Co. R. Y. VaidyaChartered Accountants M. R. Iyer S. Ramnath
Company Secretary R. A. ShahAkeel Master Pradip P. ShahPartner Deepak ThuseMembership No.: 046768 Directors
Mumbai, 16th April 2009 16th April 2009

Consolidated Financial Statements 81
Consolidated Profit and Loss Account of BASF India Limited and its Subsidiary for the year ended March 31, 2009
Rs. in million
Schedule March 31, 2009 March 31, 2008
Income:
Sales and Services 13 14,519.4 11,894.0
Less: Excise Duty 1,358.5 1,336.8
13,160.9 10,557.2
Other Income 14 67.3 32.1
13,228.2 10,589.3
Expenditure:
Materials Consumed 15 7,083.5 5,638.9
Purchase of Finished Goods 2,335.8 1,504.4
Other Expenses 16 2,871.0 2,479.9
Depreciation 4 165.3 147.3
Interest 17 65.8 36.0
12,521.4 9,806.5
Increase in Stocks 18 173.5 130.2
Profit Before Tax 880.3 913.0
Tax 19 394.2 338.4
Profit After Tax 486.1 574.6
Surplus Brought Forward 243.4 229.5
Available for Appropriation 729.5 804.1
Appropriations:
Proposed Dividend 197.3 197.3
Corporate Tax on Dividend 33.6 33.6
General Reserve 455.5 329.8
686.4 560.7
Balance Carried Forward 43.1 243.4
Weighted average number of equity shares outstanding during the year 28,189,466 28,189,466
Basic and diluted earnings per share (in Rs.) 17.24 20.38
Face value per share (in Rs.) 10.00 10.00
For Accounting Policies and Notes to Accounts — Refer Schedule 20
The Schedules referred to above form integral part of the Profit and Loss Account.
As per our report of even date attached Prasad Chandran K. R. CoorlawalaChairman & Managing Director R. R. Nair
For B S R & Co. R. Y. VaidyaChartered Accountants M. R. Iyer S. Ramnath
Company Secretary R. A. ShahAkeel Master Pradip P. ShahPartner Deepak ThuseMembership No.: 046768 Directors
Mumbai, 16th April 2009 16th April 2009

82 Annual Report 2008-2009
Consolidated Cash Flow Statement of BASF India Limited and its Subsidiary for the year ended March 31, 2009
Rs. in million
March 31, 2009 March 31, 2008
A. Cash flow from operating activities
Net Profit Before Tax 880.3 913.0
Adjustments for:
Depreciation 165.3 147.3
Interest expense 65.8 36.0
Loss/(Profit) on sale of fixed assets (net) (1.5) 1.4
Interest income (1.8) (1.6)
Unrealised (Gain)/Loss on foreign exchange (net) 10.3 10.2
Provision for Doubtful Debts (10.1) 228.0 4.7 198.0
Operating profit before working capital changes 1,108.3 1,111.0
(Increase)/Decrease in:
Trade and Other Receivables 197.7 (361.9)
Inventories (711.1) (135.8)
Trade and Other Liabilities (767.8) 254.4 (384.8) (112.9)
Cash generated from operations 1,362.7 998.1
Direct taxes paid (net) (388.0) (343.3)
Net cash from operating activities 974.7 654.8
B. Cash flow from investing activities:
Acquisition of fixed assets (427.4) (321.4)
Realisation on sale of fixed assets 3.7 8.2
Interest received 1.8 1.6
Net cash used in investing activities (421.9) (311.6)
C. Cash flow from financing activities
Repayment of loan funds (58.1) (42.7)
Interest paid (67.2) (36.6)
Dividend paid (197.3) (197.3)
Tax paid on above dividend (33.6) (33.6)
Net cash used in financing activities (356.2) (310.2)
Net increase in cash and cash equivalents 196.6 33.0
Cash and cash equivalents (opening balance) 106.1 73.1
Cash and cash equivalents (closing balance) 302.7 106.1
Restricted cash and cash equivalents 5.6 5.5
As per our report of even date attached Prasad Chandran K. R. CoorlawalaChairman & Managing Director R. R. Nair
For B S R & Co. R. Y. VaidyaChartered Accountants M. R. Iyer S. Ramnath
Company Secretary R. A. ShahAkeel Master Pradip P. ShahPartner Deepak ThuseMembership No.: 046768 Directors
Mumbai, 16th April 2009 16th April 2009

Consolidated Financial Statements 83
Schedules to Consolidated Balance Sheet as at March 31, 2009
1. Share Capital Rs. in million
March 31, 2009 March 31, 2008
Authorised:30,000,000 (Previous Year – 30,000,000) Equity Shares of Rs.10/- each 300.0 300.0 Issued:28,190,148 (Previous Year – 28,190,148) Equity Shares of Rs.10/- each 281.9 281.9 Subscribed and Paid-up:28,189,466 (Previous Year – 28,189,466) Equity Shares of Rs.10/- each fully paidOf the above –– 700 Equity Shares were allotted as fully paid pursuant to a
contract without payment being received in cash and 15,771,400 Equity Shares were allotted as fully paid Bonus Shares by way of capitalisation of Reserves.
– 4,035,948 shares were allotted to the erstwhile shareholders of Cyanamid Agro Limited (CAL) consequent to the amalgamation w.e.f. April 1, 2001
– 20,066,242 (Previous Year – 14,853,020) Equity Shares are held by BASF SE, the holding company.
281.9
281.9
281.9 281.9
2. Reserves and Surplus
Balance as on April 1,
Additions during the year
Withdrawals during the year
Balance as on March 31,
2008 2007 2008-09 2007-08 2008-09 2007-08 2009 2008
Share Premium Account 621.0 621.0 — — — — 621.0 621.0
Amalgamation Reserve 0.5 0.5 — — — — 0.5 0.5
General Reserve 2,229.4 1,899.6 455.5 329.8 — — 2,684.9 2,229.4
Surplus as per Profit & Loss Account 243.4 229.5 — 13.9 200.3 — 43.1 243.4
3,094.3 2,750.6 455.5 343.7 200.3 — 3,349.5 3,094.3
3. Unsecured Loans
March 31, 2009 March 31, 2008
Term Loan:Loan from BASF SERepayable within one year Rs. Nil (Previous Year Rs. 32 million)Maximum amount outstanding at any time during the year Rs. 32 million (Previous Year Rs. 34.8 million)
— 32.0
Other Loan:Bank FacilitiesRepayable within one year Rs. 219.4 million (Previous Year Rs. 240.7 million)
219.4
240.7
219.4 272.7

84 Annual Report 2008-2009
Schedules to Consolidated Balance Sheet as at March 31, 2009
4. Fixed Assets Rs. in million
Freehold Land
Leasehold Land
Buildings* Plant & Machinery
and Computers#
Furniture, Fixtures
and Equipment
Vehicles Total Previous Year
Gross Block:
As at April 1, 2008 24.1 50.4 647.9 2,674.0 137.9 10.6 3,544.9 3,379.2
Additions — — 102.8 135.7 23.5 0.8 262.8 339.7
Deductions — 0.2 0.1 14.1 3.7 2.2 20.3 174.0
As at March 31, 2009 24.1 50.2 750.6 2,795.6 157.7 9.2 3,787.4 3,544.9
Depreciation:
As at April 1, 2008 — 2.5 219.8 1,953.5 76.8 9.5 2,262.1 2,279.2
Depreciation for the year — 2.2 23.4 123.1 15.7 0.9 165.3 147.3
Deductions — — 0.1 13.3 2.5 2.2 18.1 164.4
As at March 31, 2009 — 4.7 243.1 2,063.3 90.0 8.2 2,409.3 2,262.1
Net Block:
As at March 31, 2009 24.1 45.5 507.5 732.3 67.7 1.0 1,378.1 1,282.8
As at March 31, 2008 24.1 47.9 428.1 720.5 61.1 1.1 1,282.8 1,100.0
Capital work in progress**
As at March 31, 2009 — — 47.5 164.9 0.2 — 212.6 40.7
As at March 31, 2008 — — 19.1 16.7 4.9 — 40.7 50.2
* Buildings include Rs. 0.03 million (Previous Year Rs. 0.03 million) being the value of shares in various co-operative societies.
** Capital work in progress includes capital advances Rs. 21.3 million (Previous Year Rs. 19.7 million) – Considered good.
# Plant & Machinery includes Gross Block Rs. 73.1 million (Previous Year Rs. 73.1 million), Accumulated Depreciation – Rs. 73.1 million (Previous Year Rs. 73.1 million) and Net Block Rs. Nil (Previous Year Rs. Nil) being the Company’s share of an asset jointly owned with another company.
5. Investments
March 31, 2009 March 31, 2008
(Non-Trade) - Unquoted - Long Term
Other Investments
National Bank for Agriculture & Rural Development — 29.0
– Nil Bonds (Previous Year – 2900 ) of Rs. 10,000 each
— 29.0
6. Deferred Tax Assets (net)
March 31, 2009 March 31, 2008
(Ref. note 7)
Deferred tax assets 79.4 87.8
Deferred tax liabilities (76.9) (64.2)
2.5 23.6

Consolidated Financial Statements 85
Schedules to Consolidated Balance Sheet as at March 31, 2009
7. Inventories Rs. in million
March 31, 2009 March 31, 2008
Raw Materials 1,187.6 660.4
Finished Goods 957.3 765.8
Stock-in-Process 24.6 42.6
Packing Materials 50.3 42.2
Fuel Oil 5.4 3.1
2,225.2 1,514.1
8. Sundry Debtors
March 31, 2009 March 31, 2008
Debts outstanding for a period exceeding six months
Considered good :
Secured — —
Unsecured 19.0 33.6
19.0 33.6
Considered doubtful 85.9 113.4
Other debts
Considered good :
Secured 54.2 47.5
Unsecured 1,722.0 1,852.7
1,776.2 1,900.2
Considered doubtful 21.6 4.2
1,902.7 2,051.4
Less: Provision for doubtful debts 107.6 117.6
1,795.1 1,933.8
9. Cash and Bank Balances
March 31, 2009 March 31, 2008
Cash on hand 0.2 0.4
Balances with Scheduled Banks :
– In Current Accounts 301.5 104.3
– In Deposit Accounts 1.0 1.4
302.7 106.1

86 Annual Report 2008-2009
Schedules to Consolidated Balance Sheet as at March 31, 2009
10. Loans and Advances (Unsecured) – Considered Goods Rs. in million
March 31, 2009 March 31, 2008
Advances recoverable in cash or in kind or for value to be received 711.9 712.6
Includes due from
– Directors Rs. 0.71 million (Previous Year Rs. 0.78 million)
Maximum amount during the year Rs. 0.78 million (Previous Year Rs. 0.85 million)
In the case of Directors, it represents loans given to them before they became Directors.
Duty Drawback receivable 11.0 15.2
Balances with Excise authorities 7.4 2.9
Balances with Income Tax authorities (Net of Provisions) 115.0 100.1
845.3 830.8
11. Current Liabilities
March 31, 2009 March 31, 2008
Sundry Creditors
– Micro & Small Enterprises 1.3 1.4
– Others 2,440.8 1,645.2
Deposits 98.3 106.3
Unclaimed Dividend* 4.6 4.3
Unclaimed matured fixed deposits* 0.6 0.7
Unclaimed Interest warrants* 0.4 0.5
* (There are no amounts due and outstanding to be credited to Investor Education and Protection fund)
Interest accrued but not due 0.1 1.5
Other Liabilities 15.0 11.5
2,561.1 1,771.4
12. Provisions
March 31, 2009 March 31, 2008
Proposed Dividend 197.3 197.3
Corporate Tax on Dividend 33.6 33.6
Provision for Long Service Award 17.5 15.0
Provision for Leave Encashment 98.3 93.3
Provision for Gratuity 2.9 1.4
349.6 340.6

Consolidated Financial Statements 87
Schedules to Consolidated Profit & Loss account for the year ended March 31, 2009
13. Sales and Services Rs. in million
March 31, 2009 March 31, 2008
Sale of Goods 13,721.8 11,295.1
Indent Commission/Technical/Service Charges 797.6 598.9
14,519.4 11,894.0
14. Other Income
March 31, 2009 March 31, 2008
Interest (Gross)
1.6
1.5 – Interest on Investments (Gross) – Non-Trade and Long Term
Tax deducted at source Rs. Nil (Previous Year Rs. Nil)
– Others 21.1 13.2
Tax deducted at source Rs. 6.1 million (Previous Year Rs. 2.8 million)
Profit on sale of Fixed Assets (net) 1.5 —
Sale of Scrap 13.5 13.2
Sundries 29.6 4.2
67.3 32.1
15. Materials consumed
March 31, 2009 March 31, 2008
Raw Materials:
Stock at Commencement 660.4 660.6
Purchases 7,305.3 5,376.8
Stock at Close (1,187.6) (660.4)
6,778.1 5,377.0
Packing Materials consumed 305.4 261.9
7,083.5 5,638.9
BASF Leather Parivar at the India International Leather Fair 2009 in Chennai, showcasing eco-friendly products & processes, and our commitment to Sustainable Development.

88 Annual Report 2008-2009
Schedules to Consolidated Profit & Loss account for the year ended March 31, 2009
16. Other Expenses Rs. in million
March 31, 2009 March 31, 2008
Salaries, Wages, Bonus and Commission (Ref. note 8) 734.0 616.6 Workmen and Staff Welfare (Ref. note 8) 119.4 150.6 Contribution to Provident and Other Funds (Ref. note 8) 81.6 98.9 Directors’ Sitting Fees 0.1 0.1 Consumption of Stores and Spare Parts 48.0 50.4 Power and Fuel 237.8 212.6 Rent (Ref. note 6(b)) 199.6 119.7 Rates and Taxes – Excise Duty (14.6) 4.9 – Others 6.2 4.0 Repairs – Machinery 33.9 34.0 – Buildings 24.3 21.2 – Others 15.7 14.7 Insurance 25.4 26.2 Bad Debts Written Off / (Recovered) 13.1 (5.0)Provision for Doubtful Debts (Net) (10.1) 4.7 Loss on Sale of Fixed Assets (Net) — 1.4 Service Fees 61.0 69.8 Travelling 171.2 167.4 Freight and Handling Charges 367.5 313.2 Communication/System Expenses 171.0 122.4 Sales Promotion Expenses 143.6 89.1 Professional Charges 81.2 60.8 Royalty 49.1 35.3 Voluntary Retirement Scheme 14.1 14.7 Sundry Expenses 297.9 252.2
2,871.0 2,479.9
17. Interest
March 31, 2009 March 31, 2008
On Short Term Loans 3.9 2.1 On Others 61.9 33.9
65.8 36.0
18. Increase in Stocks
March 31, 2009 March 31, 2008
Stock at Close Finished Goods 957.3 765.8 Stock-in-Process 24.6 42.6 Sub-total 981.9 808.4 Stock at commencement Finished Goods (765.8) (646.9) Stock-in-Process (42.6) (31.3) Sub-total (808.4) (678.2)Increase in stocks 173.5 130.2
19. Tax
March 31, 2009 March 31, 2008
Current Tax Expense (includes wealth tax Rs. 2.0 million Previous year Rs. 2.0 million)
347.8 319.7
Deferred Tax Charge / (Credit) 21.1 (2.5)Fringe Benefit Tax 25.3 21.2
394.2 338.4

Consolidated Financial Statements 89
20. Accounting Policies and Notes to Accounts
(Amounts are shown in Millions of Rupees, abbreviated as Rs. Mio.)
1. Accounting Policies
(a) Basis of Accounting
The financial statements are prepared under the historical cost convention, on accrual basis, in accordance with provisions of Companies Act, 1956 and the accounting principles generally accepted in India and comply with the Accounting Standards prescribed in the Companies (Accounting Standards) Rules, 2006 issued by the Central Government, in consultation with the National Advisory Committee on Accounting Standards, to the extent applicable. The financial statements are presented in Millions of Indian Rupees.
(b) Principles of Consolidation
1. The consolidated financial statements include the audited financial statements of BASF India Limited (‘the Company’), and its wholly owned subsidiary. The consolidation has been carried out in accordance with Accounting Standard (AS 21) — Consolidated Financial Statements on the following basis:
— The financial statements of the Company and its subsidiary have been combined on a line – by – line basis by adding together, the book values of like items of assets, liabilities, income and expenses, after fully eliminating inter company balances / transactions and resulting unrealised profits/losses.
— The consolidated financial statements have been prepared using uniform accounting policies for like transactions and other events in similar circumstances and are presented to the extent possible, in the same manner as the Company’s separate financial statements.
2. The subsidiary considered in the consolidated financial statements is:
Name of the Company Country of incorporation Proportion of ownership interest
BASF Polyurethanes India Limited India 100%
(c) Use of estimates
The presentation of financial statements in conformity with the generally accepted accounting principles requires estimates and assumptions to be made that affect the reported amount of assets and liabilities and disclosure of contingent liabilities on the date of the financial statements and the reported amount of revenues and expenses during the reporting period. Difference between the actual result and estimates are recognised in the period in which the results are known/materialise.
(d) Revenue Recognition
Sales of products and Indent Commission are recognised when risk and rewards of ownership of the products are passed on to the customers, which is generally on despatch of goods. Revenue from technical and service charges are recognised as and when the services are provided. Sales include excise duty but exclude trade discounts, rebates and sales tax. Interest on investments is booked on a time proportion basis taking into account the amounts invested and the rate of interest.
(e) Fixed Assets
Fixed Assets are recorded at cost net of Cenvat credit wherever eligible. Cost includes all expenses and interest attributable to the project till the date it is ready to use. The carrying amounts of assets are reviewed at each Balance Sheet date if there is any indication of impairment based on internal/external factors. Impairment is recognised when the carrying amount of the asset exceeds its recoverable amount. Impairment loss is charged to the Profit and Loss Account in the year in which an asset is identified as impaired. An impairment loss recognised in prior accounting periods is reversed if there has been a change in the estimate of the recoverable amount.
(f) Depreciation
Depreciation is charged on straight-line basis at the following rates:
Buildings — 3.34 %
Plant & Machinery — 10.34 % - 20%
Computers — 25.00 %
Vehicles — 25.00 %
Furniture, Fixtures & Equipment — 12.50 %
Assets individually costing Rs. 5,000 or below — 100.00 %

90 Annual Report 2008-2009
Depreciation on additions/deletions is calculated on a monthly pro-rata basis. Accelerated depreciation is charged on certain assets based on periodic review of estimated useful life.
Leasehold land is amortised over the period of lease.
(g) Borrowing costs
Borrowing costs that are attributable to the acquisition or construction of qualifying assets are capitalised. Other borrowing costs are recognised as an expense in the period in which they are incurred.
(h) Investments
Long-term Investments are stated at cost. Provision is made to recognise a decline, other than temporary, in the value of Long-term Investments. Current Investments are stated at lower of cost or fair value.
(i) Inventories
Inventories are valued at cost or net realisable value, whichever is lower. The costs are worked out on weighted average basis. Fixed production overheads are allocated on the basis of normal capacity of production facilities. Excise duty on goods manufactured by the Company and remaining in inventory is included as a part of valuation of finished goods.
(j) Foreign Currency
Transactions in foreign currencies are recorded at the exchange rates prevailing on the date of transaction. Monetary items in foreign currencies are stated at the closing exchange rate. The forward exchange contracts are backed by underlying transactions, the premium or discount arising at the inception of such a forward exchange contract is amortised as expense or income over the life of the contract and the difference between the year end rate and rate on the date of the contract is recognised as exchange difference in the Profit and Loss Account. Gains/losses on conversion/translation have been recognised in the Profit and Loss Account.
(k) Employee Benefits
(A) Short Term Employee Benefits
All employee benefits payable wholly within twelve months of rendering the service are classified as short term employee benefits and are recognized in the Profit and Loss Account as an expense at the undiscounted amount on an accrual basis.
(B) Post Employment Employee Benefits Company’s contributions to defined contribution plans such as Superannuation Fund, Family Pension Fund,
Group Mediclaim Insurance Policy, Employee State Insurance and Labour Welfare Fund are recognized in the Profit and Loss Account on an accrual basis.
Company’s liability towards Gratuity, which is a defined benefit plan, is determined on the basis of valuations, as at balance sheet date, carried out by an independent actuary using Projected Unit Credit Method. Actuarial gains and losses comprise experience adjustments and the effects of changes in actuarial assumptions and are recognised immediately in the Profit and Loss Account.
Company’s contribution to Provident Fund is recognised in the Profit and Loss Account on accrual basis.
(C) Other Long Term Employee Benefits Company’s liabilities towards Compensated Absences & Long Service Awards to employees are determined
on the basis of valuations, as at balance sheet date, carried out by an independent actuary using Projected Unit Credit Method. Actuarial gains and losses comprise experience adjustments and the effects of changes in actuarial assumptions and are recognised immediately in the Profit and Loss Account.
(D) Termination Benefits Compensation paid to employees under Voluntary Retirement Scheme is recognised as an expense when
incurred.
(l) Assets taken on lease Lease rentals payable as per agreements on vehicles and other assets taken on operating lease are charged
as expenditure on Straight Line basis over the lease term.
(m) Taxes on Income Current tax is determined as the amount of tax payable in respect of taxable income for the period computed
in accordance with relevant provisions of Income Tax Act, 1961.

Consolidated Financial Statements 91
Deferred tax charge or credit and correspondingly deferred tax asset or liability is recognised using tax rates that have been enacted or substantively enacted at the Balance Sheet date. Deferred tax is recognised, subject to the consideration of prudence, on timing differences, being the difference between taxable income and accounting income that originate in one period and are capable of reversal in one or more subsequent periods. Deferred tax assets are not recognised on unabsorbed depreciation and carry forward of losses unless there is virtual certainty that sufficient future taxable income will be available against which such deferred tax assets can be realised. Deferred tax assets are reviewed at each Balance Sheet date and written down or written up to reflect the amount i.e. reasonable/virtually certain (as the case may be) to be realised.
(n) Fringe benefit tax
Provision for fringe benefit tax (FBT) has been recognised on the basis of harmonious contextual interpretation of the provisions of Income Tax Act, 1961.
(o) Provisions, Contingent Liabilities and Contingent Assets
Provisions are recognised only when there is a present obligation as a result of past events it is more likely than not that an outflow of resources will be required to settle the obligation and when a reliable estimate of the amount of the obligation can be made.
Contingent Liability is disclosed for (i) Possible obligations which will be confirmed only by future events not wholly within the control of the Company or (ii) Present obligations arising from past events where it is not probable that an outflow of resources will be required to settle the obligation or a reliable estimate of the amount of the obligation cannot be made.
Contingent Assets are not recognised in the financial statements.
(p) Research & Development Expenditure
Revenue expenditure is recognised as an expense in the period in which it is incurred and the expenditure on capital assets is depreciated over the useful lives of the assets.
(q) Earnings per share
The basic and diluted earnings per share is computed by dividing the net profit attributable to equity shareholders for the year, by the weighted average number of equity shares outstanding during the year.
2. Contingent Liabilities not provided for:
(a) Claims against the Company not acknowledged as debts: Rs. 26.0 Mio. (Previous Year Rs. 25.9 Mio.) in respect of which the Company has counter claims of Rs. 67.0 Mio. (Previous Year Rs. 67.0 Mio.).
(b) Demands for taxes and duties in respect of which the Company has preferred appeals with appropriate authorities:
a. Income tax : Rs. 61 Mio. (Previous Year Rs. 45.3 Mio.) b. Others : Rs. 2.2 Mio. (Previous Year Rs. 3.3 Mio.)
3. Estimated amount of contracts remaining to be executed on capital account and not provided (net of advance) for Rs. 83.8 Mio. (Previous Year Rs. 28.5 Mio.).
4. The exchange loss of Rs. 101 Mio. (Previous Year loss of Rs. 11.5 Mio.) has been included in the Profit and Loss Account for the year.
5. Expenditure on Research and Development charged to Profit and Loss Account Rs. 96.1 Mio. (Previous Year Rs. 76.4 Mio.).
6. The Company has taken certain assets under operating leases.
(a) Total minimum lease payments in this respect are as follows:
Rs. Mio.
2008-09 2007-08
DueNot later than one year 21.7 16.4Later than one year but not later than five years 42.6 18.4Later than five years 1.4 2.0Total 65.7 36.8
(b) Lease rent of Rs. 30.5 Mio. (Previous Year Rs. 23.4 Mio.) has been included under ‘Rent’ in the Profit and Loss Account.

92 Annual Report 2008-2009
7. Deferred Tax:
The break up of Deferred Tax Assets (Net) as at March 31, 2009 is as under:
Rs. Mio.
2008-09 2007-08
Deferred Tax Assets
Timing differences on account of:
Provision for doubtful debts 36.5 40.0
Expenditure under Voluntary Retirement Scheme 12.2 12.0
Unabsorbed Depreciation and Accumulated Losses 4.4 5.6
Others 26.3 30.2
Total Deferred Tax Assets 79.4 87.8
Deferred Tax Liabilities
Timing difference on account of:
Fixed Assets (76.9) (64.2)
Total Deferred Tax Liabilities (76.9) (64.2)
Deferred Tax Assets – Net 2.5 23.6
Deferred tax asset on unabsorbed depreciation and carried forward losses in case of subsidiary has been recognised to the extent of the deferred tax liability.
8. Employee Benefits:
Defined contribution plans
Company’s contribution to defined contribution funds amounting to Rs. 63.1 Mio. (Previous year Rs. 68.2 Mio.) has been charged to the Profit & Loss Account.
Defined benefit plans and other Long term employee benefits.
Gratuity is payable to all eligible employees of the Company on superannuation, death, permanent disablement and resignation in terms of provisions of the Payment of Gratuity Act, 1972, or as per the Company’s scheme whichever is more beneficial. The Company irrevocably contributes funds to a separate Gratuity Trust which is recognised by Income Tax authorities.
Eligible employees can carry forward and encash leave on superannuation, death, permanent disablement and resignation as per Company’s policy.
Long Service Awards are payable to employees on completion of specified years of service at the rate of 0.5 month to 1.5 months eligible salary.
Rs. Mio.
Gratuity (Funded)
2008-09
Gratuity(Funded) 2007-08
A. Expense recognized in the Profit & Loss Account for the year ended 31st March 2009
1. Current Service Cost 11.5 12.7
2. Interest 11.2 8.5
3. Expected Return on Plan Assets (13.1) (10.4)
4. Actuarial (Gain)/Loss 10.5 19.7
5. Past service cost — —
6. Total Expense 20.1 30.5
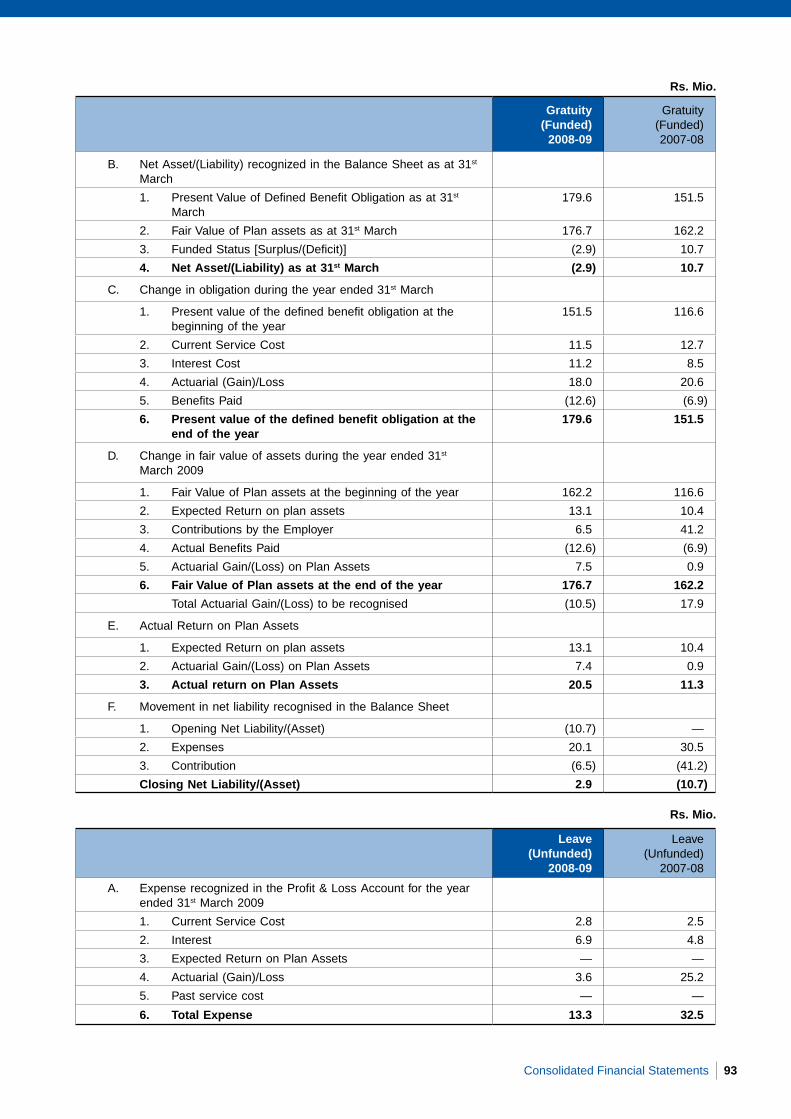
Consolidated Financial Statements 93
Gratuity (Funded)
2008-09
Gratuity(Funded) 2007-08
B. Net Asset/(Liability) recognized in the Balance Sheet as at 31st March
1. Present Value of Defined Benefit Obligation as at 31st March
179.6 151.5
2. Fair Value of Plan assets as at 31st March 176.7 162.2
3. Funded Status [Surplus/(Deficit)] (2.9) 10.7
4. Net Asset/(Liability) as at 31st March (2.9) 10.7
C. Change in obligation during the year ended 31st March
1. Present value of the defined benefit obligation at the beginning of the year
151.5 116.6
2. Current Service Cost 11.5 12.7
3. Interest Cost 11.2 8.5
4. Actuarial (Gain)/Loss 18.0 20.6
5. Benefits Paid (12.6) (6.9)
6. Present value of the defined benefit obligation at the end of the year
179.6 151.5
D. Change in fair value of assets during the year ended 31st
March 2009
1. Fair Value of Plan assets at the beginning of the year 162.2 116.6
2. Expected Return on plan assets 13.1 10.4
3. Contributions by the Employer 6.5 41.2
4. Actual Benefits Paid (12.6) (6.9)
5. Actuarial Gain/(Loss) on Plan Assets 7.5 0.9
6. Fair Value of Plan assets at the end of the year 176.7 162.2
Total Actuarial Gain/(Loss) to be recognised (10.5) 17.9
E. Actual Return on Plan Assets
1. Expected Return on plan assets 13.1 10.4
2. Actuarial Gain/(Loss) on Plan Assets 7.4 0.9
3. Actual return on Plan Assets 20.5 11.3
F. Movement in net liability recognised in the Balance Sheet
1. Opening Net Liability/(Asset) (10.7) —
2. Expenses 20.1 30.5
3. Contribution (6.5) (41.2)
Closing Net Liability/(Asset) 2.9 (10.7)
Rs. Mio.
Leave (Unfunded)
2008-09
Leave(Unfunded)
2007-08
A. Expense recognized in the Profit & Loss Account for the year ended 31st March 2009
1. Current Service Cost 2.8 2.5
2. Interest 6.9 4.8
3. Expected Return on Plan Assets — —
4. Actuarial (Gain)/Loss 3.6 25.2
5. Past service cost — —
6. Total Expense 13.3 32.5
Rs. Mio.

94 Annual Report 2008-2009
Leave (Unfunded)
2008-09
Leave(Unfunded)
2007-08
B. Net Asset/(Liability) recognized in the Balance Sheet as at 31st March
1. Present Value of Defined Benefit Obligation as at 31st March
98.3 93.3
2. Fair Value of Plan assets as at 31st March — —
3. Funded Status [Surplus/(Deficit)] (98.3) (93.3)
4. Net Asset/(Liability) as at 31st March (98.3) (93.3)
C. Change in obligation during the year ended 31st March
1. Present value of the defined benefit obligation at the beginning of the year
93.3 66.2
2. Current Service Cost 2.8 2.5
3. Interest Cost 6.9 4.8
4. Actuarial (Gain)/Loss 3.6 25.2
5. Benefits Paid (8.3) (5.4)
6. Present value of the defined benefit obligation at the end of the year
98.3 93.3
D. Change in fair value of assets during the year ended 31st March
1. Fair Value of Plan assets at the beginning of the year — —
2. Expected Return on plan assets — —
3. Contributions by the Employer 8.3 5.4
4. Actual Benefits Paid (8.3) (5.4)
5. Actuarial Gain/(Loss) on Plan Assets — —
6. Fair Value of Plan assets at the end of the year — —
Total Actuarial Gain/(Loss) to be recognised (3.6) (25.2)
E. Actual Return on Plan Assets
1. Expected Return on plan assets — —
2. Actuarial Gain/(Loss) on Plan Assets — —
3. Actual return on Plan Assets — —
F. Movement in net liability recognised in the Balance Sheet
1. Opening Net Liability/(Asset) 93.3 66.2
2. Expenses 13.3 32.5
3. Contribution (8.3) (5.4)
Closing Net Liability/(Asset) 98.3 93.3
Rs. Mio.
Long Service Awards
(Unfunded)2008-09
Long Service Awards
(Unfunded) 2007-08
A. Expense recognized in the Profit & Loss Account for the year ended 31st March 2009
1. Current Service Cost 0.5 0.6
2. Interest 0.9 0.9
3. Expected Return on Plan Assets — —
4. Actuarial (Gain)/Loss 1.1 1.5
5. Past service cost — 12.9
6. Total Expense 2.5 15.9
Rs. Mio.

Consolidated Financial Statements 95
Long Service Awards
(Unfunded)2008-09
Long Service Awards
(Unfunded) 2007-08
B. Net Asset/(Liability) recognized in the Balance Sheet as at 31st March
1. Present Value of Defined Benefit Obligation as at 31st March
17.5 15.0
2. Fair Value of Plan assets as at 31st March — —
3. Funded Status [Surplus/(Deficit)] (17.5) (15.0)
4. Net Asset/(Liability) as at 31st March (17.5) (15.0)
C. Change in obligation during the year ended 31st March
1. Present value of the defined benefit obligation at the beginning of the year
15.0 12.9
2. Current Service Cost 0.5 0.6
3. Interest Cost 0.9 0.9
4. Actuarial (Gain)/Loss 1.1 1.5
5. Benefits Paid — (0.9)
6. Present value of the defined benefit obligation at the end of the year
17.5 15.0
D. Change in fair value of assets during the year ended 31st March
1. Fair Value of Plan assets at the beginning of the year — —
2. Expected Return on plan assets — —
3. Contributions by the Employer — 0.9
4. Actual Benefits Paid — (0.9)
5. Actuarial Gain/(Loss) on Plan Assets — —
6. Fair Value of Plan assets at the end of the year — —
Total Actuarial Gain/(Loss) to be recognised (1.1) (1.5)
E. Actual Return on Plan Assets
1. Expected Return on plan assets — —
2. Actuarial Gain/(Loss) on Plan Assets — —
3. Actual return on Plan Assets — —
F. Movement in net liability recognised in the Balance Sheet
1. Opening Net Liability/(Asset) 15.0 12.4
2. Expenses 2.5 3.5
3. Contribution — (0.9)
Closing Net Liability/(Asset) 17.5 15.0
The plan assets under the Gratuity scheme are deposited under approved securities. The major categories of plan assets as a percentage of total plan assets are provided below:
2008-09 2007-08GOI Securities 27% 42%State Government Securities 15% 15%PSU Bonds 58% 39%Private Sector Bonds — 4%Total 100% 100%
The assumptions used for actuarial valuation as at 31st March 2009 are as follows:
2008-09 2007-08Expected rate of return on plan assets 7.7% p.a. 7.5% p.a.Discount Rate 7.7% p.a. 7.5% p.a.Expected salary increase rate 6% – 8% p.a. 6% – 8% p.a.In-service mortality rates LIC 1994-96 ultimate table LIC 1994-96 ultimate table
Rs. Mio.

96 Annual Report 2008-2009
The expected rate of return on assets is based on the expectation of the average long term rate of return on investment of the fund, during the estimated term of obligation.
The obligations are measured at the present value of estimated future cash flows by using a discount rate that is determined with reference to the market yields at the Balance Sheet date on Government Bonds which is consistent with the estimated terms of the obligation.
The estimate of future salary increase, considered in the actuarial valuation, takes account of inflation, security, promotion and other relevant factors such as supply and demand in the employment market.
The Guidance Note on implementing AS 15, Employee Benefits (revised 2005) issued by the Accounting Standards Board (ASB) states that provident funds set up by employers, which requires interest shortfall to be met by the employer, needs to be treated as defined benefit plan. Pending the issuance of the Guidance Note from Actuarial Society of India, the required information can not be exhibited.
9. Managerial Remuneration under Section 198 of the Companies Act, 1956, (excluding provision for contribution to Gratuity Fund, Group Insurance and Long Service Awards) is Rs. 41.2 Mio. (Previous Year Rs. 35.7 Mio.).
Rs. Mio.
2008-09 2007-08
Salaries 30.2 25.8
Contribution to Provident and Superannuation Funds 4.5 3.7
Monetary Value of other perquisites 4.4 4.1
Commission to non-whole time directors 2.0 2.0
Directors’ Sitting Fees to non-whole time directors 0.1 0.1
Total 41.2 35.7
10. Segment Information for the year ended March 31, 2009:
(a) PRIMARY SEGMENT INFORMATION (by Business Segments)
The previous year's figures are given in light type below each item
Rs. Mio.
Agricultural Solution
Per- formance Products
Plastics Chemicals Others Un-allocated
Total
Segment Revenue 3,702.1 5,348.0 3,531.8 349.1 229.9 — 13,160.9 2,446.2 4,744.6 2,927.6 319.3 119.5 — 10,557.2
Less: Inter-segment revenue — — — — — — —
Sales/Income from operations 3,702.1 5,348.0 3,531.8 349.1 229.9 — 13,160.9 2,446.2 4,744.6 2,927.6 319.3 119.5 — 10,557.2
Segment Result 643.0 361.1 (108.0) 136.2 15.1 — 1,047.4 519.6 337.3 100.2 109.4 8.4 — 1,074.9
Interest Expenses 65.8 65.8 36.0 36.0
Interest Income 22.7 22.714.7 14.7
Other un-allocable expenditure 124.0 124.0net of un-allocable income 140.6 140.6
Profit Before Tax 880.3 913.0
Tax 394.2 394.2338.4 338.4
Profit After Tax 486.1 574.6

Consolidated Financial Statements 97
Rs. Mio.
Agricultural Solution
Per- formance Products
Plastics Chemicals Others Un-allocated
Total
OTHER INFORMATION
Segment Assets 1,614.4 3,062.4 1,533.2 97.3 5.0 449.2 6,761.5 770.0 3,158.0 1,468.9 105.2 — 258.8 5,760.9
Segment Liabilities 1,181.4 907.6 552.2 31.4 — 457.5 3,130.1 664.3 672.4 506.5 29.0 — 512.5 2,384.7
Capital Expenditure 46.0 233.2 149.2 6.3 — — 434.7 23.5 182.1 118.4 6.2 — — 330.2
Depreciation 17.9 112.9 31.1 3.4 — — 165.3 19.1 103.9 21.6 2.7 — — 147.3
(b) SECONDARY SEGMENT INFORMATION (by Geographic Segments)
Rs. Mio.
Domestic Exports Total
Revenues 11,799.0 1,361.9 13,160.99,540.3 1,016.9 10,557.2
Total Assets 6,681.0 80.5 6,761.55,636.3 124.6 5,760.9
Capital Expenditure 434.7 — 434.7330.2 — 330.2
Notes on Segment Information:
1. Segments have been identified in accordance with the Accounting Standard on Segment Reporting (AS-17). Business Segments have been considered as primary segments.
2. Details of type of products included in each segment —
— Agricultural Solution – Agrochemicals like pesticides and herbicides.
— Performance Products – Tanning agents, Leather Chemicals, Textile Chemicals, Dispersion Chemicals, Speciality Chemicals and high-value fine chemicals for the food, pharmaceuticals, animal feed and cosmetics industries.
— Plastics – Expandable Polystyrene (EPS), engineering plastics and polyurethane business.
— Chemicals – Chemicals includes inorganic chemicals, intermediates and petrochemicals.
— Others – Indent Commission income not relating to any of the above segments, Technical and Service charges.
3. Un-allocable Corporate Assets include Investment, Net Deferred Tax Assets and other un-allocated assets.
4. Un-allocable Corporate Liabilities include Proposed dividend and other un-allocable liabilities.
11. Related Party Disclosures:
(a) Parties where control exists
BASF SE Holding Company (holds 71.8% of the equity share capital as on March 31, 2009)
(b) Other related parties with whom transactions have taken place during the year
Fellow Subsidiaries
BASF (China) Company Ltd. BASF JCIC Neopentylglycol Co. Ltd.
BASF (Malaysia) Sdn. Bhd. BASF Pakistan (Private) Ltd.
BASF (Thai) Ltd. BASF Petronas Chemicals Sdn. Bhd.
BASF Agro B.V. Arnhem (NL) BASF Philippines, Inc.
BASF Agri Production SAS BASF Polyurethanes (China) Co. Ltd.
BASF Asia Pacific Service Centre Sdn. Bhd. BASF Polyurethanes (Malaysia) Sdn. Bhd.
BASF Auxiliary Chemicals Co. Ltd. BASF Polyurethanes (Taiwan) Co. Ltd.
BASF Bangladesh Ltd. BASF S.A.
BASF Chemicals and Polymers Pakistan (Pvt) Ltd. BASF South East Asia Pte. Ltd.

98 Annual Report 2008-2009
BASF Chemtrade Gesellschaft MBH BASF Styrenics Private Ltd.*
BASF China Limited BASF Tuerk Kimya Sanayi Ve Ticaret Ltd. Sti.
BASF Coatings (India) Private Ltd. BASF-Finlay (Private) Limited
BASF Company Ltd. BTC Speciality Chemical Distribution Gmbh
BASF Construction Chemicals (India) Private Ltd. Elastogran GmbH
BASF Corporation Elastogran Italia Spa (Elit)
BASF Curtex S.A. BASF IT Services Holding GmbH
BASF East Asia Regional Headquarters Limited P.T. BASF Indonesia
BASF Espanola, S.L. Shanghai BASF Polyurethane Company
BASF Japan Ltd. (BJL) BASF Polyurethane Licencing GMBH
BASF Polyurethane Specialities BTC Speciality Chemicals
BASF Construction Chemicals, Dubai BASF Italia SPA
BASF Kanoo Gulf FZE K+S Kali GmbH
BASF Antwerpen N. V. BASF Agrochemical Products B.V.
BASF Australia Ltd. BASF South Africa (Pty.) Ltd.
BASF Catalysts India Pvt. Ltd. BASF Asia-Pacific (India) Pvt. Ltd.
BASF Polyurethane Specialties (China) Company Ltd. BASF Fine Chemicals Switzerland S.A.
BASF Singapore Pte. Ltd.
* Group company 100% held by BASF Styrenics Holding Company, Mauritius which is 100% held by BASF SE.
(c) Key Management Personnel
Chairman & Managing Director
Mr. Prasad Chandran
Whole – Time Directors
Mr. S. Ramnath (Alternate to Mr. Hermann Althoff)
Mr. R. Y. Vaidya (Alternate to Dr. Rainer Diercks)
Mr. Deepak Thuse (Alternate to Dr. Tilman Krauch)
(d) Details of transactions for the year ended March 31, 2009:
Rs. Mio.
Nature of Transactions Holding Company/ Subsidiary
Fellow Subsidiaries
Total
2008-09 2007-08 2008-09 2007-08 2008-09 2007-08
Sale of Goods
BASF SE 21.0 19.0 — — 21.0 19.0
BASF South East Asia Pte. Ltd. — — 207.7 113.4 207.7 113.4
BASF Coatings (India) Private Ltd. — — 127.3 145.4 127.3 145.4
BASF Construction Chemicals (India) Private Ltd. — — 300.2 152.2 300.2 152.2
BASF China Limited — — 1.3 1.7 1.3 1.7
BASF Company Ltd. — — 0.2 2.1 0.2 2.1
BASF Singapore Pte. Ltd. — — 6.1 — 6.1 —
Others — — 66.9 44.0 66.9 44.0
Sub-Total 21.0 19.0 709.7 458.8 730.7 477.8
Services Rendered
BASF SE 197.7 125.7 — — 197.7 125.7
BASF South East Asia Pte. Ltd. — — 409.4 284.6 409.4 284.6
BASF Petronas Chemicals Sdn. Bhd. — — 71.2 94.1 71.2 94.1
BASF Company Limited — — 76.8 59.2 76.8 59.2
Others — — 144.2 32.6 144.2 32.6
Sub-Total 197.7 125.7 701.6 470.5 899.3 596.2

Consolidated Financial Statements 99
Rs. Mio.
Nature of Transactions Holding Company/ Subsidiary
Fellow Subsidiaries
Total
2008-09 2007-08 2008-09 2007-08 2008-09 2007-08
Purchase of Goods/Materials
BASF SE 276.3 233.6 — — 276.3 233.6
BASF South East Asia Pte. Ltd. — — 1814.5 1,770.9 1814.5 1,770.9
BASF Company Ltd. — — 740.9 458.9 740.9 458.9
BASF Agro B.V., Arnhem (NL) — — 670.7 317.3 670.7 317.3
BASF Agrochemical Products B.V. — — 1180.0 269.3 1180.0 269.3
Elastogran Italia Spa (Elit) — — 123.1 77.4 123.1 77.4
Others — — 606.7 628.8 606.7 628.8
Sub-Total 276.3 233.6 5135.9 3,522.6 5412.2 3,756.2
Services Received
BASF SE 61.1 48.2 — — 61.1 48.2BASF South East Asia Pte. Ltd. — — 160.1 80.7 160.1 80.7BASF Asia Pacific Service Centre Sdn. Bhd. — — 73.8 38.8 73.8 38.8BASF East Asia Regional Head Quarters Ltd. — — 0.8 — 0.8 —Elastogran Italia Spa (Elit) — — 0.7 0.6 0.7 0.6Others — — 12.0 12.9 12.0 12.9
Sub-Total 61.1 48.2 247.4 133.0 308.5 181.2
Purchase of Assets
BASF SE 7.0 1.0 — — 7.0 1.0BASF South East Asia Pte. Ltd. — — 34.6 — 34.6 —Others — — 0.4 0.1 0.4 0.1
Sub-Total 7.0 1.0 35.0 0.1 42.0 1.1
Interest Expense on Loans
BASF SE 1.0 2.1 — — 1.0 2.1
Royalty and Technical Fees
BASF SE 34.6 26.8 — — 34.6 26.8BASF Polyurethane Licencing GmbH — — 14.4 8.5 14.4 8.5
Sub-Total 34.6 26.8 14.4 8.5 49.0 35.3
Dividend
BASF SE 104.0 104.0 — — 104.0 104.0
Repayment of Loan
BASF SE 32.0 — — — 32.0 —
Outstanding
Loan from BASF SE — 32.0 — — — 32.0
Outstanding Receivables
BASF SE — 23.0 — — — 23.0BASF Construction Chemicals Private Ltd. — — 77.2 67.4 77.2 67.4BASF Coatings (India) Private Ltd. — — 43.5 49.4 43.5 49.4BASF Polyurethanes (China) Co. Ltd. — — 7.0 3.8 7.0 3.8BASF China Limited — — 0.9 0.6 0.9 0.6Others — — 34.8 37.6 34.8 37.6
Sub-Total — 23.0 163.4 158.8 163.4 181.8
Outstanding Payables
BASF SE 2.3 21.2 — — 2.3 21.2BASF Agrochemical Products B.V. — — 533.2 — 533.2 —BASF Company Limited — — 64.2 87.3 64.2 87.3BASF Agro B.V., Arnhem (NL) — — 219.4 34.6 219.4 34.6BASF South East Asia Pte Ltd. — — 193.5 263.5 193.5 263.5Elastogran Italia Spa (Elite) — — 29.7 12.1 29.7 12.1Others — — 125.3 232.8 125.3 232.8
Sub-Total 2.3 21.2 1,165.3 630.3 1,167.6 651.5

100 Annual Report 2008-2009
(e) Details of transactions of Key Management Personnel:
Rs. Mio.
Nature of Transactions Key ManagementPersonnel
2008-09 2007-08
Interest Income on Loans 0.1 0.1Remuneration 39.1 33.6Outstanding :Receivable 0.7 0.8
Details of remuneration to Directors are given in Note 9.
Amounts due from directors and interest recovered thereon have been included under Schedule 10 of the Consolidated Balance Sheet and Schedule 14 of the Consolidated Profit and Loss Account under Interest – Others respectively.
12. The Previous Year's figures have been regrouped and rearranged wherever necessary.
Signatures to Schedules 1 to 20
Prasad Chandran K. R. CoorlawalaChairman & Managing Director R. R. Nair
R. Y. VaidyaM. R. Iyer S. RamnathCompany Secretary R. A. Shah
Pradip P. ShahDeepak ThuseDirectors
Mumbai, 16th April 2009
We C.A.R.E. about Safety. Dr. Tilman Krauch and Mr. Prasad Chandran, along with the Safety Management team, launch the C.A.R.E. initiative, which encourages behavioral safety at all times. Saarathi, our Safety mascot, was born on that day!

Annual Report 2008-2009 BASF India Limited
2003-04 2004-05 2005-06 2006-07 2007-08 2008-09
Sales 6533 7402 7716 8750 10306 12381
Profit before tax 513 601 706 781 930 1080
Profit after tax 341 380 454 501 594 686
Total assets 4046 4138 3986 4594 5246 6509
Borrowings 670 100 13 5 — —
Shareholders’ equity 2318 2535 2764 3034 3397 3852
Depreciation 212 244 221 109 136 152
Capital expenditure 47 76 143 451 309 416
Exports 511 564 252 320 373 571
R & D cost 16 20 37 48 76 96
Personnel cost (Total) 456 486 572 684 817 887
Dividend amount 169 169 197 197 197 197
Dividend in % 60 60 70 70 70 70
Number of employees 917 833 817 801 836 858
Number of shareholders 32831 29493 29684 33042 29631 25606
BASF India Limited Financial Highlights – At a glance
Rs. in Million
Message from the Chairman & Managing Director
Dear Shareholders,
The global financial crisis and its implications on the developed
world are still unravelling. However, India, with its robust
domestic-oriented economy, coupled with well-timed fiscal
and monetary measures taken by the government, is already
rebounding. At BASF, although sales and profitability of some
of our segments got affected during 2008-2009, our balanced
portfolio helped us remain resilient. With a strong business
foundation and one of the best teams on board, we have been
operating with excellent cost efficiency and budget discipline.
Your company derived opportunities from the current situation
and the sales and profit have grown by 20% and 16%
respectively.
Our focus on nurturing Partnerships and Excellence has won
us accolades across platforms. Being rated as the World’s
Most Admired Chemical Company by the Fortune Magazine
has not only made us all proud but also further motivated us
to raise our standards of performance. BASF Kids’ Lab aboard
the Science Express is now part of the Limca Book of Records
2009 for hosting a mobile laboratory, where 15,000 students
performed live experiments.
Employee engagement has been taken a notch higher, by
launching the C.A.R.E. initiative, which emphasized the
importance of Behavioral Safety at all times.
Together, we are confident of setting higher standards for
ourselves and the Chemical industry.
Thank you for your trust and confidence and I look forward to
your continued interest and support.
Warm Wishes,
Prasad Chandran
BASF Kids’ Lab aboard Science Express enters the Limca Book of Records 2009.
Cover 2&3.indd, Spread 2 of 2 - Pages (2, 3) 6/27/2007 12:32 PM


![2008-2009 Weed Update · - Applied Weed Science Herbicide Update Kixor [saflufenacil or BAS800] – BASF: [Not labeled in Indiana] is a new herbicide from BASF that will be labeled](https://img.dokumen.tips/doc/110x75/5f02259e7e708231d402cde0/2008-2009-weed-update-applied-weed-science-herbicide-update-kixor-saflufenacil.jpg)