Embed Size (px)
Citation preview

1
Profiling of Inlet Ports of Z-Engine Final report
Dr. Vladimir Zenkin
Dr. Andrey Kuleshov
AUMET OY - 2012
2
1. Content
1. Content ....................................................................................................................... 2
2. Specification .............................................................................................................. 3
3. Boundary conditions .................................................................................................. 4
4. Profiling of axisymmetric part of the port ................................................................. 5
5. Profiling of intake port in the cylinder head............................................................18
6. Discharge coefficient for thermodynamic engine simulation .................................30
7. Thermodynamic z-engine simulation with obtained intake port discharge
coefficient ................................................................................................................32
8. Conclusion ...............................................................................................................36
9. References................................................................................................................38
Appendix 37

3
2. Specification A target of the research is an optimisation of the inside shape of the z-engine in-
take port in order to obtain a maximal mass flow at 3600 rpm. Simulations was carried
out with thermodynamic code DIESEL-RK [1] and CFD code NSF-3 developed in
Moscow Bauman State Technical University. The NSF code uses truncated cells to
form a sophisticated shape of a spatial domain. This technique allows usage cube cells
in the space being not contacted with walls, and near-wall cells being the cubes without
cut off parts, fig. 1. The computing procedure is very economical because:
- implicit algorithm is quite stable: one make one iteration per time step with
Courant criterion about Co ≈ 0.3÷0.4 [2].
- the same algorithm is used for both kinds of cells: full and truncated.
Fig. 1. The cube cells without cut off parts, being used for description of
sophisticated shape of a spatial domain.
Before simulation the NSF code was verified by comparison of the results with
results obtained with Star-CD and CFX codes as well with experimental data.
Engine and intake valve data:
• 2 intake valves per cylinder;
• cylinder bore: 72 mm,
• piston stroke : 70 mm,
• rated (nominal) valve lift where mass flow is maximal: Lv = 4 mm;
• face diameter – 25-28 mm,
• face angle – 30 deg;
• maximum valve head diameter : Dv= 28 mm.

4
3. Boundary conditions Maximum mass flow through intake ports corresponds to the point 301 deg of CA
(fig. 2).
Intake Manifold Pressure: p_int = 16.6 bar
Intake Manifold Temperature: T_int = 310 K
Cylinder Pressure: p_cyl = 9.9 bar
These data were obtained from previous thermodynamic z-engine simulation and
optimization at maximum power point. The simulation with DIESEL-RK [1] has shown
the insufficient fresh charge in the cylinder at high capacity point. So, this point pa-
rameters were selected as boundary conditions for current research. During all CFD
simulations there static flow conditions was modelled.
Fig 2. Intake process parameters simulated with DIESEL-RK

5
4. Profiling of axisymmetric part of the port As a first step of port shape optimization there was selected an optimization of
axisymmetric part of the port in the region of intake valve seat. The independent opti-
mization of this element of port allows bound a number of cells in the mesh and use a
quite fine mesh. Last allows perform simulations faster and with good accuracy. The
sketch of axisymmetric part of the port and 3D model of this part are presented in fig. 3,
4. In the fig. 3 there are shown the main dimensions being optimized with parametrical
research technique. These dimensions are:
- Throat diameter, Dt;
- Minimum throat diameter position, ht;
- Confuser angle, αc;
- Radius Rv;
- Valve head diameter, Dv.
Fig. 3. Sketch of axisymmetric part of the port
Fig. 4. 3D-model of the computational domain
At the simulation of the flow in the axisymmetrical part of the port there was used
mesh with ~250 000 cells. Mesh in the cylinder head port had about 350 000 cells. In
both researches the turbulence was modelled by usage a turbulence viscosity μT = 0.01
Pa·s.
6
At the discharge coefficient estimations there was used a mesh with ~ 1000 000
cells and k-ε model of turbulence.
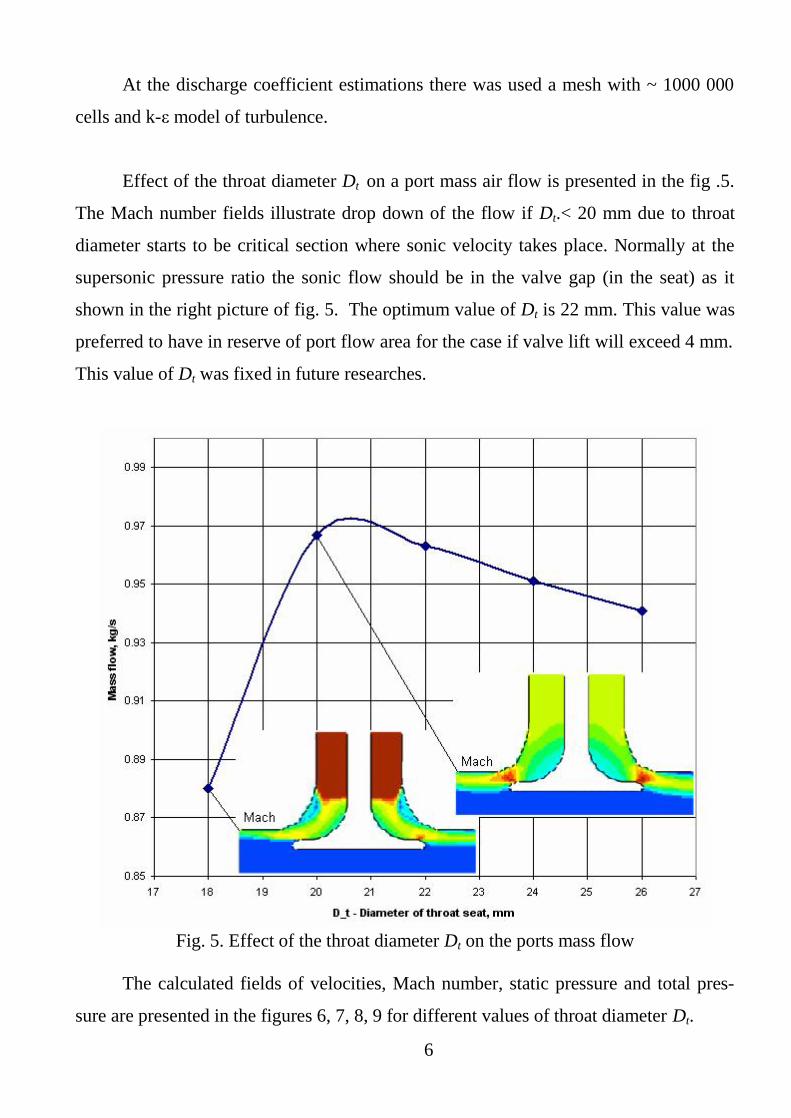
Effect of the throat diameter Dt on a port mass air flow is presented in the fig .5.
The Mach number fields illustrate drop down of the flow if Dt.< 20 mm due to throat
diameter starts to be critical section where sonic velocity takes place. Normally at the
supersonic pressure ratio the sonic flow should be in the valve gap (in the seat) as it
shown in the right picture of fig. 5. The optimum value of Dt is 22 mm. This value was
preferred to have in reserve of port flow area for the case if valve lift will exceed 4 mm.
This value of Dt was fixed in future researches.
Fig. 5. Effect of the throat diameter Dt on the ports mass flow
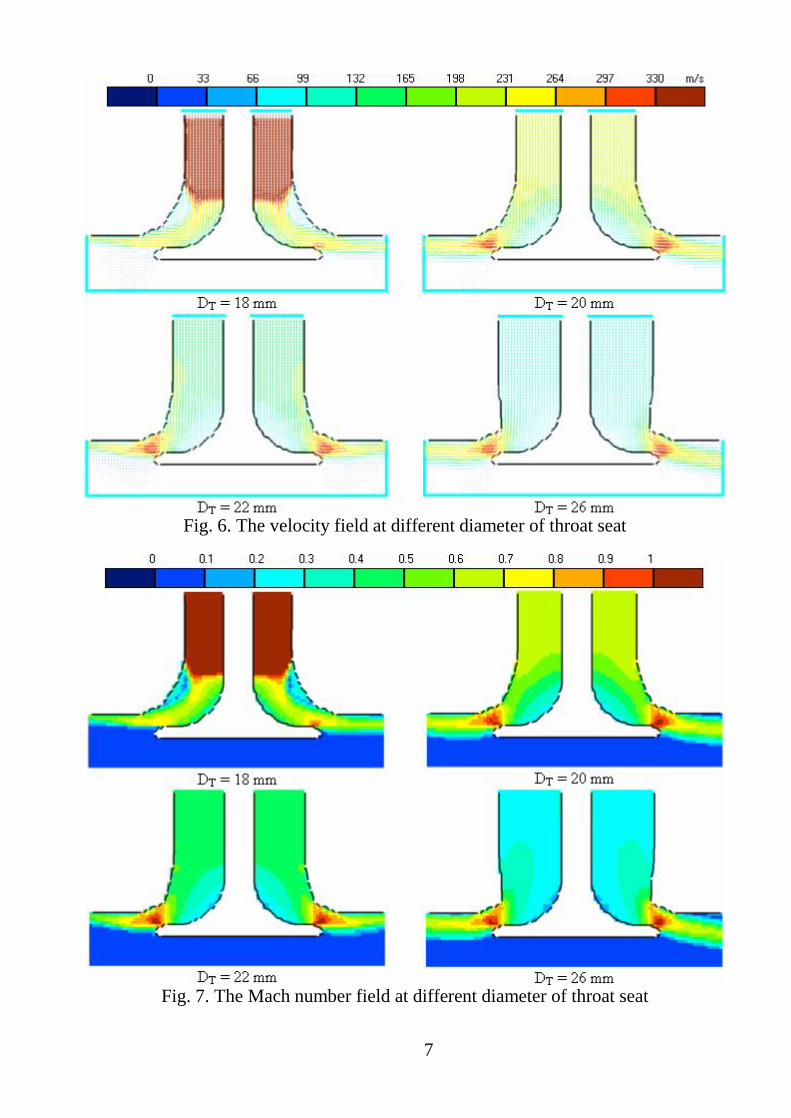
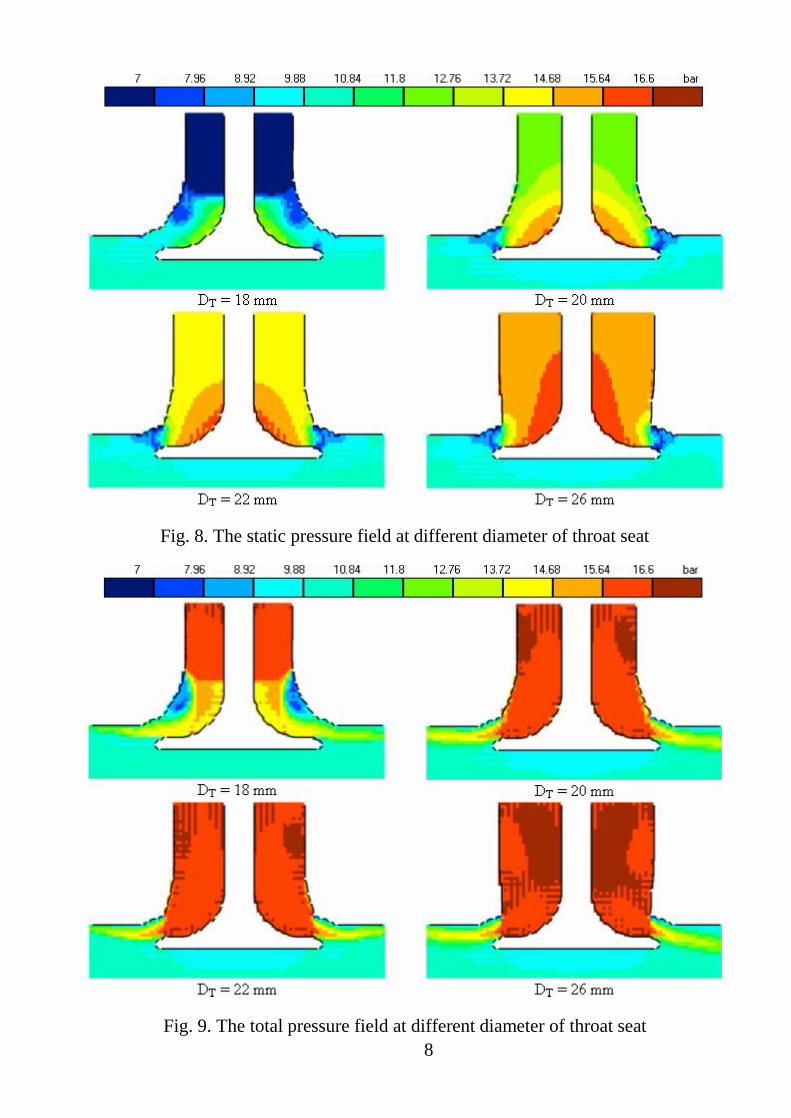
The calculated fields of velocities, Mach number, static pressure and total pres-
sure are presented in the figures 6, 7, 8, 9 for different values of throat diameter Dt.
7
Fig. 6. The velocity field at different diameter of throat seat
Fig. 7. The Mach number field at different diameter of throat seat
8
Fig. 8. The static pressure field at different diameter of throat seat
Fig. 9. The total pressure field at different diameter of throat seat

9
Effect of small valve radius is presented in the fig. 10. This effect may be ex-
plained by improvement of the flow condition in the region of valve seat having 300 an-
gle of inclination. However small radius decreases strength and durability of the valve,
so, this parameters should be estimated and selected on the base of strength simulation.
Here the was accepted Rv = 6 mm.
Fig. 10. Effect of valve radius Rv on the mass flow of the intake valves.
The calculated fields of velocities, Mach number, static pressure and total pres-
sure are presented in the figures 11, 12, 13, 14 for different values of radius Rv.

10
Fig. 11. The velocity field at different fillet radius of the valve
Fig. 12. The Mach number field at different fillet radius of the valve

11
Fig. 13. The static pressure field at different fillet radius of the valve
Fig. 14. The total pressure field at different fillet radius of the valve

12
The effect of port throat position ht on air mass flow is not large, fig. 15. If throat
is too close to a seat there is a tearing off zone of flow appeared due to a small radius
between throat and seat surface (fig. 16,17, ht = 3 mm). If throat is too far from the seat
it decrease the radius of port turn and result in another tearing off zone due to sharp
bend of the flow before axisymmetric part of the port. As a result of the research the ht =
5 mm was accepted.
Fig. 15. Dependence of the mass flow on the position of throat minimum diameter
The calculated fields of velocities, Mach number, static pressure and total pres-
sure are presented in the figures 16, 17, 18, 19 for different values of port throat position
ht
13
Fig. 16. The velocity field at different position of throat minimum diameter ht
Fig. 17. The Mach number field at different position of throat minimum diameter ht

14
Fig. 18. The static pressure field at different position of throat minimum diameter ht
Fig. 19. The total pressure field at different position of throat minimum diameter ht
15
The effect of Confuser angle αc on air mass flow is very small, fig. 20. It is well
known the confuser flow has not hydraulic losses.
Fig. 20. Dependence of the mass flow on the confuser angle αc
The calculated fields of velocities, Mach number, static pressure and total pressure are
presented in the figures 21, 22, 23, 24 for different values of the confuser angle αc
16
Fig. 21. The velocity field at different confuser angle αc
Fig. 22. The Mach number field at different confuser angleαc
Fig. 23. The static pressure field at different confuser angleαc
17
Fig. 24. The total pressure field at different confuser angleαc
Conclusion: in the result of presented research the following design of axisym-metric part of the port was accepted (fig. 25) ant fixed for future steps of the research.
Fig. 25. Sketch of the recommended axisymmetric part of the port

18
5. Profiling of intake port in the cylinder head
The port design parameters being investigated at the current stage of the research are
presented in the fig. 26.
There was optimized:
- Shape of port inlet (oval or circular).
- Position of the upper edge of the port roof, hmax (from 55 up to 64 mm).
- Cross section area of the port inlet AINL (from 8 up to 18 cm2).
- Valve head diameter Dv (from 25 up to 28 mm).
- Distance from cylinder axis to the plane of the intake valves axis XV (from 7
up to 13 mm)
Fig. 26. Sketch of intake port in the cylinder head
A comparison of calculated mass air flow of ports having oval cross section of
inlet (fig. 27) and circular cross section of inlet (fig. 27) are the same. Therefore, for
further consideration has been selected port with a circular cross section, as the simpler
in construction.
The calculated fields of velocities, Mach number, static pressure and total pres-
sure are presented in the figure 29 for different variants of intake port inlet design.

19
Fig. 27. Port with oval inlet
Fig. 28. Port with circular inlet

20
Oval inlet (fig. 27) Circular inlet (fig. 28)
Stat
ic p
ress
ure
a) b)
Tota
l pre
ssur
e
c) d)
Vel
ocity
e) f)
Mac
h nu
mbe
r
g) h)
Fig. 29. Gas flow parameters for Oval and Circular port inlets
21
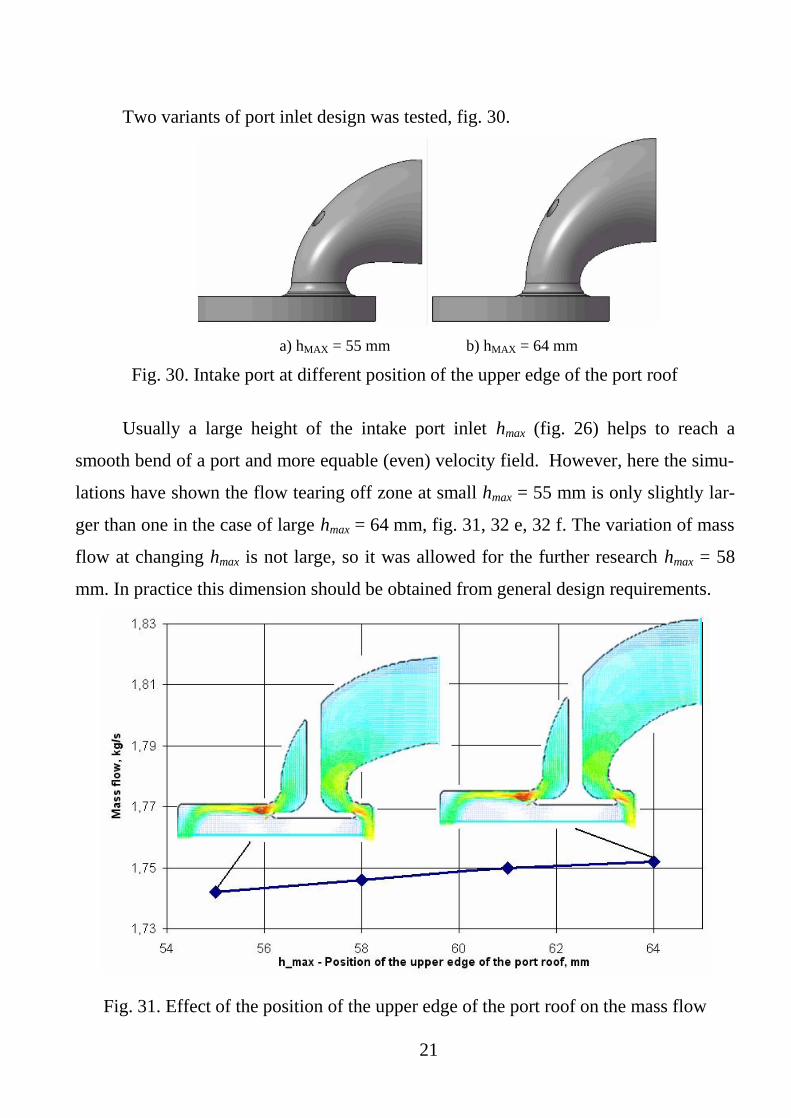
Two variants of port inlet design was tested, fig. 30.
a) hMAX = 55 mm b) hMAX = 64 mm
Fig. 30. Intake port at different position of the upper edge of the port roof
Usually a large height of the intake port inlet hmax (fig. 26) helps to reach a
smooth bend of a port and more equable (even) velocity field. However, here the simu-
lations have shown the flow tearing off zone at small hmax = 55 mm is only slightly lar-
ger than one in the case of large hmax = 64 mm, fig. 31, 32 e, 32 f. The variation of mass
flow at changing hmax is not large, so it was allowed for the further research hmax = 58
mm. In practice this dimension should be obtained from general design requirements.
Fig. 31. Effect of the position of the upper edge of the port roof on the mass flow

22
hMAX = 55 mm (fig. 31a) hMAX = 64 mm (fig. 31b)
Stat
ic p
ress
ure
a) b)
Tota
l pre
ssur
e
c) d)
Vel
ocity
e) f)
Mac
h nu
mbe
r
g) h) Fig. 32. Gas flow parameters at different position of the upper edge of the port roof

23
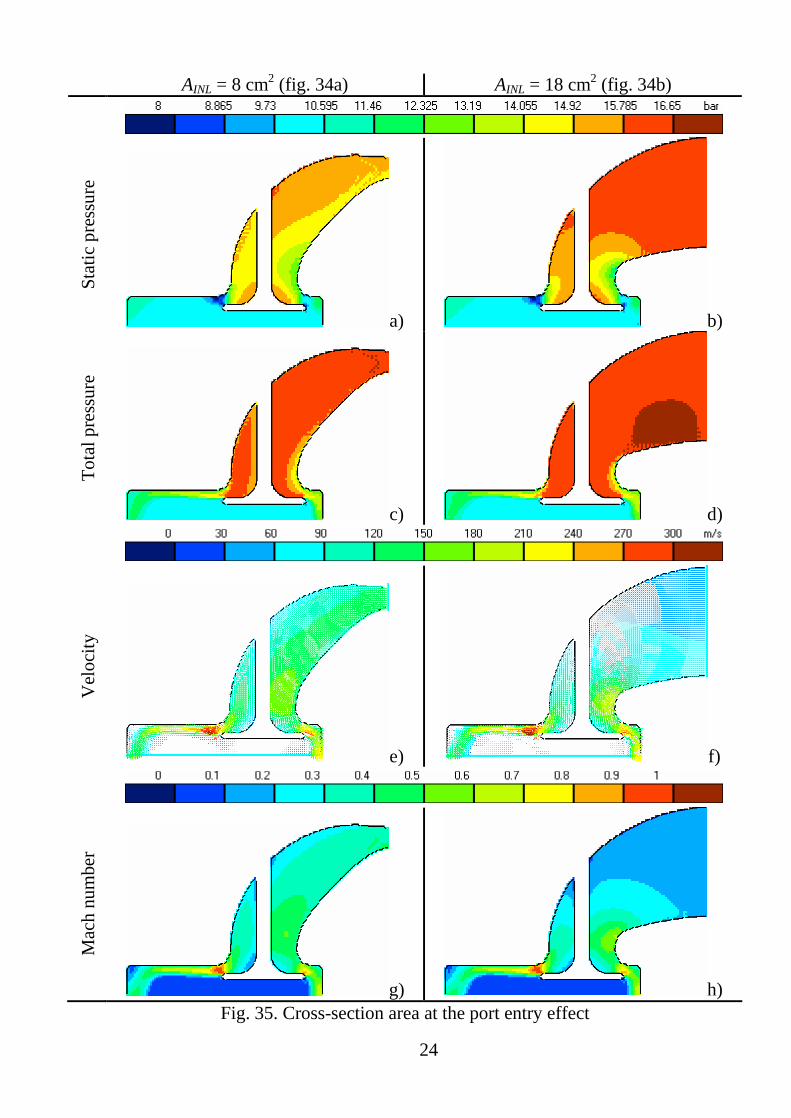
7 variants of inlet port area were considered, fig. 33. The larger the inlet area of
the port the larger air mass flow, fig. 34. However the value AINL=14 cm2 seems as op-
timal. The calculated fields of velocities, Mach number, static pressure and total pres-
sure are presented in the figure 35 for different variants of intake port inlet area.
a) AINL = 8 cm2
b) AINL = 18 cm2
Fig. 33. Intake ports with a different cross section area of the port inlet
Fig. 34. Effect of cross section area of the port inlet on the mass flow.
24
AINL = 8 cm2 (fig. 34a) AINL = 18 cm2 (fig. 34b)
Stat
ic p
ress
ure
a) b)
Tota
l pre
ssur
e
c) d)
Vel
ocity
e) f)
Mac
h nu
mbe
r
g) h) Fig. 35. Cross-section area at the port entry effect

25
A valve head diameter has a very strong effect on mass flow. But, a big valve
produces an irregular velocity field due to closely placed another valve or cylinder wall.
In the investigated diapason of valve head diameter variation the positive effect of large
flow area exceed negative effect of encumbering of flow area by neighbour valve and
cylinder wall, fig. 36. 3D domain is presented in the fig. 37. Flow parameters are shown
in fig.38. The Dv=28 mm was fixed as optimal solution due to account of exhaust valve.
Fig. 36. Dependence of the mass flow on the valve head diameter
a) DV = 25 mm b) DV = 28 mm Fig. 37. Intake port at different valve head diameter.

26
DV = 25 mm (fig. 37a) DV = 28 mm (fig. 37b)
Stat
ic p
ress
ure
a) b)
Tota
l pre
ssur
e
c) d)
Vel
ocity
e) f)
Mac
h nu
mbe
r
g) h)
Fig. 38. Gas flow parameters at different valve head diameter Dv.

27
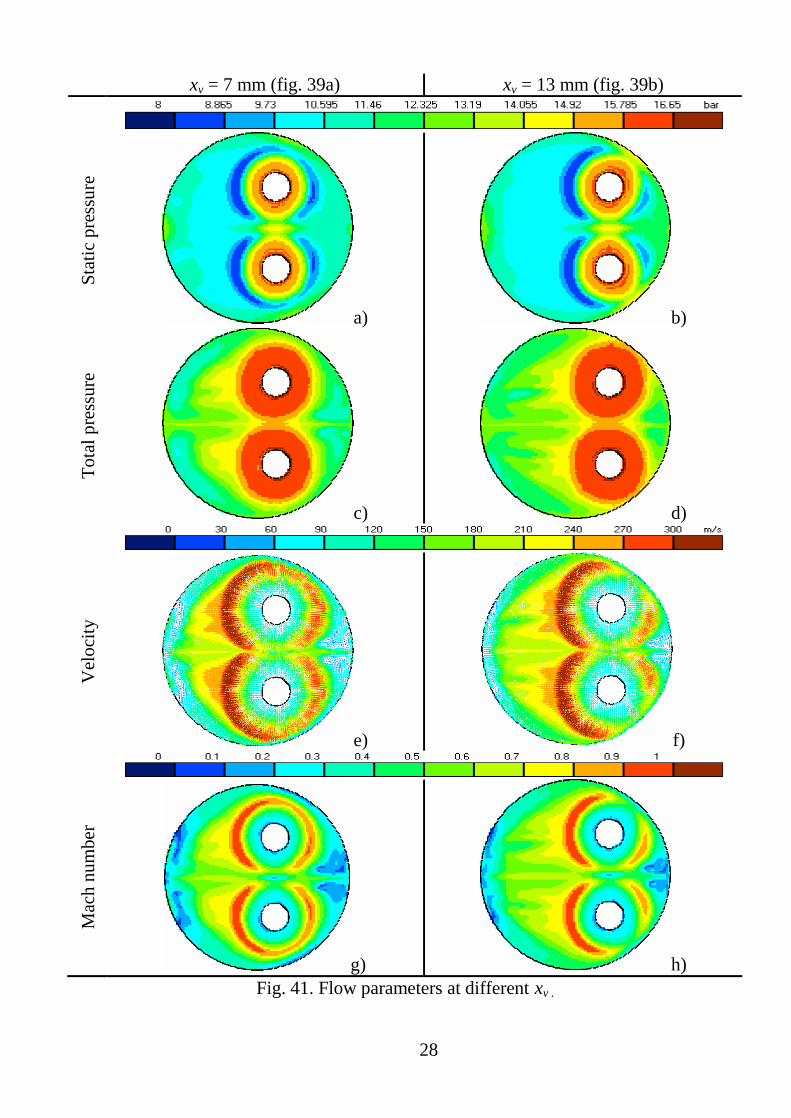
The distance from cylinder axis to the plane of the intake valves axis named as xv
was varied from 7 mm up to 13 mm, fig. 39. The xv has significant effect in mass flow,
fig. 40. The effect is caused by encumbering of flow area by neighbour cylinder wall.
The more distance from cylinder wall the larger air flow. The optimum value is xv = 10
mm (if it allows an exhaust ports design). Flow parameters for the cases of xv = 7 mm
and xv = 13 mm are shown in fig.41.
a) xv = 7 mm b) xv = 13 mm
Fig. 39. 3D Intake port domain at different distance from cylinder axis to the plane of the intake valves axis
Fig. 40. Effect of distance xv on the mass flow
28
xv = 7 mm (fig. 39a) xv = 13 mm (fig. 39b)
Stat
ic p
ress
ure
a) b)
Tota
l pre
ssur
e
c) d)
Vel
ocity
e) f)
Mac
h nu
mbe
r
g) h) Fig. 41. Flow parameters at different xv .

29
The configuration of the z-engine intake ports being obtained as a result of opti-
mization is presented in the figure 42.
Fig. 42. Sketch of the recommended intake port of the z-engine.
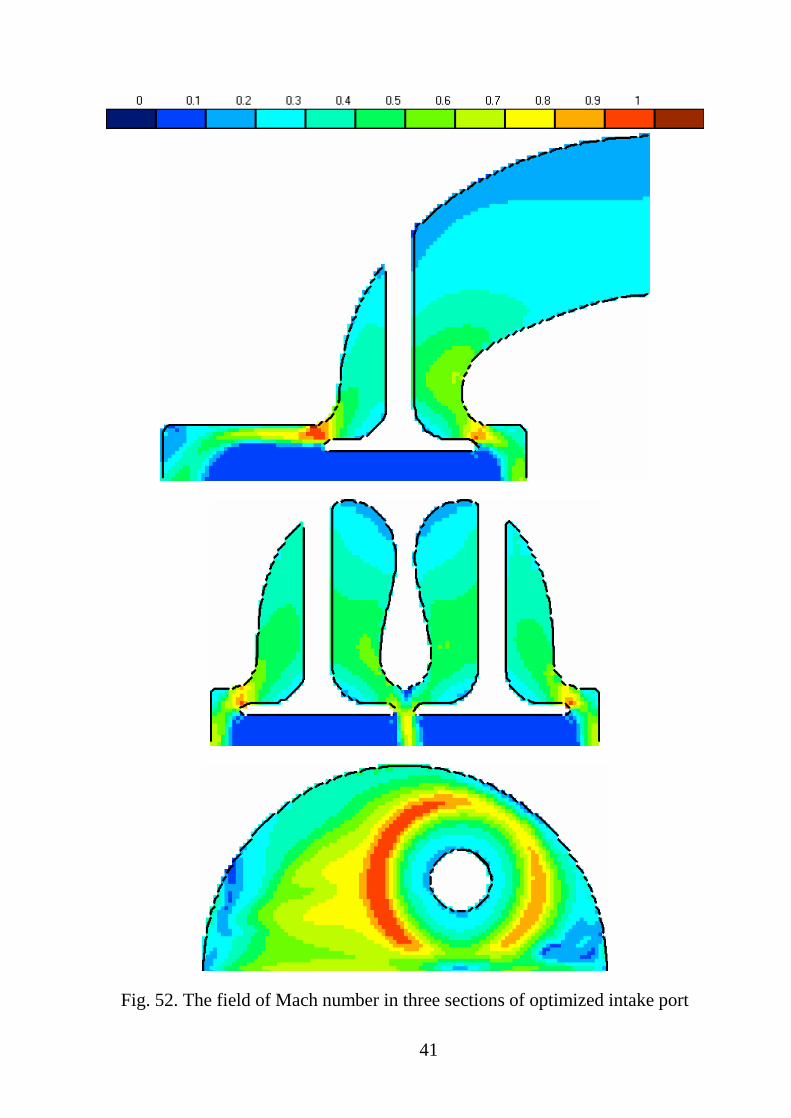
The air flow parameters corresponded with optimized port configuration are pre-
sented in APPENDIX in figures: 49, 50, 51, 52.

30
6. Discharge coefficient for thermodynamic engine simulation
After the intake port dimensions optimization there was calculated discharge co-
efficient Cd of the ports to be used in thermodynamic engine simulations and port timing
optimization being done with DIESEL-RK software. The well known expression for
port effective flow area calculation was used [3]:
A_int = nv π Dv Lv Cd; (1)
where: nv = 2 is number of intake valves per cylinder, Dv is a valve head diameter,
Lv=f(CA) is a current valve lift, Cd =f(Lv / Dv) is a discharge coefficient depending on
valve lift rated to Dv. On the another hand the effective flow area may be defined from
theoretical and real air mass flow mair, where theoretical mass flow is calculated from
Bernoulli equation and real mass flow is calculated with CFD:
−
−
=+γ
γγ
γγ
ρ
1
1
2
2
1
211 1
2
int_
pp
ppp
mA air ; (2)
where p1 and ρ1 are pressure and density of air before intake port, p2 is pressure in cyl-
inder, γ is adiabatic exponent. Discharge coefficient Cd was calculated for different
values of the valve lift in optimized intake port at few levels of pressure ratios:
- p1 =16.6 bar; p2=9.9 bar: to obtain actual Cd for specific z-engine conditions.
- p1 =1.1 bar; p2=1.0 bar: to obtain typical Cd function and verify CFD simula-
tion at typical conditions.
- p1 =16.6 bar; p2=15 bar at Lv / Dv=0.15: to check correctness of an assump-
tion about usability of typical Cd function at high intake pressure (~15 bar). If
usability will be confirmed the typical Cd function can be used.
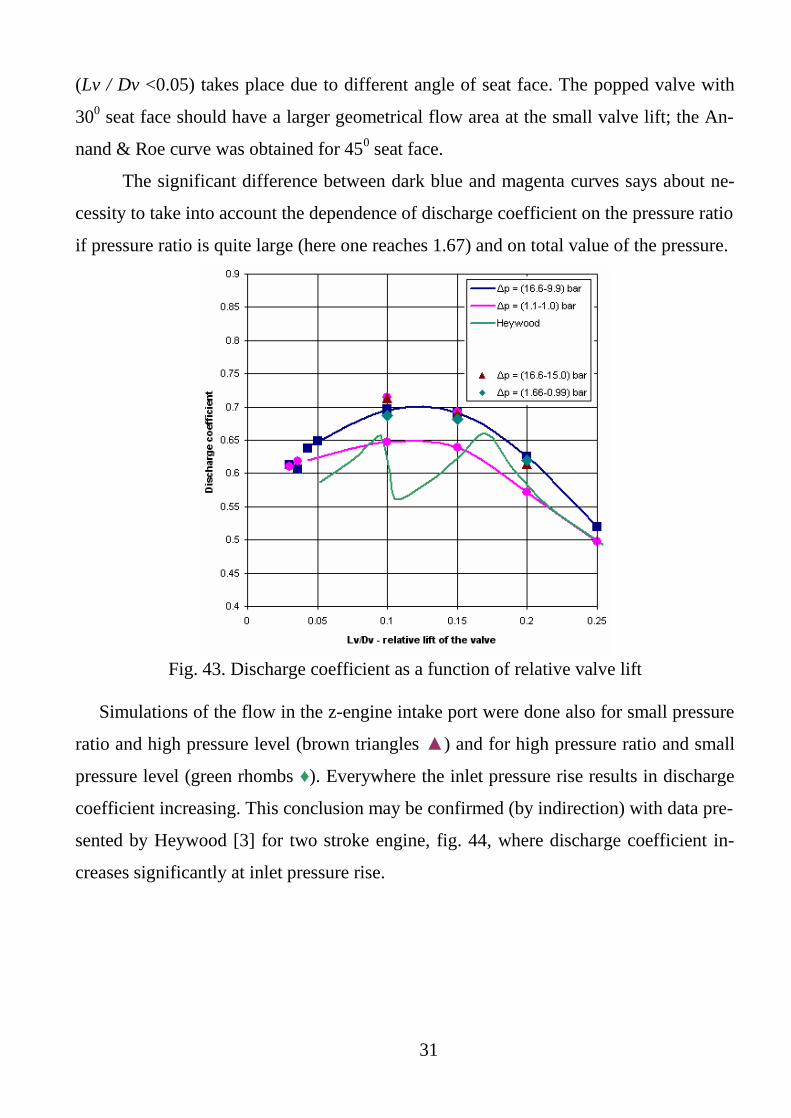
The typical Cd function [3, 4] is presented in fig. 43 by green curve, the Cd func-
tion obtained for the z-engine optimized inlet port with a small pressure ratio is shown
by magenta curve, the same Cd function but obtained for large pressure ration is plotted
by dark blue curve. An comparison of the curves shows quite well agreement of Annand
& Roe curve with Cd function calculated here. A difference in Cd at the small valve lift
31
(Lv / Dv <0.05) takes place due to different angle of seat face. The popped valve with
300 seat face should have a larger geometrical flow area at the small valve lift; the An-
nand & Roe curve was obtained for 450 seat face.
The significant difference between dark blue and magenta curves says about ne-
cessity to take into account the dependence of discharge coefficient on the pressure ratio
if pressure ratio is quite large (here one reaches 1.67) and on total value of the pressure.
Fig. 43. Discharge coefficient as a function of relative valve lift
Simulations of the flow in the z-engine intake port were done also for small pressure
ratio and high pressure level (brown triangles ▲) and for high pressure ratio and small
pressure level (green rhombs ♦). Everywhere the inlet pressure rise results in discharge
coefficient increasing. This conclusion may be confirmed (by indirection) with data pre-
sented by Heywood [3] for two stroke engine, fig. 44, where discharge coefficient in-
creases significantly at inlet pressure rise.

32
Fig. 44. Discharge coefficient as a function of port open fraction and pressure before
port.

33
7. Thermodynamic z-engine simulation with obtained intake port discharge coefficient
As it shown in the figure 43, the discharge coefficient Cd is larger at the large
pressure difference between intake and cylinder (blue curve) and at large pressure level
before and after a valve. This takes place at whole period of the z-engine intake valves
open. So the blue curve was used at the specification of effective flow area diagram.
There was used following expression for effective flow area:
( )
−=
dthst
dvv
CDD
CLDMINA 22
42
;2int_ π
π; (3)
where: Cd is discharge coefficient for valve curtain area (fig. 43); Dv = 2.8 cm is a valve
head diameter; Dt = 2.2 cm and Ds = 0.5 cm are throat diameter and steam diameter, Cdth
= 0.8 is discharge coefficient for throat area. The equation includes valve curtain area
part and port throat area part. The values of A_int corresponding with fixed ratios: Lv /
Dv = 0; 0.043; 0.1; 0.15; 0.02 are presented in the figure 45. Maximum effective flow
area takes place in the port throat when valve lift Lv is quite big, this value is shown by
magenta curves in the fig. 45.
0
1
2
3
4
5
6
7
0 2 4 6 8
CA
A_i
nt, c
m2
A_int
Eff Troat Area
opening
Fig. 45. Effective flow area corresponding with fixed ratios of valve lift to valve head diameter: Lv / Dv = 0; 0.043; 0.1; 0.15; 0.02 for opening and closing phases.
At the developing diagram of fig. 45 there was assumed the valve lift is 5.6 mm
may be reached during 6.8 CA deg. The valve lift profile is close to sine function. The

34
obtained rare points of fig. 45 were complement to describe precisely the effective flow
area of port during opening and closing to be used in DIESEL-RK for thermodynamic
cycle simulation. The results are shown in the fig. 46. Duration of valve opening was
optimized to achieve a best fuel consumption and maximum Air/Fuel ratio, fig. 46.
opening
Fig. 46. Effective flow area for opening and closing phases of intake valve motion.
Fig. 47. Effect of intake duration on z-engine parameters.
Analysis of fig. 47 shows the best duration of intake is 19 CA deg. One allows
decrease fuel consumption in 4 g/kWh, decrease PM emission and increase Lambda.

35
NOx stills same. Parameters of gasexchange at optimal point are presented in the fig. 48
in comparison with ones being character for previous configuration having duration of
intake: 21 CA deg.
Fig. 48. Gasexchange of z-engine at maximum power point with optimal intake duration
(19 CA deg.)
The analysis of the obtained results shows more efficient intake with optimized
intake port. It allows decreasing the SFC in 4 g/kW h with decreasing the PM emission.
The z-engine is very sensitive to the intake process at the large power points. It is neces-
sary to design the intake ports of engine so to provide maximum effective flow area and
fast valve opening till 5.6 mm during 6.8 CA deg. at 3600 RPM.

36
8. Conclusion 1. The greatest effect on the mass flow through the intake ports have:
- a valve head diameter Dv;
- a distance from cylinder axis to the plane of the intake valves axis xv.
The less xv the more equability of filling the gap around the valve head (see Fig.
41 e, f, g, h). The same effect of equability can be achieved by decreasing the diameters
of the valve head, but due to the reduced flow area the mass flow decreases, so the inlet
valve should be made with maximum possible diameter. Other geometrical characteris-
tics of the port (assuming a smooth change in flow area and the lack of sharp ledges in
it) affect the flow not much. The fillet radius of the valve is recommended to perform
not more than 8 mm, the cross-sectional area at the port inlet must be at least 14 cm2.
The lifting of the upper edge of the port roof has a positive effect on the flow through
the ports but an increase an engine dimensions calls into question this decision.
The specific dimensions of the proposed port are shown in fig. 42.
2. There was obtained discharge coefficient of the engine intake port as a function
of valve lift for conventional conditions of small difference of pressure (1.1-1.0 bar) and
for specific conditions of large difference of pressure (16.6-9.9 bar), fig. 43. The dis-
charge coefficient functions are intended for use in thermodynamic engine simulation
tools. The discharge coefficient for large pressure drop has to be used for simulation of
the gas exchange of z-engine.
3. The optimum duration of intake is 19 CA deg. (the full load point @ 3600
RPM). The obtained solution allows decrease fuel consumption in 4 g/kWh, decrease
PM emission and increase Lambda. NOx stills same. Наибольшее влияние на расход через впускные каналы оказывает расстояние от оси цилиндра до плоскости осей клапанов. При его уменьшении улучшается равномерность за-
полнения клапанной щели по окружности (см. рис. 40gh). Того же результата можно добиться с помощью уменьшения диаметров клапанов, но при этом в связи с уменьшением площади
проходного сечения расход снижается, поэтому впускные клапана должны быть выполнены максимально возможного диаметра. Прочие геометрические характеристики канала (при условии
гладкого изменения проходного сечения и отсутствия в нем резких уступов) влияют на расход не слишком сильно. Диаметр галтели клапана рекомендуется выполнять не более 8 мм, площадь
входного сечения должна быть хотя бы 14 см2. Так же на течение через каналы положительно сказывается подъем выходного сечения, однако увеличение габаритов двигателя ставит под
сомнение подобное решение.
Конкретные размеры предлагаемого канала приведены на рисунках 24 и 41.
37
References 1. www.diesel-rk.bmstu.ru
2. Grishin Yu.A. A new schemes of large particles method and their use for en-
gine gasexchange systems optimization // Mathematical Modelling. 2002, Vol. 14, No
8, pp. 51-55. (in Russian). Гришин Ю.А. Новые схемы метода крупных частиц и их
использование для оптимизации газовоздушных трактов двигателей // Математи-
ческое моделирование. 2002, т. 14, №8, с.51-55.
3. Heywood, J.B.: Internal Combustion Engine Fundamentals, McGraw-Hill,
New York, 1988.
4. Annand, W.J.D., and Roe, G.E.: Gas Flow in the Internal Combustion Engine,
Haessner Publishing, Newfoundland, NJ., 1974.

38
Appendix
Fig. 49. The field of static pressure in three sections of optimized intake port

39
Fig. 50. The field of total pressure in three sections of optimized intake port

40
Fig. 51. The field of velocity in three sections of optimized intake port
41
Fig. 52. The field of Mach number in three sections of optimized intake port