Embed Size (px)
Citation preview

7/27/2019 Profiling MySQL Queries with phpMyAdmin - Tuts+ Code Tutorial
http://slidepdf.com/reader/full/profiling-mysql-queries-with-phpmyadmin-tuts-code-tutorial 1/26
Jobs BlogFree Tutorials Courses eBooks Create Account / Sign In
Advertisement
Code Learning GuidesCategories Search tutorials and articles...
DATABASES
by John Cox 1 Jul 2010 0 Comments
Are you a student? Get a yearly Tuts+ subscription for $45→
I have used phpMyAdmin for over a decade. In my early years with the
tool, I simply needed something that could show me table structure and
quickly give me the data inside. As my needs have grown, so have the
tools included with phpMyAdmin which keeps me coming back as my
primary MySQL tool, even with optimization.
Introduction and Scope: Using the Tools at
Hand
I have had the pleasure to work with several different databases. Each
have their drawbacks, and each have their strengths. When given a choice,
I tend to migrate back to MySQL, despite me being too cheap to purchase
the MySQL Enterprise. Instead, I make due with phpMyAdmin as my main
profiling tool. It works well for me, but I had to do quite a bit of research to
ing MySQL Queries with phpMyAdmin - Tuts+ Code Tutorial http://code.tutsplus.com/tutorials/profiling-mysql-queries-with-p
6 9/14/2014

7/27/2019 Profiling MySQL Queries with phpMyAdmin - Tuts+ Code Tutorial
http://slidepdf.com/reader/full/profiling-mysql-queries-with-phpmyadmin-tuts-code-tutorial 2/26
understand what I am looking at while profiling my applications. I am
hoping to pass this along in a way that can be understood by the beginner,
up to the seasoned pro.
Optimization takes time. Managers, clients, and peers for that matter, do
not like to hear that a project is behind schedule because of optimization.
Often times we rush the optimization in order to meet those benchmarks. In
the end though, we aren't doing anyone any favors. The prettiest web
application in the world is going to get you repeat business if it takes 10
seconds to load every page. Likewise, if we wait to optimize until the end of
our projects, chances are there will be much more work to do, than if we
had been checking as the project goes along.
A couple of notes before we get into the meat and potatoes. First, I am notgoing to get into MySQL Tuning, as it is a bit out of the scope for this
tutorial. While tuning is optimization, it's a topic all to itself in my opinion. I
will briefly mention a couple of opportunities to optimized how to tune your
server, but the mentions will be brief. In addition, I will be mainly looking at
MyISAM tables and not InnoDB tables. The rule of thumb is if you are
writing lots of data, use InnoDB, but if you are using SELECT much more,
then use MyISAM. Also, I am not getting into table level REPAIR,
OPTIMIZE, CHECK and ANALYZE as this tutorial is covering queryoptimization with phpMyAdmin. Again, this is a bit out of the scope for this
tutorial.
Finally, I am going to look at WordPress as a real world example. I will be
the first to tell you that I am not an expert in WordPress, but I can look at
the generated queries with the best of them. From what I have seen the
database with WordPress is well indexed, but once we start adding things
that are outside of those main core files, those indexes might not be thebest for what we need.
"Optimization takes time. Managers, clients, and peers
for that matter, do not like to hear that a project is
behind schedule because of optimization."
ing MySQL Queries with phpMyAdmin - Tuts+ Code Tutorial http://code.tutsplus.com/tutorials/profiling-mysql-queries-with-p
6 9/14/2014

7/27/2019 Profiling MySQL Queries with phpMyAdmin - Tuts+ Code Tutorial
http://slidepdf.com/reader/full/profiling-mysql-queries-with-phpmyadmin-tuts-code-tutorial 3/26
Do I Need to Optimize?: Look internally
The short answer is yes.
The long answer is phpMyAdmin gives us a chance to see if we need to
optimize our queries, and how badly we need to optimize them. I wouldimagine that you have seen this screen more than once if you have used
phpMyAdmin:
It's the standard start screen for phpMyAdmin. Unless you are looking for
ways to optimize, you might well go straight to your tables on the left hand
menu, and never see the tab menu at the top. That menu, specifically the
Status and Variables tabs are where we are going to start.
Let's start with the Status screen, which might be the most important tool
that phpMyAdmin provides:
ing MySQL Queries with phpMyAdmin - Tuts+ Code Tutorial http://code.tutsplus.com/tutorials/profiling-mysql-queries-with-p
6 9/14/2014

7/27/2019 Profiling MySQL Queries with phpMyAdmin - Tuts+ Code Tutorial
http://slidepdf.com/reader/full/profiling-mysql-queries-with-phpmyadmin-tuts-code-tutorial 4/26
This is the top of the status screen. While it does have some interesting
data, if you have never gone below the scroll you have missed out on
some very important information. For the sake of brevity, I want to look at
two very simple counter values which I obsess over, the first from my test
environment:
The two values to pay very close attention to are, Handler_read_rnd and
Handler_read_rnd_next. If those two values are in the red, then there are
some queries out there that need to be checked, as when MySQL does a
SELECT, it is reading the entire table. In some cases, this might be by
design, as when you place an index on a table, it takes a bit longer to write,
and it takes a bit more space. However, if you see something like this:
chances are, this wasn't by design. 141 Million requests to read a row on a
fixed position, and 16 Billion requests to read the next row, probably means
ing MySQL Queries with phpMyAdmin - Tuts+ Code Tutorial http://code.tutsplus.com/tutorials/profiling-mysql-queries-with-p
6 9/14/2014

7/27/2019 Profiling MySQL Queries with phpMyAdmin - Tuts+ Code Tutorial
http://slidepdf.com/reader/full/profiling-mysql-queries-with-phpmyadmin-tuts-code-tutorial 5/26
that we are missing an index or two (thousand). Obviously, this number
grows based on the number of requests, so the more a search engine
indexes your site, or the more visitors that you have, the greater a small
missed index becomes. Full table scans are the enemy, and this gives you
a quick way to spot how close that enemy is to the gates.
Another great table to check for query performance takes a look at selects
and indexes directly:
This table pays particular attention to your joins. A dangerous combination
is not using and index on either table, because your full table scans go up
exponentially on the number of joins that you use. The more normalized
your tables, the more you need to pay attention to your indexes, as well as
the definition of the fields you are joining.
Finally, depending on a global variable, you also will want to check this
variable table as well:
If you are logging your slow queries, this variable counter shows the
number that have been identified for observation, depending on the setting
of long query time. Those variables can be found from the variables tab. A
quick look in my test environment shows this setting (for now):
These two tabs show quite a bit more information, some of which is
absolutely vital for tuning your MySQL server. PhpMyAdmin makes it real
ing MySQL Queries with phpMyAdmin - Tuts+ Code Tutorial http://code.tutsplus.com/tutorials/profiling-mysql-queries-with-p
6 9/14/2014

7/27/2019 Profiling MySQL Queries with phpMyAdmin - Tuts+ Code Tutorial
http://slidepdf.com/reader/full/profiling-mysql-queries-with-phpmyadmin-tuts-code-tutorial 6/26
easy for even the novice to spot a problem, and to have a basic
understanding of what that problem might be. If a value is green, we are
good. If it is red, it needs some attention. It also allows us to understand
that we made some progress. When we restart our server, these session
variables are all flushed. If we have made changes, we can see right off
the bat if we made any impact.
EXPLAIN: Understanding the Gibberish
Now that we have identified that we need to do some optimization, let's
look at some of the tools that we are going to use prior to finding our
problems. The first of the tools, and probably the most helpful is to use
EXPLAIN. EXPLAIN basically gives us our query execution plan. This tellsus what MySQL plans to do with this query before it executes.
Without reading up on EXPLAIN, the output might not mean much to you.
Using a table I created for a past tutorial, let's look at an unoptimized
execution plan. My table only has two fields in this case, one being
sales_id, and the other being sale_amount. Here's the query that I am
working with:
On the surface, this is a very simple query. Being a sales table though, the
table will grow and grow and grow. I generated 200 records for the
previous tutorial, and by doing a simple SELECT with an ORDER BY
clause, it actually took quite a bit longer than I would have expected:
That query with only 200 records cost us .15 seconds. Let's use EXPLAIN
1
2
3
4
SELECT sales_id,
sale_amount
FROM tutorial.sales
ORDER BY sale_amount
ing MySQL Queries with phpMyAdmin - Tuts+ Code Tutorial http://code.tutsplus.com/tutorials/profiling-mysql-queries-with-p
6 9/14/2014

7/27/2019 Profiling MySQL Queries with phpMyAdmin - Tuts+ Code Tutorial
http://slidepdf.com/reader/full/profiling-mysql-queries-with-phpmyadmin-tuts-code-tutorial 7/26
to understand how MySQL see's this query. Just click the "Explain SQL"
link to see the results:
Like most things, this doesn't make much sense unless you understand
what is being said. To someone that has never run an EXPLAIN on a
query, this might as well be written in hieroglyphics. Let's see if we can
translate to something a little more understandable.
The select_type tells us that MySQL sees this SELECT as a simple, go to
one table and process. If there was an union or a subquery, then this would
show what part of the SELECT statement this would be calling. Forinstance if I create a query which has a subquery:
We get an EXPLAIN of this:
Which tells us about the query itself. In this case our select_type has
changed to say that the first query is the primary, and then MySQL is going
to go out and perform the subquery, which is a view, so there is another
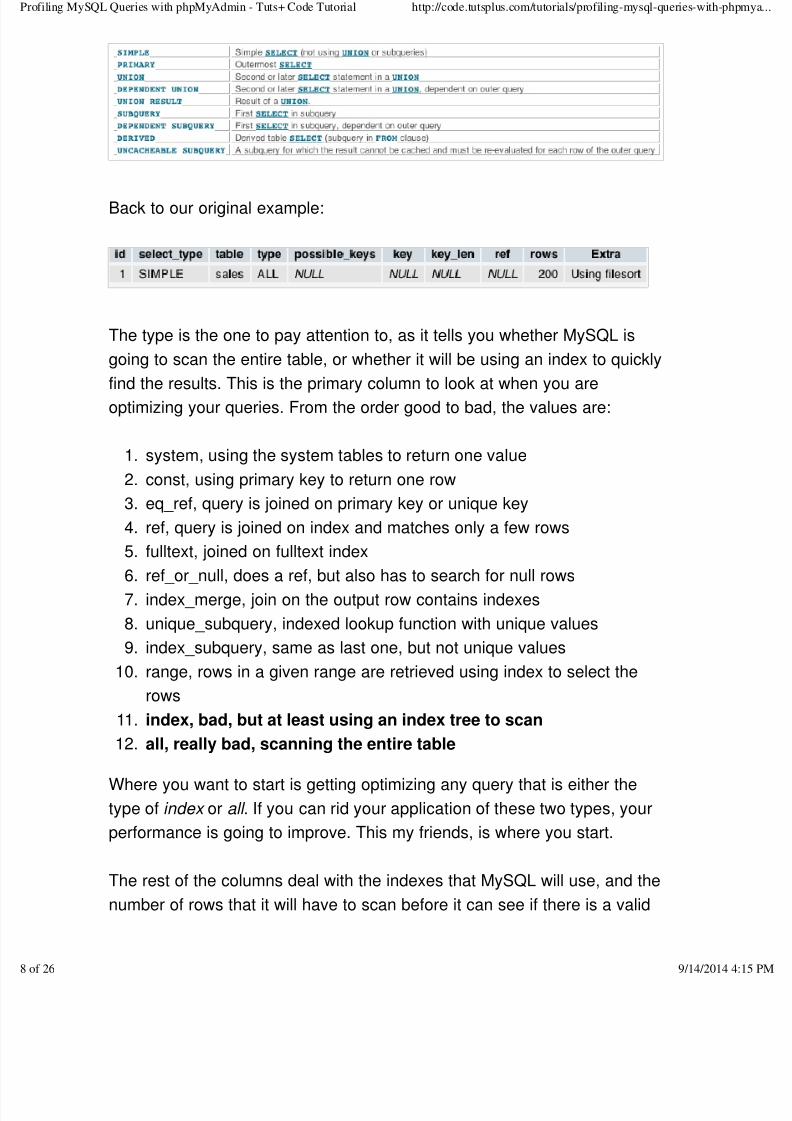
subquery to perform, hence we end with the three separate ids. TheMySQL Reference manual gives all of the possible values:
1
2
3
SELECT sale_amount as amount
FROM sales
WHERE sales_id IN (SELECT sales_id FROM sales_force WHERE sales_id
ing MySQL Queries with phpMyAdmin - Tuts+ Code Tutorial http://code.tutsplus.com/tutorials/profiling-mysql-queries-with-p
6 9/14/2014
7/27/2019 Profiling MySQL Queries with phpMyAdmin - Tuts+ Code Tutorial
http://slidepdf.com/reader/full/profiling-mysql-queries-with-phpmyadmin-tuts-code-tutorial 8/26
Back to our original example:
The type is the one to pay attention to, as it tells you whether MySQL is
going to scan the entire table, or whether it will be using an index to quickly
find the results. This is the primary column to look at when you are
optimizing your queries. From the order good to bad, the values are:
system, using the system tables to return one value1.
const, using primary key to return one row2.
eq_ref, query is joined on primary key or unique key3.
ref, query is joined on index and matches only a few rows4.
fulltext, joined on fulltext index5.
ref_or_null, does a ref, but also has to search for null rows6.
index_merge, join on the output row contains indexes7.
unique_subquery, indexed lookup function with unique values8.
index_subquery, same as last one, but not unique values9.
range, rows in a given range are retrieved using index to select the
rows
10.
index, bad, but at least using an index tree to scan11.
all, really bad, scanning the entire table12.
Where you want to start is getting optimizing any query that is either the
type of index or all . If you can rid your application of these two types, your
performance is going to improve. This my friends, is where you start.
The rest of the columns deal with the indexes that MySQL will use, and the
number of rows that it will have to scan before it can see if there is a valid
ing MySQL Queries with phpMyAdmin - Tuts+ Code Tutorial http://code.tutsplus.com/tutorials/profiling-mysql-queries-with-p
6 9/14/2014

7/27/2019 Profiling MySQL Queries with phpMyAdmin - Tuts+ Code Tutorial
http://slidepdf.com/reader/full/profiling-mysql-queries-with-phpmyadmin-tuts-code-tutorial 9/26
result. As you get rid of the "index" and "all" types, these come in handy to
understand exactly what index MySQL is using to execute this query. To
move a query up the ladder, you begin to tweak your indexes to improve
performance. For the purpose of illustration, I am going to stick with ridding
"all" or full table scans.
The final column is the "extra" column. The extra column tells you
information about the query, whether or not a WHERE clause is used,
whether or not it is an impossible WHERE, meaning this query will always
return a NULL because the WHERE clause makes it impossible to execute.
The one value that we need to pay very close attention to, and rid
ourselves of, is the "Using filesort" which we have in our example. When
you see that value, MySQL has to make another pass through the results
to sort the values. So, in the case of our original query:
Not only is MySQL scanning the entire table, but it has to scan it twice to
sort the results because of our ORDER BY statement. This, is obviously
doubly bad. We will optimize this query and many more in the following
sections.
MySQL Profiler: After the query runs
In MySQL 5.0.37 another tool became available for us to use in
optimization, and that is the MySQL profiler. In addition, phpMyAdmin
added support for this feature in version 2.11, so if you have both of these
versions available, we have another tool to add to optimization.
What the MySQL Profiler does, is give information about the bottlenecks of
1
2
3
4
SELECT sales_id,
sale_amount
FROM tutorial.sales
ORDER BY sale_amount
ing MySQL Queries with phpMyAdmin - Tuts+ Code Tutorial http://code.tutsplus.com/tutorials/profiling-mysql-queries-with-p
6 9/14/2014

7/27/2019 Profiling MySQL Queries with phpMyAdmin - Tuts+ Code Tutorial
http://slidepdf.com/reader/full/profiling-mysql-queries-with-phpmyadmin-tuts-code-tutorial 10/26
our queries. It allows us to see what happens during the actual execution
of our queries, vice what EXPLAIN does, which is give the execution plan
before . Let's see what information we can get from phpMyAdmin from my
original bad query:
If we click on the "Profiling" checkbox below our query, a new world opens
up with:
phpMyAdmin provides the actual execution times of the query that was
provided. We can now see the bottlenecks of where our queries, or eventable level structure should be addressed. Perhaps, we see the need from
log files that this table really isn't written to as much as it is read from, so
instead of InnoDB, we can now switch it to MyISAM.
There is a bit of a drawback to using phpMyAdmin when using the MySQL
Profiler, and that is that the profiler is based on the session, and
ing MySQL Queries with phpMyAdmin - Tuts+ Code Tutorial http://code.tutsplus.com/tutorials/profiling-mysql-queries-with-p
26 9/14/2014

7/27/2019 Profiling MySQL Queries with phpMyAdmin - Tuts+ Code Tutorial
http://slidepdf.com/reader/full/profiling-mysql-queries-with-phpmyadmin-tuts-code-tutorial 11/26
phpMyAdmin destroys the session on each pageview.. The problem this
gives us is that we do not have a way to keep a running total of the profiling
data, but there is a way to trick phpMyAdmin, albeit in a kludgy fashion:
Which results in:
Since we are executing multiple queries, you do need to use the delimiter.This will show that my query is query_id 1. Each subsequent time I run this
query, it is still query_id 1 since my session is being destroyed on start up. I
am not sure if this is by design, a bug or ignorance on my part that
phpMyAdmin destroys the session with the QUIT command, but we can
work around this problem just a bit. MySQL has a wonderful write up on
using the profiler by Robin Schumacher, and I am going to use a bit of
Robin's query to get the number of operations in phpMyAdmin:
1
2
34
5
6
7
8
SET profiling = 1;
SELECT sales_id,sale_amount
FROM tutorial.sales
ORDER BY sale_amount;
SHOW profiles;
01
02
03
04
05
06
07
08
09
SET profiling = 1;
SELECT sales_id,
sale_amount
FROM tutorial.sales
ORDER BY sale_amount;
SELECT min(seq) as sequence,
state,
ing MySQL Queries with phpMyAdmin - Tuts+ Code Tutorial http://code.tutsplus.com/tutorials/profiling-mysql-queries-with-p
26 9/14/2014

7/27/2019 Profiling MySQL Queries with phpMyAdmin - Tuts+ Code Tutorial
http://slidepdf.com/reader/full/profiling-mysql-queries-with-phpmyadmin-tuts-code-tutorial 12/26
Again, not ideal with phpMyAdmin, but we still get what we want in the end:
Log Files and Global Vars: Catching the Queries
Before we put all that we have learned together, let's also take a look at
how to capture queries by using MySQL's log files. We can capture everyquery that MySQL runs into the mysql.general_log table. By running this
command:
We can now have a record for all of the queries that are run, regardless of
10
11
12
13
14
15
count(*) as operations,
round(sum(duration),5) as duration
FROM information_schema.profiling
WHERE query_id = 1
GROUP by state
ORDER by seq;
1
2
SET GLOBAL general_log = 'ON';
SET GLOBAL log_output = 'TABLE';
ing MySQL Queries with phpMyAdmin - Tuts+ Code Tutorial http://code.tutsplus.com/tutorials/profiling-mysql-queries-with-p
26 9/14/2014

7/27/2019 Profiling MySQL Queries with phpMyAdmin - Tuts+ Code Tutorial
http://slidepdf.com/reader/full/profiling-mysql-queries-with-phpmyadmin-tuts-code-tutorial 13/26
the source. While this operation is expensive, and I would not run it on a
production setting, it gives us a clear and concise method of getting all of
our queries, and the order of their execution from our applications. In short,
this might be the most valuable SQL query optimization tool you have in
your toolbox. By setting these two GLOBAL vars, we have the final step to
getting some practical optimization techniques.
Here's an abbreviated output from mysql.general_log table using this
query:
produces this:
I basically have my query, along with everything that phpMyAdmin has
been doing in the background. If I empty the table before each new
command, I have something that I can work with on each page view, or
AJAX call I make from my applications. To empty the log, we simply
TRUNCATE the table like so:
1
2
3
4
5
SELECT event_time,
command_type,
argument
FROM mysql.general_log
ORDER BY event_time
ing MySQL Queries with phpMyAdmin - Tuts+ Code Tutorial http://code.tutsplus.com/tutorials/profiling-mysql-queries-with-p
26 9/14/2014

7/27/2019 Profiling MySQL Queries with phpMyAdmin - Tuts+ Code Tutorial
http://slidepdf.com/reader/full/profiling-mysql-queries-with-phpmyadmin-tuts-code-tutorial 14/26
Truncate is a much better statement to use here than DELETE FROM, as
the DELETE statement deletes row by row, where as TRUNCATE empties
the entire table at once.
Once you are done with your optimization, you simply need to turn off your
query log with this command:
The general log becomes expensive over time, and certainly slows down
the performance of your application. I keep it turned off in between my
optimizations simply so I can get a organic feel for the performance of whatI am writing. That said, in development, I always keep the slow query log
turned on as I want to see my slower queries as a quick optimization tool.
You can do this easily:
and we can check that from our Variables tab from our welcome page:
To see the output, we just need to either check the mysql.slow_log or we
can use a query like this:
Which gives me the actual queries that were logged as slow:
1 TRUNCATE mysql.general_log
1 SET GLOBAL general_log = 'OFF';
1
2
3
SET GLOBAL slow_query_log = 'ON';
SET GLOBAL log_queries_not_using_indexes = 'ON';
SET GLOBAL log_output = 'TABLE';
1
2
SELECT sql_text
FROM mysql.slow_log
ing MySQL Queries with phpMyAdmin - Tuts+ Code Tutorial http://code.tutsplus.com/tutorials/profiling-mysql-queries-with-p
26 9/14/2014
7/27/2019 Profiling MySQL Queries with phpMyAdmin - Tuts+ Code Tutorial
http://slidepdf.com/reader/full/profiling-mysql-queries-with-phpmyadmin-tuts-code-tutorial 15/26
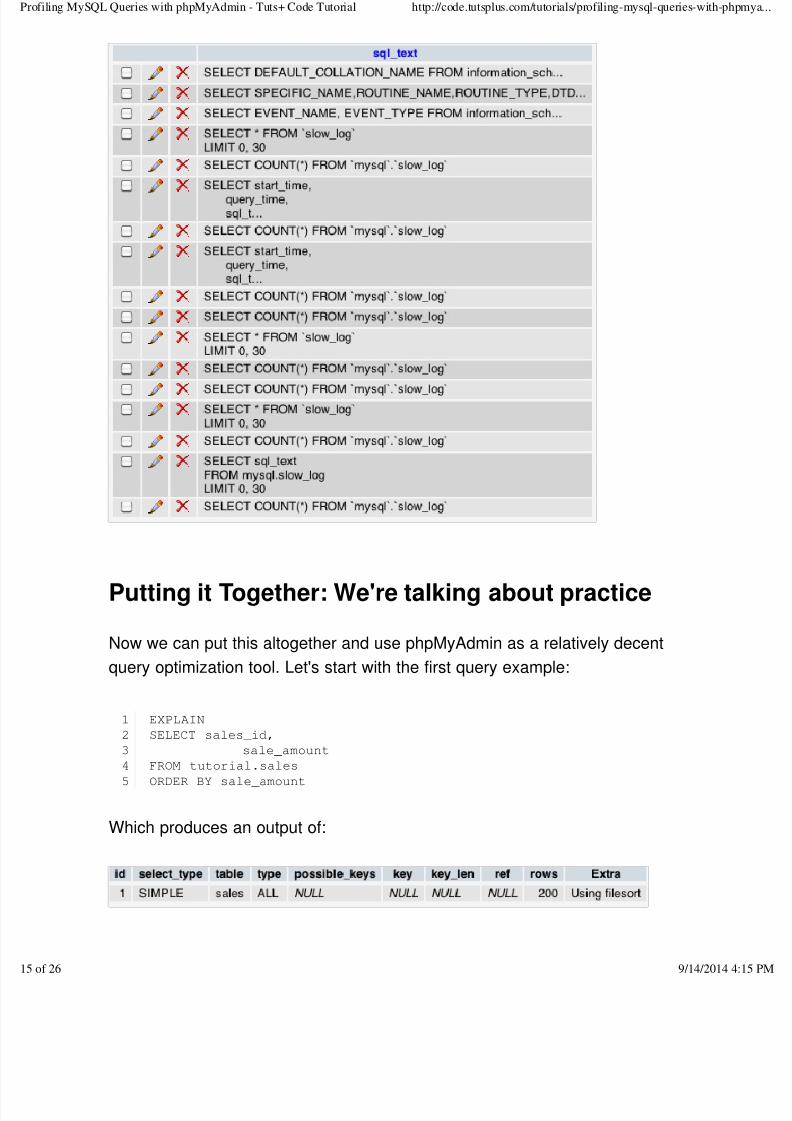
Putting it Together: We're talking about practice
Now we can put this altogether and use phpMyAdmin as a relatively decent
query optimization tool. Let's start with the first query example:
Which produces an output of:
1
2
34
5
EXPLAIN
SELECT sales_id,
sale_amountFROM tutorial.sales
ORDER BY sale_amount
ing MySQL Queries with phpMyAdmin - Tuts+ Code Tutorial http://code.tutsplus.com/tutorials/profiling-mysql-queries-with-p
26 9/14/2014

7/27/2019 Profiling MySQL Queries with phpMyAdmin - Tuts+ Code Tutorial
http://slidepdf.com/reader/full/profiling-mysql-queries-with-phpmyadmin-tuts-code-tutorial 16/26
We know we need to get at least one INDEX on this table. Let's stop and
think how this table is used. It's a simple look-up table to join a sales_force
table to tell us that they made a sale that was of the amount recorded. If all
we ever do is join against this table on the sales_id, then that is what we
need to index by clicking on the details link:
We can then just define that index like so:
Our original query still gives us a full scan, but in a practical application:
Let's see if this is any better:
1
2
3
4
5
6
7
8
SELECT sfn.first_name,
sfn.last_name,
s.sale_amount
FROM sales_force_normalized sfn
INNER JOIN sales s
ON sfn.sales_id = s.sales_id
ing MySQL Queries with phpMyAdmin - Tuts+ Code Tutorial http://code.tutsplus.com/tutorials/profiling-mysql-queries-with-p
26 9/14/2014

7/27/2019 Profiling MySQL Queries with phpMyAdmin - Tuts+ Code Tutorial
http://slidepdf.com/reader/full/profiling-mysql-queries-with-phpmyadmin-tuts-code-tutorial 17/26
Now we are getting somewhere. However, if we do something like this:
Then we are back in the same boat of doing a full scan of the table. In this
case, we can just edit the index and add the sale_amount:
Which improves us from really bad to just bad:
Or we can add a new index on just the amount:
And we have the wonderful result of:
1
2
SELECT max(sale_amount)
FROM sales
ing MySQL Queries with phpMyAdmin - Tuts+ Code Tutorial http://code.tutsplus.com/tutorials/profiling-mysql-queries-with-p
26 9/14/2014

7/27/2019 Profiling MySQL Queries with phpMyAdmin - Tuts+ Code Tutorial
http://slidepdf.com/reader/full/profiling-mysql-queries-with-phpmyadmin-tuts-code-tutorial 18/26
Which means that MySQL doesn't even have to open the table, as it just
has to look into the index. We have now hit the absolute optimum level for
this COUNT function. Check out how long it took to execute this query
now:
And for good measure, let's click the Profiling checkbox on the query to see
any bottlenecks now:
ing MySQL Queries with phpMyAdmin - Tuts+ Code Tutorial http://code.tutsplus.com/tutorials/profiling-mysql-queries-with-p
26 9/14/2014

7/27/2019 Profiling MySQL Queries with phpMyAdmin - Tuts+ Code Tutorial
http://slidepdf.com/reader/full/profiling-mysql-queries-with-phpmyadmin-tuts-code-tutorial 19/26
Advertisement
Real World: It gets a bit harder
We have been playing with pretend queries, and pretend databases, but
let's put this tutorial to the test. I have a stock WordPress install, with just
the Lorem Ipsum plugin to add about 5000 posts and 11,000 comments, so
we can put just a little strain on MySQL when we are making our selects.
Let's start logging our queries again from phpMyAdmin and also truncate
the slow and general logs so we can see what happens when we load a
page from WordPress:
1
2
SET GLOBAL general_log = 'ON';
TRUNCATE mysql.slow_log;
ing MySQL Queries with phpMyAdmin - Tuts+ Code Tutorial http://code.tutsplus.com/tutorials/profiling-mysql-queries-with-p
26 9/14/2014

7/27/2019 Profiling MySQL Queries with phpMyAdmin - Tuts+ Code Tutorial
http://slidepdf.com/reader/full/profiling-mysql-queries-with-phpmyadmin-tuts-code-tutorial 20/26
There is going to be a few artifacts in the general_log as phpMyAdmin
causes some activity within MySQL, but we should be able to get
everything in order when I reload my index page from WordPress at this
point, and if we use a LIKE condition, we can get mostly just WordPress
results since the tables are prefixed with wp_:
Which gives us a reasonable result of:
Now, we know that WordPress simply gives us 11 queries on loading the
index page with a pretty vanilla installation. Let's find something to
optimized that they might have missed. If we take the very first query that is
executed whenever WordPress loads:
3 TRUNCATE mysql.general_log;
1
2
3
4
5
6
SELECT event_time,
command_type,
argument
FROM mysql.general_log
WHERE argument LIKE "%wp_%"
ORDER BY event_time
ing MySQL Queries with phpMyAdmin - Tuts+ Code Tutorial http://code.tutsplus.com/tutorials/profiling-mysql-queries-with-p
26 9/14/2014

7/27/2019 Profiling MySQL Queries with phpMyAdmin - Tuts+ Code Tutorial
http://slidepdf.com/reader/full/profiling-mysql-queries-with-phpmyadmin-tuts-code-tutorial 21/26
We find that this is not optimized:
Let's take a look at what they did through phpMyAdmin:
We see that there is an index on option_name, but there is not an index on
autoload, which is the condition specifies on the index page. Let's add it,
and see if we can't optimize the core WordPress installation just a bit:
Since, autoload is varchar and either "yes" or "no" from what I see, I can
limit my index value to 1. Meaning, it now sees either "y" or "n" which
reduces our time even greater. Let's see the EXPLAIN after we have
optimized:
We have gone from really bad, to the fourth best type. Not bad for a couple
of minutes of work. Granted, WordPress wasn't choking on this value, but
1
2
3
4
EXPLAIN SELECT option_name,
option_value
FROM wp_options
WHERE autoload = 'yes'
ing MySQL Queries with phpMyAdmin - Tuts+ Code Tutorial http://code.tutsplus.com/tutorials/profiling-mysql-queries-with-p
26 9/14/2014

7/27/2019 Profiling MySQL Queries with phpMyAdmin - Tuts+ Code Tutorial
http://slidepdf.com/reader/full/profiling-mysql-queries-with-phpmyadmin-tuts-code-tutorial 22/26
depending on the load of your blog, every little bit helps. Granted now, the
writes take longer, because we have to index our "y" or "n" for each line
that is written.
If we go just a little further, we can also see the MySQL Profiler in action by
just checking the "Profiling" checkbox. Now we see that our query is really
buzzing right along:
Conclusion
Optimization isn't easy, nor is it really very much fun. However, when you
ignore this step of development, it always comes back to haunt you. I
believe that it is relatively easy to use the tools in phpMyAdmin to get a
pretty good optimization look at your applications. That said, there are new
tools added all the time, such as Jet Profiler which takes what I have just
done into a real time, and graphical nature.
It's not difficult, or really time consuming to approach optimization through
phpMyAdmin. It does take a little patience to learn how to do it, and what
ing MySQL Queries with phpMyAdmin - Tuts+ Code Tutorial http://code.tutsplus.com/tutorials/profiling-mysql-queries-with-p
26 9/14/2014

7/27/2019 Profiling MySQL Queries with phpMyAdmin - Tuts+ Code Tutorial
http://slidepdf.com/reader/full/profiling-mysql-queries-with-phpmyadmin-tuts-code-tutorial 23/26
Advertisement
can be done. I hope that I have given you the tools to start being a bit more
effective in your approaches. Please, let me know what you think in the
comments section.
Difficulty:
Advanced
Length:
Long
Categories:
Databases
Translations Available:
Tuts+ tutorials are translated by our community members. If you'd like to translate this post into another
language, let us know!
About John Cox
+ Expand Bio
John is fascinated with innovation of all types. He works by day as a technical business consultant
identifying and solving challenging business problems with technology, and by night as a husbandand father of two. He has been on the frontier of web development for the past fifteen years, but
still learns something new everyday. You can catch up with him through Wyome.com.
ing MySQL Queries with phpMyAdmin - Tuts+ Code Tutorial http://code.tutsplus.com/tutorials/profiling-mysql-queries-with-p
26 9/14/2014

7/27/2019 Profiling MySQL Queries with phpMyAdmin - Tuts+ Code Tutorial
http://slidepdf.com/reader/full/profiling-mysql-queries-with-phpmyadmin-tuts-code-tutorial 24/26
Advertisement
Suggested Tuts+ Course
Related Tutorials
Getting Started With Sequel $15
Installing and Using PHPMyAdmin for Web Development
Code
From Beginner to Advanced OpenCart: More About MVCCode
Best Practices When Working With Sensitive Data: Securing Your Application
Code
ing MySQL Queries with phpMyAdmin - Tuts+ Code Tutorial http://code.tutsplus.com/tutorials/profiling-mysql-queries-with-p
26 9/14/2014

7/27/2019 Profiling MySQL Queries with phpMyAdmin - Tuts+ Code Tutorial
http://slidepdf.com/reader/full/profiling-mysql-queries-with-phpmyadmin-tuts-code-tutorial 25/26
Generating PDFs with PHP
•
— This is a very clear tutorial and
well documented. Thanks for sharing
this.$pdf->SetFont('Arial, '') this has to be
Class Constants and Internal
Reference
•
— That makes sense.
Thanks.
Power A Facebook Page Using
Wordpress
•
— Very thoughtful and well
written tutorial. But I have a question.
What if you have an existing site already
Dependency Injection
•
— Hi Thomas, thanks!
Graag gedaan :)
0 Comments 1
Advertisement
ing MySQL Queries with phpMyAdmin - Tuts+ Code Tutorial http://code.tutsplus.com/tutorials/profiling-mysql-queries-with-p
26 9/14/2014

7/27/2019 Profiling MySQL Queries with phpMyAdmin - Tuts+ Code Tutorial
http://slidepdf.com/reader/full/profiling-mysql-queries-with-phpmyadmin-tuts-code-tutorial 26/26
18,240 Tutorials 400 Video Courses
Custom digital services like logo design, WordPress installaton, video
production and more.
Check out Envato Studio
Add more features to your website such as user profiles, payment gateways,
image galleries and more.
Browse WordPress Plugins
Teaching skills to millions worldwide.
Follow Us RSS Digests
Tutorials
Courses
eBooks
Help and Support
Terms of Use
Contact SupportTuts+ Blog
About Tuts+
Advertise
Write for Us
© 2014 Envato Pty Ltd. Trademarks and brands are the property of their respective owners.
ing MySQL Queries with phpMyAdmin - Tuts+ Code Tutorial http://code.tutsplus.com/tutorials/profiling-mysql-queries-with-p


![[Tuts] Bermain Blending Mode](https://img.dokumen.tips/doc/110x75/563db91a550346aa9a9a0aa1/tuts-bermain-blending-mode.jpg)