Embed Size (px)
Citation preview

Profi ling Hoodia Extracts by HPLC with Charged Aerosol Detection, Electrochemical Array Detection, and Principal Component AnalysisIan Acworth, Bruce Bailey, Marc Plante, Qi Zhang, and David ThomasThermo Fisher Scientifi c, Chelmsford, MA, USA
2 Pro� ling Hoodia Extracts by HPLC with Charged Aerosol Detection, Electrochemical Array Detection, and Principal Component Analysis
Pattern Recognition Analysis
Chromatographic data from either the charged aerosol detector or the Spectro-Electro array detector were pre-processed to align peak retention times by using the pattern recognition wizard in CoulArray 3.0 software and then imported into Pirouette software for PCA and HCA. PCA is a mathematical procedure that uses an orthogonal transformation to convert a set of observations of possibly correlated variables into a set of values of linearly uncorrelated variables called principal components. It is mostly used as a tool in exploratory data analysis and for making predictive models. The greatest variance by any projection of the data is found in the first coordinate (Factor 1), the second greatest variance is found on the second coordinate (Factor 2), and so on. Thus samples with different patterns in their chromatographic or electrochemical profile are distinguished from each other based on their relative position in three- dimensional space. The relationships among these data were used to investigate authenticity and differences in processing, e.g., dried plant parts, tablet, or capsule.
Profiling Hoodia Extracts by HPLC with Charged Aerosol Detection, Electrochemical Array Detection, and Principal Component AnalysisIan Acworth, Bruce Bailey, Marc Plante, Qi Zhang, David Thomas Thermo Fisher Scientific, Chelmsford, MA
Conclusion• Gradient HPLC with charged aerosol or electrochemical array detection are simple
approaches that generate information-rich chemical profile data. Both detectors can reveal analytes overlooked by UV detection alone.
• Chemical profile data can be imported into pattern recognition software and with principal components analysis used to readily identify product authenticity.
• The combined chromatographic/chemometric approach was verified by applying it to known test samples, but can be readily applied to quickly screen unknown samples.
References1. Avula, B.; Wang, Y.-H.; Pawar, R.S.; Shukla, Y.J.; Smillie, T.J.; Khan, I.A.
A rapid method for chemical fingerprint analysis of Hoodia species, related genera, and dietary supplements using UPLC–UV–MS J. Pharm. Biomed. Anal. 2008, 48, 722–731.
2. Gamache, P.; Acworth, I.; Lynch, M.; and Matson, W. Coulometric Array Detection for HPLC In the analysis of Juice Products in Methods to Detect Adulteration of Fruit Juice Beverages; Nagy, S., Wade, R., Eds.; AGSCIENCE USA, Inc.1995; Vol. 1, pp 120-144.
AcknowledgementsWe would like to thank Drs. Ikhlas Khan and Bharathi Avula of the National Center for Natural Products Research at The University of Mississippi, Oxford, MS, for providing the plant materials and hoodigoside standards used in this study.
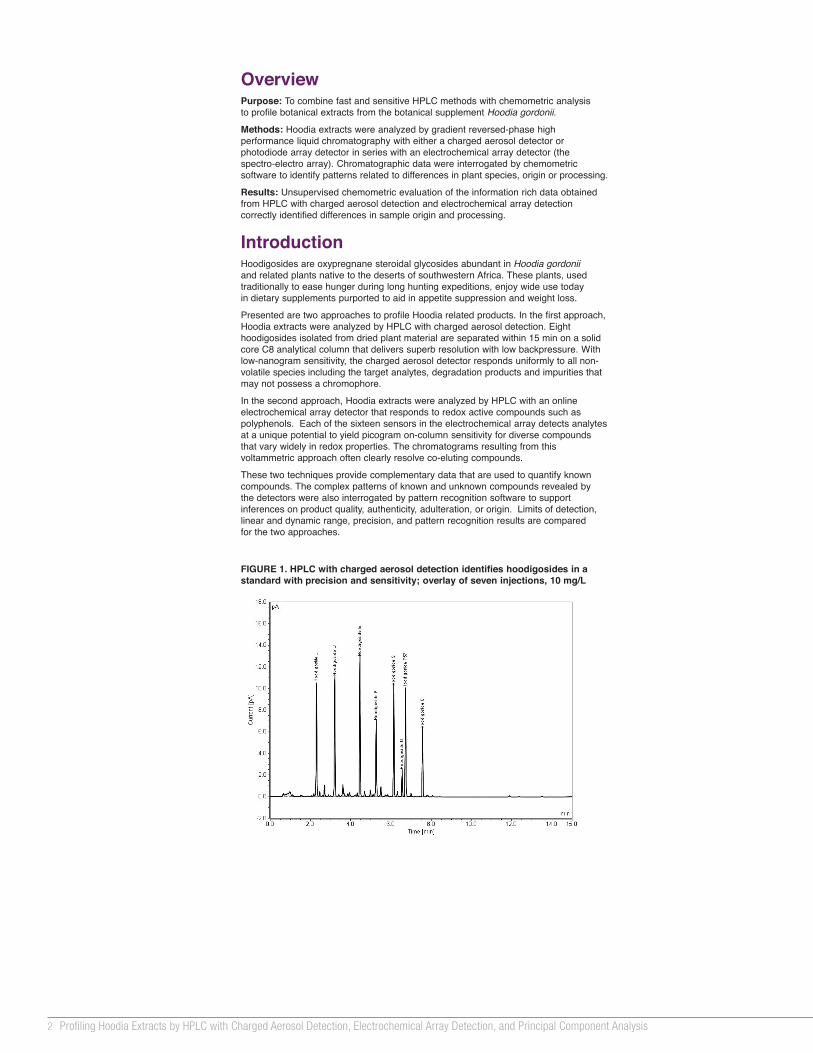
FIGURE 1. HPLC with charged aerosol detection identifies hoodigosides in a standard with precision and sensitivity; overlay of seven injections, 10 mg/L
© 2013 Thermo Fisher Scientific Inc. All rights reserved. Pirouette is a registered trademark of Informetrix, Inc.All other trademarks are the property of Thermo Fisher Scientific and its subsidiaries. This information is not intended to encourage use of these products in any manners that might infringe the intellectual property rights of others.
PO70540_E 03/13S
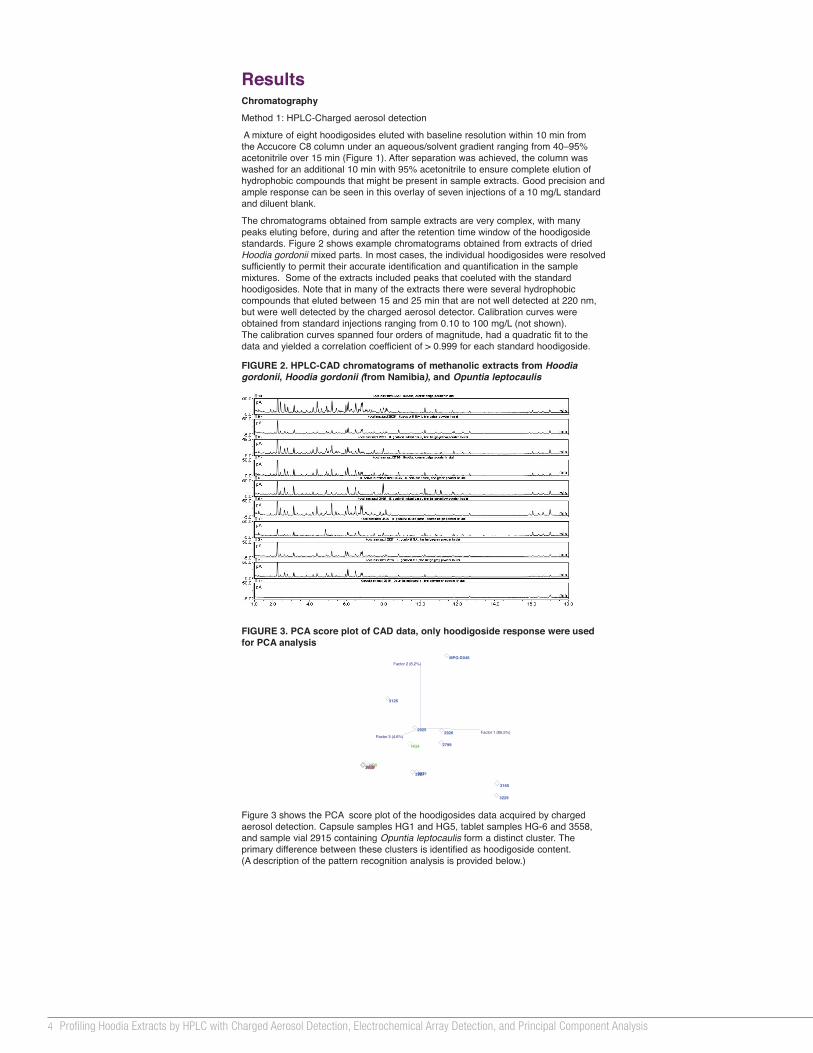
FIGURE 2. HPLC-CAD chromatograms of methanolic extracts from Hoodiagordonii, Hoodia gordonii (from Namibia), and Opuntia leptocaulis
FIGURE 6. PCA score plot for ECD array data from channels 1–16. MethodsHPLC with Charged Aerosol Detection
HPLC System: Thermo Scientific™ Dionex™ UltiMate™ 3000 RSLC system with a:- DAD–3000RS Diode Array Detector and a - Corona™ ultra RS™ Charged Aerosol Detector:Nebulizer Temperature: 25 °CPower function: 1.00Data collection rate: 20 Hz
Data Analysis: Thermo Scientific™ Dionex™ Chromeleon™ ChromatographyData System software, 7.1 SR1
Column: Thermo Scientific™ Accucore™ C8, 4.6 × 150 mm; 2.6 µm
Temp.: 40 oCInjection Vol.: 10 µLFlow Rate: 2.0 mL/minMobile Phase A: Deionized water Mobile Phase B: Acetonitrile, Fisher Scientific™ Optima™ LCMSGradient: 40%B to 47%B in 2.5 min; to 95%B in 15 min; hold 10 min.
HPLC with Spectro-Electro Array Detection
HPLC System: Thermo Scientific™ Dionex™ UltiMate™ 3000 RS system with a- DAD–3000RS Diode Array Detector- CoulArray™ Electrochemical Array Detector:16-channel array from 0 to +900 mV versus Pd in +60 mV steps
Data Analysis: Thermo Scientific™ Dionex™ Chromeleon™ Chromatography Data System 6.8 and CoulArray 3.0 software.
Column: Thermo Scientific™ Acclaim™ C18, 3 × 150 mm; 3 µm
Temperature: 35 oCFlow Rate: 0.65 mL/minInjection Vol.: 10 µLMobile Phase A: 20 mM Monobasic sodium phosphate, 3% acetonitrile, ` 0.2% tetrahydrofuran, pH 3.35Mobile Phase B: 20 mM Monobasic sodium phosphate, 50% acetonitrile,
10% tetrahydrofuran, pH 3.45Mobile Phase C: Methanol, Optima LCMS
Gradient:
Sample Preparation
50 mg powder from a commercially available capsule was placed into a 2 mL centrifuge tube. One 1 mL methanol was added and the mixture vortexed for 10 min. The supernatant was transferred to a 5 mL volumetric flask. Extraction was repeated two times with fresh methanol and the extracts combined. After bringing to volume with methanol and mixing, an aliquot was centrifuged in a 1 mL centrifuge tube at 13,000 rpm for 10 min and the supernatant transferred to a glass HPLC autosampler vial.
Data Analysis
Principal components analysis (PCA) and cluster analysis (HCA) were used to investigate pattern differences in chromatograms represented as detector response versus retention time. Data were aligned by using the Pattern Recognition Wizard in CoulArray for Windows 3.0 software and imported into Pirouette® Comprehensive Chemometrics modeling software version 4.5 for PCA and HCA.
ResultsChromatography
Method 1: HPLC-Charged aerosol detection
A mixture of eight hoodigosides eluted with baseline resolution within 10 min from the Accucore C8 column under an aqueous/solvent gradient ranging from 40–95% acetonitrile over 15 min (Figure 1). After separation was achieved, the column was washed for an additional 10 min with 95% acetonitrile to ensure complete elution of hydrophobic compounds that might be present in sample extracts. Good precision and ample response can be seen in this overlay of seven injections of a 10 mg/L standard and diluent blank.
The chromatograms obtained from sample extracts are very complex, with many peaks eluting before, during and after the retention time window of the hoodigoside standards. Figure 2 shows example chromatograms obtained from extracts of dried Hoodia gordonii mixed parts. In most cases, the individual hoodigosides were resolved sufficiently to permit their accurate identification and quantification in the sample mixtures. Some of the extracts included peaks that coeluted with the standard hoodigosides. Note that in many of the extracts there were several hydrophobic compounds that eluted between 15 and 25 min that are not well detected at 220 nm, but were well detected by the charged aerosol detector. Calibration curves were obtained from standard injections ranging from 0.10 to 100 mg/L (not shown). The calibration curves spanned four orders of magnitude, had a quadratic fit to the data and yielded a correlation coefficient of > 0.999 for each standard hoodigoside.
Time(min)
Flow(mL/min)
%A %B %C Curve
0 0.65 92 5 3 52 0.65 92 5 3 7 (concave)30 0.65 0 97 3 7 (concave)45 0.65 0 97 3 545 0.65 92 5 3 550 0.65 92 5 3 5
OverviewPurpose: To combine fast and sensitive HPLC methods with chemometric analysis to profile botanical extracts from the botanical supplement Hoodia gordonii.
Methods: Hoodia extracts were analyzed by gradient reversed-phase high performance liquid chromatography with either a charged aerosol detector or photodiode array detector in series with an electrochemical array detector (the spectro-electro array). Chromatographic data were interrogated by chemometric software to identify patterns related to differences in plant species, origin or processing.
Results: Unsupervised chemometric evaluation of the information rich data obtained from HPLC with charged aerosol detection and electrochemical array detection correctly identified differences in sample origin and processing.
IntroductionHoodigosides are oxypregnane steroidal glycosides abundant in Hoodia gordoniiand related plants native to the deserts of southwestern Africa. These plants, used traditionally to ease hunger during long hunting expeditions, enjoy wide use today in dietary supplements purported to aid in appetite suppression and weight loss.
Presented are two approaches to profile Hoodia related products. In the first approach, Hoodia extracts were analyzed by HPLC with charged aerosol detection. Eight hoodigosides isolated from dried plant material are separated within 15 min on a solid core C8 analytical column that delivers superb resolution with low backpressure. With low-nanogram sensitivity, the charged aerosol detector responds uniformly to all non-volatile species including the target analytes, degradation products and impurities that may not possess a chromophore.
In the second approach, Hoodia extracts were analyzed by HPLC with an online electrochemical array detector that responds to redox active compounds such as polyphenols. Each of the sixteen sensors in the electrochemical array detects analytes at a unique potential to yield picogram on-column sensitivity for diverse compounds that vary widely in redox properties. The chromatograms resulting from this voltammetric approach often clearly resolve co-eluting compounds.
These two techniques provide complementary data that are used to quantify known compounds. The complex patterns of known and unknown compounds revealed by the detectors were also interrogated by pattern recognition software to support inferences on product quality, authenticity, adulteration, or origin. Limits of detection, linear and dynamic range, precision, and pattern recognition results are compared for the two approaches.
Method 2: HPLC-Spectro-Electro Array.
Chromatographic results:
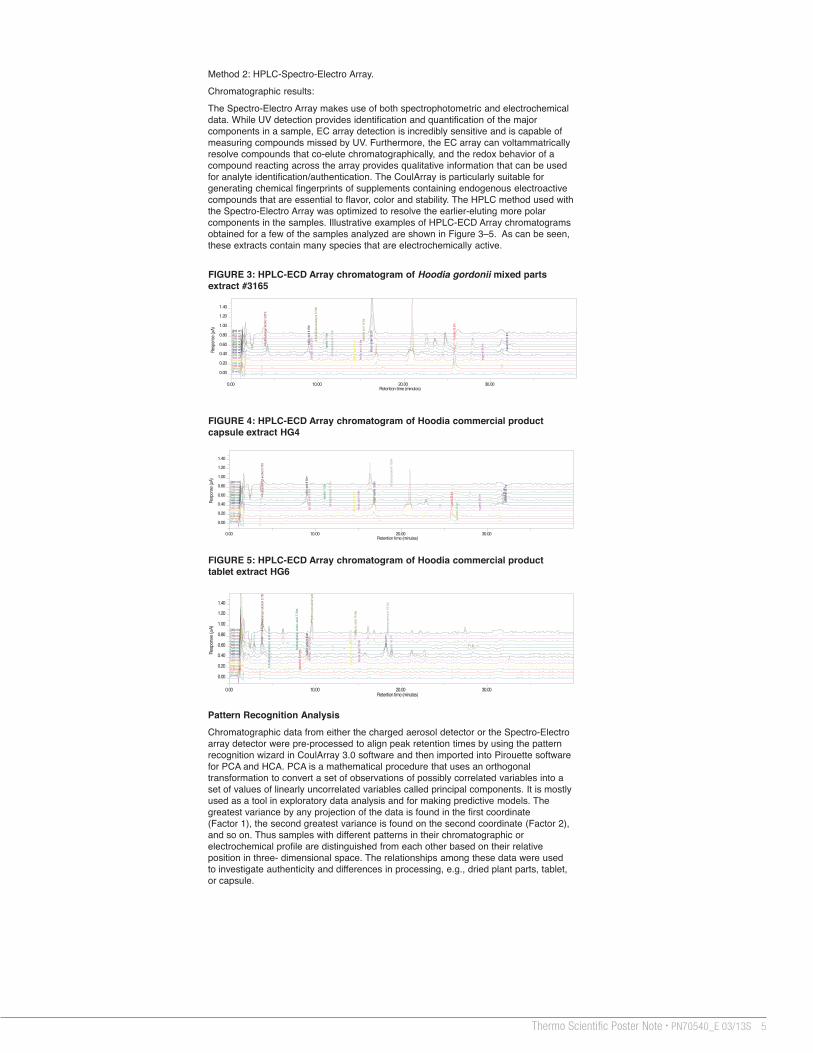
The Spectro-Electro Array makes use of both spectrophotometric and electrochemical data. While UV detection provides identification and quantification of the major components in a sample, EC array detection is incredibly sensitive and is capable of measuring compounds missed by UV. Furthermore, the EC array can voltammatrically resolve compounds that co-elute chromatographically, and the redox behavior of a compound reacting across the array provides qualitative information that can be used for analyte identification/authentication. The CoulArray is particularly suitable for generating chemical fingerprints of supplements containing endogenous electroactivecompounds that are essential to flavor, color and stability. The HPLC method used with the Spectro-Electro Array was optimized to resolve the earlier-eluting more polar components in the samples. Illustrative examples of HPLC-ECD Array chromatograms obtained for a few of the samples analyzed are shown in Figure 3–5. As can be seen, these extracts contain many species that are electrochemically active.
FIGURE 3. PCA score plot of CAD data, only hoodigoside response were used for PCA analysis
Factor 1 (72.7%)
Factor 2 (10.8%)
Factor 3 (6.3%)
3165
29272926
2915
HG5
HG6
3229
2925
MPG
3126
HG1
3558
A score plot from the HPLC-Charged aerosol detection data is shown in Figure 3 and discussed in that section. A score plot from PCA analysis of the ECD array (CoulArray)data is shown in Figure 6. Samples 2821, 2799 and HG4 were excluded as outliers before PCA analysis because of problems with the chromatography. PCA readily identifies three major groups among the remaining samples. One group contains only sample 2915, from the non-hoodia species Opuntia leptocaulis. Another group corresponds to the samples processed into capsules or tablets. The third set, within the black circle, corresponds to authentic Hoodia gordonii dried plant material. In each case, the results from the unsupervised chemometric analysis correspond to plainly observable characteristics of the samples, allowing us to verify the accuracy of the approach. The real power of this combined chromatographic/chemometric approach is that it can be implemented in a more or less automated way to quickly screen unknown samples.
Factor 1 (85.5%)
Factor 2 (8.2%)
Factor 3 (4.6%)
3229
2925
MPG-D046
3165
2927
2926
2915HG1HG5HG635582821
2799
3126
HG4
Figure 3 shows the PCA score plot of the hoodigosides data acquired by charged aerosol detection. Capsule samples HG1 and HG5, tablet samples HG-6 and 3558, and sample vial 2915 containing Opuntia leptocaulis form a distinct cluster. The primary difference between these clusters is identified as hoodigoside content. (A description of the pattern recognition analysis is provided below.)
0.00 10.00 20.00 30.00
0.00
0.20
0.40
0.60
0.80
1.00
1.20
1.40
Retention time (minutes)
Resp
onse
(µA) [900 mV]
[840 mV][780 mV]
4-hyd
roxyb
enza
ldehy
de 9.
76m
salic
ylic a
cid 15
.3m
[720 mV][660 mV]
4-hyd
roxyb
enzy
l alco
hol 3
.87m
[600 mV]
vanil
lin 11
.0m
[540 mV]
ethyl
vanil
lin 16
.2m
cava
rcrol
31.9m
[480 mV]
valilli
c acid
8.93
m
[420 mV]
syrin
geald
ehyd
e 11.6
m
[360 mV]
syrin
gic ac
id 9.2
2m
feruli
c acid
14.9m
euge
nol 2
9.1m
[300 mV] sinap
ic ac
id 14
.2m
[240 mV][180 mV]
luteo
lin 25
.8m
[120 mV][60 mV][0 mV]
0.00 10.00 20.00 30.00
0.00
0.20
0.40
0.60
0.80
1.00
1.20
1.40
Retention time (minutes)
Resp
onse
(µA) [900 mV]
4-hyd
roxyc
ouma
rin 18
.8m
[840 mV][780 mV][720 mV][660 mV]
4-hyd
roxyb
enzy
l alco
hol 3
.75m
[600 mV]
vanil
lin 11
.0m
[540 mV]
ethyl
vanil
lin 16
.8m
thymo
l 31.9
m ca
varcr
ol 32
.1m
[480 mV]
valilli
c acid
8.92
m
[420 mV]
syrin
geald
ehyd
e 11.6
m
[360 mV]
syrin
gic ac
id 9.2
1m
feruli
c acid
14.9m
euge
nol 2
9.1m
[300 mV]
sinap
ic ac
id 14
.4m
[240 mV][180 mV]
luteo
lin 25
.8m
[120 mV]
querc
etin 2
6.4m
[60 mV][0 mV]
0.00 10.00 20.00 30.00
0.00
0.20
0.40
0.60
0.80
1.00
1.20
1.40
Retention time (minutes)
Resp
onse
(µA) [900 mV]
4-hy
drox
ycou
mar
in 18
.3m
[840 mV][780 mV]
4-hy
drox
yben
zalde
hyde
salic
ylic
acid
14.6
m
[720 mV][660 mV]
4-hy
drox
yben
zyl a
lcoho
l 3.7
5m
[600 mV]
hydr
oxyp
heny
l ace
tic a
cid 7
.79m
[540 mV][480 mV]
valill
ic ac
id 8.
94m
[420 mV] hesp
eridi
n 18
.7m
[360 mV]
syrin
gic a
cid 9
.23m
feru
lic a
cid 1
5.0m
[300 mV]
sinap
ic ac
id 14
.1m
[240 mV]
3,4-
dihyd
roxy
benz
oic a
cid 4
.54m
[180 mV]
cate
chin
8.11
m
[120 mV][60 mV][0 mV]
FIGURE 3: HPLC-ECD Array chromatogram of Hoodia gordonii mixed parts extract #3165
FIGURE 4: HPLC-ECD Array chromatogram of Hoodia commercial product capsule extract HG4
FIGURE 5: HPLC-ECD Array chromatogram of Hoodia commercial product tablet extract HG6

3Thermo Scienti� c Poster Note • PN70540_E 03/13S
Pattern Recognition Analysis
Chromatographic data from either the charged aerosol detector or the Spectro-Electro array detector were pre-processed to align peak retention times by using the pattern recognition wizard in CoulArray 3.0 software and then imported into Pirouette software for PCA and HCA. PCA is a mathematical procedure that uses an orthogonal transformation to convert a set of observations of possibly correlated variables into a set of values of linearly uncorrelated variables called principal components. It is mostly used as a tool in exploratory data analysis and for making predictive models. The greatest variance by any projection of the data is found in the first coordinate (Factor 1), the second greatest variance is found on the second coordinate (Factor 2), and so on. Thus samples with different patterns in their chromatographic or electrochemical profile are distinguished from each other based on their relative position in three- dimensional space. The relationships among these data were used to investigate authenticity and differences in processing, e.g., dried plant parts, tablet, or capsule.
Profiling Hoodia Extracts by HPLC with Charged Aerosol Detection, Electrochemical Array Detection, and Principal Component AnalysisIan Acworth, Bruce Bailey, Marc Plante, Qi Zhang, David Thomas Thermo Fisher Scientific, Chelmsford, MA
Conclusion• Gradient HPLC with charged aerosol or electrochemical array detection are simple
approaches that generate information-rich chemical profile data. Both detectors can reveal analytes overlooked by UV detection alone.
• Chemical profile data can be imported into pattern recognition software and with principal components analysis used to readily identify product authenticity.
• The combined chromatographic/chemometric approach was verified by applying it to known test samples, but can be readily applied to quickly screen unknown samples.
References1. Avula, B.; Wang, Y.-H.; Pawar, R.S.; Shukla, Y.J.; Smillie, T.J.; Khan, I.A.
A rapid method for chemical fingerprint analysis of Hoodia species, related genera, and dietary supplements using UPLC–UV–MS J. Pharm. Biomed. Anal. 2008, 48, 722–731.
2. Gamache, P.; Acworth, I.; Lynch, M.; and Matson, W. Coulometric Array Detection for HPLC In the analysis of Juice Products in Methods to Detect Adulteration of Fruit Juice Beverages; Nagy, S., Wade, R., Eds.; AGSCIENCE USA, Inc.1995; Vol. 1, pp 120-144.
AcknowledgementsWe would like to thank Drs. Ikhlas Khan and Bharathi Avula of the National Center for Natural Products Research at The University of Mississippi, Oxford, MS, for providing the plant materials and hoodigoside standards used in this study.
FIGURE 1. HPLC with charged aerosol detection identifies hoodigosides in a standard with precision and sensitivity; overlay of seven injections, 10 mg/L
© 2013 Thermo Fisher Scientific Inc. All rights reserved. Pirouette is a registered trademark of Informetrix, Inc.All other trademarks are the property of Thermo Fisher Scientific and its subsidiaries. This information is not intended to encourage use of these products in any manners that might infringe the intellectual property rights of others.
PO70540_E 03/13S
FIGURE 2. HPLC-CAD chromatograms of methanolic extracts from Hoodiagordonii, Hoodia gordonii (from Namibia), and Opuntia leptocaulis
FIGURE 6. PCA score plot for ECD array data from channels 1–16. MethodsHPLC with Charged Aerosol Detection
HPLC System: Thermo Scientific™ Dionex™ UltiMate™ 3000 RSLC system with a:- DAD–3000RS Diode Array Detector and a - Corona™ ultra RS™ Charged Aerosol Detector:Nebulizer Temperature: 25 °CPower function: 1.00Data collection rate: 20 Hz
Data Analysis: Thermo Scientific™ Dionex™ Chromeleon™ ChromatographyData System software, 7.1 SR1
Column: Thermo Scientific™ Accucore™ C8, 4.6 × 150 mm; 2.6 µm
Temp.: 40 oCInjection Vol.: 10 µLFlow Rate: 2.0 mL/minMobile Phase A: Deionized water Mobile Phase B: Acetonitrile, Fisher Scientific™ Optima™ LCMSGradient: 40%B to 47%B in 2.5 min; to 95%B in 15 min; hold 10 min.
HPLC with Spectro-Electro Array Detection
HPLC System: Thermo Scientific™ Dionex™ UltiMate™ 3000 RS system with a- DAD–3000RS Diode Array Detector- CoulArray™ Electrochemical Array Detector:16-channel array from 0 to +900 mV versus Pd in +60 mV steps
Data Analysis: Thermo Scientific™ Dionex™ Chromeleon™ Chromatography Data System 6.8 and CoulArray 3.0 software.
Column: Thermo Scientific™ Acclaim™ C18, 3 × 150 mm; 3 µm
Temperature: 35 oCFlow Rate: 0.65 mL/minInjection Vol.: 10 µLMobile Phase A: 20 mM Monobasic sodium phosphate, 3% acetonitrile, ` 0.2% tetrahydrofuran, pH 3.35Mobile Phase B: 20 mM Monobasic sodium phosphate, 50% acetonitrile,
10% tetrahydrofuran, pH 3.45Mobile Phase C: Methanol, Optima LCMS
Gradient:
Sample Preparation
50 mg powder from a commercially available capsule was placed into a 2 mL centrifuge tube. One 1 mL methanol was added and the mixture vortexed for 10 min. The supernatant was transferred to a 5 mL volumetric flask. Extraction was repeated two times with fresh methanol and the extracts combined. After bringing to volume with methanol and mixing, an aliquot was centrifuged in a 1 mL centrifuge tube at 13,000 rpm for 10 min and the supernatant transferred to a glass HPLC autosampler vial.
Data Analysis
Principal components analysis (PCA) and cluster analysis (HCA) were used to investigate pattern differences in chromatograms represented as detector response versus retention time. Data were aligned by using the Pattern Recognition Wizard in CoulArray for Windows 3.0 software and imported into Pirouette® Comprehensive Chemometrics modeling software version 4.5 for PCA and HCA.
ResultsChromatography
Method 1: HPLC-Charged aerosol detection
A mixture of eight hoodigosides eluted with baseline resolution within 10 min from the Accucore C8 column under an aqueous/solvent gradient ranging from 40–95% acetonitrile over 15 min (Figure 1). After separation was achieved, the column was washed for an additional 10 min with 95% acetonitrile to ensure complete elution of hydrophobic compounds that might be present in sample extracts. Good precision and ample response can be seen in this overlay of seven injections of a 10 mg/L standard and diluent blank.
The chromatograms obtained from sample extracts are very complex, with many peaks eluting before, during and after the retention time window of the hoodigoside standards. Figure 2 shows example chromatograms obtained from extracts of dried Hoodia gordonii mixed parts. In most cases, the individual hoodigosides were resolved sufficiently to permit their accurate identification and quantification in the sample mixtures. Some of the extracts included peaks that coeluted with the standard hoodigosides. Note that in many of the extracts there were several hydrophobic compounds that eluted between 15 and 25 min that are not well detected at 220 nm, but were well detected by the charged aerosol detector. Calibration curves were obtained from standard injections ranging from 0.10 to 100 mg/L (not shown). The calibration curves spanned four orders of magnitude, had a quadratic fit to the data and yielded a correlation coefficient of > 0.999 for each standard hoodigoside.
Time(min)
Flow(mL/min)
%A %B %C Curve
0 0.65 92 5 3 52 0.65 92 5 3 7 (concave)30 0.65 0 97 3 7 (concave)45 0.65 0 97 3 545 0.65 92 5 3 550 0.65 92 5 3 5
OverviewPurpose: To combine fast and sensitive HPLC methods with chemometric analysis to profile botanical extracts from the botanical supplement Hoodia gordonii.
Methods: Hoodia extracts were analyzed by gradient reversed-phase high performance liquid chromatography with either a charged aerosol detector or photodiode array detector in series with an electrochemical array detector (the spectro-electro array). Chromatographic data were interrogated by chemometric software to identify patterns related to differences in plant species, origin or processing.
Results: Unsupervised chemometric evaluation of the information rich data obtained from HPLC with charged aerosol detection and electrochemical array detection correctly identified differences in sample origin and processing.
IntroductionHoodigosides are oxypregnane steroidal glycosides abundant in Hoodia gordoniiand related plants native to the deserts of southwestern Africa. These plants, used traditionally to ease hunger during long hunting expeditions, enjoy wide use today in dietary supplements purported to aid in appetite suppression and weight loss.
Presented are two approaches to profile Hoodia related products. In the first approach, Hoodia extracts were analyzed by HPLC with charged aerosol detection. Eight hoodigosides isolated from dried plant material are separated within 15 min on a solid core C8 analytical column that delivers superb resolution with low backpressure. With low-nanogram sensitivity, the charged aerosol detector responds uniformly to all non-volatile species including the target analytes, degradation products and impurities that may not possess a chromophore.
In the second approach, Hoodia extracts were analyzed by HPLC with an online electrochemical array detector that responds to redox active compounds such as polyphenols. Each of the sixteen sensors in the electrochemical array detects analytes at a unique potential to yield picogram on-column sensitivity for diverse compounds that vary widely in redox properties. The chromatograms resulting from this voltammetric approach often clearly resolve co-eluting compounds.
These two techniques provide complementary data that are used to quantify known compounds. The complex patterns of known and unknown compounds revealed by the detectors were also interrogated by pattern recognition software to support inferences on product quality, authenticity, adulteration, or origin. Limits of detection, linear and dynamic range, precision, and pattern recognition results are compared for the two approaches.
Method 2: HPLC-Spectro-Electro Array.
Chromatographic results:
The Spectro-Electro Array makes use of both spectrophotometric and electrochemical data. While UV detection provides identification and quantification of the major components in a sample, EC array detection is incredibly sensitive and is capable of measuring compounds missed by UV. Furthermore, the EC array can voltammatrically resolve compounds that co-elute chromatographically, and the redox behavior of a compound reacting across the array provides qualitative information that can be used for analyte identification/authentication. The CoulArray is particularly suitable for generating chemical fingerprints of supplements containing endogenous electroactivecompounds that are essential to flavor, color and stability. The HPLC method used with the Spectro-Electro Array was optimized to resolve the earlier-eluting more polar components in the samples. Illustrative examples of HPLC-ECD Array chromatograms obtained for a few of the samples analyzed are shown in Figure 3–5. As can be seen, these extracts contain many species that are electrochemically active.
FIGURE 3. PCA score plot of CAD data, only hoodigoside response were used for PCA analysis
Factor 1 (72.7%)
Factor 2 (10.8%)
Factor 3 (6.3%)
3165
29272926
2915
HG5
HG6
3229
2925
MPG
3126
HG1
3558
A score plot from the HPLC-Charged aerosol detection data is shown in Figure 3 and discussed in that section. A score plot from PCA analysis of the ECD array (CoulArray)data is shown in Figure 6. Samples 2821, 2799 and HG4 were excluded as outliers before PCA analysis because of problems with the chromatography. PCA readily identifies three major groups among the remaining samples. One group contains only sample 2915, from the non-hoodia species Opuntia leptocaulis. Another group corresponds to the samples processed into capsules or tablets. The third set, within the black circle, corresponds to authentic Hoodia gordonii dried plant material. In each case, the results from the unsupervised chemometric analysis correspond to plainly observable characteristics of the samples, allowing us to verify the accuracy of the approach. The real power of this combined chromatographic/chemometric approach is that it can be implemented in a more or less automated way to quickly screen unknown samples.
Factor 1 (85.5%)
Factor 2 (8.2%)
Factor 3 (4.6%)
3229
2925
MPG-D046
3165
2927
2926
2915HG1HG5HG635582821
2799
3126
HG4
Figure 3 shows the PCA score plot of the hoodigosides data acquired by charged aerosol detection. Capsule samples HG1 and HG5, tablet samples HG-6 and 3558, and sample vial 2915 containing Opuntia leptocaulis form a distinct cluster. The primary difference between these clusters is identified as hoodigoside content. (A description of the pattern recognition analysis is provided below.)
0.00 10.00 20.00 30.00
0.00
0.20
0.40
0.60
0.80
1.00
1.20
1.40
Retention time (minutes)
Resp
onse
(µA) [900 mV]
[840 mV][780 mV]
4-hyd
roxyb
enza
ldehy
de 9.
76m
salic
ylic a
cid 15
.3m
[720 mV][660 mV]
4-hyd
roxyb
enzy
l alco
hol 3
.87m
[600 mV]
vanil
lin 11
.0m
[540 mV]
ethyl
vanil
lin 16
.2m
cava
rcrol
31.9m
[480 mV]
valilli
c acid
8.93
m
[420 mV]
syrin
geald
ehyd
e 11.6
m
[360 mV]
syrin
gic ac
id 9.2
2m
feruli
c acid
14.9m
euge
nol 2
9.1m
[300 mV] sinap
ic ac
id 14
.2m
[240 mV][180 mV]
luteo
lin 25
.8m
[120 mV][60 mV][0 mV]
0.00 10.00 20.00 30.00
0.00
0.20
0.40
0.60
0.80
1.00
1.20
1.40
Retention time (minutes)
Resp
onse
(µA) [900 mV]
4-hyd
roxyc
ouma
rin 18
.8m
[840 mV][780 mV][720 mV][660 mV]
4-hyd
roxyb
enzy
l alco
hol 3
.75m
[600 mV]
vanil
lin 11
.0m
[540 mV]
ethyl
vanil
lin 16
.8m
thymo
l 31.9
m ca
varcr
ol 32
.1m
[480 mV]
valilli
c acid
8.92
m
[420 mV]
syrin
geald
ehyd
e 11.6
m
[360 mV]
syrin
gic ac
id 9.2
1m
feruli
c acid
14.9m
euge
nol 2
9.1m
[300 mV]
sinap
ic ac
id 14
.4m
[240 mV][180 mV]
luteo
lin 25
.8m
[120 mV]
querc
etin 2
6.4m
[60 mV][0 mV]
0.00 10.00 20.00 30.00
0.00
0.20
0.40
0.60
0.80
1.00
1.20
1.40
Retention time (minutes)
Resp
onse
(µA) [900 mV]
4-hy
drox
ycou
mar
in 18
.3m
[840 mV][780 mV]
4-hy
drox
yben
zalde
hyde
salic
ylic
acid
14.6
m
[720 mV][660 mV]
4-hy
drox
yben
zyl a
lcoho
l 3.7
5m
[600 mV]
hydr
oxyp
heny
l ace
tic a
cid 7
.79m
[540 mV][480 mV]
valill
ic ac
id 8.
94m
[420 mV] hesp
eridi
n 18
.7m
[360 mV]
syrin
gic a
cid 9
.23m
feru
lic a
cid 1
5.0m
[300 mV]
sinap
ic ac
id 14
.1m
[240 mV]
3,4-
dihyd
roxy
benz
oic a
cid 4
.54m
[180 mV]
cate
chin
8.11
m
[120 mV][60 mV][0 mV]
FIGURE 3: HPLC-ECD Array chromatogram of Hoodia gordonii mixed parts extract #3165
FIGURE 4: HPLC-ECD Array chromatogram of Hoodia commercial product capsule extract HG4
FIGURE 5: HPLC-ECD Array chromatogram of Hoodia commercial product tablet extract HG6
4 Pro� ling Hoodia Extracts by HPLC with Charged Aerosol Detection, Electrochemical Array Detection, and Principal Component Analysis
Pattern Recognition Analysis
Chromatographic data from either the charged aerosol detector or the Spectro-Electro array detector were pre-processed to align peak retention times by using the pattern recognition wizard in CoulArray 3.0 software and then imported into Pirouette software for PCA and HCA. PCA is a mathematical procedure that uses an orthogonal transformation to convert a set of observations of possibly correlated variables into a set of values of linearly uncorrelated variables called principal components. It is mostly used as a tool in exploratory data analysis and for making predictive models. The greatest variance by any projection of the data is found in the first coordinate (Factor 1), the second greatest variance is found on the second coordinate (Factor 2), and so on. Thus samples with different patterns in their chromatographic or electrochemical profile are distinguished from each other based on their relative position in three- dimensional space. The relationships among these data were used to investigate authenticity and differences in processing, e.g., dried plant parts, tablet, or capsule.
Profiling Hoodia Extracts by HPLC with Charged Aerosol Detection, Electrochemical Array Detection, and Principal Component AnalysisIan Acworth, Bruce Bailey, Marc Plante, Qi Zhang, David Thomas Thermo Fisher Scientific, Chelmsford, MA
Conclusion• Gradient HPLC with charged aerosol or electrochemical array detection are simple
approaches that generate information-rich chemical profile data. Both detectors can reveal analytes overlooked by UV detection alone.
• Chemical profile data can be imported into pattern recognition software and with principal components analysis used to readily identify product authenticity.
• The combined chromatographic/chemometric approach was verified by applying it to known test samples, but can be readily applied to quickly screen unknown samples.
References1. Avula, B.; Wang, Y.-H.; Pawar, R.S.; Shukla, Y.J.; Smillie, T.J.; Khan, I.A.
A rapid method for chemical fingerprint analysis of Hoodia species, related genera, and dietary supplements using UPLC–UV–MS J. Pharm. Biomed. Anal. 2008, 48, 722–731.
2. Gamache, P.; Acworth, I.; Lynch, M.; and Matson, W. Coulometric Array Detection for HPLC In the analysis of Juice Products in Methods to Detect Adulteration of Fruit Juice Beverages; Nagy, S., Wade, R., Eds.; AGSCIENCE USA, Inc.1995; Vol. 1, pp 120-144.
AcknowledgementsWe would like to thank Drs. Ikhlas Khan and Bharathi Avula of the National Center for Natural Products Research at The University of Mississippi, Oxford, MS, for providing the plant materials and hoodigoside standards used in this study.
FIGURE 1. HPLC with charged aerosol detection identifies hoodigosides in a standard with precision and sensitivity; overlay of seven injections, 10 mg/L
© 2013 Thermo Fisher Scientific Inc. All rights reserved. Pirouette is a registered trademark of Informetrix, Inc.All other trademarks are the property of Thermo Fisher Scientific and its subsidiaries. This information is not intended to encourage use of these products in any manners that might infringe the intellectual property rights of others.
PO70540_E 03/13S
FIGURE 2. HPLC-CAD chromatograms of methanolic extracts from Hoodiagordonii, Hoodia gordonii (from Namibia), and Opuntia leptocaulis
FIGURE 6. PCA score plot for ECD array data from channels 1–16. MethodsHPLC with Charged Aerosol Detection
HPLC System: Thermo Scientific™ Dionex™ UltiMate™ 3000 RSLC system with a:- DAD–3000RS Diode Array Detector and a - Corona™ ultra RS™ Charged Aerosol Detector:Nebulizer Temperature: 25 °CPower function: 1.00Data collection rate: 20 Hz
Data Analysis: Thermo Scientific™ Dionex™ Chromeleon™ ChromatographyData System software, 7.1 SR1
Column: Thermo Scientific™ Accucore™ C8, 4.6 × 150 mm; 2.6 µm
Temp.: 40 oCInjection Vol.: 10 µLFlow Rate: 2.0 mL/minMobile Phase A: Deionized water Mobile Phase B: Acetonitrile, Fisher Scientific™ Optima™ LCMSGradient: 40%B to 47%B in 2.5 min; to 95%B in 15 min; hold 10 min.
HPLC with Spectro-Electro Array Detection
HPLC System: Thermo Scientific™ Dionex™ UltiMate™ 3000 RS system with a- DAD–3000RS Diode Array Detector- CoulArray™ Electrochemical Array Detector:16-channel array from 0 to +900 mV versus Pd in +60 mV steps
Data Analysis: Thermo Scientific™ Dionex™ Chromeleon™ Chromatography Data System 6.8 and CoulArray 3.0 software.
Column: Thermo Scientific™ Acclaim™ C18, 3 × 150 mm; 3 µm
Temperature: 35 oCFlow Rate: 0.65 mL/minInjection Vol.: 10 µLMobile Phase A: 20 mM Monobasic sodium phosphate, 3% acetonitrile, ` 0.2% tetrahydrofuran, pH 3.35Mobile Phase B: 20 mM Monobasic sodium phosphate, 50% acetonitrile,
10% tetrahydrofuran, pH 3.45Mobile Phase C: Methanol, Optima LCMS
Gradient:
Sample Preparation
50 mg powder from a commercially available capsule was placed into a 2 mL centrifuge tube. One 1 mL methanol was added and the mixture vortexed for 10 min. The supernatant was transferred to a 5 mL volumetric flask. Extraction was repeated two times with fresh methanol and the extracts combined. After bringing to volume with methanol and mixing, an aliquot was centrifuged in a 1 mL centrifuge tube at 13,000 rpm for 10 min and the supernatant transferred to a glass HPLC autosampler vial.
Data Analysis
Principal components analysis (PCA) and cluster analysis (HCA) were used to investigate pattern differences in chromatograms represented as detector response versus retention time. Data were aligned by using the Pattern Recognition Wizard in CoulArray for Windows 3.0 software and imported into Pirouette® Comprehensive Chemometrics modeling software version 4.5 for PCA and HCA.
ResultsChromatography
Method 1: HPLC-Charged aerosol detection
A mixture of eight hoodigosides eluted with baseline resolution within 10 min from the Accucore C8 column under an aqueous/solvent gradient ranging from 40–95% acetonitrile over 15 min (Figure 1). After separation was achieved, the column was washed for an additional 10 min with 95% acetonitrile to ensure complete elution of hydrophobic compounds that might be present in sample extracts. Good precision and ample response can be seen in this overlay of seven injections of a 10 mg/L standard and diluent blank.
The chromatograms obtained from sample extracts are very complex, with many peaks eluting before, during and after the retention time window of the hoodigoside standards. Figure 2 shows example chromatograms obtained from extracts of dried Hoodia gordonii mixed parts. In most cases, the individual hoodigosides were resolved sufficiently to permit their accurate identification and quantification in the sample mixtures. Some of the extracts included peaks that coeluted with the standard hoodigosides. Note that in many of the extracts there were several hydrophobic compounds that eluted between 15 and 25 min that are not well detected at 220 nm, but were well detected by the charged aerosol detector. Calibration curves were obtained from standard injections ranging from 0.10 to 100 mg/L (not shown). The calibration curves spanned four orders of magnitude, had a quadratic fit to the data and yielded a correlation coefficient of > 0.999 for each standard hoodigoside.
Time(min)
Flow(mL/min)
%A %B %C Curve
0 0.65 92 5 3 52 0.65 92 5 3 7 (concave)30 0.65 0 97 3 7 (concave)45 0.65 0 97 3 545 0.65 92 5 3 550 0.65 92 5 3 5
OverviewPurpose: To combine fast and sensitive HPLC methods with chemometric analysis to profile botanical extracts from the botanical supplement Hoodia gordonii.
Methods: Hoodia extracts were analyzed by gradient reversed-phase high performance liquid chromatography with either a charged aerosol detector or photodiode array detector in series with an electrochemical array detector (the spectro-electro array). Chromatographic data were interrogated by chemometric software to identify patterns related to differences in plant species, origin or processing.
Results: Unsupervised chemometric evaluation of the information rich data obtained from HPLC with charged aerosol detection and electrochemical array detection correctly identified differences in sample origin and processing.
IntroductionHoodigosides are oxypregnane steroidal glycosides abundant in Hoodia gordoniiand related plants native to the deserts of southwestern Africa. These plants, used traditionally to ease hunger during long hunting expeditions, enjoy wide use today in dietary supplements purported to aid in appetite suppression and weight loss.
Presented are two approaches to profile Hoodia related products. In the first approach, Hoodia extracts were analyzed by HPLC with charged aerosol detection. Eight hoodigosides isolated from dried plant material are separated within 15 min on a solid core C8 analytical column that delivers superb resolution with low backpressure. With low-nanogram sensitivity, the charged aerosol detector responds uniformly to all non-volatile species including the target analytes, degradation products and impurities that may not possess a chromophore.
In the second approach, Hoodia extracts were analyzed by HPLC with an online electrochemical array detector that responds to redox active compounds such as polyphenols. Each of the sixteen sensors in the electrochemical array detects analytes at a unique potential to yield picogram on-column sensitivity for diverse compounds that vary widely in redox properties. The chromatograms resulting from this voltammetric approach often clearly resolve co-eluting compounds.
These two techniques provide complementary data that are used to quantify known compounds. The complex patterns of known and unknown compounds revealed by the detectors were also interrogated by pattern recognition software to support inferences on product quality, authenticity, adulteration, or origin. Limits of detection, linear and dynamic range, precision, and pattern recognition results are compared for the two approaches.
Method 2: HPLC-Spectro-Electro Array.
Chromatographic results:
The Spectro-Electro Array makes use of both spectrophotometric and electrochemical data. While UV detection provides identification and quantification of the major components in a sample, EC array detection is incredibly sensitive and is capable of measuring compounds missed by UV. Furthermore, the EC array can voltammatrically resolve compounds that co-elute chromatographically, and the redox behavior of a compound reacting across the array provides qualitative information that can be used for analyte identification/authentication. The CoulArray is particularly suitable for generating chemical fingerprints of supplements containing endogenous electroactivecompounds that are essential to flavor, color and stability. The HPLC method used with the Spectro-Electro Array was optimized to resolve the earlier-eluting more polar components in the samples. Illustrative examples of HPLC-ECD Array chromatograms obtained for a few of the samples analyzed are shown in Figure 3–5. As can be seen, these extracts contain many species that are electrochemically active.
FIGURE 3. PCA score plot of CAD data, only hoodigoside response were used for PCA analysis
Factor 1 (72.7%)
Factor 2 (10.8%)
Factor 3 (6.3%)
3165
29272926
2915
HG5
HG6
3229
2925
MPG
3126
HG1
3558
A score plot from the HPLC-Charged aerosol detection data is shown in Figure 3 and discussed in that section. A score plot from PCA analysis of the ECD array (CoulArray)data is shown in Figure 6. Samples 2821, 2799 and HG4 were excluded as outliers before PCA analysis because of problems with the chromatography. PCA readily identifies three major groups among the remaining samples. One group contains only sample 2915, from the non-hoodia species Opuntia leptocaulis. Another group corresponds to the samples processed into capsules or tablets. The third set, within the black circle, corresponds to authentic Hoodia gordonii dried plant material. In each case, the results from the unsupervised chemometric analysis correspond to plainly observable characteristics of the samples, allowing us to verify the accuracy of the approach. The real power of this combined chromatographic/chemometric approach is that it can be implemented in a more or less automated way to quickly screen unknown samples.
Factor 1 (85.5%)
Factor 2 (8.2%)
Factor 3 (4.6%)
3229
2925
MPG-D046
3165
2927
2926
2915HG1HG5HG635582821
2799
3126
HG4
Figure 3 shows the PCA score plot of the hoodigosides data acquired by charged aerosol detection. Capsule samples HG1 and HG5, tablet samples HG-6 and 3558, and sample vial 2915 containing Opuntia leptocaulis form a distinct cluster. The primary difference between these clusters is identified as hoodigoside content. (A description of the pattern recognition analysis is provided below.)
0.00 10.00 20.00 30.00
0.00
0.20
0.40
0.60
0.80
1.00
1.20
1.40
Retention time (minutes)
Resp
onse
(µA) [900 mV]
[840 mV][780 mV]
4-hyd
roxyb
enza
ldehy
de 9.
76m
salic
ylic a
cid 15
.3m
[720 mV][660 mV]
4-hyd
roxyb
enzy
l alco
hol 3
.87m
[600 mV]
vanil
lin 11
.0m
[540 mV]
ethyl
vanil
lin 16
.2m
cava
rcrol
31.9m
[480 mV]
valilli
c acid
8.93
m
[420 mV]
syrin
geald
ehyd
e 11.6
m
[360 mV]
syrin
gic ac
id 9.2
2m
feruli
c acid
14.9m
euge
nol 2
9.1m
[300 mV] sinap
ic ac
id 14
.2m
[240 mV][180 mV]
luteo
lin 25
.8m
[120 mV][60 mV][0 mV]
0.00 10.00 20.00 30.00
0.00
0.20
0.40
0.60
0.80
1.00
1.20
1.40
Retention time (minutes)
Resp
onse
(µA) [900 mV]
4-hyd
roxyc
ouma
rin 18
.8m
[840 mV][780 mV][720 mV][660 mV]
4-hyd
roxyb
enzy
l alco
hol 3
.75m
[600 mV]
vanil
lin 11
.0m
[540 mV]
ethyl
vanil
lin 16
.8m
thymo
l 31.9
m ca
varcr
ol 32
.1m
[480 mV]
valilli
c acid
8.92
m
[420 mV]
syrin
geald
ehyd
e 11.6
m
[360 mV]
syrin
gic ac
id 9.2
1m
feruli
c acid
14.9m
euge
nol 2
9.1m
[300 mV]
sinap
ic ac
id 14
.4m
[240 mV][180 mV]
luteo
lin 25
.8m
[120 mV]
querc
etin 2
6.4m
[60 mV][0 mV]
0.00 10.00 20.00 30.00
0.00
0.20
0.40
0.60
0.80
1.00
1.20
1.40
Retention time (minutes)
Resp
onse
(µA) [900 mV]
4-hy
drox
ycou
mar
in 18
.3m
[840 mV][780 mV]
4-hy
drox
yben
zalde
hyde
salic
ylic
acid
14.6
m
[720 mV][660 mV]
4-hy
drox
yben
zyl a
lcoho
l 3.7
5m
[600 mV]
hydr
oxyp
heny
l ace
tic a
cid 7
.79m
[540 mV][480 mV]
valill
ic ac
id 8.
94m
[420 mV] hesp
eridi
n 18
.7m
[360 mV]
syrin
gic a
cid 9
.23m
feru
lic a
cid 1
5.0m
[300 mV]
sinap
ic ac
id 14
.1m
[240 mV]
3,4-
dihyd
roxy
benz
oic a
cid 4
.54m
[180 mV]
cate
chin
8.11
m
[120 mV][60 mV][0 mV]
FIGURE 3: HPLC-ECD Array chromatogram of Hoodia gordonii mixed parts extract #3165
FIGURE 4: HPLC-ECD Array chromatogram of Hoodia commercial product capsule extract HG4
FIGURE 5: HPLC-ECD Array chromatogram of Hoodia commercial product tablet extract HG6
5Thermo Scienti� c Poster Note • PN70540_E 03/13S
Pattern Recognition Analysis
Chromatographic data from either the charged aerosol detector or the Spectro-Electro array detector were pre-processed to align peak retention times by using the pattern recognition wizard in CoulArray 3.0 software and then imported into Pirouette software for PCA and HCA. PCA is a mathematical procedure that uses an orthogonal transformation to convert a set of observations of possibly correlated variables into a set of values of linearly uncorrelated variables called principal components. It is mostly used as a tool in exploratory data analysis and for making predictive models. The greatest variance by any projection of the data is found in the first coordinate (Factor 1), the second greatest variance is found on the second coordinate (Factor 2), and so on. Thus samples with different patterns in their chromatographic or electrochemical profile are distinguished from each other based on their relative position in three- dimensional space. The relationships among these data were used to investigate authenticity and differences in processing, e.g., dried plant parts, tablet, or capsule.
Profiling Hoodia Extracts by HPLC with Charged Aerosol Detection, Electrochemical Array Detection, and Principal Component AnalysisIan Acworth, Bruce Bailey, Marc Plante, Qi Zhang, David Thomas Thermo Fisher Scientific, Chelmsford, MA
Conclusion• Gradient HPLC with charged aerosol or electrochemical array detection are simple
approaches that generate information-rich chemical profile data. Both detectors can reveal analytes overlooked by UV detection alone.
• Chemical profile data can be imported into pattern recognition software and with principal components analysis used to readily identify product authenticity.
• The combined chromatographic/chemometric approach was verified by applying it to known test samples, but can be readily applied to quickly screen unknown samples.
References1. Avula, B.; Wang, Y.-H.; Pawar, R.S.; Shukla, Y.J.; Smillie, T.J.; Khan, I.A.
A rapid method for chemical fingerprint analysis of Hoodia species, related genera, and dietary supplements using UPLC–UV–MS J. Pharm. Biomed. Anal. 2008, 48, 722–731.
2. Gamache, P.; Acworth, I.; Lynch, M.; and Matson, W. Coulometric Array Detection for HPLC In the analysis of Juice Products in Methods to Detect Adulteration of Fruit Juice Beverages; Nagy, S., Wade, R., Eds.; AGSCIENCE USA, Inc.1995; Vol. 1, pp 120-144.
AcknowledgementsWe would like to thank Drs. Ikhlas Khan and Bharathi Avula of the National Center for Natural Products Research at The University of Mississippi, Oxford, MS, for providing the plant materials and hoodigoside standards used in this study.
FIGURE 1. HPLC with charged aerosol detection identifies hoodigosides in a standard with precision and sensitivity; overlay of seven injections, 10 mg/L
© 2013 Thermo Fisher Scientific Inc. All rights reserved. Pirouette is a registered trademark of Informetrix, Inc.All other trademarks are the property of Thermo Fisher Scientific and its subsidiaries. This information is not intended to encourage use of these products in any manners that might infringe the intellectual property rights of others.
PO70540_E 03/13S
FIGURE 2. HPLC-CAD chromatograms of methanolic extracts from Hoodiagordonii, Hoodia gordonii (from Namibia), and Opuntia leptocaulis
FIGURE 6. PCA score plot for ECD array data from channels 1–16. MethodsHPLC with Charged Aerosol Detection
HPLC System: Thermo Scientific™ Dionex™ UltiMate™ 3000 RSLC system with a:- DAD–3000RS Diode Array Detector and a - Corona™ ultra RS™ Charged Aerosol Detector:Nebulizer Temperature: 25 °CPower function: 1.00Data collection rate: 20 Hz
Data Analysis: Thermo Scientific™ Dionex™ Chromeleon™ ChromatographyData System software, 7.1 SR1
Column: Thermo Scientific™ Accucore™ C8, 4.6 × 150 mm; 2.6 µm
Temp.: 40 oCInjection Vol.: 10 µLFlow Rate: 2.0 mL/minMobile Phase A: Deionized water Mobile Phase B: Acetonitrile, Fisher Scientific™ Optima™ LCMSGradient: 40%B to 47%B in 2.5 min; to 95%B in 15 min; hold 10 min.
HPLC with Spectro-Electro Array Detection
HPLC System: Thermo Scientific™ Dionex™ UltiMate™ 3000 RS system with a- DAD–3000RS Diode Array Detector- CoulArray™ Electrochemical Array Detector:16-channel array from 0 to +900 mV versus Pd in +60 mV steps
Data Analysis: Thermo Scientific™ Dionex™ Chromeleon™ Chromatography Data System 6.8 and CoulArray 3.0 software.
Column: Thermo Scientific™ Acclaim™ C18, 3 × 150 mm; 3 µm
Temperature: 35 oCFlow Rate: 0.65 mL/minInjection Vol.: 10 µLMobile Phase A: 20 mM Monobasic sodium phosphate, 3% acetonitrile, ` 0.2% tetrahydrofuran, pH 3.35Mobile Phase B: 20 mM Monobasic sodium phosphate, 50% acetonitrile,
10% tetrahydrofuran, pH 3.45Mobile Phase C: Methanol, Optima LCMS
Gradient:
Sample Preparation
50 mg powder from a commercially available capsule was placed into a 2 mL centrifuge tube. One 1 mL methanol was added and the mixture vortexed for 10 min. The supernatant was transferred to a 5 mL volumetric flask. Extraction was repeated two times with fresh methanol and the extracts combined. After bringing to volume with methanol and mixing, an aliquot was centrifuged in a 1 mL centrifuge tube at 13,000 rpm for 10 min and the supernatant transferred to a glass HPLC autosampler vial.
Data Analysis
Principal components analysis (PCA) and cluster analysis (HCA) were used to investigate pattern differences in chromatograms represented as detector response versus retention time. Data were aligned by using the Pattern Recognition Wizard in CoulArray for Windows 3.0 software and imported into Pirouette® Comprehensive Chemometrics modeling software version 4.5 for PCA and HCA.
ResultsChromatography
Method 1: HPLC-Charged aerosol detection
A mixture of eight hoodigosides eluted with baseline resolution within 10 min from the Accucore C8 column under an aqueous/solvent gradient ranging from 40–95% acetonitrile over 15 min (Figure 1). After separation was achieved, the column was washed for an additional 10 min with 95% acetonitrile to ensure complete elution of hydrophobic compounds that might be present in sample extracts. Good precision and ample response can be seen in this overlay of seven injections of a 10 mg/L standard and diluent blank.
The chromatograms obtained from sample extracts are very complex, with many peaks eluting before, during and after the retention time window of the hoodigoside standards. Figure 2 shows example chromatograms obtained from extracts of dried Hoodia gordonii mixed parts. In most cases, the individual hoodigosides were resolved sufficiently to permit their accurate identification and quantification in the sample mixtures. Some of the extracts included peaks that coeluted with the standard hoodigosides. Note that in many of the extracts there were several hydrophobic compounds that eluted between 15 and 25 min that are not well detected at 220 nm, but were well detected by the charged aerosol detector. Calibration curves were obtained from standard injections ranging from 0.10 to 100 mg/L (not shown). The calibration curves spanned four orders of magnitude, had a quadratic fit to the data and yielded a correlation coefficient of > 0.999 for each standard hoodigoside.
Time(min)
Flow(mL/min)
%A %B %C Curve
0 0.65 92 5 3 52 0.65 92 5 3 7 (concave)30 0.65 0 97 3 7 (concave)45 0.65 0 97 3 545 0.65 92 5 3 550 0.65 92 5 3 5
OverviewPurpose: To combine fast and sensitive HPLC methods with chemometric analysis to profile botanical extracts from the botanical supplement Hoodia gordonii.
Methods: Hoodia extracts were analyzed by gradient reversed-phase high performance liquid chromatography with either a charged aerosol detector or photodiode array detector in series with an electrochemical array detector (the spectro-electro array). Chromatographic data were interrogated by chemometric software to identify patterns related to differences in plant species, origin or processing.
Results: Unsupervised chemometric evaluation of the information rich data obtained from HPLC with charged aerosol detection and electrochemical array detection correctly identified differences in sample origin and processing.
IntroductionHoodigosides are oxypregnane steroidal glycosides abundant in Hoodia gordoniiand related plants native to the deserts of southwestern Africa. These plants, used traditionally to ease hunger during long hunting expeditions, enjoy wide use today in dietary supplements purported to aid in appetite suppression and weight loss.
Presented are two approaches to profile Hoodia related products. In the first approach, Hoodia extracts were analyzed by HPLC with charged aerosol detection. Eight hoodigosides isolated from dried plant material are separated within 15 min on a solid core C8 analytical column that delivers superb resolution with low backpressure. With low-nanogram sensitivity, the charged aerosol detector responds uniformly to all non-volatile species including the target analytes, degradation products and impurities that may not possess a chromophore.
In the second approach, Hoodia extracts were analyzed by HPLC with an online electrochemical array detector that responds to redox active compounds such as polyphenols. Each of the sixteen sensors in the electrochemical array detects analytes at a unique potential to yield picogram on-column sensitivity for diverse compounds that vary widely in redox properties. The chromatograms resulting from this voltammetric approach often clearly resolve co-eluting compounds.
These two techniques provide complementary data that are used to quantify known compounds. The complex patterns of known and unknown compounds revealed by the detectors were also interrogated by pattern recognition software to support inferences on product quality, authenticity, adulteration, or origin. Limits of detection, linear and dynamic range, precision, and pattern recognition results are compared for the two approaches.
Method 2: HPLC-Spectro-Electro Array.
Chromatographic results:
The Spectro-Electro Array makes use of both spectrophotometric and electrochemical data. While UV detection provides identification and quantification of the major components in a sample, EC array detection is incredibly sensitive and is capable of measuring compounds missed by UV. Furthermore, the EC array can voltammatrically resolve compounds that co-elute chromatographically, and the redox behavior of a compound reacting across the array provides qualitative information that can be used for analyte identification/authentication. The CoulArray is particularly suitable for generating chemical fingerprints of supplements containing endogenous electroactivecompounds that are essential to flavor, color and stability. The HPLC method used with the Spectro-Electro Array was optimized to resolve the earlier-eluting more polar components in the samples. Illustrative examples of HPLC-ECD Array chromatograms obtained for a few of the samples analyzed are shown in Figure 3–5. As can be seen, these extracts contain many species that are electrochemically active.
FIGURE 3. PCA score plot of CAD data, only hoodigoside response were used for PCA analysis
Factor 1 (72.7%)
Factor 2 (10.8%)
Factor 3 (6.3%)
3165
29272926
2915
HG5
HG6
3229
2925
MPG
3126
HG1
3558
A score plot from the HPLC-Charged aerosol detection data is shown in Figure 3 and discussed in that section. A score plot from PCA analysis of the ECD array (CoulArray)data is shown in Figure 6. Samples 2821, 2799 and HG4 were excluded as outliers before PCA analysis because of problems with the chromatography. PCA readily identifies three major groups among the remaining samples. One group contains only sample 2915, from the non-hoodia species Opuntia leptocaulis. Another group corresponds to the samples processed into capsules or tablets. The third set, within the black circle, corresponds to authentic Hoodia gordonii dried plant material. In each case, the results from the unsupervised chemometric analysis correspond to plainly observable characteristics of the samples, allowing us to verify the accuracy of the approach. The real power of this combined chromatographic/chemometric approach is that it can be implemented in a more or less automated way to quickly screen unknown samples.
Factor 1 (85.5%)
Factor 2 (8.2%)
Factor 3 (4.6%)
3229
2925
MPG-D046
3165
2927
2926
2915HG1HG5HG635582821
2799
3126
HG4
Figure 3 shows the PCA score plot of the hoodigosides data acquired by charged aerosol detection. Capsule samples HG1 and HG5, tablet samples HG-6 and 3558, and sample vial 2915 containing Opuntia leptocaulis form a distinct cluster. The primary difference between these clusters is identified as hoodigoside content. (A description of the pattern recognition analysis is provided below.)
0.00 10.00 20.00 30.00
0.00
0.20
0.40
0.60
0.80
1.00
1.20
1.40
Retention time (minutes)
Resp
onse
(µA) [900 mV]
[840 mV][780 mV]
4-hyd
roxyb
enza
ldehy
de 9.
76m
salic
ylic a
cid 15
.3m
[720 mV][660 mV]
4-hyd
roxyb
enzy
l alco
hol 3
.87m
[600 mV]
vanil
lin 11
.0m
[540 mV]
ethyl
vanil
lin 16
.2m
cava
rcrol
31.9m
[480 mV]
valilli
c acid
8.93
m
[420 mV]
syrin
geald
ehyd
e 11.6
m
[360 mV]
syrin
gic ac
id 9.2
2m
feruli
c acid
14.9m
euge
nol 2
9.1m
[300 mV] sinap
ic ac
id 14
.2m
[240 mV][180 mV]
luteo
lin 25
.8m
[120 mV][60 mV][0 mV]
0.00 10.00 20.00 30.00
0.00
0.20
0.40
0.60
0.80
1.00
1.20
1.40
Retention time (minutes)
Resp
onse
(µA) [900 mV]
4-hyd
roxyc
ouma
rin 18
.8m
[840 mV][780 mV][720 mV][660 mV]
4-hyd
roxyb
enzy
l alco
hol 3
.75m
[600 mV]
vanil
lin 11
.0m
[540 mV]
ethyl
vanil
lin 16
.8m
thymo
l 31.9
m ca
varcr
ol 32
.1m
[480 mV]
valilli
c acid
8.92
m
[420 mV]
syrin
geald
ehyd
e 11.6
m
[360 mV]
syrin
gic ac
id 9.2
1m
feruli
c acid
14.9m
euge
nol 2
9.1m
[300 mV]
sinap
ic ac
id 14
.4m
[240 mV][180 mV]
luteo
lin 25
.8m
[120 mV]
querc
etin 2
6.4m
[60 mV][0 mV]
0.00 10.00 20.00 30.00
0.00
0.20
0.40
0.60
0.80
1.00
1.20
1.40
Retention time (minutes)
Resp
onse
(µA) [900 mV]
4-hy
drox
ycou
mar
in 18
.3m
[840 mV][780 mV]
4-hy
drox
yben
zalde
hyde
salic
ylic
acid
14.6
m
[720 mV][660 mV]
4-hy
drox
yben
zyl a
lcoho
l 3.7
5m
[600 mV]
hydr
oxyp
heny
l ace
tic a
cid 7
.79m
[540 mV][480 mV]
valill
ic ac
id 8.
94m
[420 mV] hesp
eridi
n 18
.7m
[360 mV]
syrin
gic a
cid 9
.23m
feru
lic a
cid 1
5.0m
[300 mV]
sinap
ic ac
id 14
.1m
[240 mV]
3,4-
dihyd
roxy
benz
oic a
cid 4
.54m
[180 mV]
cate
chin
8.11
m
[120 mV][60 mV][0 mV]
FIGURE 3: HPLC-ECD Array chromatogram of Hoodia gordonii mixed parts extract #3165
FIGURE 4: HPLC-ECD Array chromatogram of Hoodia commercial product capsule extract HG4
FIGURE 5: HPLC-ECD Array chromatogram of Hoodia commercial product tablet extract HG6

6 Pro� ling Hoodia Extracts by HPLC with Charged Aerosol Detection, Electrochemical Array Detection, and Principal Component Analysis
Pattern Recognition Analysis
Chromatographic data from either the charged aerosol detector or the Spectro-Electro array detector were pre-processed to align peak retention times by using the pattern recognition wizard in CoulArray 3.0 software and then imported into Pirouette software for PCA and HCA. PCA is a mathematical procedure that uses an orthogonal transformation to convert a set of observations of possibly correlated variables into a set of values of linearly uncorrelated variables called principal components. It is mostly used as a tool in exploratory data analysis and for making predictive models. The greatest variance by any projection of the data is found in the first coordinate (Factor 1), the second greatest variance is found on the second coordinate (Factor 2), and so on. Thus samples with different patterns in their chromatographic or electrochemical profile are distinguished from each other based on their relative position in three- dimensional space. The relationships among these data were used to investigate authenticity and differences in processing, e.g., dried plant parts, tablet, or capsule.
Profiling Hoodia Extracts by HPLC with Charged Aerosol Detection, Electrochemical Array Detection, and Principal Component AnalysisIan Acworth, Bruce Bailey, Marc Plante, Qi Zhang, David Thomas Thermo Fisher Scientific, Chelmsford, MA
Conclusion• Gradient HPLC with charged aerosol or electrochemical array detection are simple
approaches that generate information-rich chemical profile data. Both detectors can reveal analytes overlooked by UV detection alone.
• Chemical profile data can be imported into pattern recognition software and with principal components analysis used to readily identify product authenticity.
• The combined chromatographic/chemometric approach was verified by applying it to known test samples, but can be readily applied to quickly screen unknown samples.
References1. Avula, B.; Wang, Y.-H.; Pawar, R.S.; Shukla, Y.J.; Smillie, T.J.; Khan, I.A.
A rapid method for chemical fingerprint analysis of Hoodia species, related genera, and dietary supplements using UPLC–UV–MS J. Pharm. Biomed. Anal. 2008, 48, 722–731.
2. Gamache, P.; Acworth, I.; Lynch, M.; and Matson, W. Coulometric Array Detection for HPLC In the analysis of Juice Products in Methods to Detect Adulteration of Fruit Juice Beverages; Nagy, S., Wade, R., Eds.; AGSCIENCE USA, Inc.1995; Vol. 1, pp 120-144.
AcknowledgementsWe would like to thank Drs. Ikhlas Khan and Bharathi Avula of the National Center for Natural Products Research at The University of Mississippi, Oxford, MS, for providing the plant materials and hoodigoside standards used in this study.
FIGURE 1. HPLC with charged aerosol detection identifies hoodigosides in a standard with precision and sensitivity; overlay of seven injections, 10 mg/L
© 2013 Thermo Fisher Scientific Inc. All rights reserved. Pirouette is a registered trademark of Informetrix, Inc.All other trademarks are the property of Thermo Fisher Scientific and its subsidiaries. This information is not intended to encourage use of these products in any manners that might infringe the intellectual property rights of others.
PO70540_E 03/13S
FIGURE 2. HPLC-CAD chromatograms of methanolic extracts from Hoodiagordonii, Hoodia gordonii (from Namibia), and Opuntia leptocaulis
FIGURE 6. PCA score plot for ECD array data from channels 1–16. MethodsHPLC with Charged Aerosol Detection
HPLC System: Thermo Scientific™ Dionex™ UltiMate™ 3000 RSLC system with a:- DAD–3000RS Diode Array Detector and a - Corona™ ultra RS™ Charged Aerosol Detector:Nebulizer Temperature: 25 °CPower function: 1.00Data collection rate: 20 Hz
Data Analysis: Thermo Scientific™ Dionex™ Chromeleon™ ChromatographyData System software, 7.1 SR1
Column: Thermo Scientific™ Accucore™ C8, 4.6 × 150 mm; 2.6 µm
Temp.: 40 oCInjection Vol.: 10 µLFlow Rate: 2.0 mL/minMobile Phase A: Deionized water Mobile Phase B: Acetonitrile, Fisher Scientific™ Optima™ LCMSGradient: 40%B to 47%B in 2.5 min; to 95%B in 15 min; hold 10 min.
HPLC with Spectro-Electro Array Detection
HPLC System: Thermo Scientific™ Dionex™ UltiMate™ 3000 RS system with a- DAD–3000RS Diode Array Detector- CoulArray™ Electrochemical Array Detector:16-channel array from 0 to +900 mV versus Pd in +60 mV steps
Data Analysis: Thermo Scientific™ Dionex™ Chromeleon™ Chromatography Data System 6.8 and CoulArray 3.0 software.
Column: Thermo Scientific™ Acclaim™ C18, 3 × 150 mm; 3 µm
Temperature: 35 oCFlow Rate: 0.65 mL/minInjection Vol.: 10 µLMobile Phase A: 20 mM Monobasic sodium phosphate, 3% acetonitrile, ` 0.2% tetrahydrofuran, pH 3.35Mobile Phase B: 20 mM Monobasic sodium phosphate, 50% acetonitrile,
10% tetrahydrofuran, pH 3.45Mobile Phase C: Methanol, Optima LCMS
Gradient:
Sample Preparation
50 mg powder from a commercially available capsule was placed into a 2 mL centrifuge tube. One 1 mL methanol was added and the mixture vortexed for 10 min. The supernatant was transferred to a 5 mL volumetric flask. Extraction was repeated two times with fresh methanol and the extracts combined. After bringing to volume with methanol and mixing, an aliquot was centrifuged in a 1 mL centrifuge tube at 13,000 rpm for 10 min and the supernatant transferred to a glass HPLC autosampler vial.
Data Analysis
Principal components analysis (PCA) and cluster analysis (HCA) were used to investigate pattern differences in chromatograms represented as detector response versus retention time. Data were aligned by using the Pattern Recognition Wizard in CoulArray for Windows 3.0 software and imported into Pirouette® Comprehensive Chemometrics modeling software version 4.5 for PCA and HCA.
ResultsChromatography
Method 1: HPLC-Charged aerosol detection
A mixture of eight hoodigosides eluted with baseline resolution within 10 min from the Accucore C8 column under an aqueous/solvent gradient ranging from 40–95% acetonitrile over 15 min (Figure 1). After separation was achieved, the column was washed for an additional 10 min with 95% acetonitrile to ensure complete elution of hydrophobic compounds that might be present in sample extracts. Good precision and ample response can be seen in this overlay of seven injections of a 10 mg/L standard and diluent blank.
The chromatograms obtained from sample extracts are very complex, with many peaks eluting before, during and after the retention time window of the hoodigoside standards. Figure 2 shows example chromatograms obtained from extracts of dried Hoodia gordonii mixed parts. In most cases, the individual hoodigosides were resolved sufficiently to permit their accurate identification and quantification in the sample mixtures. Some of the extracts included peaks that coeluted with the standard hoodigosides. Note that in many of the extracts there were several hydrophobic compounds that eluted between 15 and 25 min that are not well detected at 220 nm, but were well detected by the charged aerosol detector. Calibration curves were obtained from standard injections ranging from 0.10 to 100 mg/L (not shown). The calibration curves spanned four orders of magnitude, had a quadratic fit to the data and yielded a correlation coefficient of > 0.999 for each standard hoodigoside.
Time(min)
Flow(mL/min)
%A %B %C Curve
0 0.65 92 5 3 52 0.65 92 5 3 7 (concave)30 0.65 0 97 3 7 (concave)45 0.65 0 97 3 545 0.65 92 5 3 550 0.65 92 5 3 5
OverviewPurpose: To combine fast and sensitive HPLC methods with chemometric analysis to profile botanical extracts from the botanical supplement Hoodia gordonii.
Methods: Hoodia extracts were analyzed by gradient reversed-phase high performance liquid chromatography with either a charged aerosol detector or photodiode array detector in series with an electrochemical array detector (the spectro-electro array). Chromatographic data were interrogated by chemometric software to identify patterns related to differences in plant species, origin or processing.
Results: Unsupervised chemometric evaluation of the information rich data obtained from HPLC with charged aerosol detection and electrochemical array detection correctly identified differences in sample origin and processing.
IntroductionHoodigosides are oxypregnane steroidal glycosides abundant in Hoodia gordoniiand related plants native to the deserts of southwestern Africa. These plants, used traditionally to ease hunger during long hunting expeditions, enjoy wide use today in dietary supplements purported to aid in appetite suppression and weight loss.
Presented are two approaches to profile Hoodia related products. In the first approach, Hoodia extracts were analyzed by HPLC with charged aerosol detection. Eight hoodigosides isolated from dried plant material are separated within 15 min on a solid core C8 analytical column that delivers superb resolution with low backpressure. With low-nanogram sensitivity, the charged aerosol detector responds uniformly to all non-volatile species including the target analytes, degradation products and impurities that may not possess a chromophore.
In the second approach, Hoodia extracts were analyzed by HPLC with an online electrochemical array detector that responds to redox active compounds such as polyphenols. Each of the sixteen sensors in the electrochemical array detects analytes at a unique potential to yield picogram on-column sensitivity for diverse compounds that vary widely in redox properties. The chromatograms resulting from this voltammetric approach often clearly resolve co-eluting compounds.
These two techniques provide complementary data that are used to quantify known compounds. The complex patterns of known and unknown compounds revealed by the detectors were also interrogated by pattern recognition software to support inferences on product quality, authenticity, adulteration, or origin. Limits of detection, linear and dynamic range, precision, and pattern recognition results are compared for the two approaches.
Method 2: HPLC-Spectro-Electro Array.
Chromatographic results:
The Spectro-Electro Array makes use of both spectrophotometric and electrochemical data. While UV detection provides identification and quantification of the major components in a sample, EC array detection is incredibly sensitive and is capable of measuring compounds missed by UV. Furthermore, the EC array can voltammatrically resolve compounds that co-elute chromatographically, and the redox behavior of a compound reacting across the array provides qualitative information that can be used for analyte identification/authentication. The CoulArray is particularly suitable for generating chemical fingerprints of supplements containing endogenous electroactivecompounds that are essential to flavor, color and stability. The HPLC method used with the Spectro-Electro Array was optimized to resolve the earlier-eluting more polar components in the samples. Illustrative examples of HPLC-ECD Array chromatograms obtained for a few of the samples analyzed are shown in Figure 3–5. As can be seen, these extracts contain many species that are electrochemically active.
FIGURE 3. PCA score plot of CAD data, only hoodigoside response were used for PCA analysis
Factor 1 (72.7%)
Factor 2 (10.8%)
Factor 3 (6.3%)
3165
29272926
2915
HG5
HG6
3229
2925
MPG
3126
HG1
3558
A score plot from the HPLC-Charged aerosol detection data is shown in Figure 3 and discussed in that section. A score plot from PCA analysis of the ECD array (CoulArray)data is shown in Figure 6. Samples 2821, 2799 and HG4 were excluded as outliers before PCA analysis because of problems with the chromatography. PCA readily identifies three major groups among the remaining samples. One group contains only sample 2915, from the non-hoodia species Opuntia leptocaulis. Another group corresponds to the samples processed into capsules or tablets. The third set, within the black circle, corresponds to authentic Hoodia gordonii dried plant material. In each case, the results from the unsupervised chemometric analysis correspond to plainly observable characteristics of the samples, allowing us to verify the accuracy of the approach. The real power of this combined chromatographic/chemometric approach is that it can be implemented in a more or less automated way to quickly screen unknown samples.
Factor 1 (85.5%)
Factor 2 (8.2%)
Factor 3 (4.6%)
3229
2925
MPG-D046
3165
2927
2926
2915HG1HG5HG635582821
2799
3126
HG4
Figure 3 shows the PCA score plot of the hoodigosides data acquired by charged aerosol detection. Capsule samples HG1 and HG5, tablet samples HG-6 and 3558, and sample vial 2915 containing Opuntia leptocaulis form a distinct cluster. The primary difference between these clusters is identified as hoodigoside content. (A description of the pattern recognition analysis is provided below.)
0.00 10.00 20.00 30.00
0.00
0.20
0.40
0.60
0.80
1.00
1.20
1.40
Retention time (minutes)
Resp
onse
(µA) [900 mV]
[840 mV][780 mV]
4-hyd
roxyb
enza
ldehy
de 9.
76m
salic
ylic a
cid 15
.3m
[720 mV][660 mV]
4-hyd
roxyb
enzy
l alco
hol 3
.87m
[600 mV]
vanil
lin 11
.0m
[540 mV]
ethyl
vanil
lin 16
.2m
cava
rcrol
31.9m
[480 mV]
valilli
c acid
8.93
m
[420 mV]
syrin
geald
ehyd
e 11.6
m
[360 mV]
syrin
gic ac
id 9.2
2m
feruli
c acid
14.9m
euge
nol 2
9.1m
[300 mV] sinap
ic ac
id 14
.2m
[240 mV][180 mV]
luteo
lin 25
.8m
[120 mV][60 mV][0 mV]
0.00 10.00 20.00 30.00
0.00
0.20
0.40
0.60
0.80
1.00
1.20
1.40
Retention time (minutes)
Resp
onse
(µA) [900 mV]
4-hyd
roxyc
ouma
rin 18
.8m
[840 mV][780 mV][720 mV][660 mV]
4-hyd
roxyb
enzy
l alco
hol 3
.75m
[600 mV]
vanil
lin 11
.0m
[540 mV]
ethyl
vanil
lin 16
.8m
thymo
l 31.9
m ca
varcr
ol 32
.1m
[480 mV]
valilli
c acid
8.92
m
[420 mV]
syrin
geald
ehyd
e 11.6
m
[360 mV]
syrin
gic ac
id 9.2
1m
feruli
c acid
14.9m
euge
nol 2
9.1m
[300 mV]
sinap
ic ac
id 14
.4m
[240 mV][180 mV]
luteo
lin 25
.8m
[120 mV]
querc
etin 2
6.4m
[60 mV][0 mV]
0.00 10.00 20.00 30.00
0.00
0.20
0.40
0.60
0.80
1.00
1.20
1.40
Retention time (minutes)
Resp
onse
(µA) [900 mV]
4-hy
drox
ycou
mar
in 18
.3m
[840 mV][780 mV]
4-hy
drox
yben
zalde
hyde
salic
ylic
acid
14.6
m
[720 mV][660 mV]
4-hy
drox
yben
zyl a
lcoho
l 3.7
5m
[600 mV]
hydr
oxyp
heny
l ace
tic a
cid 7
.79m
[540 mV][480 mV]
valill
ic ac
id 8.
94m
[420 mV] hesp
eridi
n 18
.7m
[360 mV]
syrin
gic a
cid 9
.23m
feru
lic a
cid 1
5.0m
[300 mV]
sinap
ic ac
id 14
.1m
[240 mV]
3,4-
dihyd
roxy
benz
oic a
cid 4
.54m
[180 mV]
cate
chin
8.11
m
[120 mV][60 mV][0 mV]
FIGURE 3: HPLC-ECD Array chromatogram of Hoodia gordonii mixed parts extract #3165
FIGURE 4: HPLC-ECD Array chromatogram of Hoodia commercial product capsule extract HG4
FIGURE 5: HPLC-ECD Array chromatogram of Hoodia commercial product tablet extract HG6

www.thermofisher.com/dionex©2016 Thermo Fisher Scientific Inc. All rights reserved. Pirouette is a registered trademark of Informetrix, Inc. All other trademarks are the property of Thermo Fisher Scientific Inc. and its subsidiaries. This information is presented as an example of the capabilities of Thermo Fisher Scientific Inc. products. It is not intended to encourage use of these products in any manners that might infringe the intellectual property rights of others. Specifications, terms and pricing are subject to change. Not all products are available in all countries. Please consult your local sales representative for details.
Australia +61 3 9757 4486 Austria +43 1 333 50 34 0 Belgium +32 53 73 42 41 Brazil +55 11 3731 5140 China +852 2428 3282
PN70540_E 09/16S
Denmark +45 70 23 62 60France +33 1 60 92 48 00Germany +49 6126 991 0India +91 22 2764 2735Italy +39 02 51 62 1267
Japan +81 6 6885 1213Korea +82 2 3420 8600Netherlands +31 76 579 55 55Singapore +65 6289 1190 Sweden +46 8 473 3380
Switzerland +41 62 205 9966Taiwan +886 2 8751 6655UK/Ireland +44 1442 233555USA and Canada +847 295 7500