Embed Size (px)
Citation preview

PROF ILE OF THE SC IENCE , ENGINEER ING AND TECHNOLOGY TEACHING WORKFORCE IN THE
COLLEGE SECTOR IN ENGLAND
GEOFF HAYWARD, FACULTY OF EDUCATION, UNIVERSITY OF CAMBRIDGEMATT HOMER, SCHOOL OF EDUCATION, UNIVERSITY OF LEEDS
G AT S B Y I S A F O U N DAT I O N S E T U P B Y DAV I D S A I N S B U RY
TO R E A L I S E H I S C H A R I TA B L E O B J E C T I V E S .W E F O C U S O U R S U P P O RT O N A L I M I T E D
N U M B E R O F A R E A S :
P L A N T S C I E N C E R E S E A R C HN E U RO S C I E N C E R E S E A R C H
S C I E N C E A N D E N G I N E E R I N G E D U C AT I O NE C O N O M I C D E V E L O P M E N T I N A F R I C A
P U B L I C P O L I C Y R E S E A R C H A N D A DV I C ET H E A RT S
W E A R E P ROAC T I V E I N D E V I S I N G P RO J E C T STO AC H I E V E O U R A I M S . W E A R E E N T H U S I A S T I C
A B O U T S U P P O RT I N G I N N OVAT I O N . W E A R E A N A LY T I C A L A S W E B E L I E V E I T I S I M P O RTA N T
TO U N D E R S TA N D T H E O P P O RT U N I T I E SA N D P RO B L E M S W E TAC K L E . W E TA K E A
L O N G - T E R M V I E W A S W E D O N OT T H I N K M U C H C A N B E AC H I E V E D B Y S H O RT, O N E - O F F
P RO J E C T S . W E A R E A LWAY S E AG E R TO F O R M PA RT N E R S H I P S W I T H O R G A N I S AT I O N S W H O
S H A R E O U R G OA L S .
T h e G a t s by C h a r i t a b l e F o u n d a t i o nT h e Pe a k , 5 W i l t o n R o a d , L o n d o n S W 1 V 1 A P
T + 4 4 ( 0 ) 2 0 7 4 1 0 0 3 3 0 F + 4 4 ( 0 ) 2 0 7 4 1 0 0 3 3 2w w w. g a t s by. o r g . u k
C o py r i g h t © G a t s by C h a r i t a b l e F o u n d a t i o n 2 0 1 5
pageCONTENTS
EXECUTIVE SUMMARY 1SECTION 1 INTRODUCTION 4SECTION 2 METHODOLOGY 6SECTION 3 FINDINGS 73.1 Overview 73.2 SET teaching workforce profile 83.2.1 The size of the FE SET teaching workforce 83.2.2 SET teaching workforce composition 11SECTION 4 CPD PROVISION 31SECTION 5 CONCLUSION 35APPENDIX 1 THE DEMAND FOR SET SKILLS AND TECHNICIANS 36APPENDIX 2 EXAMPLES OF CPD REQUIREMENT OF TEACHERS INTERVIEWED 39APPENDIX 3 RESEARCH INSTRUMENTS (online version of report only) 40
TABLESTable 1: Composition of the sample compared with data from
the SIR 2012–2013 7Table 2: Average proportion of part-time teaching staff in different
subject areas 8Table 3: Numbers of teachers and Full-time Equivalents (FTEs)
by subject area and by type of contract 9Table 4: Nationally projected figures for teacher numbers and FTEs
by subject area and type of contract (rounded to the nearest 10) 10Table 5: Frequency and proportion of individuals teaching in different
subject areas 11Table 6: Proportion of SET teachers by age (years) and subject 12Table 7: Roles undertaken by gender and type of contract 15Table 8: Replacement demand for SET staff under two different scenarios,
rounded to the nearest 50 18Table 9: NQF level of courses taught 18Table 10: The highest subject qualification by level held by teachers and
tutors in the sample 21Table 11: Highest teaching qualification held by teachers and tutors in the sample 22Table 12: Reported occurrence of CPD provision in FE colleges 31Table 13: Type of CPD activities undertaken by teachers relevant to
teaching their main subject 32Table 14: Rating of different types of CPD activity reported 32
FIGURESFigure 1: Distribution of teachers and tutors in the sample by gender
and subject area 11Figure 2: Age distribution of the sample 12Figure 3: Type of employment contract by gender 14Figure 4: Age distribution of SET teachers by type of contract 14Figure 5: Roles undertaken by subject area 15
Continued...
Figure 6: Median number of teaching contact hours per week by subject area 16Figure 7: Median number of teaching contact hours per week by gender 17Figure 8: Median number of teaching contact hours per week by type of contract 17Figure 9: NQF levels of courses taught by subject area 19Figure 10: Highest qualification by NQF level held by teachers in
different subject areas 20Figure 11: Highest qualification held by NQF level of course being taught 21Figure 12: Highest teaching qualification held by subject area taught 23Figure 13: Enterprise-based experience of teachers and tutors by
subject area 24Figure 14: Number of years of industrial experience relevant to
teaching courses by subject area 25Figure 15: Time elapsed since most recent enterprise-based experiences
by subject area 26Figure 16: Age at which teaching career commenced by subject area 27Figure 17: Average length of teaching career in years by subject
area (± 95% CI) 28Figure 18: Length of current teaching contract by subject area 29Figure 19: English, Welsh and Northern Ireland National
Qualifications Framework 38
TERMINOLOGY The term ‘teacher’ is used throughout this report to encompass lecturer, tutor, trainer and teacher.
ACKNOWLEDGEMENTSWe are very grateful for advice and comments on an earlier draft from Jenifer Burden and Hannah Stanwix. We are also grateful to all the interviewees and to colleagues at York Consulting led by Philip Wilson who collected the data. Financial support from the Gatsby Charitable Foundation is gratefully acknowledged.
Professor Geoff HaywardFaculty of EducationUniversity of [email protected]
This research has been funded by the Gatsby Charitable Foundation with a contribution from the Nuffield Foundation as part of aligned programmes of work exploring the science, engineering and technology teaching workforce in further education colleges, and the mathematics teaching workforce across the whole post-16 education sector. The findings are presented in three reports. The first two reports (by Geoff Hayward and Matt Homer) are published by the Gatsby Charitable Foundation and the third (by John Howson) will be published by the Nuffield Foundation (title and publication date to be confirmed).
1 Profile of the science, engineering and technology teaching workforce in the college sector in England
2 Profile of the mathematics teaching workforce in the college sector in England3 The maths teaching workforce across the post-16 education sector
DISCLAIMER The views and opinions expressed in this report are those of the authors and do not necessarily state or reflect those of the Gatsby Charitable Foundation.
Contents continued...
Dr Matt Homer School of Education University of Leeds [email protected]
S E T C O L L E G E T E AC H I N G WO R K F O R C E
1
EXECUTIVE SUMMARY
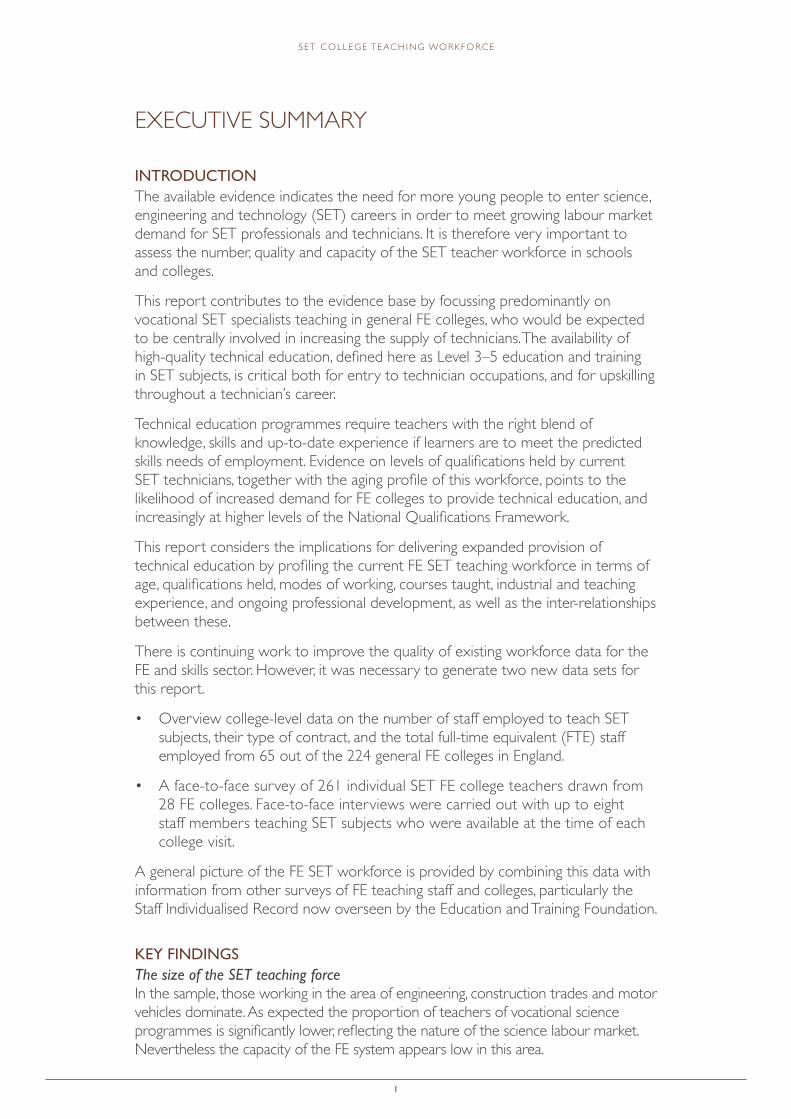
INTRODUCTIONThe available evidence indicates the need for more young people to enter science, engineering and technology (SET) careers in order to meet growing labour market demand for SET professionals and technicians. It is therefore very important to assess the number, quality and capacity of the SET teacher workforce in schools and colleges.
This report contributes to the evidence base by focussing predominantly on vocational SET specialists teaching in general FE colleges, who would be expected to be centrally involved in increasing the supply of technicians. The availability of high-quality technical education, defined here as Level 3–5 education and training in SET subjects, is critical both for entry to technician occupations, and for upskilling throughout a technician’s career.
Technical education programmes require teachers with the right blend of knowledge, skills and up-to-date experience if learners are to meet the predicted skills needs of employment. Evidence on levels of qualifications held by current SET technicians, together with the aging profile of this workforce, points to the likelihood of increased demand for FE colleges to provide technical education, and increasingly at higher levels of the National Qualifications Framework.
This report considers the implications for delivering expanded provision of technical education by profiling the current FE SET teaching workforce in terms of age, qualifications held, modes of working, courses taught, industrial and teaching experience, and ongoing professional development, as well as the inter-relationships between these.
There is continuing work to improve the quality of existing workforce data for the FE and skills sector. However, it was necessary to generate two new data sets for this report.
• Overview college-level data on the number of staff employed to teach SET subjects, their type of contract, and the total full-time equivalent (FTE) staff employed from 65 out of the 224 general FE colleges in England.
• A face-to-face survey of 261 individual SET FE college teachers drawn from 28 FE colleges. Face-to-face interviews were carried out with up to eight staff members teaching SET subjects who were available at the time of each college visit.
A general picture of the FE SET workforce is provided by combining this data with information from other surveys of FE teaching staff and colleges, particularly the Staff Individualised Record now overseen by the Education and Training Foundation.
KEY FINDINGSThe size of the SET teaching forceIn the sample, those working in the area of engineering, construction trades and motor vehicles dominate. As expected the proportion of teachers of vocational science programmes is significantly lower, reflecting the nature of the science labour market. Nevertheless the capacity of the FE system appears low in this area.
2
S E T C O L L E G E T E AC H I N G WO R K F O R C E
For analysis purposes, the wide range of subject areas taught was amalgamated into three: science, technology and engineering. The majority of courses taught by the teachers of engineering and technology interviewed were of a vocational nature. Science teachers predominantly taught on academic courses (eg A-levels).
The gender split in the sample is 29% female and 71% male, with women over-represented in science and under-represented in technology and engineering. The median age is 45 years old, with no difference between the SET areas in terms of average age, but with women generally younger than men. However, at least a quarter of teachers in all SET areas are over 53. Thus, regardless of any additional expansion demand, there is likely to be a significant replacement demand in the coming years for teachers of technical education. This demand is estimated using two different scenarios to be between 1,500 – 2,000 SET teachers over the next decade solely to meet replacement demand. Given the difficulties reported by FE colleges in recruiting appropriately skilled SET teaching staff, this will be a challenging target to meet.
A total of 470 different SET courses across Levels 1–5 are taught by the 261 SET teaching staff in the sample, with the majority (62%) at Level 3. The data suggest that the current SET teaching force in FE colleges is inexperienced in delivering provision at Levels 4–5, which is likely to be increasingly required to meet emerging demands for highly qualified SET technicians.
Just under 70% of the respondents have qualifications at degree level (NQF Level 6) or above, with 90% having qualifications at Level 4 and above. Typical Level 4 and 5 qualifications are HNCs, HNDs and Foundation degrees. However, science and technology teaching staff are better qualified than those teaching engineering: 99% and 84% of science and technology teachers, respectively, hold degrees or higher-level qualifications compared with 43% of those teaching engineering disciplines.
18% of engineering teaching staff hold their highest formal qualifications at Levels 2 and 3. There is a strong association between the highest qualification held and the level of the programme being taught. However, some 24% of Level 2 courses and 8% of those at Level 3 are taught by individuals whose highest level of academic or vocational qualification is at Level 2 or 3.
70% of respondents had higher level teaching qualifications such as PGCE or Cert Ed (or equivalent). Overall a lower proportion of engineering teachers hold higher-level teaching qualifications. This raises the question as to how much subject-specialist training engineering teaching staff will encounter if undertaking a shorter initial teacher training course.
In addition, perhaps unsurprisingly, engineers on average have significantly more years of enterprise-based experience (17 years) than either technologists (11) or scientists (8). For this reason, engineers start teaching on average significantly later, at a median age of 36 compared with 29 for scientists and technologists. Hence, the average length of teaching career for science and technology teachers is significantly longer than their colleagues teaching engineering.
CPD PROVISIONTeachers’ industrial experience was typically gained nine to eleven years ago, but across all subject areas they rated the utility of this experience highly in relation to their teaching.
3
S E T C O L L E G E T E AC H I N G WO R K F O R C E
The vast majority of respondents reported receiving some CPD from their college, but the frequency was highly variable. 80% of the sample indicated that they had received some CPD relevant to their main teaching subject.
The most common type of CPD was Increasing subject knowledge and skills (46%), followed by Generic teaching skills training (21%).
The majority of CPD was of short duration; 53% was one day or less, and 92% ten days or less. Very few individuals had long duration CPD, for instance were being sponsored to complete a degree.
11% of the sample indicated that they required no further CPD, 50% wanted industry- or subject content-related CPD, 30% required teaching-related CPD, and 9% wanted both of these types.
Science teachers are seven times more likely than engineers to indicate that they would like to receive additional CPD, and four times more likely than technologists. Further details of the CPD requirements of FE teachers can be found in this report.
CONCLUSION1. The current FE workforce data, provided by the Staff Individualised Record, is
not fit-for-purpose. Response rates have been falling over time and the data are insufficiently granular to provide policy-makers with an evidence base on which they can anticipate and implement necessary interventions to provide UK plc with a future FE workforce to drive technical education. As a minimum, data for mathematics and science teachers should be recorded independently, and teachers’ qualifications included in data collection.
2. The existing SET FE workforce is skewed towards a higher age and there will be a replacement demand for teachers with high levels of qualification combined with industry experience. Further work is required to understand whether recruitment and retention of new staff is meeting this need.
3. Overall the current SET workforce in FE colleges is well-qualified, both in terms of subject and teaching qualifications, to deliver the requisite level of qualifications needed to produce the SET technicians of the future. However, it is likely that a greater proportion of those teaching in the engineering disciplines will require higher levels of subject qualification if the anticipated demand for future employees qualified at Levels 3–5 is to be delivered – and particularly at the higher levels. This points to significant future recruitment and training difficulties for FE colleges.
4. The report illustrates the large numbers of SET teaching staff required solely to meet replacement demand. However, there is evidence that the labour market requirement for highly-qualified SET technicians is growing. It is unlikely that this demand will be sufficiently neatly geographically arranged to enable the current infrastructure of FE colleges to recruit the required additional teaching staff. Technical education is expensive, both for facilities and staffing, and is often required in niche areas. Overcoming this tyranny of small numbers needs greater local coherent planning of provision in order to align supply and demand.
4
S E T C O L L E G E T E AC H I N G WO R K F O R C E
SECTION 1 INTRODUCTION
There is general agreement that the UK will experience a growing demand for science, engineering and technology (SET) professionals and technicians over the coming years1. Further Education (FE) colleges2 are likely to play a central role in meeting this demand, if it materialises, through providing learning to support the acquisition of intermediate (Levels 3–5) qualifications. This is crucially dependent upon having the right size and composition of teaching workforce in FE colleges, with the appropriate mix of knowledge, skills and experience. However, little is known about that workforce at the individual level, and this would be needed to examine, for example, issues of replacement, recruitment and retention. This report therefore focuses on the current SET teaching workforce in English FE colleges, answering the following questions:
(i) What is the size of the SET teaching workforce in English FE colleges?(ii) What is the current composition of the vocational SET teaching workforce in
these colleges? - age profile and gender balance - proportion working full- and part-time - courses taught - qualifications held (non-teaching and teaching), and relation to courses being
taught - current level of experience of SET workplaces and of teaching.
(iii) What CPD have FE SET teachers and tutors undertaken, and what CPD do they see as being necessary to deliver the courses that they currently teach?
(iv) What are the implications of i-iii in relation to identified needs for SET professionals and technicians, and the future development of the SET workforce in FE?
To answer these research questions requires, first, an overview of the size of the SET teaching workforce in FE colleges, and more detailed, individualised information about FE teachers, for example, their age, qualifications held, and information about their industrial experience relevant to the courses they teach. In addition, data on recently undertaken CPD, its frequency, duration and utility are required, plus information about what CPD teachers deem desirable in order to undertake their teaching. Currently there is no publicly available data set that provides such individualised information. Furthermore, investigations undertaken for this report with FE college HR managers revealed that it is not straightforward to generate the required data from existing college HR systems.
1 See Appendix 1 for an overview.2 The College sector in England is large and complex. At the time of writing there were in England 224 general FE colleges, which offer a wide range of relevant academic (e.g. GCE A-level) and vocational (e.g. BTEC Nationals and apprenticeship) qualifications. In addition, there were 94 sixth-form colleges offering predominantly academic qualifications. This report focuses on general FE colleges. Source: Association of Colleges website: www.aoc.co.uk (accessed January 2015).
5
S E T C O L L E G E T E AC H I N G WO R K F O R C E
The Staff Individualised Record3 (SIR) provides some information about the FE workforce. The last published national information available is based on analysis of the 2012–13 SIR4. However, submission of data for the SIR is voluntary, and response rates have been falling over time with only one-third of colleges providing information in 2012-13. Further, the information collected is highly aggregated5. As a result, the SIR does not provide information/breakdown on FE SET staff which could be used to answer the research questions for this report, such as subject specialism(s), qualification levels, CPD received or required, full-time/part-time teaching, industrial experience. Further, within the SIR, subject areas are aggregated in such a way that, for instance, science teachers cannot be identified explicitly as a distinct group (science is grouped with mathematics, and engineering, technology and manufacturing are aggregated), and the publicly available information does not allow identification of individual level data, which prevents linkage of demographic variables to areas taught, and other variables of interest. Nonetheless, the analysis of the SIR data is a useful source of benchmark data that can be used to assess the representativeness of the sample used for this report while providing useful triangulation of results. This information is presented where relevant throughout this report.
3 Until it was disbanded in 2011, the sector skills council Lifelong Learning UK (LLUK) collected data for the Staff Individualised Record (SIR) across the lifelong learning sector, which included those working in FE. This work was subsequently undertaken by the Learning and Skills Improvement Service (LSIS), which collected workforce data from FE colleges in England for 2010/11 and 2011/12. Surveys of education and training staff in other training providers are carried out by the representative bodies AELP and HOLEX. Following the closure of LSIS in July 2013, responsibility for SIR management now rests with the Education and Training Foundation (ETF).4 ETF (2014) Further Education workforce data for England: Analysis of the 2012-13 staff individualised record.5 ibid p. 8
6
S E T C O L L E G E T E AC H I N G WO R K F O R C E
SECTION 2 METHODOLOGY
To answer the research questions posed for this report, two new types of data sets were therefore constructed. First, using a standardised proforma, overview reports were developed using information provided by heads of subject areas in a representative sample of 65 FE colleges6 in England. These overview reports provided information about the number of staff employed to teach SET subjects in the college, their type of contract, and the total full-time equivalent (FTE) staff employed. Combining this data with information from the SIR provides a general picture of the FE SET teaching workforce.
Second, an individual survey of SET FE college teachers was undertaken to provide the more individualised data required to answer the second and third research questions. Given the highly diverse nature of FE colleges, an initial random sample stratified by English region7 and college size (determined by total learner number) was identified. These colleges were approached with a request to participate in the research project. Where colleges replied that they did not wish to be visited, a replacement college in the same region and of comparable size was identified randomly. Hence while not completely stratified by region and size, we have taken steps to ensure representativeness by these factors. Each college selected was visited by a researcher who undertook face-to-face interviews with up to eight SET teachers who were available and willing to be interviewed at the time of this visit. Inevitably this means that the selection of teachers and tutors within colleges who were interviewed constitutes an opportunity sample, with the inevitable consequences that has for the external validity of the findings.
The total sample size generated from face-to-face college visits was 261 individuals teaching SET subjects distributed across 28 FE colleges. Each of these individuals was interviewed face to face using the schedule in Appendix 3. All data were entered first into Excel spreadsheets and then subsequently analysed in IBM SPSS version 21. A large number of variables were recoded in order to facilitate analysis. Details of the recoding process are described as necessary in each part of the findings section.
6 28 from interviewed colleges + 37 from proforma only colleges = 65 proforma FE colleges in total.7 Based on the old Learning and Skills Council regions.
7
S E T C O L L E G E T E AC H I N G WO R K F O R C E
SECTION 3 FINDINGS
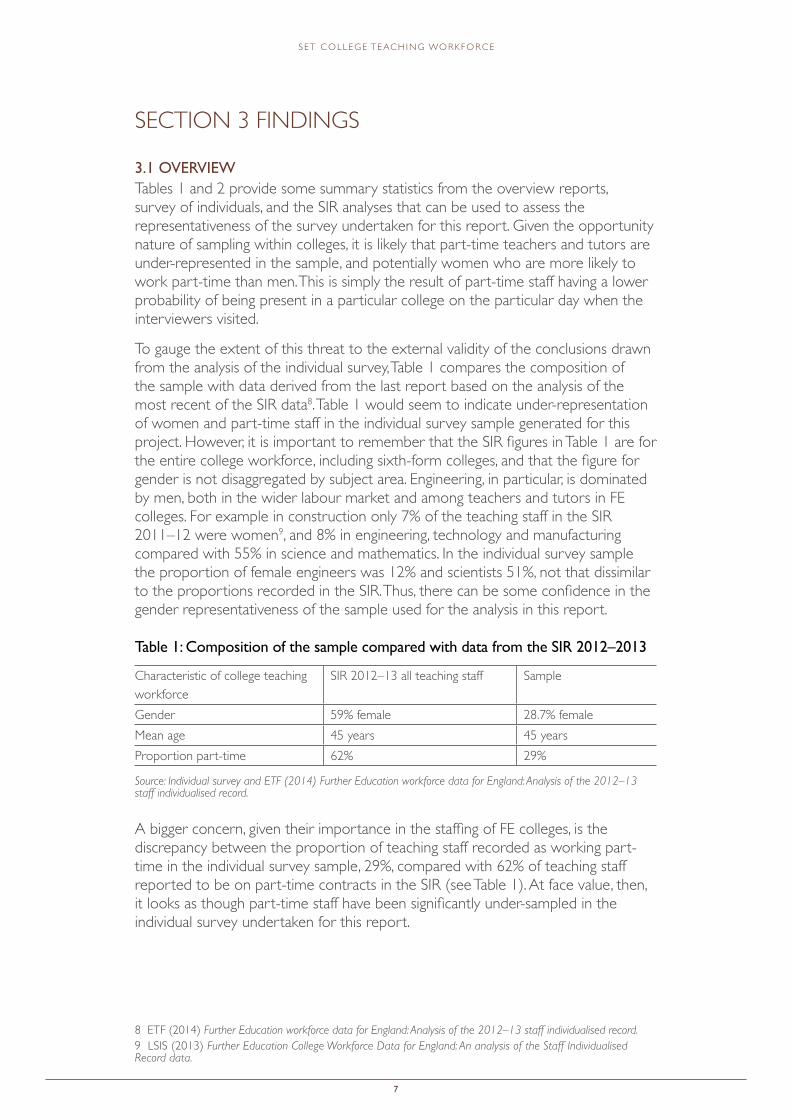
3.1 OVERVIEWTables 1 and 2 provide some summary statistics from the overview reports, survey of individuals, and the SIR analyses that can be used to assess the representativeness of the survey undertaken for this report. Given the opportunity nature of sampling within colleges, it is likely that part-time teachers and tutors are under-represented in the sample, and potentially women who are more likely to work part-time than men. This is simply the result of part-time staff having a lower probability of being present in a particular college on the particular day when the interviewers visited.
To gauge the extent of this threat to the external validity of the conclusions drawn from the analysis of the individual survey, Table 1 compares the composition of the sample with data derived from the last report based on the analysis of the most recent of the SIR data8. Table 1 would seem to indicate under-representation of women and part-time staff in the individual survey sample generated for this project. However, it is important to remember that the SIR figures in Table 1 are for the entire college workforce, including sixth-form colleges, and that the figure for gender is not disaggregated by subject area. Engineering, in particular, is dominated by men, both in the wider labour market and among teachers and tutors in FE colleges. For example in construction only 7% of the teaching staff in the SIR 2011–12 were women9, and 8% in engineering, technology and manufacturing compared with 55% in science and mathematics. In the individual survey sample the proportion of female engineers was 12% and scientists 51%, not that dissimilar to the proportions recorded in the SIR. Thus, there can be some confidence in the gender representativeness of the sample used for the analysis in this report.
Table 1: Composition of the sample compared with data from the SIR 2012–2013
Characteristic of college teaching workforce
SIR 2012–13 all teaching staff Sample
Gender 59% female 28.7% femaleMean age 45 years 45 yearsProportion part-time 62% 29%
Source: Individual survey and ETF (2014) Further Education workforce data for England: Analysis of the 2012–13 staff individualised record.
A bigger concern, given their importance in the staffing of FE colleges, is the discrepancy between the proportion of teaching staff recorded as working part-time in the individual survey sample, 29%, compared with 62% of teaching staff reported to be on part-time contracts in the SIR (see Table 1). At face value, then, it looks as though part-time staff have been significantly under-sampled in the individual survey undertaken for this report.
8 ETF (2014) Further Education workforce data for England: Analysis of the 2012–13 staff individualised record.9 LSIS (2013) Further Education College Workforce Data for England: An analysis of the Staff Individualised Record data.
8
S E T C O L L E G E T E AC H I N G WO R K F O R C E
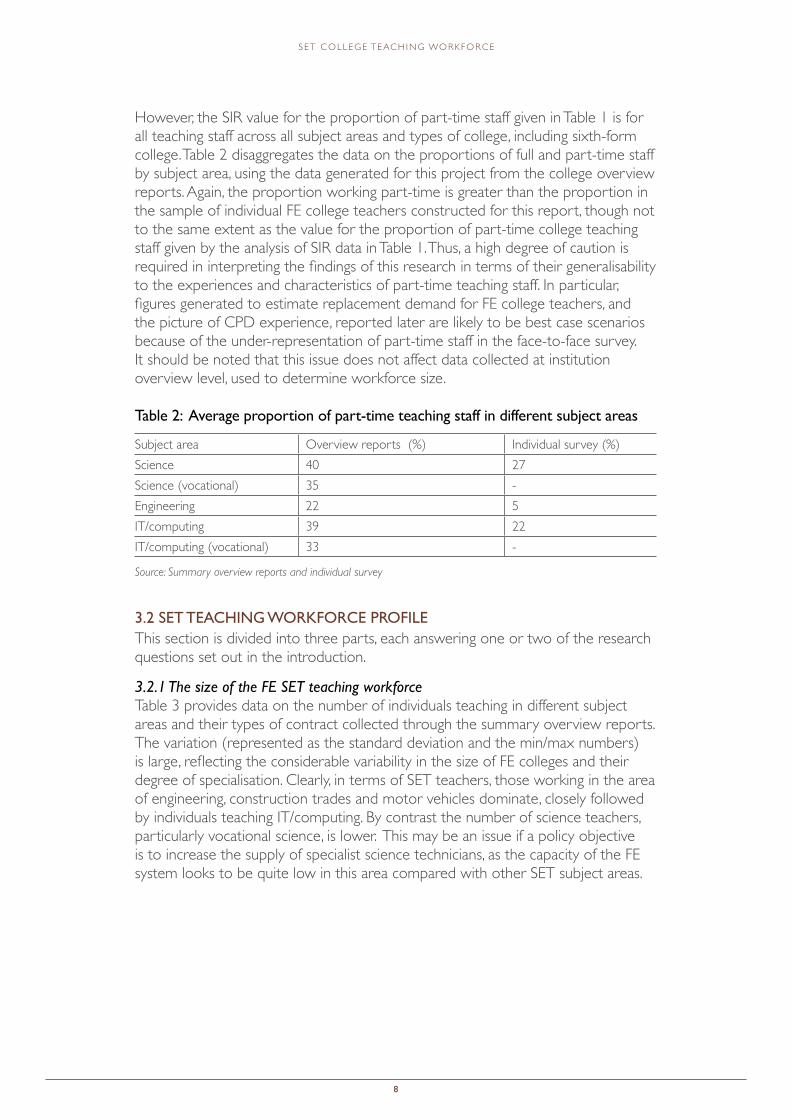
However, the SIR value for the proportion of part-time staff given in Table 1 is for all teaching staff across all subject areas and types of college, including sixth-form college. Table 2 disaggregates the data on the proportions of full and part-time staff by subject area, using the data generated for this project from the college overview reports. Again, the proportion working part-time is greater than the proportion in the sample of individual FE college teachers constructed for this report, though not to the same extent as the value for the proportion of part-time college teaching staff given by the analysis of SIR data in Table 1. Thus, a high degree of caution is required in interpreting the findings of this research in terms of their generalisability to the experiences and characteristics of part-time teaching staff. In particular, figures generated to estimate replacement demand for FE college teachers, and the picture of CPD experience, reported later are likely to be best case scenarios because of the under-representation of part-time staff in the face-to-face survey. It should be noted that this issue does not affect data collected at institution overview level, used to determine workforce size.
Table 2: Average proportion of part-time teaching staff in different subject areas
Subject area Overview reports (%) Individual survey (%)Science 40 27Science (vocational) 35 -Engineering 22 5IT/computing 39 22IT/computing (vocational) 33 -
Source: Summary overview reports and individual survey
3.2 SET TEACHING WORKFORCE PROFILEThis section is divided into three parts, each answering one or two of the research questions set out in the introduction.
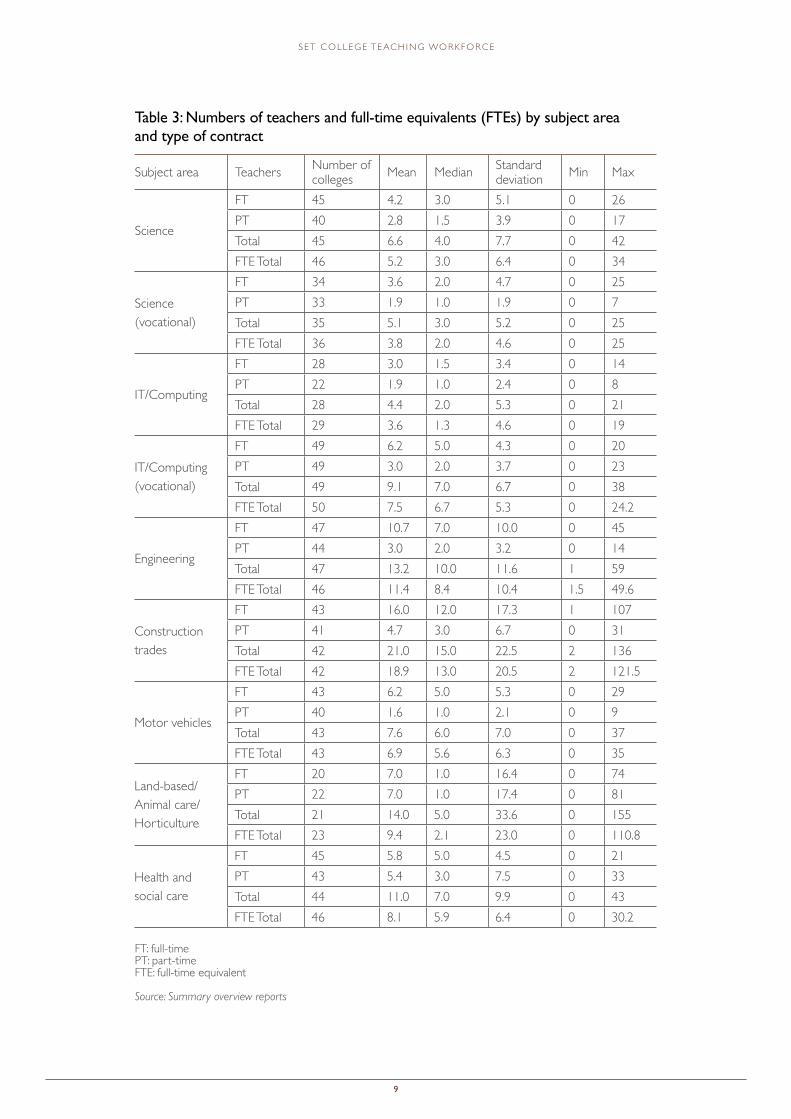
3.2.1 The size of the FE SET teaching workforce Table 3 provides data on the number of individuals teaching in different subject areas and their types of contract collected through the summary overview reports. The variation (represented as the standard deviation and the min/max numbers) is large, reflecting the considerable variability in the size of FE colleges and their degree of specialisation. Clearly, in terms of SET teachers, those working in the area of engineering, construction trades and motor vehicles dominate, closely followed by individuals teaching IT/computing. By contrast the number of science teachers, particularly vocational science, is lower. This may be an issue if a policy objective is to increase the supply of specialist science technicians, as the capacity of the FE system looks to be quite low in this area compared with other SET subject areas.
9
S E T C O L L E G E T E AC H I N G WO R K F O R C E
Table 3: Numbers of teachers and full-time equivalents (FTEs) by subject area and type of contract
Subject area Teachers Number of colleges Mean Median Standard
deviation Min Max
Science
FT 45 4.2 3.0 5.1 0 26PT 40 2.8 1.5 3.9 0 17Total 45 6.6 4.0 7.7 0 42FTE Total 46 5.2 3.0 6.4 0 34
Science (vocational)
FT 34 3.6 2.0 4.7 0 25PT 33 1.9 1.0 1.9 0 7Total 35 5.1 3.0 5.2 0 25FTE Total 36 3.8 2.0 4.6 0 25
IT/Computing
FT 28 3.0 1.5 3.4 0 14PT 22 1.9 1.0 2.4 0 8Total 28 4.4 2.0 5.3 0 21FTE Total 29 3.6 1.3 4.6 0 19
IT/Computing (vocational)
FT 49 6.2 5.0 4.3 0 20PT 49 3.0 2.0 3.7 0 23Total 49 9.1 7.0 6.7 0 38FTE Total 50 7.5 6.7 5.3 0 24.2
Engineering
FT 47 10.7 7.0 10.0 0 45PT 44 3.0 2.0 3.2 0 14Total 47 13.2 10.0 11.6 1 59FTE Total 46 11.4 8.4 10.4 1.5 49.6
Construction trades
FT 43 16.0 12.0 17.3 1 107PT 41 4.7 3.0 6.7 0 31Total 42 21.0 15.0 22.5 2 136FTE Total 42 18.9 13.0 20.5 2 121.5
Motor vehicles
FT 43 6.2 5.0 5.3 0 29PT 40 1.6 1.0 2.1 0 9Total 43 7.6 6.0 7.0 0 37FTE Total 43 6.9 5.6 6.3 0 35
Land-based/ Animal care/ Horticulture
FT 20 7.0 1.0 16.4 0 74PT 22 7.0 1.0 17.4 0 81Total 21 14.0 5.0 33.6 0 155FTE Total 23 9.4 2.1 23.0 0 110.8
Health and social care
FT 45 5.8 5.0 4.5 0 21PT 43 5.4 3.0 7.5 0 33Total 44 11.0 7.0 9.9 0 43FTE Total 46 8.1 5.9 6.4 0 30.2
FT: full-time PT: part-time FTE: full-time equivalent
Source: Summary overview reports
10
S E T C O L L E G E T E AC H I N G WO R K F O R C E
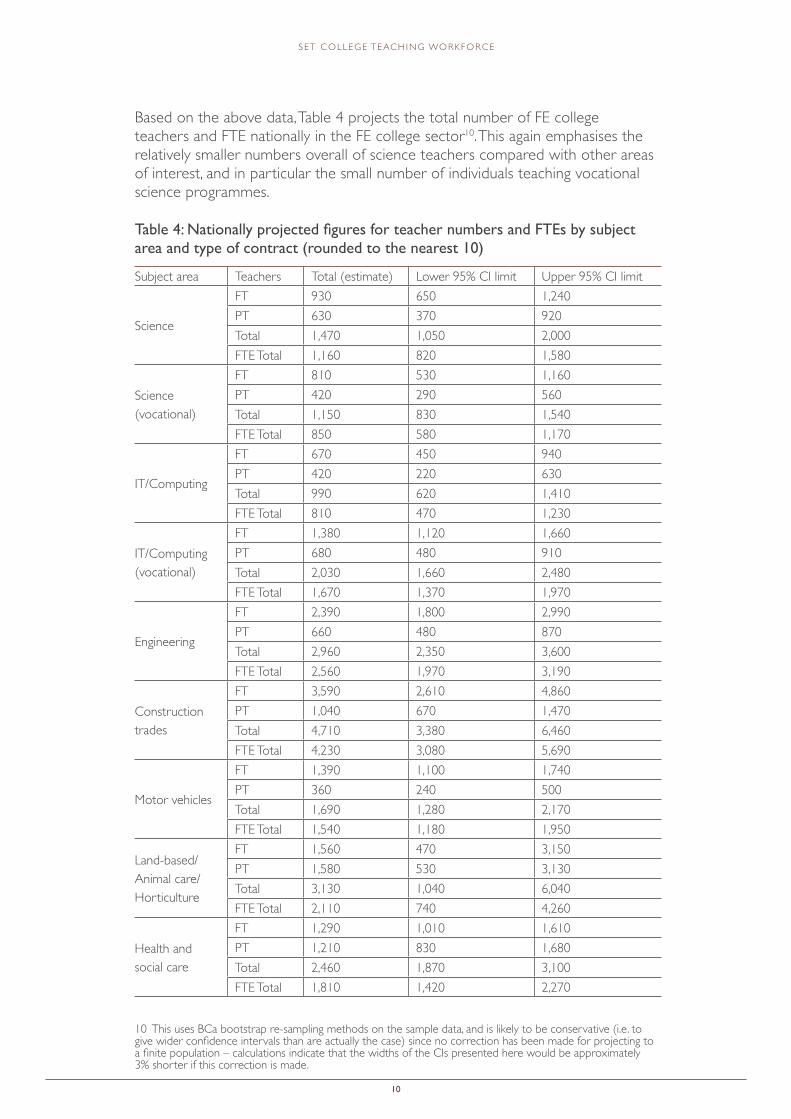
Based on the above data, Table 4 projects the total number of FE college teachers and FTE nationally in the FE college sector10. This again emphasises the relatively smaller numbers overall of science teachers compared with other areas of interest, and in particular the small number of individuals teaching vocational science programmes.
Table 4: Nationally projected figures for teacher numbers and FTEs by subject area and type of contract (rounded to the nearest 10)
Subject area Teachers Total (estimate) Lower 95% CI limit Upper 95% CI limit
Science
FT 930 650 1,240PT 630 370 920Total 1,470 1,050 2,000FTE Total 1,160 820 1,580
Science (vocational)
FT 810 530 1,160PT 420 290 560Total 1,150 830 1,540FTE Total 850 580 1,170
IT/Computing
FT 670 450 940PT 420 220 630Total 990 620 1,410FTE Total 810 470 1,230
IT/Computing (vocational)
FT 1,380 1,120 1,660PT 680 480 910Total 2,030 1,660 2,480FTE Total 1,670 1,370 1,970
Engineering
FT 2,390 1,800 2,990PT 660 480 870Total 2,960 2,350 3,600FTE Total 2,560 1,970 3,190
Construction trades
FT 3,590 2,610 4,860PT 1,040 670 1,470Total 4,710 3,380 6,460FTE Total 4,230 3,080 5,690
Motor vehicles
FT 1,390 1,100 1,740PT 360 240 500Total 1,690 1,280 2,170FTE Total 1,540 1,180 1,950
Land-based/ Animal care/ Horticulture
FT 1,560 470 3,150PT 1,580 530 3,130Total 3,130 1,040 6,040FTE Total 2,110 740 4,260
Health and social care
FT 1,290 1,010 1,610PT 1,210 830 1,680Total 2,460 1,870 3,100FTE Total 1,810 1,420 2,270
10 This uses BCa bootstrap re-sampling methods on the sample data, and is likely to be conservative (i.e. to give wider confidence intervals than are actually the case) since no correction has been made for projecting to a finite population – calculations indicate that the widths of the CIs presented here would be approximately 3% shorter if this correction is made.
11
S E T C O L L E G E T E AC H I N G WO R K F O R C E
3.2.2 SET teaching workforce compositionThe teachers interviewed face-to-face taught on a wide range of programmes from across the spectrum of SET disciplines provided in FE colleges and related to the Standard Occupational Codes that represent technician occupations. Courses offered included the traditional science subjects of biology, chemistry and physics; ICT and other technology-based programmes; automotive, aeronautical and other engineering disciplines. The majority of courses being taught were of a vocational nature except in science where, as predicted by the national overview data presented in Table 4, the majority of science teachers were teaching pure sciences – biology, chemistry, physics – with fewer teaching vocational programmes such as BTEC Applied Science. For the purposes of statistical analysis this wider range of subject areas were amalgamated into three groups as shown in Table 511.
Table 5: Frequency and proportion of individuals teaching in different subject areas
Subject area Frequency PercentageScience 83 31.8Technology 55 21.1Engineering 123 47.1Total 261 100.0
Source: Individual survey data
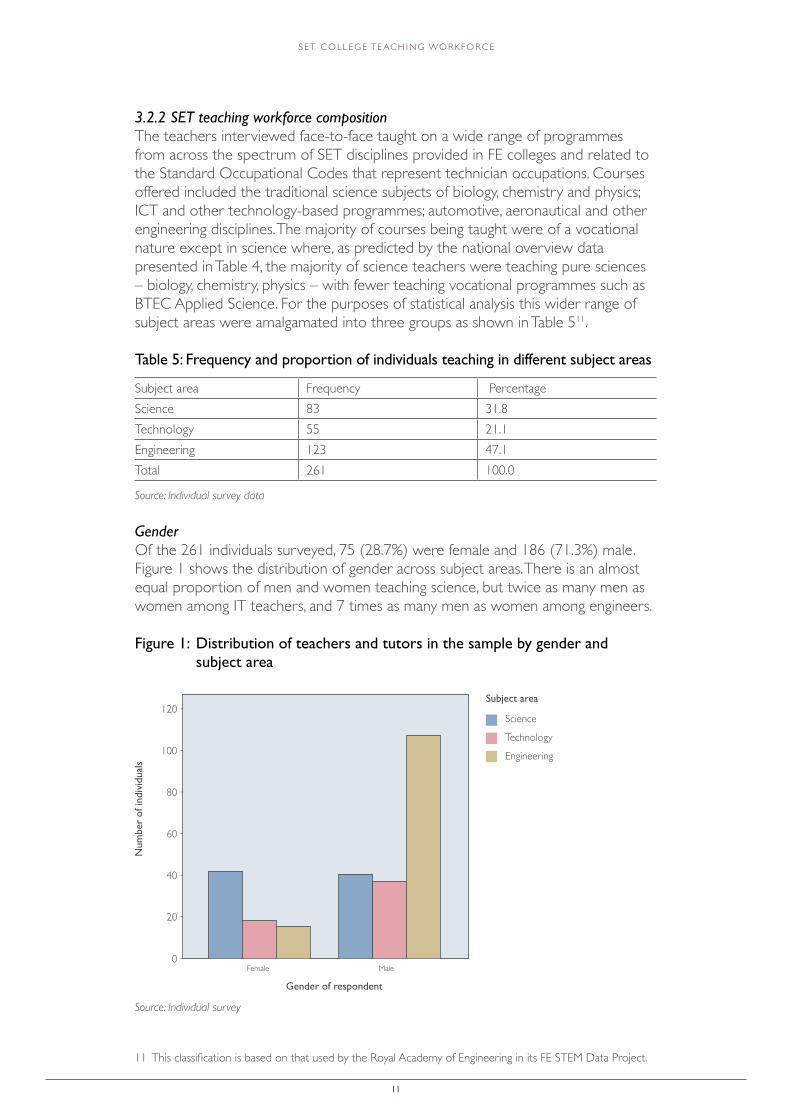
GenderOf the 261 individuals surveyed, 75 (28.7%) were female and 186 (71.3%) male. Figure 1 shows the distribution of gender across subject areas. There is an almost equal proportion of men and women teaching science, but twice as many men as women among IT teachers, and 7 times as many men as women among engineers.
Figure 1: Distribution of teachers and tutors in the sample by gender and subject area
Source: Individual survey
11 This classification is based on that used by the Royal Academy of Engineering in its FE STEM Data Project.
Num
ber
of in
divi
dual
s
Gender of respondent
Subject area
Science
Technology
Engineering
120 -
100 -
80 -
60 -
40 -
20 -
0 - Female Male
12
S E T C O L L E G E T E AC H I N G WO R K F O R C E
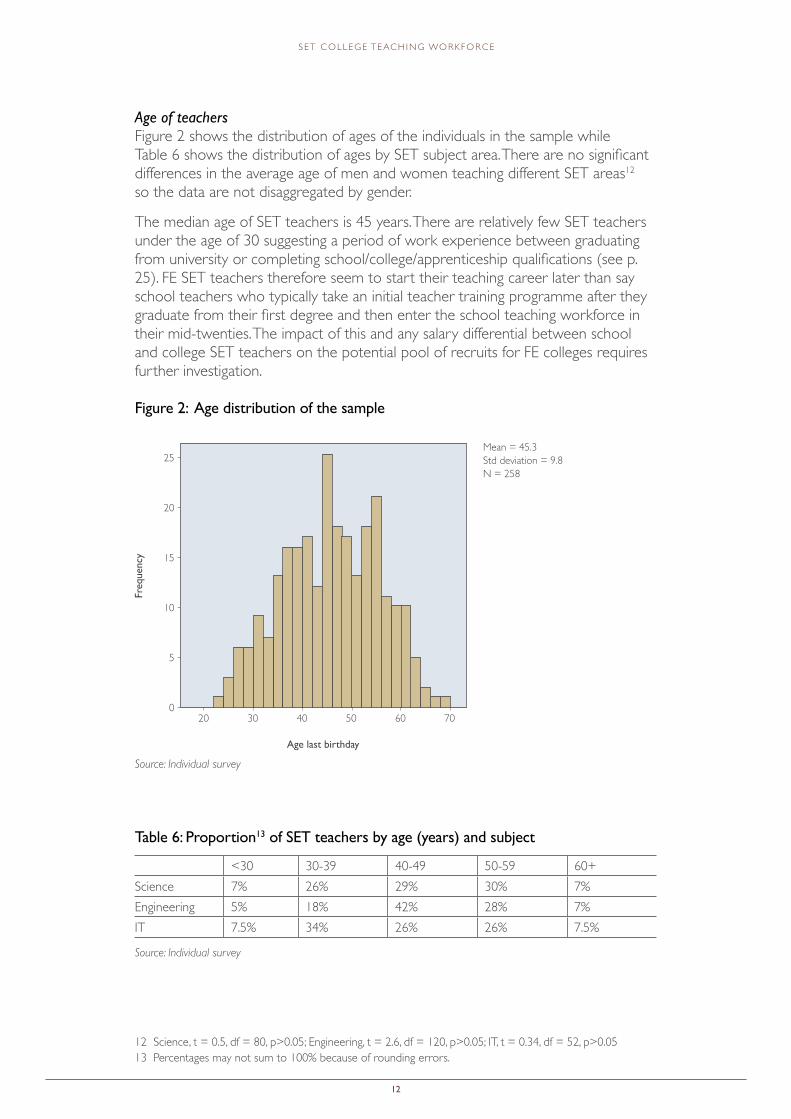
Age of teachersFigure 2 shows the distribution of ages of the individuals in the sample while Table 6 shows the distribution of ages by SET subject area. There are no significant differences in the average age of men and women teaching different SET areas12 so the data are not disaggregated by gender.
The median age of SET teachers is 45 years. There are relatively few SET teachers under the age of 30 suggesting a period of work experience between graduating from university or completing school/college/apprenticeship qualifications (see p. 25). FE SET teachers therefore seem to start their teaching career later than say school teachers who typically take an initial teacher training programme after they graduate from their first degree and then enter the school teaching workforce in their mid-twenties. The impact of this and any salary differential between school and college SET teachers on the potential pool of recruits for FE colleges requires further investigation.
Figure 2: Age distribution of the sample
Source: Individual survey
Table 6: Proportion13 of SET teachers by age (years) and subject
<30 30-39 40-49 50-59 60+Science 7% 26% 29% 30% 7%Engineering 5% 18% 42% 28% 7%IT 7.5% 34% 26% 26% 7.5%
Source: Individual survey
12 Science, t = 0.5, df = 80, p>0.05; Engineering, t = 2.6, df = 120, p>0.05; IT, t = 0.34, df = 52, p>0.0513 Percentages may not sum to 100% because of rounding errors.
Freq
uenc
y
Age last birthday
Mean = 45.3Std deviation = 9.8N = 258
25 -
20 -
15 -
10 -
5 -
0 - 20 5030 6040 70
13
S E T C O L L E G E T E AC H I N G WO R K F O R C E
The typical SET teacher is then aged between 30 and 55. However, 12% of science, 17% of engineers and 15% of IT teachers are aged 55 or over, i.e. within ten years of the old default retirement age for men. Whilst an individual can keep working for as long as they wish under new legislation, it seems reasonable to assume that most will finish full-time work in their mid-sixties. Using the national estimates of the number of SET teachers in FE colleges given in Table 4, and assuming retirement by the mid-sixties, this suggests the replacement demand over the next decade, measured as full-time equivalents (FTEs) simply to maintain the status quo is:
• 250 science FTEs• 700 engineering (including motor vehicle) FTEs• 370 IT FTEs
This is likely to be an under-estimate of the total replacement demand for SET teaching staff, as some may retire earlier and others leave the profession for a variety of other reasons. Adding 5% to the proportion likely to retire over the next ten years, i.e. we assume 17% of the current workforce retires, suggests the following replacement demand over the next decade:
• 350 science FTEs• 900 engineering (including motor vehicle) FTEs• 500 IT FTEs
Thus, there is likely to be a significant replacement demand for FE college teachers and tutors who can provide education and training in SET subjects over the next ten years. If the policy requirement requires an expansion of the FE college SET teaching workforce in order to meet an increased demand for SET skills in the UK labour market, then these numbers would increase further. However, the values quoted are in FTEs – these have to be translated into the number of individuals by taking account of the employment contract, either part-time or full-time, and the number of hours worked on such contracts.
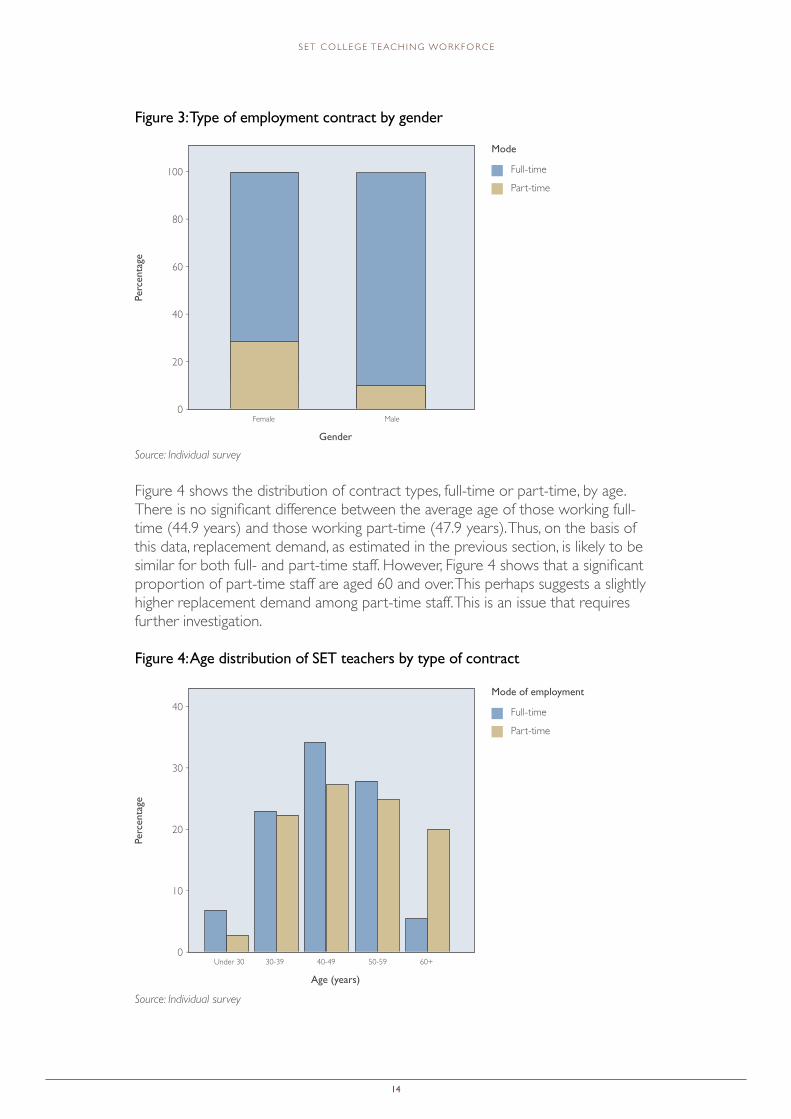
Type of employment contractsIt is important to recognize, from the outset of this section, that in the individual survey sample constructed for this report part-time teachers have been under-sampled14. Figure 3 shows that women (29%) are significantly15 more likely to work part-time than men (10%) resulting in a significant16 over-representation of part-time staff in science disciplines compared with engineering: in this sample 27% of staff in science disciplines work part-time, compared with 5% in engineering and 22% in IT.
14 It is likely that those working on shorter part-time contracts will have been particularly under-sampled and this has an effect on the estimation of the average number of hours worked on part-time contracts.15 c2= 15.8, df = 1, p<0.05, odds of working part-time as a woman are 3.9 times the odds of working part-time as a man.16 c2 = 22.9, df = 4, p<0.05, odds of working part-time in science are 9.5 times higher than in engineering; odds of working part-time in technology are 8 times higher than in engineering.
14
S E T C O L L E G E T E AC H I N G WO R K F O R C E
Figure 3: Type of employment contract by gender
Source: Individual survey
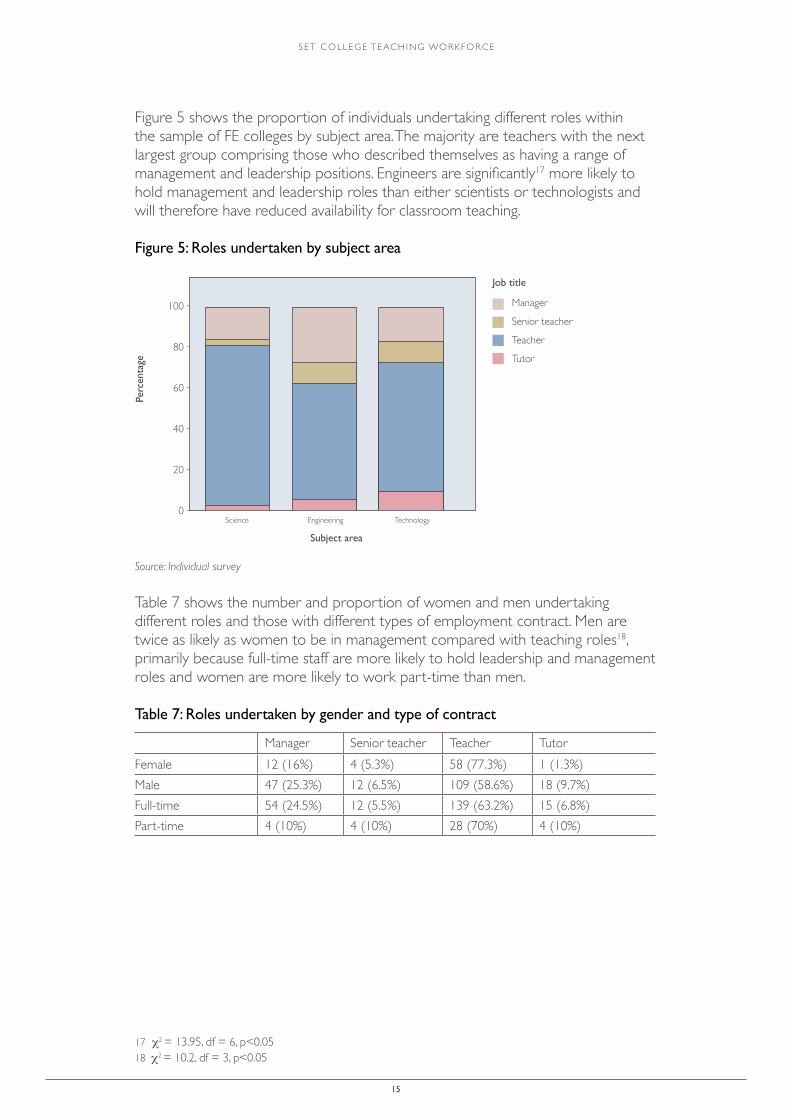
Figure 4 shows the distribution of contract types, full-time or part-time, by age. There is no significant difference between the average age of those working full-time (44.9 years) and those working part-time (47.9 years). Thus, on the basis of this data, replacement demand, as estimated in the previous section, is likely to be similar for both full- and part-time staff. However, Figure 4 shows that a significant proportion of part-time staff are aged 60 and over. This perhaps suggests a slightly higher replacement demand among part-time staff. This is an issue that requires further investigation.
Figure 4: Age distribution of SET teachers by type of contract
Source: Individual survey
Perc
enta
ge
Gender
Mode
Full-time
Part-time100 -
80 -
60 -
40 -
20 -
0 - Female Male
Perc
enta
ge
Age (years)
Mode of employment
Full-time
Part-time
40 -
30 -
20 -
10 -
0 - Under 30 30-39 40-49 50-59 60+
15
S E T C O L L E G E T E AC H I N G WO R K F O R C E
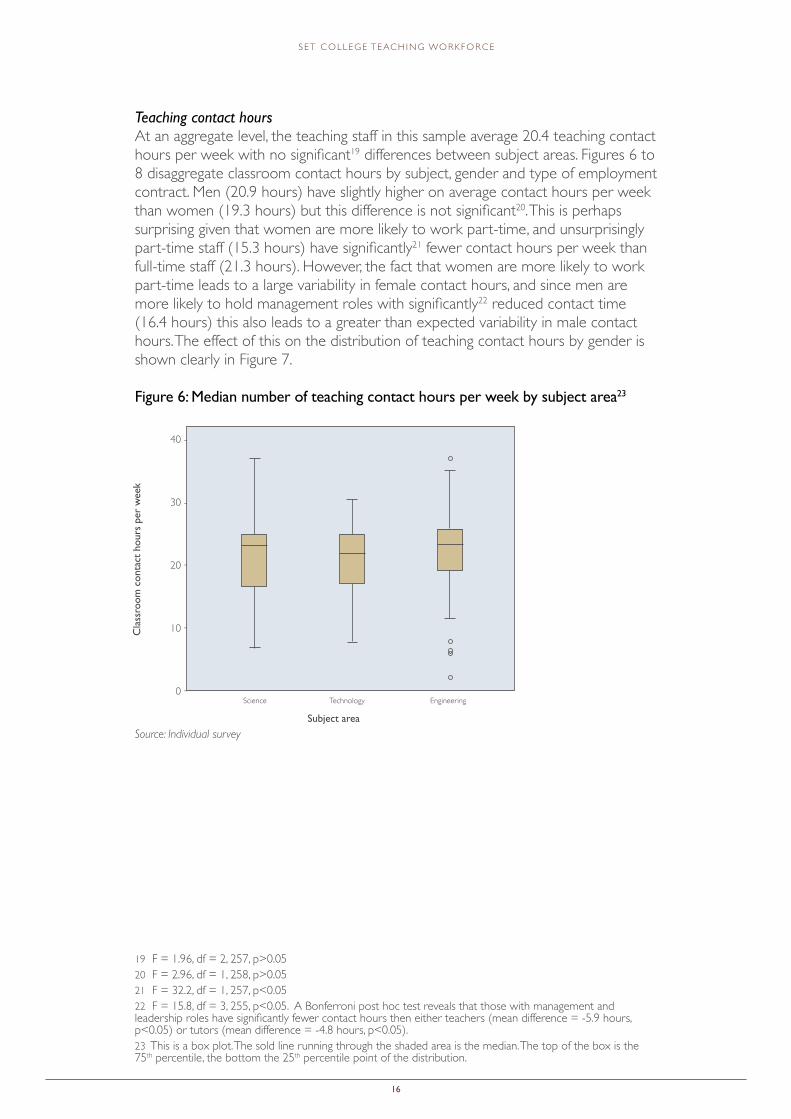
Figure 5 shows the proportion of individuals undertaking different roles within the sample of FE colleges by subject area. The majority are teachers with the next largest group comprising those who described themselves as having a range of management and leadership positions. Engineers are significantly17 more likely to hold management and leadership roles than either scientists or technologists and will therefore have reduced availability for classroom teaching.
Figure 5: Roles undertaken by subject area
Source: Individual survey
Table 7 shows the number and proportion of women and men undertaking different roles and those with different types of employment contract. Men are twice as likely as women to be in management compared with teaching roles18, primarily because full-time staff are more likely to hold leadership and management roles and women are more likely to work part-time than men.
Table 7: Roles undertaken by gender and type of contract
Manager Senior teacher Teacher TutorFemale 12 (16%) 4 (5.3%) 58 (77.3%) 1 (1.3%)Male 47 (25.3%) 12 (6.5%) 109 (58.6%) 18 (9.7%)Full-time 54 (24.5%) 12 (5.5%) 139 (63.2%) 15 (6.8%)Part-time 4 (10%) 4 (10%) 28 (70%) 4 (10%)
17 c2 = 13.95, df = 6, p<0.0518 c2 = 10.2, df = 3, p<0.05
Perc
enta
ge
Subject area
Job title
Manager
Senior teacher
Teacher
Tutor80 -
100 -
60 -
20 -
40 -
0 - Science Engineering Technology
16
S E T C O L L E G E T E AC H I N G WO R K F O R C E
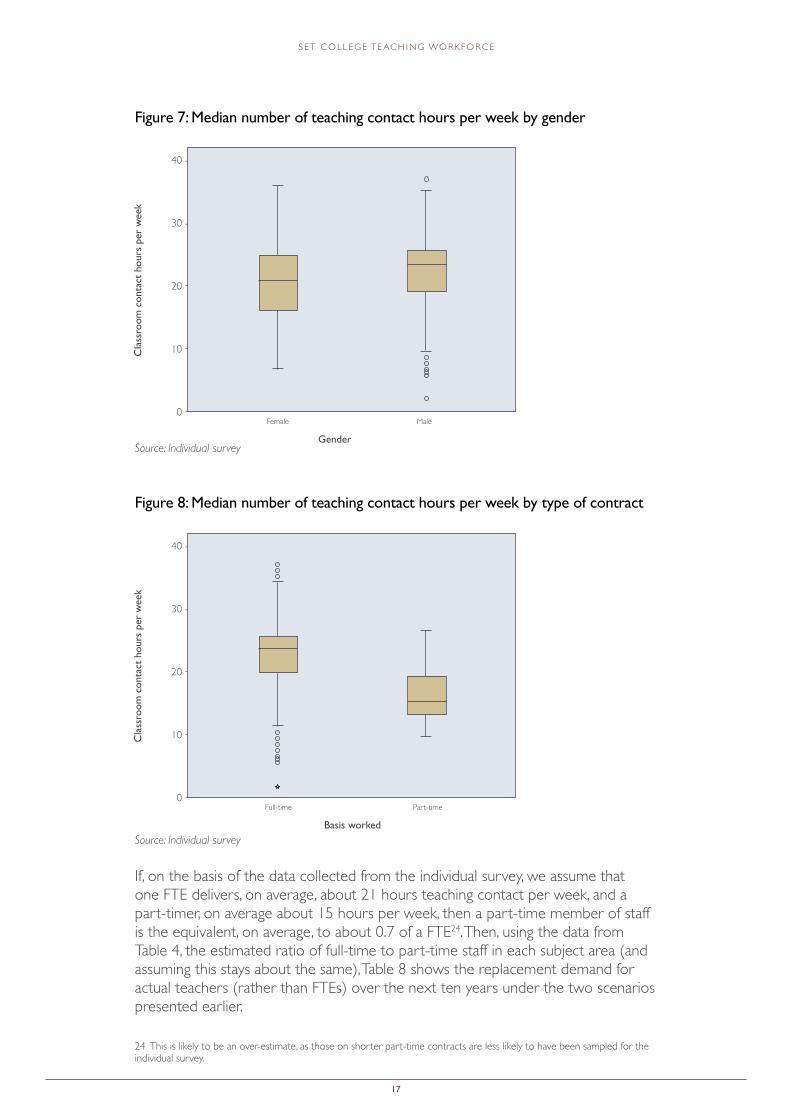
Teaching contact hoursAt an aggregate level, the teaching staff in this sample average 20.4 teaching contact hours per week with no significant19 differences between subject areas. Figures 6 to 8 disaggregate classroom contact hours by subject, gender and type of employment contract. Men (20.9 hours) have slightly higher on average contact hours per week than women (19.3 hours) but this difference is not significant20. This is perhaps surprising given that women are more likely to work part-time, and unsurprisingly part-time staff (15.3 hours) have significantly21 fewer contact hours per week than full-time staff (21.3 hours). However, the fact that women are more likely to work part-time leads to a large variability in female contact hours, and since men are more likely to hold management roles with significantly22 reduced contact time (16.4 hours) this also leads to a greater than expected variability in male contact hours. The effect of this on the distribution of teaching contact hours by gender is shown clearly in Figure 7.
Figure 6: Median number of teaching contact hours per week by subject area23
Source: Individual survey
19 F = 1.96, df = 2, 257, p>0.0520 F = 2.96, df = 1, 258, p>0.0521 F = 32.2, df = 1, 257, p<0.0522 F = 15.8, df = 3, 255, p<0.05. A Bonferroni post hoc test reveals that those with management and leadership roles have significantly fewer contact hours then either teachers (mean difference = -5.9 hours, p<0.05) or tutors (mean difference = -4.8 hours, p<0.05).23 This is a box plot. The sold line running through the shaded area is the median. The top of the box is the 75th percentile, the bottom the 25th percentile point of the distribution.
Cla
ssro
om c
onta
ct h
ours
per
wee
k
Subject area
40 -
20 -
30 -
10 -
0 - Science EngineeringTechnology
17
S E T C O L L E G E T E AC H I N G WO R K F O R C E
Figure 7: Median number of teaching contact hours per week by gender
Source: Individual survey
Figure 8: Median number of teaching contact hours per week by type of contract
Source: Individual survey
If, on the basis of the data collected from the individual survey, we assume that one FTE delivers, on average, about 21 hours teaching contact per week, and a part-timer, on average about 15 hours per week, then a part-time member of staff is the equivalent, on average, to about 0.7 of a FTE24. Then, using the data from Table 4, the estimated ratio of full-time to part-time staff in each subject area (and assuming this stays about the same), Table 8 shows the replacement demand for actual teachers (rather than FTEs) over the next ten years under the two scenarios presented earlier.
24 This is likely to be an over-estimate, as those on shorter part-time contracts are less likely to have been sampled for the individual survey.
Cla
ssro
om c
onta
ct h
ours
per
wee
k
Gender
40 -
20 -
30 -
10 -
0 - Female Male
Cla
ssro
om c
onta
ct h
ours
per
wee
k
Basis worked
40 -
20 -
30 -
10 -
0 - Full-time Part-time
18
S E T C O L L E G E T E AC H I N G WO R K F O R C E
Table 8: Replacement demand for SET staff over the next decade under two different scenarios, rounded to the nearest 50
Scenario 1 Scenario 2FT:PT staff ratio
Proportion leaving
Number of replacements needed
FT:PT staff ratio
Proportion leaving
Number of replacements needed
Science 60:40 12% 300 60:40 17% 400Engineering 80:20 17% 750 80:20 22% 1000Technology 65:35 15% 350 65:35 20% 600
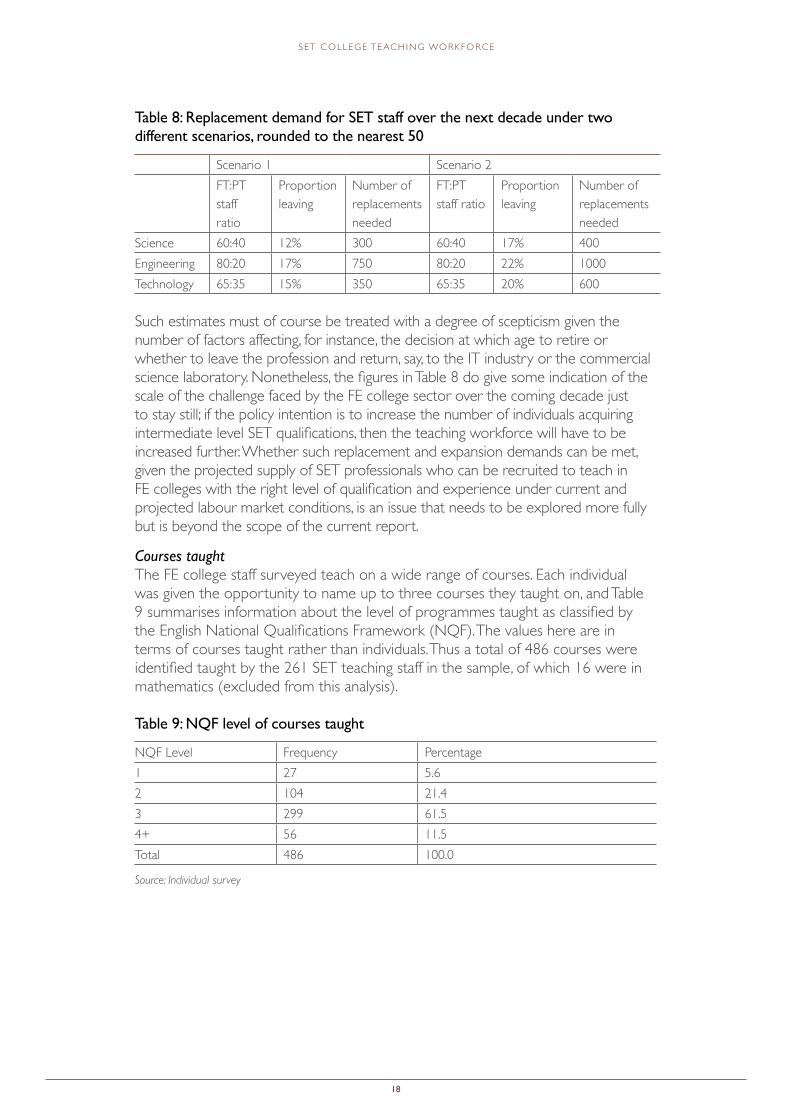
Such estimates must of course be treated with a degree of scepticism given the number of factors affecting, for instance, the decision at which age to retire or whether to leave the profession and return, say, to the IT industry or the commercial science laboratory. Nonetheless, the figures in Table 8 do give some indication of the scale of the challenge faced by the FE college sector over the coming decade just to stay still; if the policy intention is to increase the number of individuals acquiring intermediate level SET qualifications, then the teaching workforce will have to be increased further. Whether such replacement and expansion demands can be met, given the projected supply of SET professionals who can be recruited to teach in FE colleges with the right level of qualification and experience under current and projected labour market conditions, is an issue that needs to be explored more fully but is beyond the scope of the current report.
Courses taughtThe FE college staff surveyed teach on a wide range of courses. Each individual was given the opportunity to name up to three courses they taught on, and Table 9 summarises information about the level of programmes taught as classified by the English National Qualifications Framework (NQF). The values here are in terms of courses taught rather than individuals. Thus a total of 486 courses were identified taught by the 261 SET teaching staff in the sample, of which 16 were in mathematics (excluded from this analysis).
Table 9: NQF level of courses taught
NQF Level Frequency Percentage1 27 5.62 104 21.43 299 61.54+ 56 11.5Total 486 100.0
Source: Individual survey
19
S E T C O L L E G E T E AC H I N G WO R K F O R C E
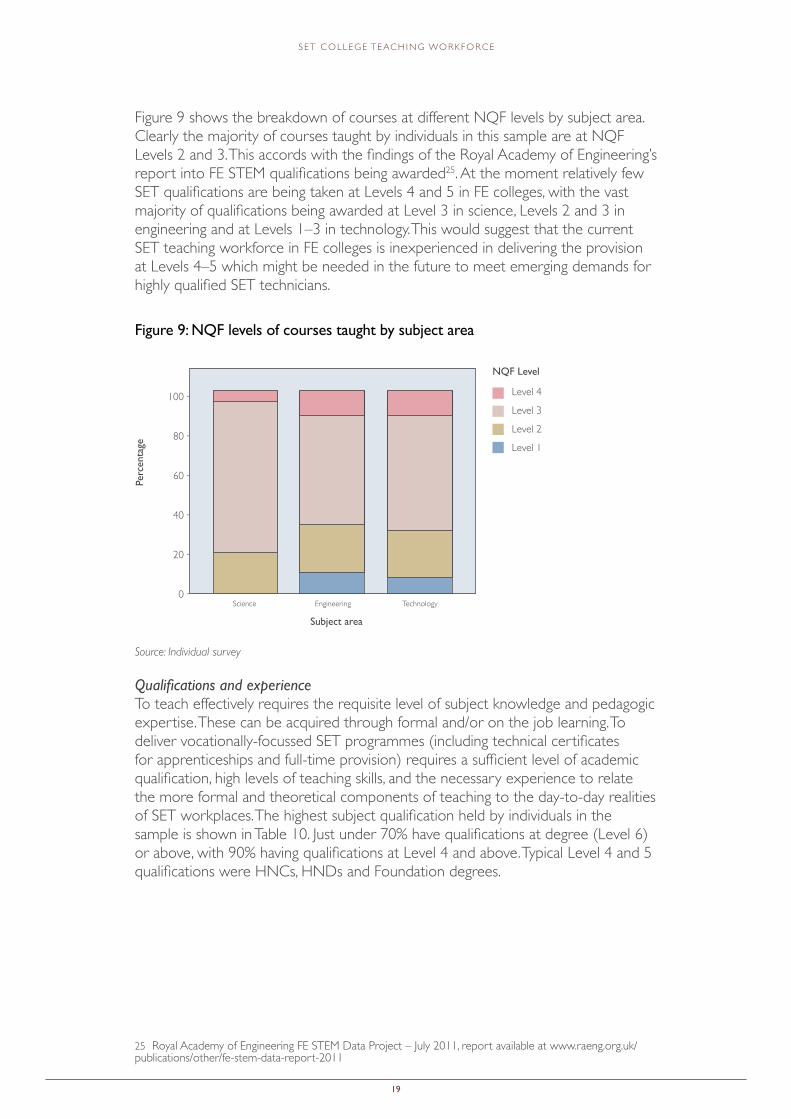
Figure 9 shows the breakdown of courses at different NQF levels by subject area. Clearly the majority of courses taught by individuals in this sample are at NQF Levels 2 and 3. This accords with the findings of the Royal Academy of Engineering’s report into FE STEM qualifications being awarded25. At the moment relatively few SET qualifications are being taken at Levels 4 and 5 in FE colleges, with the vast majority of qualifications being awarded at Level 3 in science, Levels 2 and 3 in engineering and at Levels 1–3 in technology. This would suggest that the current SET teaching workforce in FE colleges is inexperienced in delivering the provision at Levels 4–5 which might be needed in the future to meet emerging demands for highly qualified SET technicians.
Figure 9: NQF levels of courses taught by subject area
Source: Individual survey
Qualifications and experienceTo teach effectively requires the requisite level of subject knowledge and pedagogic expertise. These can be acquired through formal and/or on the job learning. To deliver vocationally-focussed SET programmes (including technical certificates for apprenticeships and full-time provision) requires a sufficient level of academic qualification, high levels of teaching skills, and the necessary experience to relate the more formal and theoretical components of teaching to the day-to-day realities of SET workplaces. The highest subject qualification held by individuals in the sample is shown in Table 10. Just under 70% have qualifications at degree (Level 6) or above, with 90% having qualifications at Level 4 and above. Typical Level 4 and 5 qualifications were HNCs, HNDs and Foundation degrees.
25 Royal Academy of Engineering FE STEM Data Project – July 2011, report available at www.raeng.org.uk/publications/other/fe-stem-data-report-2011
Perc
enta
ge
Subject area
NQF Level
Level 4
Level 3
Level 2
Level 180 -
100 -
60 -
20 -
40 -
0 - Science Engineering Technology
20
S E T C O L L E G E T E AC H I N G WO R K F O R C E
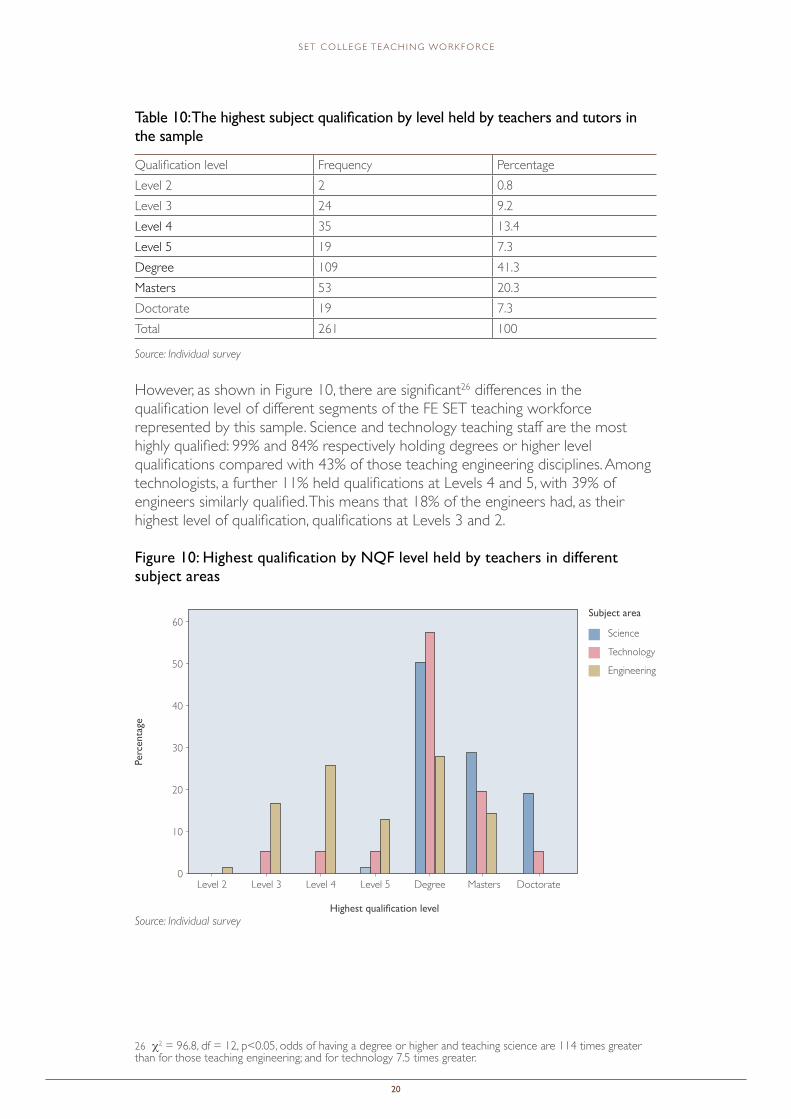
Table 10: The highest subject qualification by level held by teachers and tutors in the sample
Qualification level Frequency PercentageLevel 2 2 0.8Level 3 24 9.2Level 4 35 13.4Level 5 19 7.3Degree 109 41.3Masters 53 20.3Doctorate 19 7.3Total 261 100
Source: Individual survey
However, as shown in Figure 10, there are significant26 differences in the qualification level of different segments of the FE SET teaching workforce represented by this sample. Science and technology teaching staff are the most highly qualified: 99% and 84% respectively holding degrees or higher level qualifications compared with 43% of those teaching engineering disciplines. Among technologists, a further 11% held qualifications at Levels 4 and 5, with 39% of engineers similarly qualified. This means that 18% of the engineers had, as their highest level of qualification, qualifications at Levels 3 and 2.
Figure 10: Highest qualification by NQF level held by teachers in different subject areas
Source: Individual survey
26 c2 = 96.8, df = 12, p<0.05, odds of having a degree or higher and teaching science are 114 times greater than for those teaching engineering; and for technology 7.5 times greater.
Perc
enta
ge
Highest qualification level
60 -
50 -
40 -
30 -
20 -
10 -
0 - Level 2 Level 3 Level 4 Level 5 Degree Masters Doctorate
Subject area
Science
Technology
Engineering
21
S E T C O L L E G E T E AC H I N G WO R K F O R C E
There are no significant27 differences in the level of qualification held by those teaching full- or part-time.
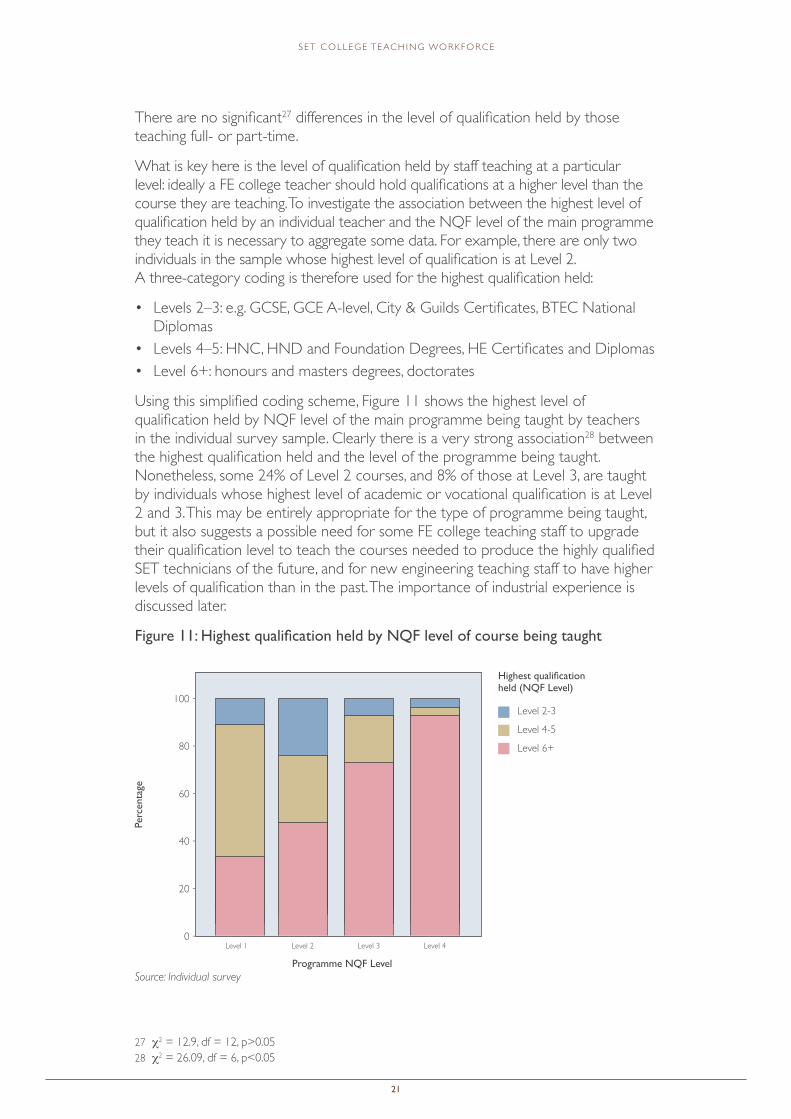
What is key here is the level of qualification held by staff teaching at a particular level: ideally a FE college teacher should hold qualifications at a higher level than the course they are teaching. To investigate the association between the highest level of qualification held by an individual teacher and the NQF level of the main programme they teach it is necessary to aggregate some data. For example, there are only two individuals in the sample whose highest level of qualification is at Level 2. A three-category coding is therefore used for the highest qualification held:
• Levels 2–3: e.g. GCSE, GCE A-level, City & Guilds Certificates, BTEC National Diplomas
• Levels 4–5: HNC, HND and Foundation Degrees, HE Certificates and Diplomas• Level 6+: honours and masters degrees, doctorates
Using this simplified coding scheme, Figure 11 shows the highest level of qualification held by NQF level of the main programme being taught by teachers in the individual survey sample. Clearly there is a very strong association28 between the highest qualification held and the level of the programme being taught. Nonetheless, some 24% of Level 2 courses, and 8% of those at Level 3, are taught by individuals whose highest level of academic or vocational qualification is at Level 2 and 3. This may be entirely appropriate for the type of programme being taught, but it also suggests a possible need for some FE college teaching staff to upgrade their qualification level to teach the courses needed to produce the highly qualified SET technicians of the future, and for new engineering teaching staff to have higher levels of qualification than in the past. The importance of industrial experience is discussed later.
Figure 11: Highest qualification held by NQF level of course being taught
Source: Individual survey
27 c2 = 12.9, df = 12, p>0.0528 c2 = 26.09, df = 6, p<0.05
Perc
enta
ge
Programme NQF Level
Highest qualification held (NQF Level)
Level 2-3
Level 4-5
Level 6+
100 -
80 -
60 -
40 -
20 -
0 - Level 1 Level 3Level 2 Level 4

22
S E T C O L L E G E T E AC H I N G WO R K F O R C E
Table 11 summarises the proportions in the sample holding different types of teaching qualifications. A small proportion holds multiple teaching qualifications, and for them the highest qualification is recorded in Table 9. Of the 261 SET teachers and tutors in the sample, 25 (10%) either held no teaching qualifications or provided no information about the teaching qualifications they held. The majority (70%) had high levels of teaching qualifications such as PGCE, Cert Ed, BEd/QTS or the Diploma in Teaching in the Lifelong Learning Sector (or equivalent). This level of qualification reflects the emphasis placed on teacher training and development in the FE sector over the last few years.
Table 11: Highest teaching qualification held by teachers and tutors in the sample
Frequency PercentagePGCE 89 34CERT Ed 60 23B.Ed./QTS 5 2PTLLS1 equivalent 32 12CTLLS2 equivalent 21 8DTLLS3 equivalent 29 11No reported qualifications 25 10Total 261 100
Source: Individual survey
Figure 12 indicates that there are some significant29 differences between subject areas in the level of highest teaching qualification held. Clearly scientists are more likely to hold PGCEs than either engineering or technology teachers, but engineers are more likely to have the Certificate of Education (Cert Ed) qualification. The most likely explanation for this difference is that science teachers and tutors are more likely to be qualified to degree level, a pre-requisite to study for a Post Graduate Certificate in Education, than those teaching engineering disciplines. Engineers and IT specialists are more likely to have qualifications such as the PTLLS, CTLLS and DTLLS than scientists, reflecting the development of teaching skills and expertise after commencing teaching as a career rather than through a pre-service route.
29 c2 = 63.2, df = 12, p<0.05
1 PTLLS Award in Preparing to Teach in the Lifelong Learning Sector2 CTLLS Certificate in Preparing to Teach in the Lifelong Learning Sector3 DTLLS Diploma in Preparing to Teach in the Lifelong Learning Sector

23
S E T C O L L E G E T E AC H I N G WO R K F O R C E
Figure 12: Highest teaching qualification held by subject area taught
Source: Individual survey
There are no significant differences in the level of teaching qualification held between part-time and full-time staff30. Furthermore, there is no significant association between a teacher’s age and their qualification level31.
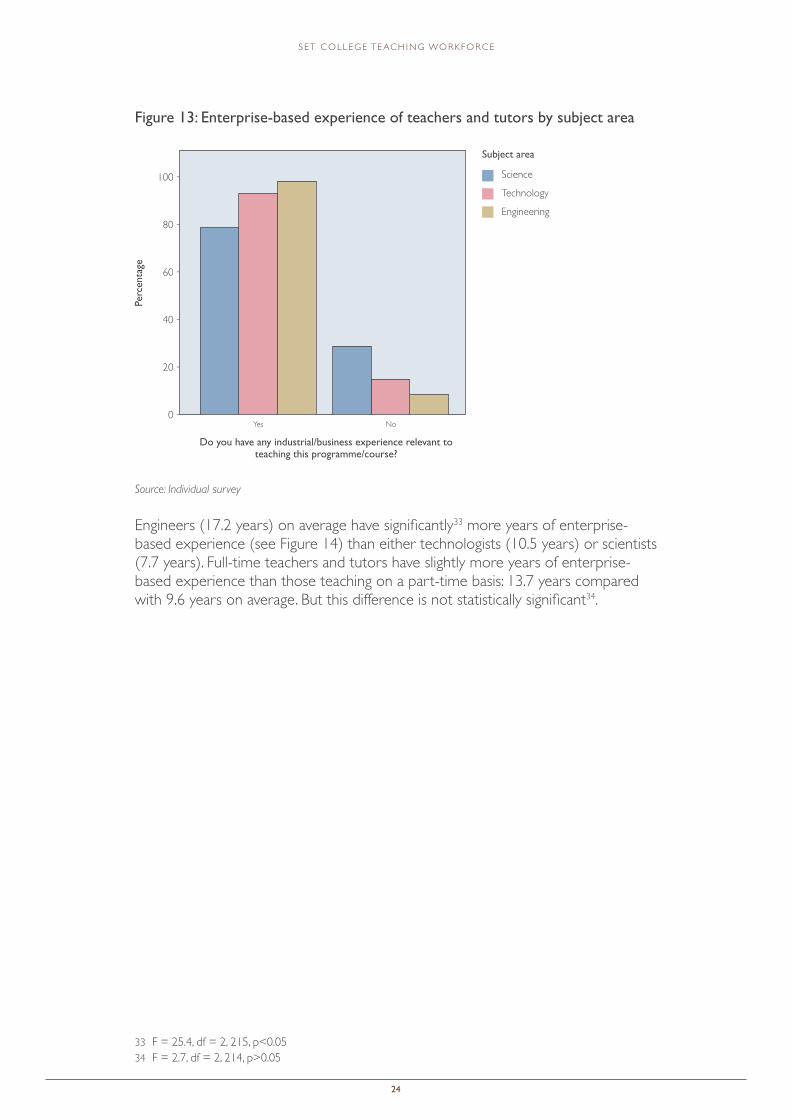
Industrial experienceThe other way of developing knowledge and skills is via experience, both in enterprises and as teachers. Here the engineers (see Figure 13) are significantly32 more likely to report having had relevant enterprise-based experience than the scientists (though not the technologists). Nonetheless, nearly three-quarters of those teaching science subjects report having had some enterprise-based experience relevant to the courses they are teaching, compared with 87% of those teaching technology and 93% of those teaching engineering disciplines.
30 c2 = 6.6, df = 6, p>0.0531 F = 1.05, df = 6,251, p>0.0532 c2 = 14.4, df = 2, p<0.05, the odds of an engineer reporting relevant industrial experience are 4.5 times greater than for an individual teaching science, and just under 2 times greater when compared with technologists.
Perc
enta
ge
Subject area
Highest teaching qualification
PGCE
CERT Ed
BEd/QTS
DTLLS equivalent
CTLLS equivalent
PTLLS equivalent
No reported qualifications
100 -
80 -
60 -
40 -
20 -
0 - Science Engineering Technology
24
S E T C O L L E G E T E AC H I N G WO R K F O R C E
Figure 13: Enterprise-based experience of teachers and tutors by subject area
Source: Individual survey
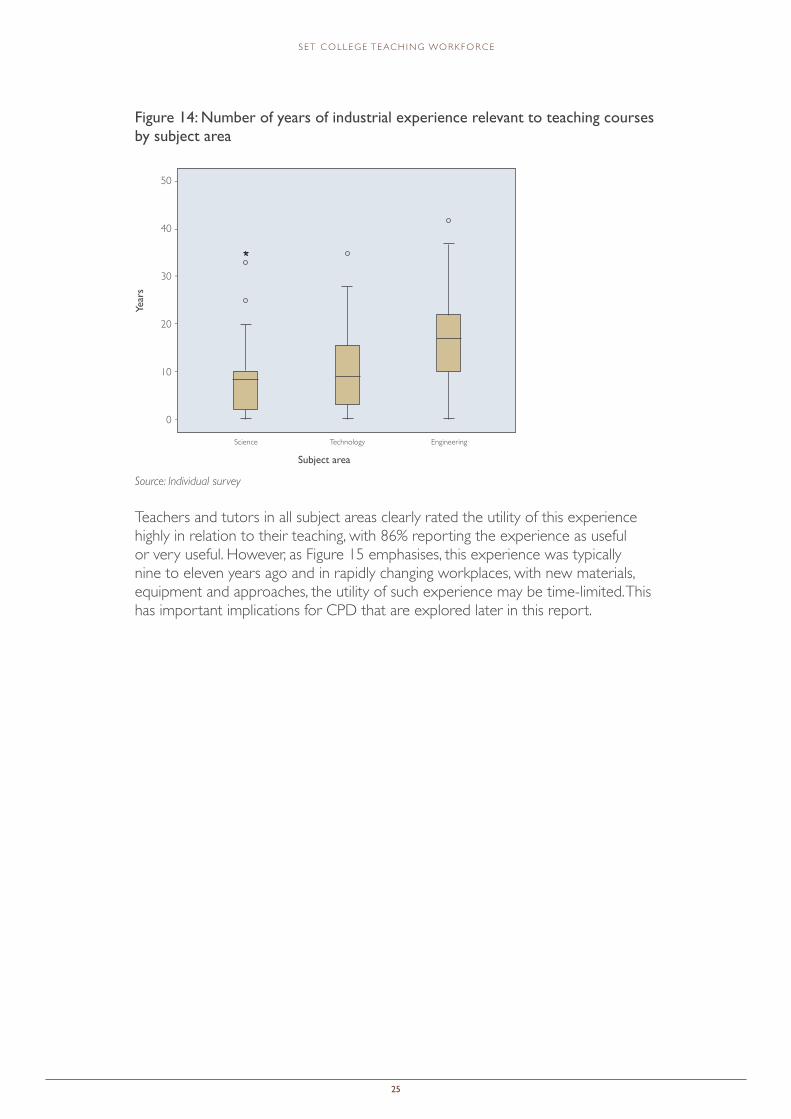
Engineers (17.2 years) on average have significantly33 more years of enterprise-based experience (see Figure 14) than either technologists (10.5 years) or scientists (7.7 years). Full-time teachers and tutors have slightly more years of enterprise-based experience than those teaching on a part-time basis: 13.7 years compared with 9.6 years on average. But this difference is not statistically significant34.
33 F = 25.4, df = 2, 215, p<0.0534 F = 2.7, df = 2, 214, p>0.05
Perc
enta
ge
Do you have any industrial/business experience relevant to teaching this programme/course?
Subject area
Science
Technology
Engineering
100 -
80 -
60 -
40 -
20 -
0 - Yes No
25
S E T C O L L E G E T E AC H I N G WO R K F O R C E
Figure 14: Number of years of industrial experience relevant to teaching courses by subject area
Source: Individual survey
Teachers and tutors in all subject areas clearly rated the utility of this experience highly in relation to their teaching, with 86% reporting the experience as useful or very useful. However, as Figure 15 emphasises, this experience was typically nine to eleven years ago and in rapidly changing workplaces, with new materials, equipment and approaches, the utility of such experience may be time-limited. This has important implications for CPD that are explored later in this report.
Year
s
Subject area
50 -
30 -
40 -
20 -
10 -
0 -
Science Technology Engineering
26
S E T C O L L E G E T E AC H I N G WO R K F O R C E
Figure 15: Time elapsed since most recent enterprise-based experiences by subject area
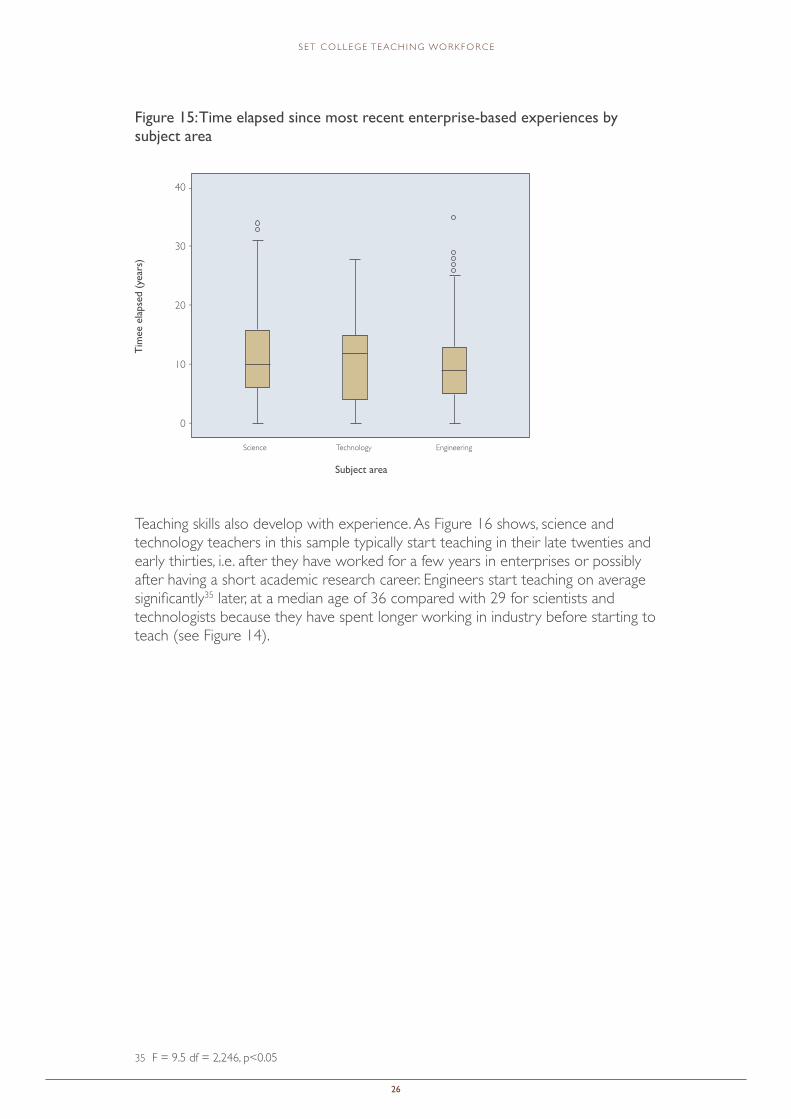
Teaching skills also develop with experience. As Figure 16 shows, science and technology teachers in this sample typically start teaching in their late twenties and early thirties, i.e. after they have worked for a few years in enterprises or possibly after having a short academic research career. Engineers start teaching on average significantly35 later, at a median age of 36 compared with 29 for scientists and technologists because they have spent longer working in industry before starting to teach (see Figure 14).
35 F = 9.5 df = 2,246, p<0.05
Tim
ee e
laps
ed (
year
s)
Subject area
40 -
20 -
30 -
10 -
0 -
Science Technology Engineering
27
S E T C O L L E G E T E AC H I N G WO R K F O R C E
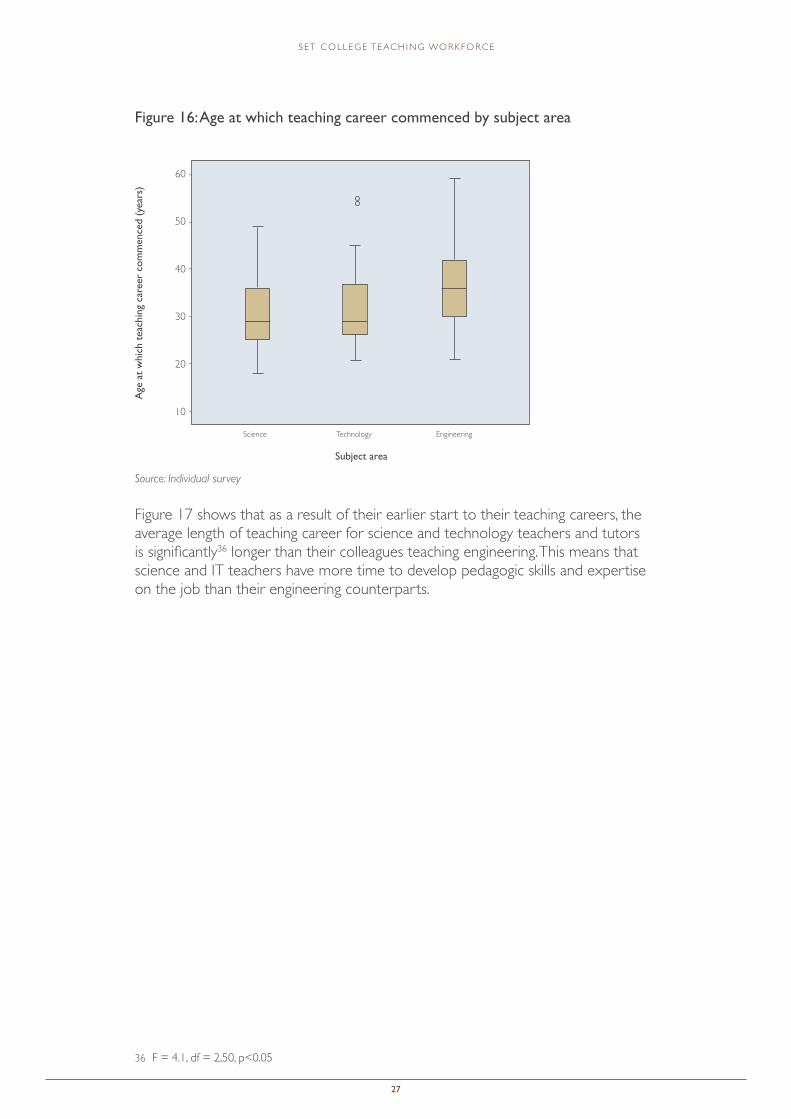
Figure 16: Age at which teaching career commenced by subject area
Source: Individual survey
Figure 17 shows that as a result of their earlier start to their teaching careers, the average length of teaching career for science and technology teachers and tutors is significantly36 longer than their colleagues teaching engineering. This means that science and IT teachers have more time to develop pedagogic skills and expertise on the job than their engineering counterparts.
36 F = 4.1, df = 2,50, p<0.05
Age
at
whi
ch t
each
ing
care
er c
omm
ence
d (y
ears
)
Subject area
60 -
40 -
50 -
30 -
20 -
10 -
Science Technology Engineering
28
S E T C O L L E G E T E AC H I N G WO R K F O R C E
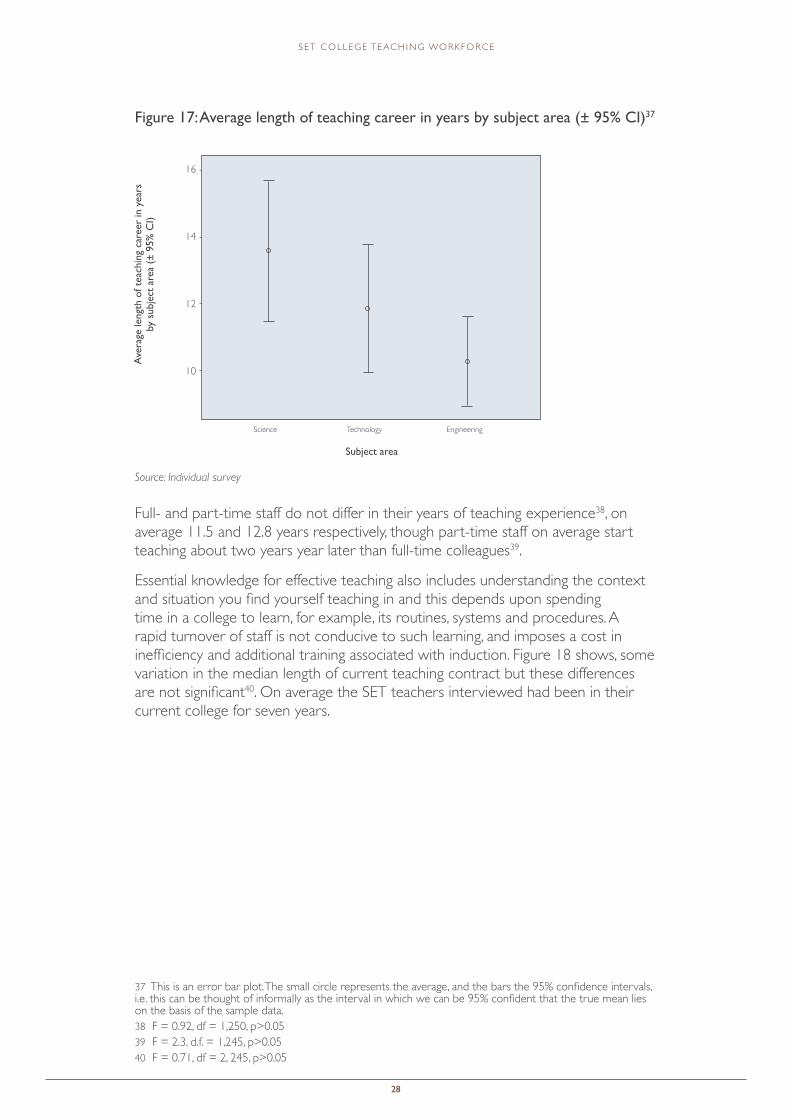
Figure 17: Average length of teaching career in years by subject area (± 95% CI)37
Source: Individual survey
Full- and part-time staff do not differ in their years of teaching experience38, on average 11.5 and 12.8 years respectively, though part-time staff on average start teaching about two years year later than full-time colleagues39.
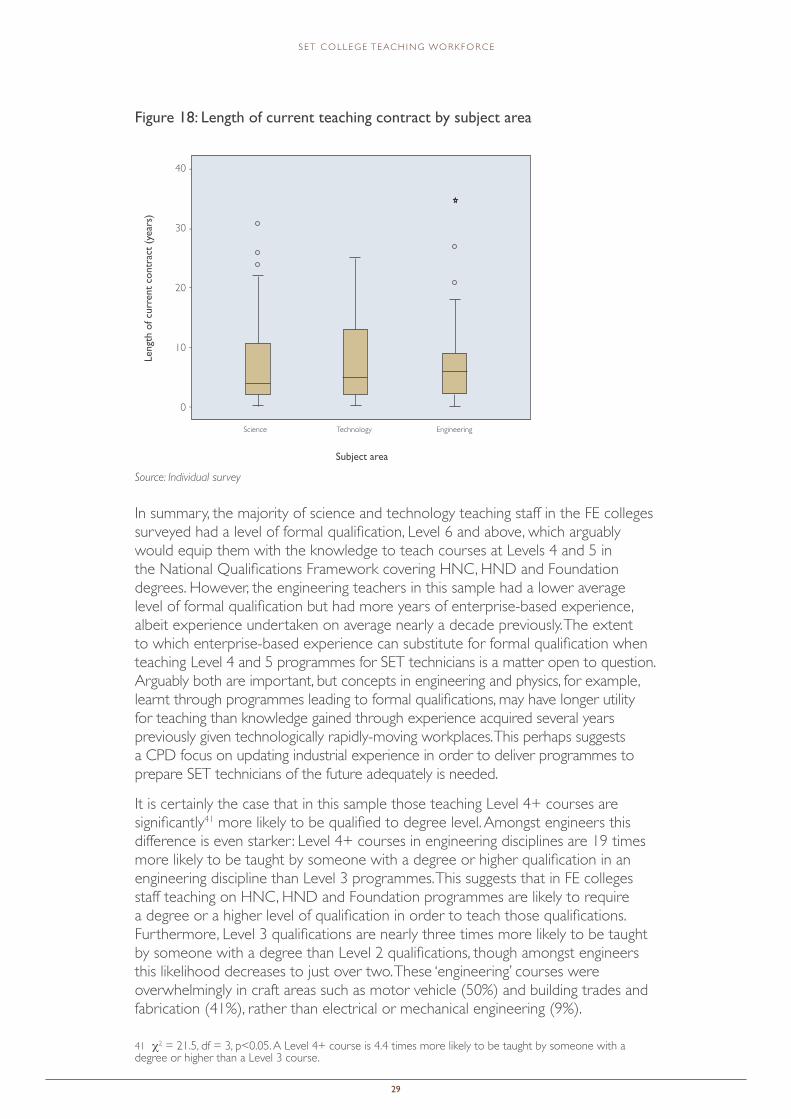
Essential knowledge for effective teaching also includes understanding the context and situation you find yourself teaching in and this depends upon spending time in a college to learn, for example, its routines, systems and procedures. A rapid turnover of staff is not conducive to such learning, and imposes a cost in inefficiency and additional training associated with induction. Figure 18 shows, some variation in the median length of current teaching contract but these differences are not significant40. On average the SET teachers interviewed had been in their current college for seven years.
37 This is an error bar plot. The small circle represents the average, and the bars the 95% confidence intervals, i.e. this can be thought of informally as the interval in which we can be 95% confident that the true mean lies on the basis of the sample data.38 F = 0.92, df = 1,250, p>0.0539 F = 2.3, d.f. = 1,245, p>0.0540 F = 0.71, df = 2, 245, p>0.05
Ave
rage
leng
th o
f tea
chin
g ca
reer
in y
ears
by
sub
ject
are
a (±
95%
CI)
Subject area
16 -
12 -
14 -
10 -
Science Technology Engineering
29
S E T C O L L E G E T E AC H I N G WO R K F O R C E
Figure 18: Length of current teaching contract by subject area
Source: Individual survey
In summary, the majority of science and technology teaching staff in the FE colleges surveyed had a level of formal qualification, Level 6 and above, which arguably would equip them with the knowledge to teach courses at Levels 4 and 5 in the National Qualifications Framework covering HNC, HND and Foundation degrees. However, the engineering teachers in this sample had a lower average level of formal qualification but had more years of enterprise-based experience, albeit experience undertaken on average nearly a decade previously. The extent to which enterprise-based experience can substitute for formal qualification when teaching Level 4 and 5 programmes for SET technicians is a matter open to question. Arguably both are important, but concepts in engineering and physics, for example, learnt through programmes leading to formal qualifications, may have longer utility for teaching than knowledge gained through experience acquired several years previously given technologically rapidly-moving workplaces. This perhaps suggests a CPD focus on updating industrial experience in order to deliver programmes to prepare SET technicians of the future adequately is needed.
It is certainly the case that in this sample those teaching Level 4+ courses are significantly41 more likely to be qualified to degree level. Amongst engineers this difference is even starker : Level 4+ courses in engineering disciplines are 19 times more likely to be taught by someone with a degree or higher qualification in an engineering discipline than Level 3 programmes. This suggests that in FE colleges staff teaching on HNC, HND and Foundation programmes are likely to require a degree or a higher level of qualification in order to teach those qualifications. Furthermore, Level 3 qualifications are nearly three times more likely to be taught by someone with a degree than Level 2 qualifications, though amongst engineers this likelihood decreases to just over two. These ‘engineering’ courses were overwhelmingly in craft areas such as motor vehicle (50%) and building trades and fabrication (41%), rather than electrical or mechanical engineering (9%).
41 c2 = 21.5, df = 3, p<0.05. A Level 4+ course is 4.4 times more likely to be taught by someone with a degree or higher than a Level 3 course.
Leng
th o
f cur
rent
con
trac
t (y
ears
)
Subject area
40 -
20 -
30 -
10 -
0 -
Science Technology Engineering
30
S E T C O L L E G E T E AC H I N G WO R K F O R C E
Nonetheless, it is the case for all SET disciplines that Level 3 and above programmes, which would include those programmes required to develop intermediate technician level skills, are more likely to be taught by someone with a degree. That suggests that meeting both replacement and expansion demand in the SET teaching workforce would require FE colleges both to recruit more people with degrees in the SET disciplines, particularly engineering, and to upskill their existing workforce through CPD programmes. In terms of recruitment, this requirement for a higher level of initial qualification in the future may reduce the size of the recruitment pool making the task of acquiring the right quality of teachers from the wider labour market, in the face of competition from enterprises and other education providers, even more challenging.
As teachers the individuals in this sample are, in the main, both well-qualified and experienced, perhaps reflecting the ongoing effort that FE colleges have put into improving the teaching qualifications of their staff. However, it is clear that FE college SET teachers and tutors start their careers as teachers later than, say, school teachers. The industrial experience they acquire in the meantime is clearly important for their role as FE teachers. But this also potentially reduces the pool of recruits, making meeting replacement demand, let alone any expansion demand, a very significant challenge.
31
S E T C O L L E G E T E AC H I N G WO R K F O R C E
SECTION 4 CPD PROVISION
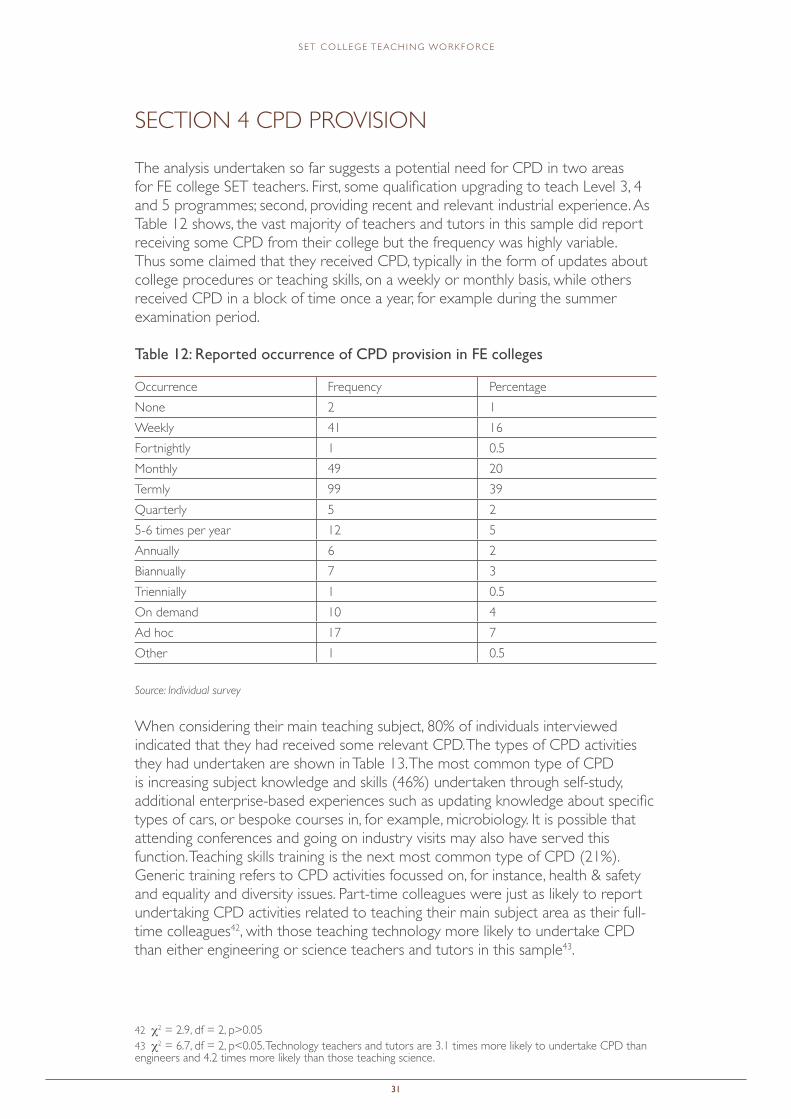
The analysis undertaken so far suggests a potential need for CPD in two areas for FE college SET teachers. First, some qualification upgrading to teach Level 3, 4 and 5 programmes; second, providing recent and relevant industrial experience. As Table 12 shows, the vast majority of teachers and tutors in this sample did report receiving some CPD from their college but the frequency was highly variable. Thus some claimed that they received CPD, typically in the form of updates about college procedures or teaching skills, on a weekly or monthly basis, while others received CPD in a block of time once a year, for example during the summer examination period.
Table 12: Reported occurrence of CPD provision in FE colleges
Occurrence Frequency PercentageNone 2 1Weekly 41 16Fortnightly 1 0.5Monthly 49 20Termly 99 39Quarterly 5 25-6 times per year 12 5Annually 6 2Biannually 7 3Triennially 1 0.5On demand 10 4Ad hoc 17 7Other 1 0.5
Source: Individual survey
When considering their main teaching subject, 80% of individuals interviewed indicated that they had received some relevant CPD. The types of CPD activities they had undertaken are shown in Table 13. The most common type of CPD is increasing subject knowledge and skills (46%) undertaken through self-study, additional enterprise-based experiences such as updating knowledge about specific types of cars, or bespoke courses in, for example, microbiology. It is possible that attending conferences and going on industry visits may also have served this function. Teaching skills training is the next most common type of CPD (21%). Generic training refers to CPD activities focussed on, for instance, health & safety and equality and diversity issues. Part-time colleagues were just as likely to report undertaking CPD activities related to teaching their main subject area as their full-time colleagues42, with those teaching technology more likely to undertake CPD than either engineering or science teachers and tutors in this sample43.
42 c2 = 2.9, df = 2, p>0.0543 c2 = 6.7, df = 2, p<0.05. Technology teachers and tutors are 3.1 times more likely to undertake CPD than engineers and 4.2 times more likely than those teaching science.
32
S E T C O L L E G E T E AC H I N G WO R K F O R C E
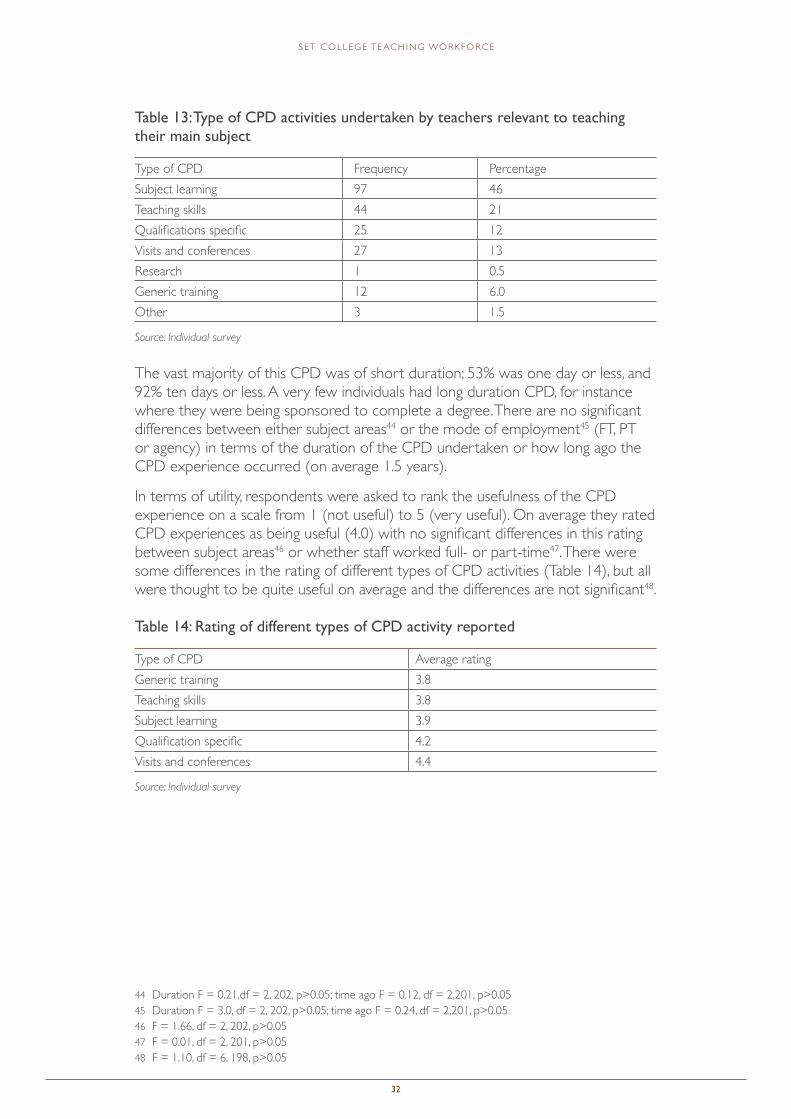
Table 13: Type of CPD activities undertaken by teachers relevant to teaching their main subject
Type of CPD Frequency PercentageSubject learning 97 46Teaching skills 44 21Qualifications specific 25 12Visits and conferences 27 13Research 1 0.5Generic training 12 6.0Other 3 1.5
Source: Individual survey
The vast majority of this CPD was of short duration; 53% was one day or less, and 92% ten days or less. A very few individuals had long duration CPD, for instance where they were being sponsored to complete a degree. There are no significant differences between either subject areas44 or the mode of employment45 (FT, PT or agency) in terms of the duration of the CPD undertaken or how long ago the CPD experience occurred (on average 1.5 years).
In terms of utility, respondents were asked to rank the usefulness of the CPD experience on a scale from 1 (not useful) to 5 (very useful). On average they rated CPD experiences as being useful (4.0) with no significant differences in this rating between subject areas46 or whether staff worked full- or part-time47. There were some differences in the rating of different types of CPD activities (Table 14), but all were thought to be quite useful on average and the differences are not significant48.
Table 14: Rating of different types of CPD activity reported
Type of CPD Average ratingGeneric training 3.8Teaching skills 3.8Subject learning 3.9Qualification specific 4.2Visits and conferences 4.4
Source: Individual survey
44 Duration F = 0.21,df = 2, 202, p>0.05; time ago F = 0.12, df = 2,201, p>0.05 45 Duration F = 3.0, df = 2, 202, p>0.05; time ago F = 0.24, df = 2,201, p>0.0546 F = 1.66, df = 2, 202, p>0.0547 F = 0.01, df = 2, 201, p>0.0548 F = 1.10, df = 6, 198, p>0.05
33
S E T C O L L E G E T E AC H I N G WO R K F O R C E
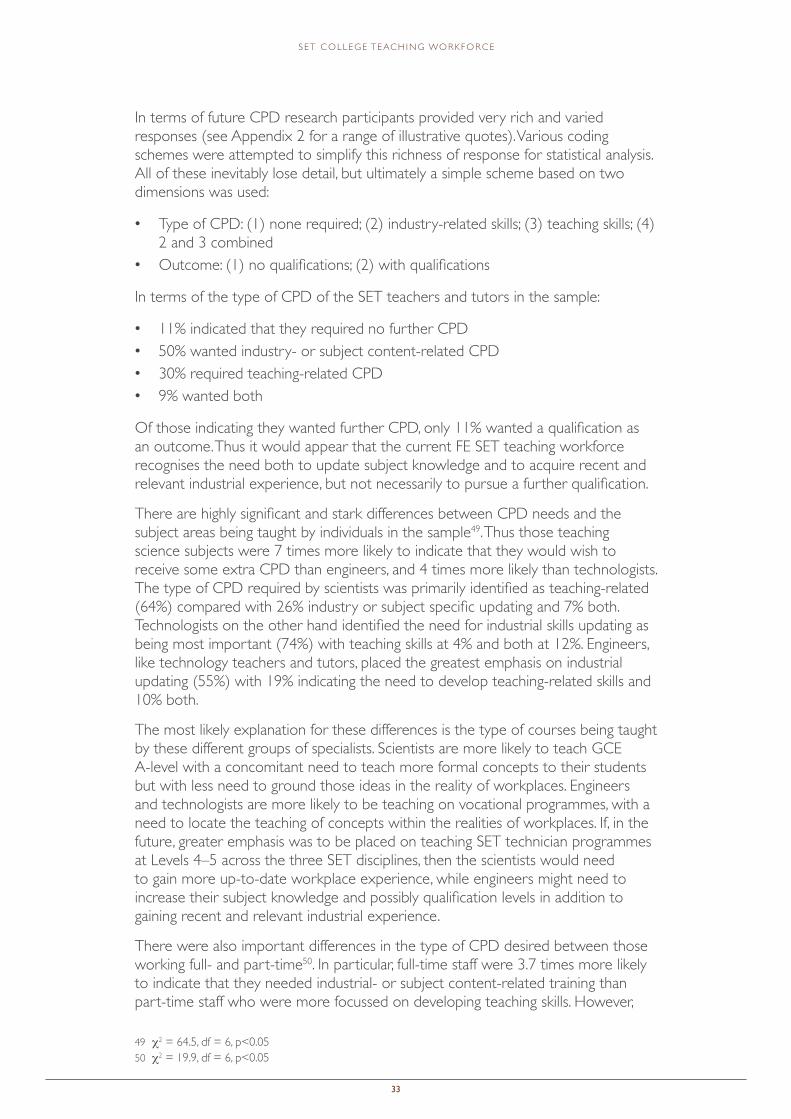
In terms of future CPD research participants provided very rich and varied responses (see Appendix 2 for a range of illustrative quotes). Various coding schemes were attempted to simplify this richness of response for statistical analysis. All of these inevitably lose detail, but ultimately a simple scheme based on two dimensions was used:
• Type of CPD: (1) none required; (2) industry-related skills; (3) teaching skills; (4) 2 and 3 combined
• Outcome: (1) no qualifications; (2) with qualifications
In terms of the type of CPD of the SET teachers and tutors in the sample:
• 11% indicated that they required no further CPD• 50% wanted industry- or subject content-related CPD• 30% required teaching-related CPD• 9% wanted both
Of those indicating they wanted further CPD, only 11% wanted a qualification as an outcome. Thus it would appear that the current FE SET teaching workforce recognises the need both to update subject knowledge and to acquire recent and relevant industrial experience, but not necessarily to pursue a further qualification.
There are highly significant and stark differences between CPD needs and the subject areas being taught by individuals in the sample49. Thus those teaching science subjects were 7 times more likely to indicate that they would wish to receive some extra CPD than engineers, and 4 times more likely than technologists. The type of CPD required by scientists was primarily identified as teaching-related (64%) compared with 26% industry or subject specific updating and 7% both. Technologists on the other hand identified the need for industrial skills updating as being most important (74%) with teaching skills at 4% and both at 12%. Engineers, like technology teachers and tutors, placed the greatest emphasis on industrial updating (55%) with 19% indicating the need to develop teaching-related skills and 10% both.
The most likely explanation for these differences is the type of courses being taught by these different groups of specialists. Scientists are more likely to teach GCE A-level with a concomitant need to teach more formal concepts to their students but with less need to ground those ideas in the reality of workplaces. Engineers and technologists are more likely to be teaching on vocational programmes, with a need to locate the teaching of concepts within the realities of workplaces. If, in the future, greater emphasis was to be placed on teaching SET technician programmes at Levels 4–5 across the three SET disciplines, then the scientists would need to gain more up-to-date workplace experience, while engineers might need to increase their subject knowledge and possibly qualification levels in addition to gaining recent and relevant industrial experience.
There were also important differences in the type of CPD desired between those working full- and part-time50. In particular, full-time staff were 3.7 times more likely to indicate that they needed industrial- or subject content-related training than part-time staff who were more focussed on developing teaching skills. However,
49 c2 = 64.5, df = 6, p<0.0550 c2 = 19.9, df = 6, p<0.05

34
S E T C O L L E G E T E AC H I N G WO R K F O R C E
this association is linked to the distribution of part-time and full-time staff across subject areas, with a greater proportion of part-time teachers of science. Once this is controlled for the association disappears.
Those who indicated that they did not require any further CPD were on the whole slightly older than those wanting further training, and they also had slightly more teaching experience. But these differences are not significant51.
51 F = 1.67, df = 3,219, p>0.05 and F = 1.4, df = 3,219, p>0.05
35
S E T C O L L E G E T E AC H I N G WO R K F O R C E
SECTION 5 CONCLUSION
There is growing evidence of increasing demand for SET technicians at both skilled trade and associate professional occupational levels. However, for FE colleges to invest in recruiting additional teachers with the right level of qualification, knowledge, skill and experience and upskilling their existing workforce would require there to be a demand for SET technician programmes from the labour market. It is important to note that an identified need may not be converted into a demand, as employers may seek to provide the skills they need in other ways, for example, by employing graduates, or by upskilling in-house their existing workforce to take on technician roles. Further, even if a need can be identified at a national level this may not materialise as a viable demand at the college level, because of the dispersed nature of SET technician roles across the country. Thus, at a local level there may be insufficient expansion demand to justify the development of new programmes at say HNC, HND or Foundation Degree level, and therefore no demand from FE colleges to recruit additional teaching staff or upskill their existing teaching workforce. This could be addressed, for example, with local coherent planning of specialist provision.
Nonetheless, the existing SET FE college workforce is aging, and there will be a replacement demand for teachers and tutors with high levels of qualification, ideally combined with enterprise-based experience. Such teaching staff will not be easy to recruit, given the general shortage of SET qualified employees in the labour market, especially those with recent and relevant industrial experience. There will be strong competition from both industry and schools for individuals with SET qualifications. Further work is needed to ascertain whether recently announced initiatives52, such as training bursaries or golden hellos, will provide sufficient incentives to overcome foreseeable recruitment difficulties.
The current FE SET workforce, as far as can be judged from this sample, is well qualified, in terms of both academic and teaching qualifications, to deliver the requisite level of qualifications needed to produce the SET technicians of the future. However, it is likely that a greater proportion of those teaching in the engineering disciplines will require higher levels of qualification, if the anticipated demand for future SET employees qualified at Levels 3–5 is to be delivered.
The majority of SET teaching staff in the sample had enterprise-based experience which they felt was relevant to their teaching. However, on average, this had taken place several years previously. Providing recent and relevant industrial placements, for example, might therefore be a priority for CPD if more apprenticeship-type approaches to developing SET technicians are to be adopted.
Nonetheless, it was clear from the evidence derived from this sample that the majority of FE SET teachers and tutors were receiving CPD from their colleges which they in the main found useful. The majority were also able to identify CPD experiences directly relevant to teaching their main subject, and the majority also had clear ideas about the types of CPD they wished to undertake in the future. The challenge will be meeting this demand: finding time for teachers and tutors to be absent to undertake such experience on anything more than a short duration approach seems unlikely given the pressures on the teaching workforce in FE colleges.
52 Department for Business, Innovation and Skills (2014) The Government’s Strategy to Support Workforce Excellence in Further Education
36
S E T C O L L E G E T E AC H I N G WO R K F O R C E
APPENDIX 1 THE DEMAND FOR SET SKILLS AND TECHNICIANS
Predicting the future demand and supply of SET skills is inevitably problematic, as the estimates are highly sensitive to modelling assumptions53. Nevertheless, the evidence about the scale of both the replacement and potential expansion demand for SET qualified professionals and technicians, as the UK economy rebalances with a hoped-for greater focus on manufacturing, indicates the need to expand the supply pipeline for SET skills. As Professor John Perkins reports in his 2013 review of engineering skills:
‘One of the most widely-cited estimates is the Royal Academy of Engineering’s report on “Jobs and Growth”, which forecasts that, between 2012 and 2020, the UK economy will require 830,000 professional scientists, engineers and technologists, largely to replace those leaving engineering practice e.g. through retirement. This works out at over 100,000 new professionals each year.’54
Further, the CBI’s 6th annual education and skills survey, published in 2013, indicated that the demand for Science, Technology, Engineering and Mathematics (STEM) skills was outstripping supply, and that shortages of STEM-qualified technicians remain stubbornly high. The Science Council noted that:
‘Across all employers future technician recruitment was considered a problem by only 20% of employers. However, 29% of employers in engineering, high-tech/IT and science said that they had experienced a shortage of STEM qualified technicians, and 39% of employers in engineering, high-tech/IT and science sectors expect this problem to intensify over the next three years ... It has also been forecast that upwards of 450,000 new STEM based technicians will be needed by 2024.’55
Such concern about the provision of SET-qualified employees is nothing new, acknowledged in the Perkins Review:
‘Over the past 150 years, public and business concerns prompted periodic investigations into the nature, scale and effectiveness of the system of science teaching and technical instruction.’ 56
Nonetheless, the available evidence indicates the need to encourage more young people to take up STEM qualifications and to pursue STEM careers if the expected demand for SET professionals and technicians is to be met. For example, in his report on the general SET technician workforce, Mason pointed out the high replacement demand for technicians, as 31% of SET skilled trade workers and 23% of SET associate professionals were aged over 50. Meeting this replacement demand alone will require the capacity and capability of the supply “pipeline”, from GCSE to degree level and beyond to be expanded. Expansion demand, for example emanating from attempts to rebalance the UK economy by growing the manufacturing sector, would increase the need for yet more skilled SET technicians. Central to such an expansion is the size and quality of the teaching workforce available in schools, colleges and universities to teach STEM subjects.
53 UKCES (2013) Supply and Demand for High Level STEM Skills54 Professor John Perkins (2013) Review of Engineering Skills. Dept for Business, Innovation and Skills, p.1055 See www.sciencecouncil.org/content/cbi-education-and-skills-survey-2013 (Accessed January 2015) 56 Professor John Perkins (2013) Review of Engineering Skills. Dept for Business, Innovation and Skills, p.11
37
S E T C O L L E G E T E AC H I N G WO R K F O R C E
This report contributes to the evidence base about that teaching workforce by focussing on SET subject specialists in FE colleges, which would be expected to be centrally involved in increasing the supply of SET technicians57. For example, the Higher Apprenticeship Fund launched in 2011 is expected to produce 22,000 Higher Apprenticeship starts by 2015. This would require a suitably qualified teaching workforce to deliver Level 4 and 5 qualifications as part of the technical certificates for those in Apprenticeship frameworks. There is also an expectation of a growth in demand for the new ‘Tech level’ qualifications58 within a new government performance measure for 16–19 vocational education – the technical baccalaureate or ‘TechBacc’59 – as part of an overarching government policy to deliver higher-quality vocational pathways. Teaching these new programmes will require teachers with the right blend of knowledge, skills and up-to-date experience if learners completing these programmes are to meet the predicted skills needs of employment.
The technician workforceSET technicians are defined both in terms of what they can do and where they stand in a hierarchy of occupations and /or qualifications (see Mason)60. Perhaps the best definition of technician, for a report about developing educational capacity to support the development of knowledge and skills needed to fulfil the demands of technician occupation, is that provided by the Technician Council in the UK:
‘Technicians are concerned with applying proven techniques and procedures to the solution of practical problems. They carry supervisory or technical responsibility and are competent to exercise creativity and skills within defined fields of science and technology.’61
For the reasons cited by Mason, the designation of SET technician falls, for the purposes of this report, within both the ‘Associate Professional and Technical Occupations’ and ‘Skilled Trade Occupations’ level jobs in the UK Standard Occupational Classification. Such a definition covers a diverse range of associate professional occupations including laboratory technician, architectural technologist, IT operations technician, and building and civil engineering technicians, plus a range of skilled trades such as smiths and forge-workers, tool-makers, and heating and ventilation engineers. This diversity requires an equally diverse array of teachers and tutors in FE colleges to deliver technical education.
The qualifications held by the current SET technician workforce provide some guide to the levels of qualification that FE colleges might be expected to deliver in the future to meet the potential labour market demand. Analysis of the 2010 Labour Force survey62 indicates that amongst those SET technicians undertaking associate professional roles (and for skilled trades):
• 29% had Bachelor degrees or above (5%)• 1% Foundation Degrees (0.5%)
57 A separate report considers the mathematics teaching capacity and capability in FE and sixth-form colleges.58 www.gov.uk/government/policies/improving-the-quality-of-further-education-and-skills-training/supporting-pages/technical-level-qualifications (Accessed January 2015)59 www.gov.uk/government/news/new-techbacc-will-give-vocational-education-the-high-status-it-deserves (Accessed January 2015)60 Geoff Mason (2012) Science, Engineering and Technology Technicians in the UK Economy. Available at www.gatsby.org.uk/uploads/education/reports/pdf/geoff-mason-report-2012.pdf61 Cited in Mason (p.4).62 Mason Table 3.6.

38
S E T C O L L E G E T E AC H I N G WO R K F O R C E
• 14% Higher National Certificates or Diplomas (8%)• 5% other Level 4 or 5 qualifications (2%)• 18% Level 3 vocational qualifications (52%)• 10% Level 3 general qualifications (4%)• 4% Level 2 vocational qualifications (6%)• 10% Level 2 general qualifications (10%)• 5% low or no qualifications (8%)• 4% other qualifications (6%)
This would suggest that the main areas for FE colleges to focus on would be qualification Levels 3–5 in the English, Welsh and Northern Irish National Qualifications Framework (see Figure 19).
Figure 19: English, Welsh and Northern Ireland National Qualifications Framework (as at June 2015)
This may change as more FE colleges gain degree-awarding powers with an additional focus on Level 6 provision; however, there are good reasons to suspect that employers may be seeking to grow the number of SET technicians developed through an apprenticeship-style training rather than take on more graduates. This is particularly the case with those holding Level 3 qualifications in the current SET technician workforce, where a third are aged 50 or over representing the likelihood of a considerable replacement demand at this level of qualification63. On the other hand, there remains a considerable wage premium for some graduate SET technicians, possibly reflecting the need for more skilled workers as product specifications and complexity rise in the face of competitive pressures. Nonetheless, it is likely that employers are re-evaluating the mix of intermediate and higher-level skills required in the SET technician workforce, suggesting a possible increase in demand for those with Level 3–5 qualifications 64 in the coming years.
63 Mason op. cit, p. 19.64 In Scotland the equivalent levels of qualification would be 6-8, but the English, Welsh and Northern Irish qualifications framework levels are used in this report.
39
S E T C O L L E G E T E AC H I N G WO R K F O R C E
APPENDIX 2 EXAMPLES OF CPD REQUIREMENT OF TEACHERS INTERVIEWED
“Resources and ideas on active learning for students. Want to move away from using ... worksheets to more practical-based.”
“Would like to do a masters linked to film e.g. film production or script writing; also course on using high-end film cameras.”
“Courses in industry-related software that lead to accredited qualifications e.g. animation and rendering; Autodesk and Autodesk Maya, Nuke, Pixologic and Z-brush; courses run by the IT Foundry.”
“Autodesk accredited for software use; Adobe, Nuke, Basically accredited training on industry spec software.”
“Would be interested in ‘CPD’ in how to better integrate industry within course delivery.”
“They want and try to do employer-engaged live projects in the college. College gets industry in to do that. Feels that has mutual benefits for the college and employer. This is because the college get real-life briefs and examples of projects that their students can work on delivering. The employer gets students who they can they take on for work experience or employment. The benefit if employer is then getting trained staff who can do the jobs they need. However, interviewee felt that often what employer needs in terms of staff skills differs from what awarding bodies cover in course content. So course delivery is too different to what employers need.”
“Learning more about computer programming languages e.g. C-sharp.”
“Work placement in industry to get industrially relevant experience; considering leaving FE to go back to industry and then return with updated skills.”
“Proper CAD training; with industrial updating.”
“Time back in industry to learn about new technologies e.g. sustainability and IT.”
“Gas qualifications; renewable energy; VL assessors award.”
“Always want to learn more skills in relation to current industry techniques – if I don’t keep up to date myself, the students will know. Also industry will know – i.e. future employers need to know that the tutors have relevant modern skills. Would like to go back to industry to refresh skills and transfer these to the classroom experience.”
“New technologies: but things move so fast that things would be old by the time they arrived in college. There isn’t the funding to enable new technologies to be brought into FE.”

40
S E T C O L L E G E T E AC H I N G WO R K F O R C E
APPENDIX 3 RESEARCH INSTRUMENTSFE COLLEGE/SIXTH-FORM COLLEGE STEM SURVEY
A College type
FE College SFC Reference Number
B Name of college
1 Job titleSenior Lecturer
Lecturer
Teacher
Tutor
Instructor
Other, please state:
2 Basis of work (self-assessed)Full-time
Part-time
Agency
2.1 If part-time/agency what are your total contracted hours per week (on average)? NUMERIC RANGE 1 … 30
2.2 What is the number of classroom contact hours per week (including form/tutor time)? NUMERIC RANGE 1 … 35
2.3 If not teaching this year, in which academic year did you last teach?
2.4 How long have you been teaching?
2.5 How long have you worked at this college?

41
S E T C O L L E G E T E AC H I N G WO R K F O R C E
3.1 What qualifications (academic, vocational and professional) do you have (apart from teaching qualifications)?
HE Subject (eg electrical engineering)
Doctorate
Masters
Honours degree
Ordinary degree
Foundation Degree
HND
HNC
Diploma
Certificate
City & Guilds
NVQ/SVQ
Other
Professional Subject
Accounting
Law
Medicine
Other
Level 3 Subject(s)
A-level
IB
BTEC or OCR National Certificate/Diploma
Advanced GNVQ
ONC/OND
City & Guilds
Welsh Baccalaureate
Scottish Advanced Higher
Scottish Higher
NVQ/SVQ
Advanced Apprenticeship
Other

42
S E T C O L L E G E T E AC H I N G WO R K F O R C E
Level 2 Subject (where appropriate, not for GCSE/O-level)
GCSE (A*-C) total number
O levels
GCSE/O-level (A*-C) Maths (Y/N)
CSE Grade 1
GNVQ Intermediate
BTEC or OCR First Certificate/Diploma
Welsh Baccalaureate
Scottish Standard Grade (1-3) or Ordinary (A-C)
NVQ/SVQ
Intermediate Apprenticeship
Other
3.2 What is your highest (non-teaching) maths qualification? [Self-assessed]HE Description or Subject Grade
Doctorate
Masters
Honours degree
Ordinary degree
Foundation Degree
Diploma
Certificate
Other
Level 3
A-level
IB
Welsh Baccalaureate
Scottish Advanced Higher
Scottish Higher
Other
Level 2
GCSE (A*-C)
O-level
CSE Grade 1
Welsh Baccalaureate
Scottish Standard Grade (1-3) or Ordinary (A-C)
Other

43
S E T C O L L E G E T E AC H I N G WO R K F O R C E
4 Do you have, or are you working towards, a teaching qualification, and, where applicable, through which route did you obtain it?
Teaching qualification Achieved Working towards
Subject specialism
1 PGCE a) HEI
b) Teach First
c) School Direct
d) SCITT PGCE
e) SCITT GTP
2 CertEd
3 Preparing to teach in the lifelong learning sector (PTLLS)
4 Certificate in teaching in the lifelong learning sector (CTLLS)
5 Diploma in teaching in the lifelong learning sector (DTLLS)
6 Post-Compulsory Education and Training (PCET)
7 FE Teaching Certificate (FETC) Stage 1 or Further Adult Education Teaching Certificate (FAETC)
8 FETC Stage 2 or FAETC
9 FETC Stage 3 or FAETC
10 BTEC Level 3 Certificate in Teaching in the Lifelong Learning Sector
11 City & Guilds Further Education Teaching Level 4
12 City & Guilds Further Education Teaching Level 5
13 Level 3 Award in Education & Training
14 Level 4 Certificate in Education & Training
15 Level 5 Diploma in Education & Training
16 Level 5 Diploma in Education & Training with specialist pathway
17 BEd
18 QTS a) SCITT QTS
b) SCITT GTP
c) School Direct
d) Teach First
e) Other
19 Skills for Life Qualifications:a) literacy
b) numeracy
c) ESOL
20 Other, eg TEFL, Music Teaching Diploma, Assessor A/D Units – please state:

44
S E T C O L L E G E T E AC H I N G WO R K F O R C E
5 Thinking of your last full week of teaching, what are the main courses/programmes you teach on and at what level, up to Level 4? [top 3 if many]
Level First Second Third
Description
L 1
L 2
L 3
L 4
Note: For maths teachers, GCSE, A-level Maths, A-level Further Maths count as separate programmes. If A-level Further Maths, check modules as separate courses and note.
5.1 Does your college have regular general CPD/training sessions? No
Yes Weekly
Yes Monthly
Yes Termly
Yes Other_______________
Thinking of the programme/course you teach the most6.1 How many hours is that per week?
6.2 What (non-teaching) qualification do you have that is most relevant to teaching this programme/course?
HE Subject (eg electrical engineering)
Doctorate
Masters
Honours degree
Ordinary degree
Foundation Degree
HND
HNC
Diploma
Certificate
City & Guilds
NVQ/SVQ
Other

45
S E T C O L L E G E T E AC H I N G WO R K F O R C E
Professional Subject
Accounting
Law
Medicine
Other
Level 3 Subject(s)
A-level
IB
BTEC or OCR National Certificate/Diploma
Advanced GNVQ
ONC/OND
City & Guilds
Welsh Baccalaureate
Scottish Advanced Higher
Scottish Higher
NVQ/SVQ
Advanced Apprenticeship
Other
Level 2 Subject (where appropriate, not for GCSE/O-level)
GCSE (A*–C) total number
GCSE (A*–C) Maths
O-level
CSE Grade 1
GNVQ Intermediate
BTEC or OCR First Certificate/Diploma
Welsh Baccalaureate
Scottish Standard Grade (1–3) or Ordinary (A–C)
NVQ/SVQ
Intermediate Apprenticeship
Other
6.3 Have you undertaken any training or CPD to support your teaching of this programme/course?
Yes
No If No, Go to Question 6.5

46
S E T C O L L E G E T E AC H I N G WO R K F O R C E
6.4 Briefly describe three CPD examples, relevant to your teaching of this subject, over the past 3 years
CPD1: recent
CPD2: most intensive/significant
CPD3: most valuable
6.4.1 If Yes, for approximately how long? NUMERIC VALUE 0.5 day or less, 1 day…1 week…6 months+CPD1
CPD2
CPD3
6.4.2 How long ago? NUMERIC RANGE Less than 1 month, 1 month, 2 months…10 yearsCPD1
CPD2
CPD3
6.4.3 How useful was this training or CPD to assist in your teaching of this programme/course?
CPD1 CPD2 CPD3
5 (Very useful)
4
3
2
1 (Not very useful)
6.5 What type(s) of CPD would you be interested in, to support your teaching of this programme/course?

47
S E T C O L L E G E T E AC H I N G WO R K F O R C E
6.6 Do you have any industrial/business experience relevant to teaching this programme/course?
Yes
No Go to next subject or Question 9 if no more subjects
6.6.1 If Yes, please describe briefly
6.6.2 If Yes, how many years total experience? NUMERIC RANGE Less than 1 year…20+ years
6.6.3 How long since you finished this experience? NUMERIC RANGE Less than 1 year. … 10+ years
6.6.4 How valuable is this experience to your teaching of this programme/ course?
Value of experience
5 (Very valuable)
4
3
2
1 (Not very valuable)

48
S E T C O L L E G E T E AC H I N G WO R K F O R C E
7.1 Thinking about the programme/course you teach the second-most, how many hours is that per week?
7.2 What (non-teaching) qualification do you have that is most relevant to teaching this programme/course?
HE Subject (eg electrical engineering)
Doctorate
Masters
Honours degree
Ordinary degree
Foundation Degree
HND
HNC
Diploma
Certificate
City & Guilds
NVQ/SVQ
Other
Professional Subject
Accounting
Law
Medicine
Other
Level 3 Subject(s)
A-level
IB
BTEC or OCR National Certificate/Diploma
Advanced GNVQ
ONC/OND
City & Guilds
Welsh Baccalaureate
Scottish Advanced Higher
Scottish Higher
NVQ/SVQ
Advanced Apprenticeship
Other
Level 2 Subject (where appropriate, not for GCSE/O-level)
GCSE (A*–C) total number

49
S E T C O L L E G E T E AC H I N G WO R K F O R C E
GCSE (A*–C) Maths
O-level
CSE Grade 1
GNVQ Intermediate
BTEC or OCR First Certificate/Diploma
Welsh Baccalaureate
Scottish Standard Grade (1–3) or Ordinary (A–C)
NVQ/SVQ
Intermediate Apprenticeship
Other
7.3 Have you undertaken any training or CPD to support your teaching of this programme/course?
Yes
No If No, Go to Question 7.5
7.4 Briefly describe three CPD examples, relevant to your teaching of this subject, over the past 3 years (recent, intensive/significant, useful)
CPD1: recent
CPD2: most intensive/significant
CPD3: most valuable
7.4.1 If Yes, for approximately how long? NUMERIC VALUE 0.5 day or less, 1 day…1 week…6 months+
CPD1
CPD2
CPD3
7.4.2 How long ago? NUMERIC RANGE Less than 1 month, 1 month, 2 months…10 years
CPD1
CPD2
CPD3

50
S E T C O L L E G E T E AC H I N G WO R K F O R C E
7.4.3 How useful was this training or CPD to assist in your teaching of this programme/course?
CPD1 CPD2 CPD3
5 (Very useful)
4
3
2
1 (Not very useful)
7.5 What CPD areas would you be interested in, relevant to teaching this programme/course?
7.6 Do you have any industrial/business experience relevant to teaching this programme/course?
Yes
No Go to next subject or Question 9 if no more subjects
7.6.1 If Yes, please describe briefly?
7.6.2 If Yes, how many years total experience? NUMERIC RANGE Less than 1 year…20+ years
7.6.3 How long since you finished this experience? NUMERIC RANGE Less than 1 year…10+ years
7.6.4 How valuable is this experience to your teaching of this programme/course?
Value of experience
5 (Very valuable)
4
3
2
1 (Not very valuable)

51
S E T C O L L E G E T E AC H I N G WO R K F O R C E
8.1 Thinking about the programme/course you teach the third-most, how many hours is that per week?
8.2 What (non-teaching) qualification do you have that is most relevant to teaching this programme/course?
HE Subject (eg electrical engineering)
Doctorate
Masters
Honours degree
Ordinary degree
Foundation Degree
HND
HNC
Diploma
Certificate
City and Guilds
NVQ/SVQ
Other
Professional Subject
Accounting
Law
Medicine
Other
Level 3 Subject(s)
A-level
IB
BTEC or OCR National Certificate/Diploma
Advanced GNVQ
ONC/OND
City & Guilds
Welsh Baccalaureate
Scottish Advanced Higher
Scottish Higher
NVQ/SVQ
Advanced Apprenticeship
Other

52
S E T C O L L E G E T E AC H I N G WO R K F O R C E
Level 2 Subject (where appropriate, not for GCSE/O-Level)
GCSE (A*–C) total number
GCSE (A*–C) Maths
O-level
CSE Grade 1
GNVQ Intermediate
BTEC or OCR First Certificate/Diploma
Welsh Baccalaureate
Scottish Standard Grade (1–3) or Ordinary (A–C)
NVQ/SVQ
Intermediate Apprenticeship
Other
8.3 Have you undertaken any training or CPD to support your teaching of this programme/course?
Yes
No If No, Go to Question 8.5
8.4 Briefly, describe three CPD examples, relevant to your teaching of this subject, over the past 3 years CPD1: recent
CPD2: most intensive/significant
CPD3: most valuable
8.4.1 If Yes, for approximately how long? NUMERIC VALUE 0.5 day or less, 1 day…1 week…6 months+
CPD1
CPD2
CPD3
8.4.2 How long ago? NUMERIC RANGE Less than 1 month, 1 month, 2 months…10 years
CPD1
CPD2
CPD3

53
S E T C O L L E G E T E AC H I N G WO R K F O R C E
8.4.3 How useful was this training or CPD to assist in your teaching of this programme/course?
CPD1 CPD2 CPD3
5 (Very useful)
4
3
2
1 (Not very useful)
8.5 What CPD areas would you be interested in relevant to teaching this programme/course?
8.6 Do you have any industrial/business experience relevant to teaching this programme/course?
Yes
No Go to Question 9
8.6.1 If Yes, please describe briefly
8.6.2 If Yes, how many years total experience? NUMERIC RANGE Less than 1 year…20+ years
8.6.3 How long since you finished this experience? NUMERIC RANGE Less than 1 year…10+ years
8.6.4 How valuable is this experience to your teaching of this programme/course?
Value of experience
5 (Very valuable)
4
3
2
1 (Not very valuable)

54
S E T C O L L E G E T E AC H I N G WO R K F O R C E
[IF MATHS TEACHER, SKIP TO QUESTION 9.3, OVER PAGE]
[NON-MATHS TEACHER]9 Do you teach any Maths/Numeracy on any of your programmes/courses?Yes
No
9.1 If Yes, how many hours does this involve?Hours per week
Teaching full subject qualification
Functional Skills/Essential Skills/Skills for Life in Numeracy
Mathematical component in Programme/Course
Other, please state:
9.2 Have you undertaken any training or CPD to support your teaching of Maths?
Yes
No
9.2.1 If Yes, for approximately how long? NUMERIC VALUE 0.5 day or less, 1 day…1 week…6 months+
9.2.2 How long ago? NUMERIC RANGE Less than 1 month, 1 month, 2 months…10 years
9.2.3 Briefly, describe this training or CPD
NB Do not ask for information on Maths training or CPD if already collected above.

55
S E T C O L L E G E T E AC H I N G WO R K F O R C E
[MATHS TEACHER]9.3 Do you teach maths on any other course or programme?
Yes If yes please describe:No
[ALL STAFF]10 Do you perform a significant role other than teaching? [self-defined]
Yes
No
10.1 Please describe briefly, in what areas? [self-defined]Management
Administration
Other, please state:
11 Sex of respondentMale Female
12 Age last birthday NUMERIC RANGE 14…95

The Gatsby Charitable Foundation
The Peak, 5 Wilton Road, London SW1V 1AP
T +44 (0)20 7410 0330 www.gatsby.org.uk
Registered Charity number 251988
Copyright © Gatsby Charitable Foundation
July 2015