Embed Size (px)
Citation preview


Profile of International Home Buyers in Florida
2015 Report
Prepared for the Florida REALTORS®
By the Research Division, National Association of REALTORS®
September 2015
1
Profile of International Home Buyers in Florida
2015 Report The Research Division of the National Association of REALTORS®, in cooperation with the Florida REALTORS®, has conducted an annual survey of purchases of existing homes by international clients since 2005. The term international (or foreign) client refers to clients who are “citizens of another country”. This definition covers both non-resident and resident clients1:
Non-Resident Foreigners (Type A): Foreign clients with permanent residences outside the U.S. These clients typically purchase property as an investment, or for vacations or visits of less than six months to the U.S.
Resident Foreigners (Type B): Clients who are recent immigrants (in the country less than two years) or temporary visa holders residing for more than six months in the U.S. for professional, educational, or other reasons. The Florida REALTORS® issued the invitation to its members to participate in the online survey, conducted over the time period July 7 - August 9, 2015. There were 1,203 Florida REALTORS® respondents to this year’s survey who provided information on their client interaction during the 12 months ended June 2015 and on the characteristics of their most recent sale during this period.2
NAR Research Division Lawrence Yun, Ph.D., Senior Vice President & Chief Economist
Paul Bishop, Ph.D., Vice President, Research
Jed Smith, Ph.D., Managing Director, Quantitative Research
Gay Cororaton, Research Economist
1 The 2005, 2007, 2008 Florida surveys covered only non-resident international clients. Starting 2009, the Florida
surveys asked about international clients “who are citizens of another country” so this definition covers resident and non-resident international clients, both citizens of another country. NAR did not conduct a survey in 2006. 2 Some care should be taken when comparing certain results of the 2015 Florida survey to those of the 2014
Florida survey—the latter of which had a lower-than-typical response rate in Miami-Dade and Broward counties.
2
Table of Contents
I. EXECUTIVE SUMMARY AND OVERVIEW ........................................................................ 3
II. FLORIDA’S INTERNATIONAL SALES, 12 MONTHS ENDED JUNE 2015 ................................. 4
III. TRENDS IN REALTOR® TRANSACTIONS WITH INTERNATIONAL CLIENTS ................... 8
Share of REALTORS® who worked with an international client ............................................................... 8
Number of International Clients ............................................................................................................... 8
Number of Clients Who Purchased Property ............................................................................................ 9
Source of Client Contact ......................................................................................................................... 10
Most Important Factor Affecting Decision to Purchase ......................................................................... 11
Client’s Perception of Florida Property Prices and Exchange Rate Changes .......................................... 11
Reasons for Not Purchasing Property ..................................................................................................... 13
Change in the Percentage of International Clients ................................................................................. 13
Retirees as a Potential Market ................................................................................................................ 14
Number of Years as a REALTOR® ........................................................................................................... 15
Extent of Language or Cultural Problems ............................................................................................... 16
IV. INTERNATIONAL BUYERS: ORIGINS AND PREFERENCES ............................................ 17
Origin of Foreign Buyers ......................................................................................................................... 17
Destination of Foreign Buyers ................................................................................................................. 19
Top Buyers by Metro Area ...................................................................................................................... 22
Prices and Financing................................................................................................................................ 24
Intended Use of Property ....................................................................................................................... 26
Location Preference ................................................................................................................................ 27
Type of Property ..................................................................................................................................... 28
New and Existing Home Sales ................................................................................................................. 30
Intended Months’ Use of Property ......................................................................................................... 30
V. CONCLUDING COMMENTS ........................................................................................... 31
VI. APPENDICES .................................................................................................................................... 33
Appendix 1: Computation of Market Share ........................................................................................... 33
Appendix 2: Some Comments Received From 2015 Florida Survey ...................................................... 34

3
I. EXECUTIVE SUMMARY AND OVERVIEW
Florida is one of the major U.S. destinations of international residential real estate
buyers. Approximately 25 percent of foreign home buyers purchasing U.S. property buy Florida
properties.3 The 2015 survey shows that foreign sales remain an important segment of Florida’s
residential market:
International unit sales totaled 44,000 properties, 12 percent of Florida’s residential market
(15 percent a year ago), compared to four percent nationally.
The dollar volume of international sales totaled $23.7 billion, 24 percent of Florida’s
residential dollar volume of sales (19 percent a year ago), compared to eight percent
nationally.
69 percent of Florida REALTORS® have international clients (52 percent a year ago),
compared to the national average of 35 percent.
31 percent of Florida REALTORS® reported having more than five clients (19 percent a year
ago), compared to the national average of 15 percent
Among respondents who worked with a client, 78 percent reported having closed at least
one sale (75 percent a year ago), compared to the national average of 56 percent for those
working with an international client.
Respondents reported a significant increase in the share of buyers from Latin America to 56
percent (23 percent a year ago).
Approximately 50 percent of foreign buyers purchased in Miami-Miami Beach (36 percent)
and Fort Lauderdale (14 percent).
Foreigners purchased property at the average price of $538,600 ($300,600 in 2014),
compared to the median price of Florida’s residential sales of $258,200. The substantial
change in average price appears to be due to market mix.
Approximately 63 percent reported that their clients found Florida properties less expensive
than comparable properties in their home country (76 percent a year ago).
Approximately 29 percent reported that an increase in the percentage of business that is
international in the past year (45 percent a year ago), compared to the national average of
13 percent.
Florida’s real estate market continues to attract new REALTORS®: 16 percent of Florida
respondents reported that they have been in business for less than one year (12 percent a
year ago), compared to 10 percent at the national level.
3 Data are from NAR’s Profile of International Home Buyers surveys, 2009 through 2015. The percentages fluctuate
year to year. In the 2015 survey, Florida accounted for 21 percent of all foreign buyers purchasing in the U.S.

4
II. FLORIDA’S INTERNATIONAL SALES, 12 MONTHS ENDED JUNE
2015
In the 12-month period ended June 2015, sales to foreign buyers accounted for 12
percent of Florida’s residential unit sales of single-family, townhome, and condominium
properties, a decrease from the 15 percent share in the same period last year.4 In terms of
dollar volume, sales to foreign buyers accounted for 24 percent of Florida’s residential dollar
volume of sales, an increase from the 19 percent share in the same period last year. For
comparison, all purchases of foreign buyers in the U.S. accounted for four percent of U.S. total
existing home sales, while the corresponding dollar volume of such sales accounted for eight
percent of the U.S. dollar volume of existing home sales.5
The market share of foreign buyers in Florida’s residential existing home markets
significantly increased in the wake of the housing downturn, accounting for about half of the
dollar volume of sales and about a fifth of Florida unit sales in 2009 -2011. With the recovery of
the U.S. economy and increased participation of domestic buyers, the share of foreign buyers
to Florida’s residential market has decreased. Still, the 24 percent share of purchases by foreign
buyers in Florida’s existing home sales market is substantial when compared to the national
figure of eight percent in the 2015.
4 12 months ended June 2014.
5 NAR’s Survey of International Homebuyers. NAR’s reference period in estimating the national level of
international sales is from April of the previous year to March of the current year. The Florida survey’s reference period is from July of the previous year to June of the current year.
12% 14% 19% 17%
27% 23%
17% 14% 15% 12%
19% 27%
38% 41%
57% 51%
43%
28%
19% 24%
0%
10%
20%
30%
40%
50%
60%
70%
2005 2007 2008 2009 2010 2011 2012 2013 2014 2015
Share of International Sales to Florida's Residential Market in Past 12 Months*
As percent of unit sales As percent of dollar sales
*Source: NAR. Past 12 months generally covers the period July of previous year to June of current year. No survey was held in 2006. The 2005-, 2007, 2008 surveys covered only non-resident foreign

5
Measured in numbers of purchases, foreigners purchased 44,000 properties in the 12-
month period ended June 2015, a decrease from the level of 52,300 units in the same period
last year. These transactions accounted for about 12 percent of Florida’s residential unit sales, a
decrease compared to the 15 percent share in the previous period.6 The decrease in Florida’s
residential unit sales to foreigners is in line with the decrease in international sales at the
national level and the lower share of Florida to the national level of international sales.
Nationally, international sales decreased to 209,000 in 2015 from 232,600 in 2014. Florida’s
share to total international sales decreased to 21 percent in 2015 from 23 percent in 2014.
Increases in home prices across the U.S. and in Florida, changes in foreign exchange
rates, and adverse economic conditions in some countries appear to have been the major
factors that dampened the demand for existing homes by foreign buyers. The average price of a
residential property in Florida rose to $258,200 in the past 12 months ended June 2015, a six
percent increase from $245,500 in the same period last year. The weakening of most currencies
against the U.S. dollar (e.g., the Canadian dollar, the Brazilian real, and the euro) further made
Florida prices more expensive in terms of the local currency. In this year’s survey, respondents
reported that the primary reason cited for not making a sale was “cost of property” (18 percent
in 2015, 11 percent in 2014); previously “could not find property” was the major reason. Also, a
higher share of respondents cited that the exchange rate movement had an impact on foreign
purchases (90 percent in 2015, 85 percent in 2014). In addition, a lower percentage of
respondents cited that Florida prices were less expensive compared to their home country (63
percent in 2015, 76 percent in 2014).
6 Based on closed sales and mean prices for single-family homes and condo/townhouses from July 2014-June 2015
reported by Florida REALTORS®, downloaded from http://media.floridarealtors.org.
39,800
24,500 30,600
36,200
66,100 65,300
53,600
44,300
52,300
44,000
-
10,000
20,000
30,000
40,000
50,000
60,000
70,000
2005 2007 2008 2009 2010 2011 2012 2013 2014 2015
Number of International Sales in Florida in Past 12 Months*
*Source: NAR. Past 12 months generally covers the period July of previous year to June of current year. No survey was held in 2006. The 2005, 2007, 2008 surveys covered only non-resident foreign buyers.

6
Measured in dollar volume, sales to foreigners increased to $23.7 billion from the
previous 12-month period’s level of $15.7 billion. International sales accounted for about 24
percent of Florida’s residential market, compared to a 19 percent share in the preceding
period.7
The dollar volume of sales increased even as unit sales decreased as those international
clients who decided to purchase property did so for properties at the upper price range
compared to domestic buyers in Florida. Foreign buyers in Florida purchased properties at the
average price of $538,600 compared to $300,600 from the same period last year. The average
price of homes purchased by foreign buyers in Florida was higher compared to the price of
homes purchased by all foreign buyers in the U.S. ($499,600), to the price of residential homes
sold in Florida ($258,200), and to the price of U.S. existing home sales ($255,600).8 The median
price of properties purchased by foreign buyers in Florida also increased to $297,300 compared
to $209,600 in the same period last year.
7 See Appendix 1 for computations.
8 This is the average price for single-family, townhomes, and condominiums based on data reported by the Florida
Realtors® downloaded at http://www.floridarealtors.org/ResearchAndStatistics/Florida-Market-Reports/Index.cfm.
$14.5
$10.3 $11.2 $12.0
$17.1 $17.3 $17.4
$14.5 $15.7
$23.7
$-
$5
$10
$15
$20
$25
2005 2007 2008 2009 2010 2011 2012 2013 2014 2015
Dollar Volume of International Sales in Florida in Past 12 Months* In Billion Dollars
Source: NAR. Past 12 months generally covers the period July of previous year to June of current year. No survey was held in 2006. The 2005, 2007, 2008 surveys covered only non-resident foreign buyers.

7
$300,600
$396,000
$245,500 $249,500
$538,600 $499,600
$258,200 $255,600
Florida internationalclients
All internationalclients
Florida existinghome sales
U.S. existing homesales
Average(Mean) Home Prices of International and Domestic Clients in Florida and U.S. Market*
2014 2015
*Past 12 months in the Florida survey covers the period July 2014-June 2015. In the National survey, the period is from April 2015-March 2015.
$209,600
$268,000
$161,800
$201,800
$297,300 $265,100
$174,600
$208,900
Florida internationalclients
All internationalclients
Florida existinghome sales
U.S. existing homesales
Median Home Prices of International and Domestic Clients in Florida and U.S. Market*
2014 2015
*Past 12 months in the Florida survey covers the period July 2014-June 2015. In the National survey, the period is from April 2015-March 2015.

8
III. TRENDS IN REALTOR® TRANSACTIONS WITH INTERNATIONAL CLIENTS
Share of REALTORS® who worked with an international client International transactions account for a larger share of transactions in Florida
compared to international transactions at the national level. About 69 percent of Florida
REALTORS® worked with an international client for the 12 months ended June 2015.
Nationally, only 35 percent of REALTORS® had an international client. Last year, 52 percent of
Florida respondents reported working with an international client.
Number of International Clients
Among respondents who reported dealing with an international client, approximately
69 percent reported one to five clients (whether purchased or not), compared to 85 percent
nationally. Last year, 81 percent reported one to five clients.
53% 54% 61%
77%
61% 63% 52%
69%
26% 23% 28% 28% 27% 27% 28%
35%
0%10%20%30%40%50%60%70%80%90%
2008 2009 2010 2011 2012 2013 2014 2015
Share of Florida REALTOR® Respondents Who Had an International Client in the Past Twelve Months*
Florida National
*Past 12 months in the Florida survey generally covers the period July of previous year to June of current year. In the National survey, the period is from April of previous year to March of current year.

9
Number of Clients Who Purchased Property
Among respondents who reported working with an international client, 78 percent reported that they had at least one client who purchased a property, compared 56 percent nationally.
82% 79% 76% 72% 75% 76% 81% 69%
10% 11% 14% 17% 15% 13% 12%
17%
8% 10% 9% 11% 10% 11% 7% 13%
0%
20%
40%
60%
80%
100%
2008 2009 2010 2011 2012 2013 2014 2015
Number of International Clients Among FLORIDA REALTOR® Respondents With International Clients
(Percentage distribution)
1 to 5 6 to 10 more than 10
38% 33% 26% 22% 23% 19% 25% 22%
28% 26%
25% 22% 24% 26%
28% 28%
15% 18%
16% 17% 18% 21%
17% 18%
7% 8%
9% 12% 11% 11%
11% 8%
3% 5%
6% 7% 6% 7% 6%
6%
3% 4% 6% 6% 6% 6% 5%
6%
4% 4% 8% 9% 8% 6% 6%
6%
2% 3% 4% 5% 3% 5% 3% 6%
0%
10%
20%
30%
40%
50%
60%
70%
80%
90%
100%
2008 2009 2010 2011 2012 2013 2014 2015
Number of International Clients Who Purchased Property from Florida REALTOR® Respondents With International Clients
(Percentage Distribution)
0 1 2 3 4 5 6 to 10 more than 10
10
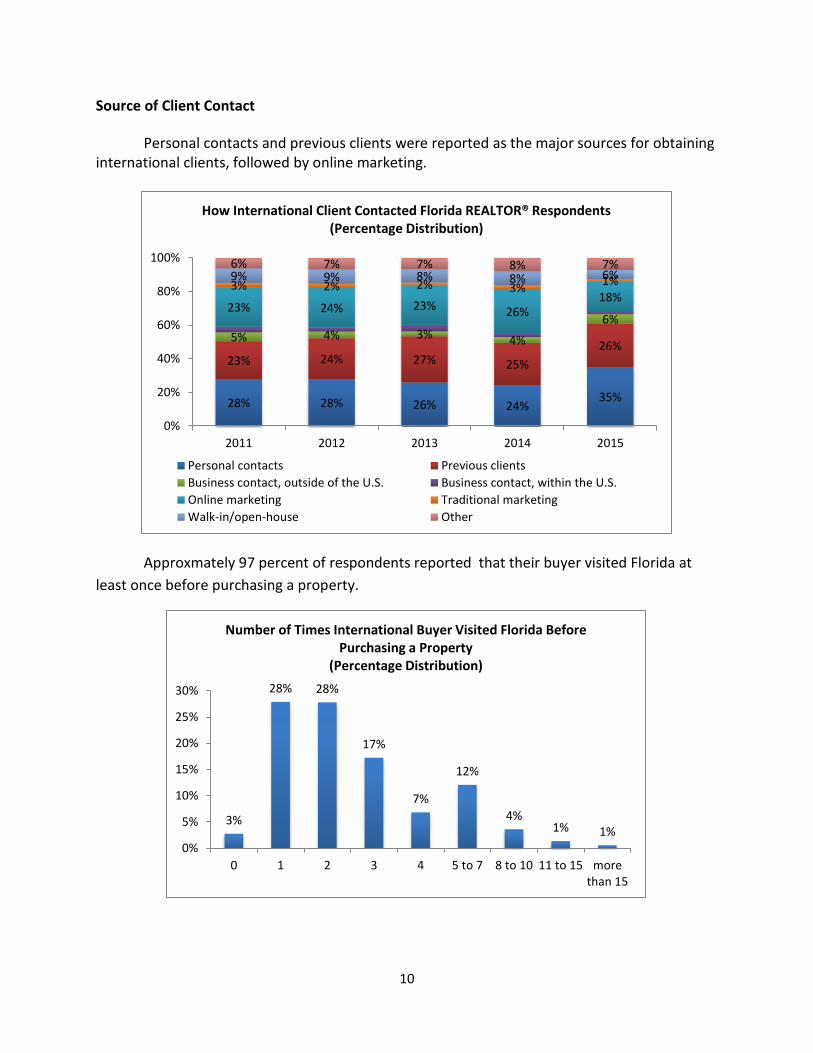
Source of Client Contact
Personal contacts and previous clients were reported as the major sources for obtaining international clients, followed by online marketing.
Approxmately 97 percent of respondents reported that their buyer visited Florida at
least once before purchasing a property.
28% 28% 26% 24% 35%
23% 24% 27% 25%
26% 5% 4% 3% 4%
6% 23% 24% 23% 26%
18% 3% 2% 2% 3%
1% 9% 9% 8% 8% 6% 6% 7% 7% 8% 7%
0%
20%
40%
60%
80%
100%
2011 2012 2013 2014 2015
How International Client Contacted Florida REALTOR® Respondents (Percentage Distribution)
Personal contacts Previous clients
Business contact, outside of the U.S. Business contact, within the U.S.
Online marketing Traditional marketing
Walk-in/open-house Other
3%
28% 28%
17%
7%
12%
4% 1% 1%
0%
5%
10%
15%
20%
25%
30%
0 1 2 3 4 5 to 7 8 to 10 11 to 15 morethan 15
Number of Times International Buyer Visited Florida Before Purchasing a Property
(Percentage Distribution)

11
Most Important Factor Affecting Decision to Purchase
The most important factor influencing a client’s decision to purchase Florida property
appears to be primarily tied to the security and profitability of investing in Florida property,
cited by 51 percent of respondents. This is consistent with the findings of this and past surveys
that show majority of buyers are purchasing property for rental purposes. About 41 percent of
Florida REALTORS® respondents reported Florida’s desirable location as the most important
factor, also consistent with the finding that majority of foreign buyers purchase property for
vacation use.
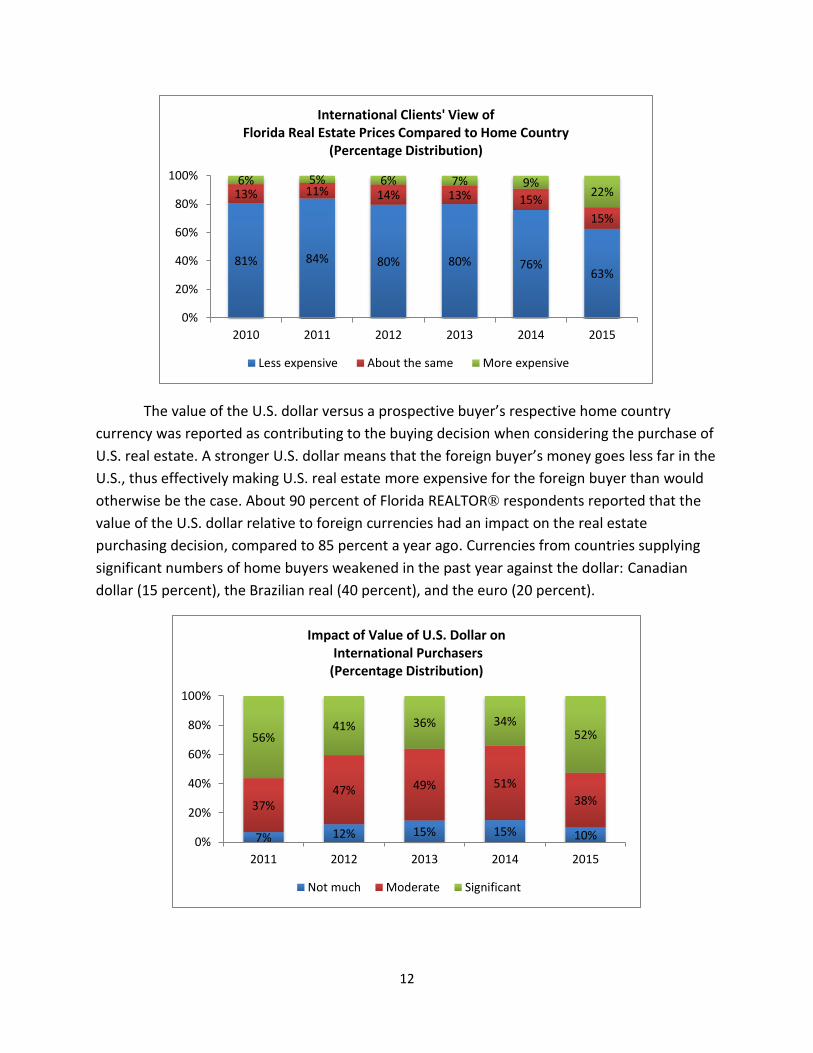
Client’s Perception of Florida Property Prices and Exchange Rate Changes
International clients also purchase property in Florida because of their perception about
the value they get for their money. About 63 percent of Florida REALTORS® responding to the
survey reported that their clients found Florida properties less expensive than comparable
properties in their home country. However, this is a decline from the previous years’ shares of
about 76 to 81 percent. The average price of a residential property in Florida rose to $258,200
in the past 12 months ended June 2015, a six percent increase from $245,500 in the same
period last year.
Secure investment
30%
Profitable investment
21%
Desirable location
41%
Other/don't know
8%
Most Important Factor Influencing Client's Decision to Purchase Real Estate in Florida
(Percentage Distribution)
12
The value of the U.S. dollar versus a prospective buyer’s respective home country
currency was reported as contributing to the buying decision when considering the purchase of
U.S. real estate. A stronger U.S. dollar means that the foreign buyer’s money goes less far in the
U.S., thus effectively making U.S. real estate more expensive for the foreign buyer than would
otherwise be the case. About 90 percent of Florida REALTOR® respondents reported that the
value of the U.S. dollar relative to foreign currencies had an impact on the real estate
purchasing decision, compared to 85 percent a year ago. Currencies from countries supplying
significant numbers of home buyers weakened in the past year against the dollar: Canadian
dollar (15 percent), the Brazilian real (40 percent), and the euro (20 percent).
81% 84% 80% 80% 76% 63%
13% 11% 14% 13% 15%
15%
6% 5% 6% 7% 9% 22%
0%
20%
40%
60%
80%
100%
2010 2011 2012 2013 2014 2015
International Clients' View of Florida Real Estate Prices Compared to Home Country
(Percentage Distribution)
Less expensive About the same More expensive
7% 12% 15% 15% 10%
37% 47% 49% 51%
38%
56% 41% 36% 34%
52%
0%
20%
40%
60%
80%
100%
2011 2012 2013 2014 2015
Impact of Value of U.S. Dollar on International Purchasers (Percentage Distribution)
Not much Moderate Significant

13
Reasons for Not Purchasing Property
Not every transaction resulted in a sale. Approximately 43 percent of respondents with
an international client had at least one client who decided not to purchase. There were a
variety of reasons that explain why a client did not purchase a property. ”Cost of property” was
cited as the major reason in 2015, mentioned by 18 percent of Florida REALTORS®
respondents, up from 11 percent a year ago. Rising property prices and the weakening of most
currencies against the dollar might have accounted for this increase. In addition, foreigners are
reported to be frequently surprised by the levels of condo fees, property taxes, and insurance
costs. There are differences in real estate markets between countries, and foreigners frequently
need additional information on U.S. practices compared to their country of origin. “Could not
find property” was another reason, mentioned by ten percent of respondents. REALTORS® may
need to work more closely with foreign buyers who are looking for properties that meet their
financial requirements, individual preferences, and cultural lifestyle.
Change in the Percentage of International Clients
Approximately 29 percent of respondents reported an increase in the percentage of
clients in the past year, a decrease from the 45 percent share who reported an increase in
2014. The majority of respondents reported no change. Approximately one in five did not
provide an opinion because they had been in business for less than one year.
11% 11%
20%
11%
5% 7%
8%
3%
18%
11% 11% 10%
7% 7% 5% 4%
1%
6%
Reasons For Not Purchasing Property in Past 12 Months (Percentage Distribution)
2014 2015
* Not included as a response option in 2014 survey.

14
Over a five-year period, 37 percent of respondents reported an increase in the share of
international clients to their business, compared to 29 percent in 2014. About a third of
respondents had no opinion because they have been in business for less than five years.
Retirees as a Potential Market
Approximately half of respondents have reported in the surveys that have been
conducted that foreign retirees are a potential pool of buyers in their market.
45% 32% 31%
45% 29%
38% 48% 49%
38%
40%
8% 8% 7% 8% 14%
9% 12% 13% 9% 18%
0%
50%
100%
2011 2012 2013 2014 2015
How Has the Percentage Of Clients Who Are International Changed in the Past Year? (Percentage Distribution)
Not applicable, less than 1 yr in businessDecreasedStayed about the sameIncreased
27% 27% 31% 46% 38% 39%
29% 37%
36% 38% 33%
29% 35% 35%
40% 21%
11% 14% 17% 9% 8% 5% 8%
9%
26% 22% 19% 16% 20% 21% 23% 32%
0%
50%
100%
2008 2009 2010 2011 2012 2013 2014 2015
How Has the Percentage Of Clients Who Are International Changed in the Past 5 Years?
(Percentage Distribution)
Not applicable, less than 5 yrs in businessDecreasedStayed about the sameIncreased

15
Number of Years as a REALTOR®
The share of REALTORS ® who have less than one year of experience continued to
increase in 2015, as reported in the surveys conducted in recent years, rising from six percent in
2008 to 16 percent in 2015. The rising share is an indicator of the growth potential for growth
of the Florida’s market. An examination of reasons for why foreigners have not purchased
property may be of interest to individuals building their practice. “Could not find property” and
“cost of property” were major reasons why foreign clients did not purchase properties,
indicating that REALTORS® will need to work more closely with clients to meet their financial
requirements, individual needs, and cultural preferences.
46% 49% 52% 54% 47% 52% 47%
22% 23% 21% 25% 23% 22% 23%
32% 28% 27% 21% 30% 27% 30%
0%
20%
40%
60%
80%
100%
2008 2009 2010 2011 2012 2013 2014
Are Foreign Retirees A Potential Pool of Buyers In Your Market?
(Percentage Distribution)
Yes No Don’t know
6% 8% 8% 10% 12% 11% 12% 16%
42% 32% 26% 22% 19% 19% 19%
31%
18% 21% 28% 28% 28% 25% 17%
18%
9% 10% 12% 13% 13% 16%
19%
16% 8%
8% 9% 8% 8% 10% 9%
5% 17% 21% 19% 20% 20% 19% 25%
13%
0%
20%
40%
60%
80%
100%
2008 2009 2010 2011 2012 2013 2014 2015
Years as a REALTOR® Among Florida REALTOR® Respondents (Percentage Distribution)
Less than 1 1 to 5 6 to 10 11 to 15 16 to 20 more than 20

16
Extent of Language or Cultural Problems
The international market appears to be very specialized on the buyer-side. There are
significant differences between the U.S. and foreign countries in terms of culture, business
practices, and consumer expectations. Typically, agents serving clients on the buyer-side of the
market have a language and cultural background in common with the prospective purchaser,
specialized experience in identifying buyer needs, and a knowledge of the intricacies of
property transactions for international clients. Appendix 2 provides some comments from
Florida REALTORS® working with international clients.
On the seller-side of the market, specialized experience may be less prevalent; in some
cases the listing agent may have had no experience in addressing the specific needs of
international customers. Given differences in culture, customer needs, negotiation styles, and
other factors, a listing agent may benefit from reviewing relevant material available from NAR
in the event of having an opportunity to work with an international customer.
Respondents to this year’s survey did not reference major language or cultural problems
in dealing with foreign clients--because most speak a language other than English or were born
outside of the U.S. Approximately 61 percent reported they have not had problems dealing
with international clients, up from 37 percent in the past year. The share of respondents who
reported speaking a language other than English also increased to 64 percent, up from 24
percent a year ago. Fewer than half reported that they were born in the U.S., compared to 83
percent in the 2014 survey.
56% 47% 47% 37%
61%
33% 39% 38% 44%
26%
5% 7% 5% 7% 4%
7% 7% 10% 13% 9%
0%
20%
40%
60%
80%
100%
2011 2012 2013 2014 2015
Extent of Language or Cultural Problems (Percentage Distribution)
Have not had problems A few problems
Significant problems Other

17
IV. INTERNATIONAL BUYERS: ORIGINS AND PREFERENCES
Origin of Foreign Buyers
Foreign home buyers in Florida come from a wide variety of countries. In the 12 months
ended June 2015, Florida REALTORS® respondents reported a significant increase in the share
of purchases from Latin America and a decrease from Canada and Europe. The majority of
buyers from Latin America came from Venezuela (18 percent in 2015, 3 percent in 2014), Brazil
(9 percent in 2015, 6 percent in 2014), Colombia (7 percent in 2015, 4 percent in 2014), and
Argentina (7 percent in 2015, 3 percent in 2014). The share of buyers from Canada and Europe
30% 33% 33%
41% 39% 33%
24%
64%
0%
10%
20%
30%
40%
50%
60%
70%
2008 2009 2010 2011 2012 2013 2014 2015
Percent of Florida REALTOR® Respondents Who are Fluent in a Language Other than English
63% 69% 73% 83%
48%
10% 10% 8% 6%
14%
27% 21% 19% 11% 38%
0%
20%
40%
60%
80%
100%
2011 2012 2013 2014 2015
Where You Born in the U.S.? (Percentage Distribution)
No, but came to the U.S. at least 18 years old
No, but came to the U.S. before 18 years old
Yes

18
decreased, particularly from Canada (11 percent in 2015, 32 percent in 2014). The share of
purchases from the United Kingdom has declined significantly from a share of 21 percent in
2008 to five percent in 2015. Meanwhile, the share of purchases from China has been generally
trending up from an insignificant level in 2008 to four percent in 2015.
By region of origin, Latin America/Caribbean accounted for 56 percent of international
buyers, a jump from 23 percent in 2014. Buyers from Europe accounted for 19 percent. Buyers
from Canada declined from about a third to about a tenth.
3% 5% 6% 4% 6% 8% 11% 8%
27% 26% 35% 38% 31% 30%
32%
11%
50% 42% 37%
28% 24% 27%
29%
19%
17% 25% 17% 28% 36% 32% 23%
56%
0%
20%
40%
60%
80%
100%
2008 2009 2010 2011 2012 2013 2014 2015
Region of Origin
Asia/Oceania AfricaCanada EuropeLatin America/Caribbean Middle EastUnknown
19
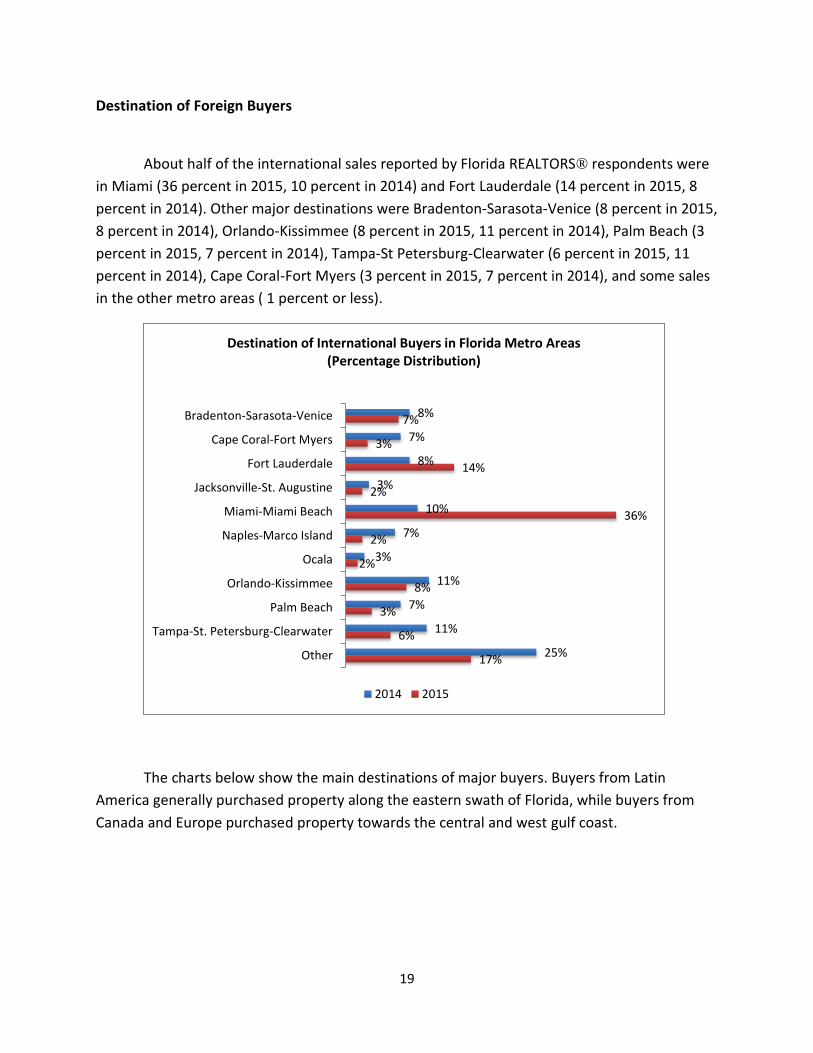
Destination of Foreign Buyers
About half of the international sales reported by Florida REALTORS® respondents were
in Miami (36 percent in 2015, 10 percent in 2014) and Fort Lauderdale (14 percent in 2015, 8
percent in 2014). Other major destinations were Bradenton-Sarasota-Venice (8 percent in 2015,
8 percent in 2014), Orlando-Kissimmee (8 percent in 2015, 11 percent in 2014), Palm Beach (3
percent in 2015, 7 percent in 2014), Tampa-St Petersburg-Clearwater (6 percent in 2015, 11
percent in 2014), Cape Coral-Fort Myers (3 percent in 2015, 7 percent in 2014), and some sales
in the other metro areas ( 1 percent or less).
The charts below show the main destinations of major buyers. Buyers from Latin
America generally purchased property along the eastern swath of Florida, while buyers from
Canada and Europe purchased property towards the central and west gulf coast.
8%
7%
8%
3%
10%
7%
3%
11%
7%
11%
25%
7%
3%
14%
2%
36%
2%
2%
8%
3%
6%
17%
Bradenton-Sarasota-Venice
Cape Coral-Fort Myers
Fort Lauderdale
Jacksonville-St. Augustine
Miami-Miami Beach
Naples-Marco Island
Ocala
Orlando-Kissimmee
Palm Beach
Tampa-St. Petersburg-Clearwater
Other
Destination of International Buyers in Florida Metro Areas (Percentage Distribution)
2014 2015

20
44%
18%
16%
Miami-Miami Beach
Fort Lauderdale
Orlando-Kissimmee
Brazil: Major Destinations
29%
19%
17%
9%
9%
6%
4%
Bradenton-Sarasota-Venice
Palm Beach
Tampa-St. Petersburg-Clearwater
Fort Lauderdale
Cape Coral-Fort Myers
Naples-Marco Island
Miami-Miami Beach
Canada: Major Destinations
42%
27%
9%
6%
5%
3%
3%
Miami-Miami Beach
Bradenton-Sarasota-Venice
Orlando-Kissimmee
Tallahassee
Gainesville
Fort Lauderdale
Ocala
China: Major Destinations
21
52%
15%
5%
3%
Miami-Miami Beach
Fort Lauderdale
Orlando-Kissimmee
Naples-Marco Island
Latin America/Caribbean, Except Brazil and Venezuela: Major Destinations
44%
22%
15%
8%
6%
Orlando-Kissimmee
Tampa-St. Petersburg-Clearwater
Bradenton-Sarasota-Venice
Palm Beach
Ocala
United Kingdom: Major Destinations
41%
27%
5%
Miami-Miami Beach
Fort Lauderdale
Orlando-Kissimmee
Venezuela: Major Destinations

22
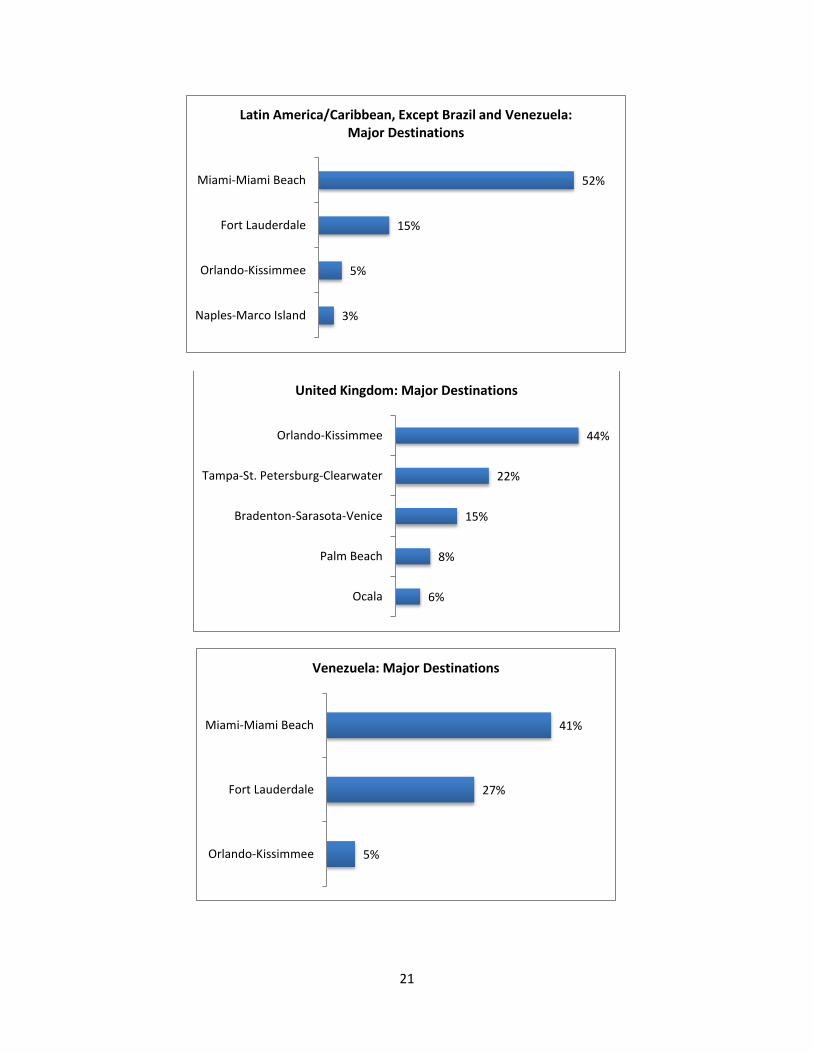
Top Buyers by Metro Area
Miami-Miami Beach, Fort Lauderdale, Orlando-Kissimmee, Palm Beach, and Tampa-St.
Petersburg-Clearwater were the major destinations of foreign buyers. The next charts show the
top countries of origin for these areas.
27%
13%
12%
10%
7%
6%
4%
3%
Miami-Miami Beach
Cape Coral-Fort Myers
Fort Lauderdale
Tampa-St. Petersburg-Clearwater
Bradenton-Sarasota-Venice
Orlando-Kissimmee
Naples-Marco Island
Palm Beach
Western Europe, Except United Kingdom: Major Destinations
46%
14%
11%
3%
3%
Canada
China
United Kingdom
Italy
Czech Republic
Bradenton-Sarasota-Venice: Top Foreign Buyers in Past 12 Months Ended June 2015

23
34%
12%
7%
6%
5%
5%
4%
4%
3%
Venezuela
Brazil
Canada
Colombia
Argentina
Mexico
France
Cuba
Ecuador
Fort Lauderdale: Top Foreign Buyers in Past 12 Months Ended June 2015
21%
13%
12%
8%
4%
4%
3%
Venezuela
Argentina
Brazil
Colombia
Mexico
China
France
Miami: Top Foreign Buyers in Past 12 Months Ended June 2015
28%
19%
12%
7%
5%
4%
4%
4%
4%
3%
United Kingdom
Brazil
Venezuela
Peru
Colombia
China
Ecuador
Germany
Sweden
Canada
Orlando-Kissimmee: Top Foreign Buyers in Past 12 Months Ended June 2015
24
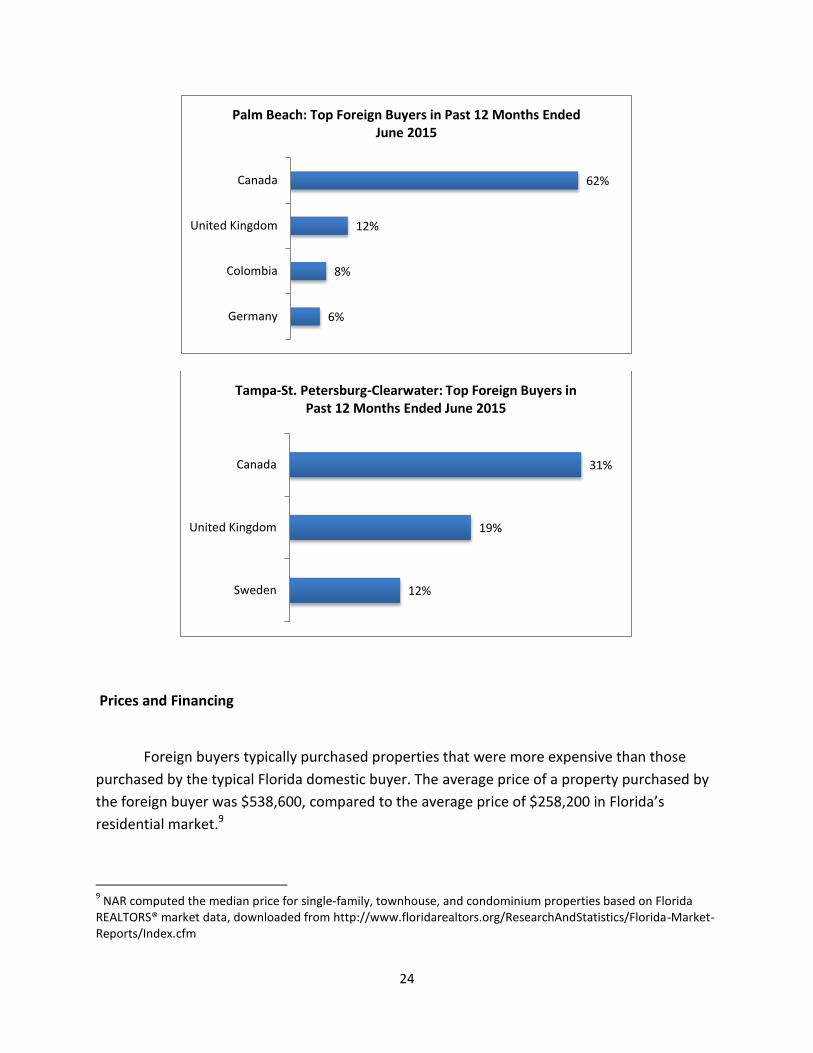
Prices and Financing
Foreign buyers typically purchased properties that were more expensive than those
purchased by the typical Florida domestic buyer. The average price of a property purchased by
the foreign buyer was $538,600, compared to the average price of $258,200 in Florida’s
residential market.9
9 NAR computed the median price for single-family, townhouse, and condominium properties based on Florida
REALTORS® market data, downloaded from http://www.floridarealtors.org/ResearchAndStatistics/Florida-Market-Reports/Index.cfm
62%
12%
8%
6%
Canada
United Kingdom
Colombia
Germany
Palm Beach: Top Foreign Buyers in Past 12 Months Ended June 2015
31%
19%
12%
Canada
United Kingdom
Sweden
Tampa-St. Petersburg-Clearwater: Top Foreign Buyers in Past 12 Months Ended June 2015

25
Buyers from Western Europe except the United Kingdom and from China purchased the
more expensive properties, while buyers from the United Kingdom and Canada purchased less
expensive properties. This is related to the survey’s findings that majority of these buyers
purchased properties in Miami-Miami Beach area where home prices are higher.
About 74 percent of Florida REALTORS® respondents reported all cash sales to foreign
buyers. Among recent foreign buyers in Florida, the use of mortgage financing was much less
frequent at 20 percent compared with the overall national share of 70 percent of
transactions.10 This disparity in the use of mortgages appears to have been due to differences in
credit reporting between the U.S. and foreign countries, and difficulties in confirming credit
worthiness internationally. Foreign buyers typically don’t have credit ratings that are computed
on scales similar to U.S. practices, don’t have Social Security numbers, and have credit and asset
10
Based on data from NAR’s REALTORS® Confidence Index surveys from April 2014-March 2015.
$264,400 $323,800 $326,500 $300,600
$538,600
$190,000 $198,800 $224,100 $245,500 $258,200
2011 2012 2013 2014 2015
Average (Mean) Home Prices of International and Domestic Clients in Florida and U.S. Market
Florida - foreign buyer Florida - residential market
Average Price of Property Purchased in Florida by Foreign Buyer, 12 months ended June 2015
Average (Mean) Price
Brazil $587,700
Canada $376,800
China $1,064,800
Latin America/Caribbean Except Brazil & Venezuela $593,600
United Kingdom $289,600
Venezuela $390,400
Western Europe Except United Kingdom $844,500
All foreign buyers $538,600

26
profiles significantly different from those typically experienced in standard U.S. credit profiles.
This makes obtaining a mortgage difficult for the foreign buyer.
Buyers from Canada were more likely to pay cash for the property.
Intended Use of Property
Approximately 66 percent of Florida’s foreign buyers purchased property for use as
vacation, residential rental, or both.
82% 84% 82% 74%
14% 13% 14% 21%
0%
50%
100%
2012 2013 2014 2015
Financing of International Buyers Purchasing Property in Florida
(Percentage Distribution)
Don’t know Investors/OtherMortgage financing - buyer's home countryMortgage financing - U.S. sourcesAll cash
Cash sales, as Percent of Purchases Made by Foreign Buyer in Florida, 12 months ended June 2015
Percent of buyers
Brazil 65%
Canada 92%
China 79%
Latin America/Caribbean Except Brazil & Venezuela 69%
United Kingdom 82%
Venezuela 82%
Western Europe Except United Kingdom 80%
All foreign buyers 74%

27
Buyers from the United Kingdom were the most likely to purchase the property for
vacation, residential rental, or both. Buyers from China tended to use the property for primary
residence and student housing.
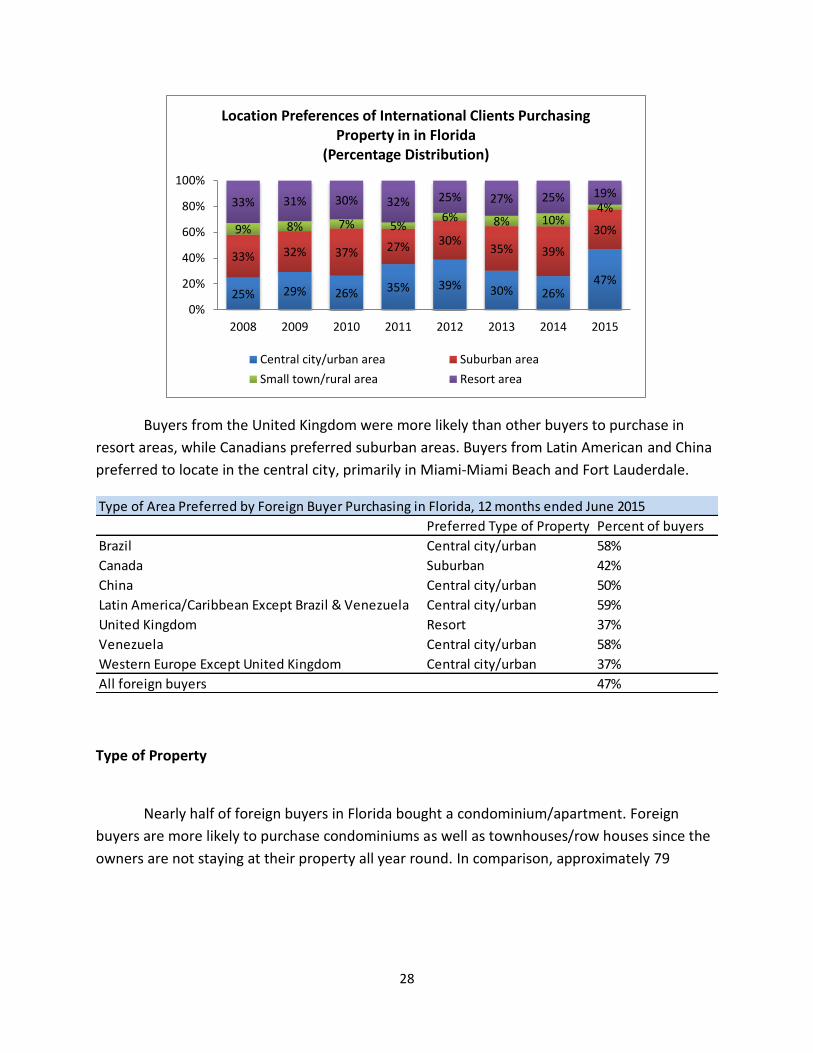
Location Preference
Florida REALTOR® respondents reported that 47 percent of foreign buyers purchased
property in the central city/urban area. This is in line with the finding that the share of buyers
from Latin America increased, and that these buyers tend to purchase condominium properties
for vacation and residential rental use.
27% 24% 20%
16%
4% 4% 5%
15% 20%
46%
11%
3% 2% 3%
0%5%
10%15%20%25%30%35%40%45%50%
Intended Use Property Purchased By International Clients (Percentage Distribution)
Florida National
Use of Property for Vacation, Rental, or Both by Foreign Buyer, 12 months ended June 2015
Percent of buyers
Brazil 63%
Canada 73%
China 57%
Latin America/Caribbean Except Brazil & Venezuela 69%
United Kingdom 81%
Venezuela 72%
Western Europe Except United Kingdom 72%
All foreign buyers 66%
28
Buyers from the United Kingdom were more likely than other buyers to purchase in
resort areas, while Canadians preferred suburban areas. Buyers from Latin American and China
preferred to locate in the central city, primarily in Miami-Miami Beach and Fort Lauderdale.
Type of Property
Nearly half of foreign buyers in Florida bought a condominium/apartment. Foreign
buyers are more likely to purchase condominiums as well as townhouses/row houses since the
owners are not staying at their property all year round. In comparison, approximately 79
25% 29% 26% 35% 39% 30% 26% 47%
33% 32% 37% 27% 30% 35% 39%
30% 9% 8% 7% 5% 6% 8% 10%
4% 33% 31% 30% 32% 25% 27% 25% 19%
0%
20%
40%
60%
80%
100%
2008 2009 2010 2011 2012 2013 2014 2015
Location Preferences of International Clients Purchasing Property in in Florida
(Percentage Distribution)
Central city/urban area Suburban area
Small town/rural area Resort area
Type of Area Preferred by Foreign Buyer Purchasing in Florida, 12 months ended June 2015
Preferred Type of Property Percent of buyers
Brazil Central city/urban 58%
Canada Suburban 42%
China Central city/urban 50%
Latin America/Caribbean Except Brazil & Venezuela Central city/urban 59%
United Kingdom Resort 37%
Venezuela Central city/urban 58%
Western Europe Except United Kingdom Central city/urban 37%
All foreign buyers 47%
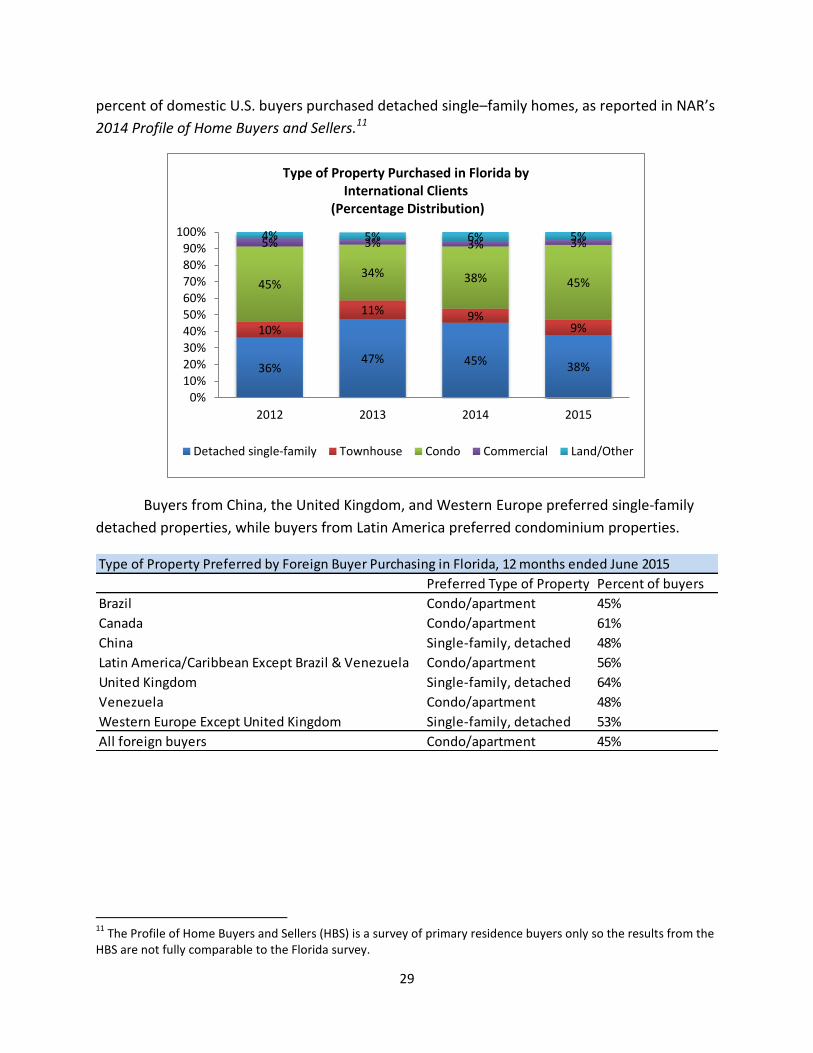
29
percent of domestic U.S. buyers purchased detached single–family homes, as reported in NAR’s
2014 Profile of Home Buyers and Sellers.11
Buyers from China, the United Kingdom, and Western Europe preferred single-family
detached properties, while buyers from Latin America preferred condominium properties.
11
The Profile of Home Buyers and Sellers (HBS) is a survey of primary residence buyers only so the results from the HBS are not fully comparable to the Florida survey.
36% 47% 45% 38%
10%
11% 9% 9%
45% 34% 38% 45%
5% 3% 3% 3% 4% 5% 6% 5%
0%10%
20%30%
40%
50%
60%
70%
80%
90%100%
2012 2013 2014 2015
Type of Property Purchased in Florida by International Clients
(Percentage Distribution)
Detached single-family Townhouse Condo Commercial Land/Other
Type of Property Preferred by Foreign Buyer Purchasing in Florida, 12 months ended June 2015
Preferred Type of Property Percent of buyers
Brazil Condo/apartment 45%
Canada Condo/apartment 61%
China Single-family, detached 48%
Latin America/Caribbean Except Brazil & Venezuela Condo/apartment 56%
United Kingdom Single-family, detached 64%
Venezuela Condo/apartment 48%
Western Europe Except United Kingdom Single-family, detached 53%
All foreign buyers Condo/apartment 45%

30
New and Existing Home Sales
About 81 percent of foreign buyers who purchased a home in Florida bought an existing
home, lower than the share reported last year. The national share is 84 percent reported in
NAR’s 2014 Profile of Home Buyers and Sellers.
Buyers from Canada were the most likely to buy existing homes than any other group,
while buyers from China were the most likely to buy new homes.
Intended Months’ Use of Property
The likelihood that properties may have a dual use is also reflected in the length of time
that buyers plan to personally use them, with shorter intended use among those who also plan
22% 14% 11% 11% 12% 11% 10% 19%
78% 86% 89% 89% 88% 89% 90% 81%
0%
20%
40%
60%
80%
100%
2008 2009 2010 2011 2012 2013 2014 2015
New vs. Previously Owned Units Purchased in Florida By International Clients
(Percentage Distribution)
New Previously owned
Share of New and Existing Home Sales by Foreign Buyer in Florida, 12 months ended June 2015
New Existing
Brazil 19% 81%
Canada 7% 93%
China 40% 60%
Latin America/Caribbean Except Brazil & Venezuela 20% 80%
United Kingdom 27% 73%
Venezuela 15% 85%
Western Europe Except United Kingdom 19% 81%
All foreign buyers 19% 81%

31
to rent their property to others. Historically, about half of buyers have intended to use their
property for at most six months.
Most buyers were likely to stay at most six months. The high share of “don’t know”
responses especially about buyers from China and Venezuela does not enable the researchers
to make strong conclusions about the intended length of stay of foreign buyers.
V. CONCLUDING COMMENTS
The international market for the sale of existing residential homes to non-resident
foreigners remains an important part of the total Florida real estate market, comprising
approximately 12 percent of sales transactions and 24 percent of dollar volume in Florida in the
15% 16% 16% 18% 16% 14%
21% 23% 17% 22%
15% 16%
34% 34% 32%
31% 32%
23%
15% 12% 15%
13% 18%
22%
16% 16% 20% 16% 20% 25%
0%
10%
20%
30%
40%
50%
60%
70%
80%
90%
100%
2010 2011 2012 2013 2014 2015
Months International Buyer Plans to Use Property (Percentage Distribution)
Less than 1 1 to 2 3 to 6 more than 6 Don’t know
Intended Months' Use of Property of Foreign Buyer Purchasing in Florida, 12 months ended June 2015
Up to six months Don't know
Brazil 64% 20%
Canada 74% 17%
China 27% 46%
Latin America/Caribbean Except Brazil & Venezuela 50% 24%
United Kingdom 83% 3%
Venezuela 40% 40%
Western Europe Except United Kingdom 66% 15%
All foreign buyers 53% 25%
Percent of buyers

32
12 month time period ending June 2015. Although the role of foreign buyers has declined
compared to the years in the wake of the Great Recession, foreign buyers continue to be a
significant source of business in Florida, especially when compared against the national
performance.
A wide diversity of purchasers is attracted to Florida for investment and vacation
purposes. Respondents did express concern about the “cost of property” in Florida. This is
expected to be a continuing concern given the steep increase of properties amid tight inventory
that has pushed up prices.
In general, Florida REALTORS® responding to the survey have seen their international
practices expand over the past five years, and the increasing entry of new agents indicate that
further growth could be expected in the future. The future growth of international sales to
foreigners will be strongly dependent on the economic outlook in the countries of origin as well
as the other factors that typically drive residential markets.
33
VI. APPENDICES
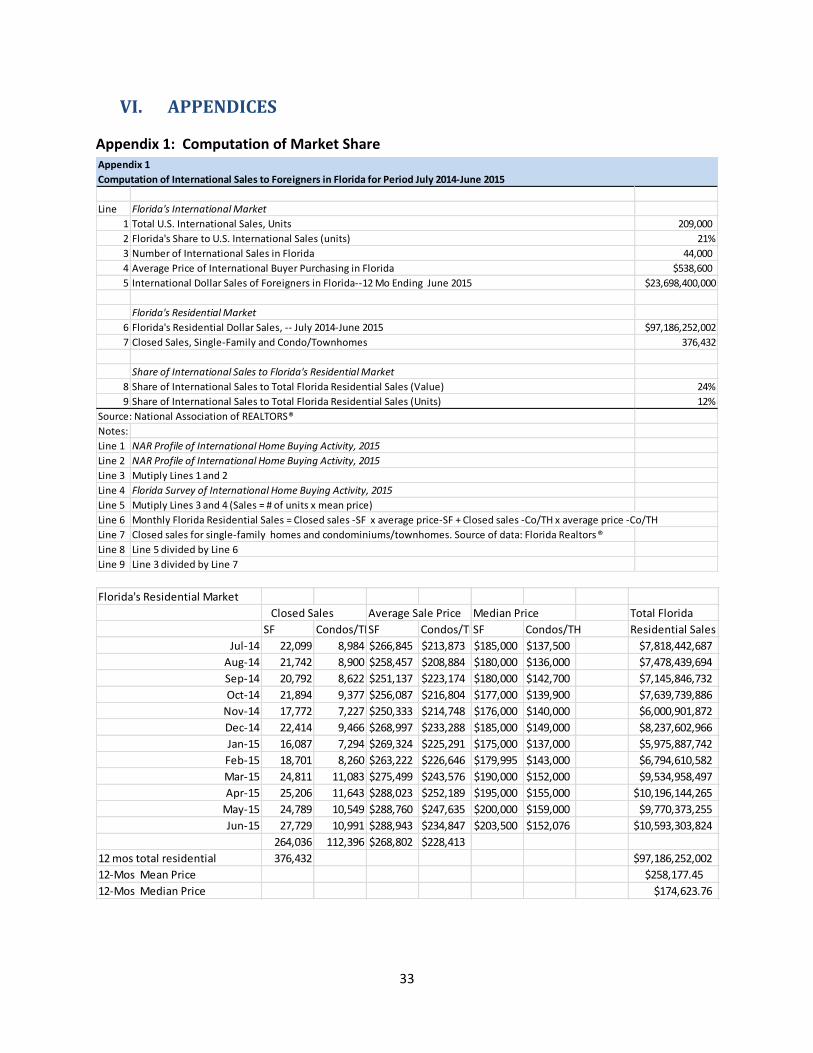
Appendix 1: Computation of Market Share
Appendix 1
Computation of International Sales to Foreigners in Florida for Period July 2014-June 2015
Line Florida's International Market
1 Total U.S. International Sales, Units 209,000
2 Florida's Share to U.S. International Sales (units) 21%
3 Number of International Sales in Florida 44,000
4 Average Price of International Buyer Purchasing in Florida $538,600
5 International Dollar Sales of Foreigners in Florida--12 Mo Ending June 2015 $23,698,400,000
Florida's Residential Market
6 Florida's Residential Dollar Sales, -- July 2014-June 2015 $97,186,252,002
7 Closed Sales, Single-Family and Condo/Townhomes 376,432
Share of International Sales to Florida's Residential Market
8 Share of International Sales to Total Florida Residential Sales (Value) 24%
9 Share of International Sales to Total Florida Residential Sales (Units) 12%
Source: National Association of REALTORS®
Notes:
Line 1 NAR Profile of International Home Buying Activity, 2015
Line 2 NAR Profile of International Home Buying Activity, 2015
Line 3 Mutiply Lines 1 and 2
Line 4 Florida Survey of International Home Buying Activity, 2015
Line 5 Mutiply Lines 3 and 4 (Sales = # of units x mean price)
Line 6 Monthly Florida Residential Sales = Closed sales -SF x average price-SF + Closed sales -Co/TH x average price -Co/TH
Line 7 Closed sales for single-family homes and condominiums/townhomes. Source of data: Florida Realtors®
Line 8 Line 5 divided by Line 6
Line 9 Line 3 divided by Line 7
Florida's Residential Market
Closed Sales Average Sale Price Median Price Total Florida
SF Condos/THSF Condos/THSF Condos/TH Residential Sales
Jul-14 22,099 8,984 $266,845 $213,873 $185,000 $137,500 $7,818,442,687
Aug-14 21,742 8,900 $258,457 $208,884 $180,000 $136,000 $7,478,439,694
Sep-14 20,792 8,622 $251,137 $223,174 $180,000 $142,700 $7,145,846,732
Oct-14 21,894 9,377 $256,087 $216,804 $177,000 $139,900 $7,639,739,886
Nov-14 17,772 7,227 $250,333 $214,748 $176,000 $140,000 $6,000,901,872
Dec-14 22,414 9,466 $268,997 $233,288 $185,000 $149,000 $8,237,602,966
Jan-15 16,087 7,294 $269,324 $225,291 $175,000 $137,000 $5,975,887,742
Feb-15 18,701 8,260 $263,222 $226,646 $179,995 $143,000 $6,794,610,582
Mar-15 24,811 11,083 $275,499 $243,576 $190,000 $152,000 $9,534,958,497
Apr-15 25,206 11,643 $288,023 $252,189 $195,000 $155,000 $10,196,144,265
May-15 24,789 10,549 $288,760 $247,635 $200,000 $159,000 $9,770,373,255
Jun-15 27,729 10,991 $288,943 $234,847 $203,500 $152,076 $10,593,303,824
264,036 112,396 $268,802 $228,413
12 mos total residential 376,432 $97,186,252,002
12-Mos Mean Price $258,177.45
12-Mos Median Price $174,623.76

34
Appendix 2: Some Comments Received From 2015 Florida Survey
Market Trends/Factors Influencing Purchase
o The dollar is strengthening and we will see a significant drop in foreign investment; rising prices will also deter investment.
o The strong dollar is affecting the purchase power of the international clients. o Exchange rates have stopped a couple of clients from overseas from purchasing. o A big decrease in Canadian interest in the past several months. o The rebound of the US market and home price has driven away the Canadian buyers who were
scooping up the deals a few years ago. They are still looking but there are not many bargains any more.
o The decline of the euro has had the most impact on the foreign buyer. o Brazil still our best market but new economic challenges is beginning to have effect on new
transactions. o Chinese market seems to be the biggest investor. o European clients are interested in the US market, also Middle Eastern clients. o Foreign market is hot. Two years ago it was Russia and Brazil. Now it is China. o I think that the next pool of people who is going to buy here in South Florida is going to be
Chinese (besides those from Latin America, Canadians and Russians). o I am finding that foreign clients are selling their properties and not rebuying. I have sold three
homes and going to list another four in next month. All My clients are from the UK. o It is a market geared to Spanish speaking Realtors®. o In my city of Dunedin, Canadian buyers abound due to our winter home of the Toronto Blue
Jays, but they concentrate on mobile homes and very inexpensive condos. o I've had several inquiries from German customers. o Many Australians are drawn to Florida for the investment prices, since it is much more
affordable here, but the dollar has an influence. o Most of my buyers and renters have been international. My Brickell tenants are 90% relocating
for professional reasons. Foreign buyers tend to have more cash available and less time to make decisions on purchasing a property.
o My dealings have been more with listings so I do have customers both buyers and sellers from Canada, UK, Argentina & China.
o The Venezuelan investors dominate the South Florida market. o The investors are taking advantage of the low interest rates. I am also a Property Manager. o Most international buyers are now purchasing pre-construction in my opinion. o There is lot of new homes and prices are high. o I like work with international buyer because they come to USA with cash to buy. o The buyer I had were a young professional buyer. I feel global trade, export, and manufacturing
business are going to be a great impact in our market. Young professional want a secure vacation home.
o Out of 200 leads that come in, three percent are international and that is what I have right now working.
o My career is about to become obsolete because I am a Miami Beach native and the international market is significantly pushing out my local clientele making my job very difficult. It is becoming impossible for my clients to purchase real estate in their hometown and they feel like they are being driven out do to the significant influx of internationals. This is just not feeling

35
like a home to them anymore and it has been very sad not only for my clients, but my real estate business that has been here for over 50 years. Yes, the city is booming but we need to have a more even mix of locals and internationals or we are going to have a major issue. We need subsidized housing for locals or this city is going to fall apart.
o Our property prices and lack of inventory are hurting our international market as well as lack of good financing for foreign buyers.
o My foreign buyers haven't bought yet, but are still looking. All three are multi-millionaires. o I'm an experienced businessman in dealing with internationals clients and believe that this
market will grow in desirability as Florida represents a location well known worldwide as a destination point which most international clients value as important in considering the security of a real estate investment beyond their home country.
Visa/Immigration/Business
o The two limiting factors are the lack of long-stay visa for retirees and the almost-impossibility for foreigners to get a mortgage.
o If we didn't have the rental restrictions on condo in Miami Beach, we could sell three times what we do to international buyers. They all want to buy to use the place and rent when they are not in town and this is not possible in Miami Beach!
o I would like to see an alliance with the Palm Beach International Airport to increase flight traffic to our area from regions around the world.
o We thought the new international airport in Panama City Beach would bring in more international buyers. The aircraft carriers are not there.
o Immigration attitude and taxes draw many potential investors away. Bank/Mortgage/Financing
o We need more local banks with programs for foreign national buyers. o We need to improve in offering foreign national loans. We need to have a more reliable source
of attorneys and accountants able to deal with international buyers. o International buyers are having trouble and or prohibited from pulling large amounts of cash out
of their home country. Last two Brazilian buyers failed to close. Homeowner Association Fees/Taxes/Procedures
o Some international buyers are not aware of our tax laws, therefore, as a Realtor®, we need to help educate these potential buyers.
o The inheritance taxes and taxes in general are scaring international customers. They are becoming savvy on taxes and they are holding back.
Language/Culture
o The biggest challenge I have had is that there are many Realtors® that do not speak English very well. Because of this, my workload on an average transaction has been more than it should have been.
o We Realtors® should be more prepared in giving clear and understandable explanations to our foreign buyers. This way they can easily understand the buying process before, during and after their purchase is completed.

36
Association Assistance/Support
o Maybe more education in other languages about international buyers. o More class in Spanish. o More information and capacity in Spanish and Italian. o More nice videos about all Miami each different- areas, life-style like Brickell Aventura edge
water south beach etc...should be made separately and posted on YouTube. We should sell Miami lifestyle first.
o More oversees marketing. o Would like to see more classes on working with international buyers and the implications. o Need more info on immigration status to own a property because the info for financing or tax
related charges are well explained.