Embed Size (px)
Citation preview

Smokeless Tobacco Sub-Group
Proficiency Test Report
The Determination of Arsenic, Beryllium, Cadmium, Chromium, Cobalt, Nickel, Lead,
and Selenium in Reference Materials
September 2015
Author and Sub-Group Secretary:
Karl Wagner, Ph.D.
Altria Client Services
Co-Author and Statistical Analysis:
Michael Morton, Ph.D.
Altria Client Services

Table of Contents
1. Summary ............................................................................................................................. 3
2. Introduction ......................................................................................................................... 3
3. Organisation ........................................................................................................................ 3
3.1 Participants .................................................................................................................. 3
3.2 Protocol ........................................................................................................................ 4
4. Data – Descriptive Statistics ............................................................................................... 4
5. Data – Statistical Analysis .................................................................................................. 4
6. Results – Z-Scores .............................................................................................................. 6
7. Conclusion ........................................................................................................................ 11
APPENDIX A: Study Protocol ............................................................................................... 13
APPENDIX B: Data Tables .................................................................................................... 18

STS-CTR-Metals Proficiency Study – September 2015 3/21
1. Summary
In December 2014 through March 2015, the CORESTA Smokeless Tobacco Sub-Group
(STS) and Routine Analytical Chemistry Sub-Group (RAC) conducted a proficiency study to
determine arsenic (As), beryllium (Be), cadmium (Cd), chromium (Cr), cobalt (Co), nickel
(Ni), lead (Pb), and selenium (Se) in three certified reference materials and in a CORESTA
Reference Product (CRP3). Nineteen laboratories participated in this study.
2. Introduction
The objective of this proficiency study was to provide an initial assessment of laboratory
capabilities for the analysis of specific trace elements in several tobacco and non-tobacco
plant matrices. Laboratories were requested to determine As, Be, Cd, Cr, Co, Ni, Pb, and Se
using inductively coupled plasma mass spectrometry (ICP-MS).
3. Organisation
3.1 Participants
A list of the participating laboratories is provided in Table 1. The laboratories are listed in
alphabetical order. The laboratory codes used in this report do not correspond to the same
order as provided in Table 1.
Table 1: List of Participating Laboratories
Participating Laboratories
Arista Laboratories, United States
British American Tobacco, Souza Cruz S.A, Brazil
Canadian Border Service Agency, Canada
China National Tobacco Quality Supervision and Test Center, China
Centers for Disease Control and Prevention, Tobacco Products Laboratory, United States
Enthalpy Analytical, United States
Essentra Scientific Services, United Kingdom
Eurofins Food & Agro Testing, Sweden
Global Laboratory Services, United States
Imperial Tobacco Group, Reemtsma, Germany
Imperial Tobacco Group, SEITA, France
Japan Tobacco, Leaf Tobacco Research Center, Japan
KT&G R&D Center, Republic of Korea
Labstat International, Canada
Lorillard Tobacco Company, United States
Philip Morris International TPTL, Switzerland
R.J. Reynolds Tobacco Company, United States
Swedish Match, Sweden
Technical Center of Shanghai Tobacco Group Co., LTD Shanghai, China

STS-CTR-Metals Proficiency Study – September 2015 4/21
3.2 Protocol
The study included three certified reference materials and CRP3. Sample descriptions are
provided in Table 2. The two tobacco reference materials do not contain significant levels of
Se; therefore, BCR402 (White Clover) was included as this plant matrix has significant
levels of Se. Participating laboratories were responsible for procuring the samples for the
study. Each participant was requested to determine three replicates under repeatability
conditions, using their validated method. Data were reported on an as-is basis and not
corrected for moisture. A microwave digestion method was provided for reference, but use of
the digestion method was not required. Additional details are provided in the study protocol
which is given in Appendix A. The only deviation noted by the participants was that Lab 3
used ICP-OES instead of ICP-MS.
Table 2: Sample Identification
Sample Product Type
INCT-OBTL-5 Oriental Basma Tobacco Leaves
INCT-PVTL-6 Polish Virginia Tobacco Leaves
BCR-402 White Clover
CRP3 CORESTA Reference Product 3, American-style loose dry snuff powder
4. Data – Descriptive Statistics
The data tables, with descriptive statistics, are provided in Appendix B. The data are
provided on an as-is basis without any correction for moisture.
5. Data – Statistical Analysis
The assigned values for each element, for each sample, were developed from the certified or
informational values provided in the certificates of analysis, if available. If certified or
informational values were not available, the assigned values were the median values from this
study.
The certified and informational values provided in the certificates of analysis were given on a
dry weight basis; however, the results in this study were expressed on an as-is basis. For this
reason, the dry weight values from the certificates of analysis were converted to an as-is basis.
The conversion to an as-is basis was based on moisture measurements (oven volatiles) made
by three participating laboratories. The average percent moisture values of the reference
materials, determined by the three laboratories, are given in Table 3.
Table 3: Percent Oven Volatiles
Sample Average Percent Moisture
INCT-OBTL-5 4.6%
INCT-PVTL-6 3.8%
BCR-402 7.8%
CRP3 Not determined

STS-CTR-Metals Proficiency Study – September 2015 5/21
It was necessary to determine the standard deviations for the proficiency assessment in order
to calculate z-statistics. The standard deviations were calculated from the Horwitz equation
and are presented in Table 4. The Horwitz equation was originally developed by William
Horwitz based on the observation that over a wide concentration range, the interlaboratory
variation can be approximated by an exponential function of the concentration of the analyte.
The equation has been refined, since its original introduction and we use the version of the
equation given in Thompson1. The updated version of the Horwitz equation used here is
given as:
𝜎𝑝 = 0.01√𝑐, 13.8% ≤ 𝑐
𝜎𝑝 = 0.02𝑐0.8495, 120𝑛𝑔
𝑔≤ 𝑐 < 13.8%
𝜎𝑝 = 0.22𝑐, 𝑐 < 120𝑛𝑔
𝑔
Where:
𝜎𝑝: The “standard deviation for proficiency assessment.”
c: The concentration of the element on a gram of analyte per gram sample basis.
The concentration used in the calculation was the assigned value.
The standard deviations are given in Table 4.
Z-statistics were calculated for each laboratory to assess the lab performance. The z-statistic
is defined as:
𝑧 =𝑥 − 𝑥𝑎
𝜎𝑝
Where:
𝑥: The value obtained by the laboratory
𝑥𝑎: The “assigned value” based on the certified or informational value if available,
or on the study median.
𝜎𝑝: The “standard deviation for proficiency assessment.”
The z-statistics (z-scores) are presented in the Results section.
1 Thompson, Michael, “Recent trends in inter-laboratory precision at ppb and sub-ppb concentrations in relation
to fitness for purpose criteria in proficiency testing,” The Analyst, 2000, 125, 385-386.

STS-CTR-Metals Proficiency Study – September 2015 6/21
Table 4: Assigned Values
INCT-OBTL-5 (ng/g)
As
C Be
I Cd
C Cr
I Co
C Pb
C Ni
C Se
M
Certified or Informational Value
(dry weight) 668 81.2 2640 6300 981 2010 8500 --
Assigned Value (as-is)
637 77 2519 6011 936 1918 8110 88
St dev (as-is)ǂ 109 17 351 734 151 278 947 19
INCT-PVTL-6 (ng/g)
As
C Be
M Cd
C Cr
I Co
C Pb
C Ni
C Se
M
Certified or Informational Value
(dry weight) 138 -- 2230 911 154 972 1490 --
Assigned Value (as-is)
133 20.0 2144 876 148 935 1433 49
St dev (as-is)ǂ 29 4.39 306 143 32 151 217 10
BCR-402 (ng/g)
As
C Be
M Cd
M Cr
I Co
C Pb
M Ni
I Se
C
Certified or Informational Value
(dry weight) 93 -- -- 5190 178 -- 8250 6700
Assigned Value (as-is)
86 6.43 163 4785 164 485 7607 6178
St dev (as-is)ǂ 19 1.42 34 605 34 87 897 751
CRP3 (ng/g)
As
M Be
M Cd
M Cr
M Co
M Pb
M Ni
M Se
M
Certified or Informational Value
(dry weight) -- -- -- -- -- -- -- --
Assigned Value (as-is)
287 30.2 1470 8531 1125 790 6730 116
St dev (as-is)ǂ 55 6.64 222 988 177 131 808 25
C: The assigned value was based upon the ‘certified’ value provided in the certificate of analysis.
I: The assigned value was based upon the ‘informational’ value provided in the certificate of analysis.
M: The assigned value was based upon the group median.
ǂ:
The standard deviations were calculated from the Horwitz equation.
--: ‘Certified’ or ‘informational’ values are not available.
6. Results – Z-Scores
The values obtained by each laboratory, for each element, are given in Appendix B. The
corresponding z-statistics are given in Tables 5 – 8. As a general rule, the z-scores are
regarded as reasonable if -2 < z < 2 and generally thought to be unacceptable if |z|>3.
Laboratories should consider |z| between 2 and 3 as a warning signal.
STS-CTR-Metals Proficiency Study – September 2015 7/21
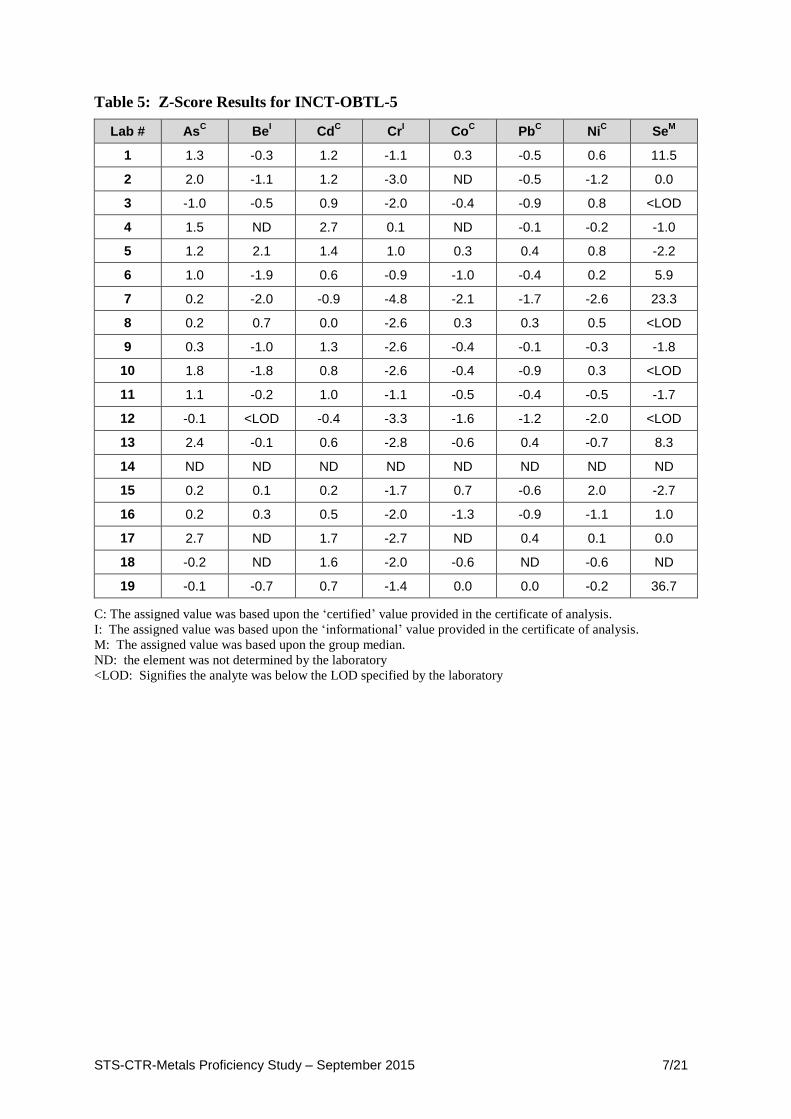
Table 5: Z-Score Results for INCT-OBTL-5
Lab # AsC Be
I Cd
C Cr
I Co
C Pb
C Ni
C Se
M
1 1.3 -0.3 1.2 -1.1 0.3 -0.5 0.6 11.5
2 2.0 -1.1 1.2 -3.0 ND -0.5 -1.2 0.0
3 -1.0 -0.5 0.9 -2.0 -0.4 -0.9 0.8 <LOD
4 1.5 ND 2.7 0.1 ND -0.1 -0.2 -1.0
5 1.2 2.1 1.4 1.0 0.3 0.4 0.8 -2.2
6 1.0 -1.9 0.6 -0.9 -1.0 -0.4 0.2 5.9
7 0.2 -2.0 -0.9 -4.8 -2.1 -1.7 -2.6 23.3
8 0.2 0.7 0.0 -2.6 0.3 0.3 0.5 <LOD
9 0.3 -1.0 1.3 -2.6 -0.4 -0.1 -0.3 -1.8
10 1.8 -1.8 0.8 -2.6 -0.4 -0.9 0.3 <LOD
11 1.1 -0.2 1.0 -1.1 -0.5 -0.4 -0.5 -1.7
12 -0.1 <LOD -0.4 -3.3 -1.6 -1.2 -2.0 <LOD
13 2.4 -0.1 0.6 -2.8 -0.6 0.4 -0.7 8.3
14 ND ND ND ND ND ND ND ND
15 0.2 0.1 0.2 -1.7 0.7 -0.6 2.0 -2.7
16 0.2 0.3 0.5 -2.0 -1.3 -0.9 -1.1 1.0
17 2.7 ND 1.7 -2.7 ND 0.4 0.1 0.0
18 -0.2 ND 1.6 -2.0 -0.6 ND -0.6 ND
19 -0.1 -0.7 0.7 -1.4 0.0 0.0 -0.2 36.7
C: The assigned value was based upon the ‘certified’ value provided in the certificate of analysis.
I: The assigned value was based upon the ‘informational’ value provided in the certificate of analysis.
M: The assigned value was based upon the group median.
ND: the element was not determined by the laboratory
<LOD: Signifies the analyte was below the LOD specified by the laboratory

STS-CTR-Metals Proficiency Study – September 2015 8/21
Table 6: Z-Score Results for INCT-PVTL-6
Lab # AsC Be
M Cd
C Cr
I Co
C Pb
C Ni
C Se
M
1 -0.1 0.1 1.2 -1.3 0.7 -1.8 0.1 3.2
2 0.4 -0.7 1.1 -2.5 ND -1.8 -1.6 -0.6
3 <LOD -0.1 1.7 -1.8 0.0 0.5 1.5 <LOD
4 0.2 ND 2.9 -0.8 ND -1.4 -0.7 -1.0
5 0.0 1.2 1.2 -0.9 0.2 -1.1 -0.2 -2.0
6 0.2 <LOD 0.4 -1.8 0.1 -1.6 0.4 1.8
7 -0.7 -2.0 -0.8 -3.6 -1.1 -2.0 -1.7 9.6
8 0.4 4.2 -0.2 0.6 0.5 -1.3 0.1 <LOD
9 -0.4 -2.7 0.6 -3.9 -0.7 -1.8 -2.7 -2.8
10 0.0 <LOD 0.8 -2.7 -0.4 -1.7 -0.8 <LOD
11 0.5 0.1 1.1 -1.7 0.0 -1.5 -0.8 -1.5
12 -0.9 <LOD 0.6 -2.5 -0.3 -1.8 -1.1 <LOD
13 0.8 -0.1 0.7 -2.7 -0.4 -1.5 -0.9 <LOD
14 ND ND ND ND ND ND ND ND
15 -0.3 1.3 0.3 -2.0 1.2 -0.9 1.1 -1.9
16 0.2 <LOD 0.7 -3.4 -0.2 -1.8 -1.1 6.1
17 0.8 ND 1.5 -1.8 ND -1.6 -1.2 0.6
18 -0.6 ND 1.5 0.9 0.3 ND 1.2 ND
19 0.8 <LOD 0.9 1.4 1.0 -1.0 2.0 11.4
C: The assigned value was based upon the ‘certified’ value provided in the certificate of analysis.
I: The assigned value was based upon the ‘informational’ value provided in the certificate of analysis.
M: The assigned value was based upon the group median.
ND: the element was not determined by the laboratory
<LOD: Signifies the analyte was below the LOD specified by the laboratory

STS-CTR-Metals Proficiency Study – September 2015 9/21
Table 7: Z-Score Results for BCR-402
Lab # AsC Be
M Cd
M Cr
I Co
C Pb
M Ni
I Se
C
1 1.3 <LOD 0.7 2.0 0.2 0.7 1.9 1.0
2 1.4 -0.8 0.6 -1.2 ND 0.1 -0.1 2.3
3 <LOD 0.2 0.6 0.5 -0.7 2.4 1.8 2.0
4 0.7 ND 1.4 0.5 ND -0.1 1.2 1.7
5 0.1 0.1 0.0 0.5 -0.4 0.0 1.9 0.6
6 10.8 <LOD -0.6 0.2 -0.6 0.2 0.7 0.9
7 0.0 -2.2 -0.5 -4.2 -1.7 -1.1 -2.0 0.7
8 0.9 6.2 -1.4 0.4 0.3 0.4 0.4 0.6
9 -0.3 -3.2 0.7 -0.7 -0.5 -0.5 0.6 0.8
10 0.6 <LOD -0.2 0.6 -0.4 -0.4 1.7 1.2
11 0.9 0.0 0.0 0.3 -0.4 0.2 1.1 1.0
12 <LOD <LOD -0.8 -0.9 -1.1 -0.4 -0.1 -0.8
13 1.4 -0.8 -0.1 -0.5 -0.6 0.0 1.0 1.0
14 ND ND ND ND ND ND ND ND
15 0.7 2.5 -0.2 -0.4 0.6 0.1 3.7 0.0
16 0.6 <LOD 0.1 -0.7 -2.8 0.0 0.7 -0.1
17 1.5 ND 1.6 -3.4 ND -0.3 -0.8 2.4
18 0.3 ND 3.1 -1.1 -0.8 ND -1.2 ND
19 7.7 <LOD -1.0 1.0 0.8 1.2 -0.2 0.0
C: The assigned value was based upon the ‘certified’ value provided in the certificate of analysis.
I: The assigned value was based upon the ‘informational’ value provided in the certificate of analysis.
M: The assigned value was based upon the group median.
ND: the element was not determined by the laboratory
<LOD: Signifies the analyte was below the LOD specified by the laboratory

STS-CTR-Metals Proficiency Study – September 2015 10/21
Table 8: Z-Score Results for CRP3
Lab # AsM
BeM Cd
M Cr
M Co
M Pb
M Ni
M Se
M
1 0.0 0.2 0.3 1.4 0.6 -0.3 0.9 7.9
2 0.1 -0.2 0.2 -1.8 ND 0.0 -1.4 0.0
3 5.3 0.3 0.0 0.4 -0.1 0.7 0.9 <LOD
4 0.1 ND 1.6 0.0 ND -0.2 0.3 -0.5
5 -0.1 1.7 0.4 1.3 0.6 0.6 1.3 -1.6
6 -0.2 -2.1 0.2 1.3 -0.7 -0.9 0.9 3.2
7 -0.8 -1.7 -1.6 -4.6 -1.9 -1.9 -3.6 10.9
8 -0.1 -1.1 -1.4 0.3 0.2 0.4 -0.5 3.2
9 -1.2 -0.2 0.1 -0.3 -0.2 -0.1 -0.3 -3.0
10 0.2 <LOD 0.0 0.9 0.0 -0.5 0.7 -1.3
11 0.3 0.6 0.1 0.9 0.0 0.5 0.2 -1.1
12 -0.8 <LOD -0.6 -0.9 -0.9 -0.5 -0.9 -1.7
13 0.9 1.2 -0.4 -0.2 0.0 0.5 0.0 7.6
14 0.5 ND -0.5 0.4 ND 0.0 -0.5 3.5
15 -0.1 1.9 0.3 0.0 2.8 1.2 4.6 -1.4
16 -0.5 <LOD 0.0 -0.4 -0.6 -0.3 -0.5 -1.5
17 0.7 ND 0.6 -4.2 ND 0.1 -1.8 3.4
18 -1.1 ND -0.5 -1.0 -1.2 ND -1.5 ND
19 4.2 -0.2 -0.3 0.5 0.5 0.0 1.7 54.6
M: The assigned value was based upon the group median.
ND: the element was not determined by the laboratory
<LOD: Signifies the analyte was below the LOD specified by the laboratory

STS-CTR-Metals Proficiency Study – September 2015 11/21
7. Conclusion
The overall results of the proficiency study, showing the percentage of acceptable results
where |z|≤2, are given in Table 9. Notable observations include the following:
The results demonstrate that participating laboratories showed the least agreement
with the determination of selenium in all samples. It is worth noting that the
zscore results for selenium also show the greatest deviation from |z|=2 as
compared to the other elements (e.g. z=54.6 for CRP3).
Laboratories also showed poor agreement with the certified values for chromium in
INCT-OBTL-5 and INCT-PVTL-6. The median value of chromium among the
participating laboratories was close to two standard deviations below the assigned
values for both samples.
Although most laboratories showed acceptable results for lead with values within
two standard deviations of the assigned value, the median of the lab values for lead
for INCT-PVTL-6 was just over 1.6 standard deviations below the assigned value.
A recommendation for future metals studies is that all laboratories report data for the certified
reference materials on a dry weight basis so that these data do not need to be converted to an
as-is basis. Moisture (oven volatiles) should be determined following the instruction provided
in the certificate of analyses.
Table 9: Proficiency Study Results
Element Assigned Value
(ng/g)
Number of Scores |z|≤2
Total Number of Scoresǂ
Percent |z|≤2
INCT-OBTL-5
AsC 637 16 18 89
BeI 77 13 14 93
CdC 2519 17 18 94
CrI 6011 10 18 56
CoC 936 14 15 93
PbC 1918 17 17 100
NiC 8110 17 18 94
SeM 88 6 13 46
INCT-PVTL-6
AsC 133 17 17 100
BeM 20 8 10 80
CdC 2144 17 18 94
CrI 876 11 18 61
CoC 148 15 15 100
PbC 935 17 17 100
NiC 1433 17 18 94
SeM 49 7 12 58

STS-CTR-Metals Proficiency Study – September 2015 12/21
Element Assigned Value
(ng/g)
Number of Scores |z|≤2
Total Number of Scoresǂ
Percent |z|≤2
BCR-402
AsC 86 14 16 88
BeM 6.43 6 10 60
CdM 163 17 18 94
CrI 4785 16 18 89
CoC 164 14 15 93
PbM 485 16 17 94
NiI 7607 17 18 94
SeC 6178 15 17 88
CRP3
AsM 287 17 19 89
BeM 30.2 11 12 92
CdM 1470 19 19 100
CrM 8531 17 19 89
CoM 1125 14 15 93
PbM 790 18 18 100
NiM 6730 17 19 89
SeM 116 8 17 47
C: The assigned value was based upon the ‘certified’ value provided in the certificate of analysis.
I: The assigned value was based upon the ‘informational’ value provided in the certificate of analysis.
M: The assigned value was based upon the group median.
ǂ: Laboratories that reported <LOD or did not determine the element in the matrix were not included in the sum.

STS-CTR-Metals Proficiency Study – September 2015 13/21
APPENDIX A: Study Protocol
SMOKELESS TOBACCO SUB-GROUP
Metals Proficiency Study
Protocol
December 3, 2014
Author and Study Coordinator:
Karl Wagner (Altria Client Services Inc.), U.S.A.
Co-Author Statistical Analysis:
Michael Morton, Ph D.
(Altria Client Services Inc.), U.S.A.
Confidentiality Notice: All data in this Collaborative Study should be handled in the strictest
of confidence by all participating laboratories.
STS-CTR-Metals Proficiency Study – September 2015 14/21
1. Introduction
The purpose of interlaboratory proficiency testing is to provide participating laboratories with
an objective means of assessing laboratory capability. Additionally, proficiency testing is an
important component of a quality system and is a requirement of ISO 17025.
2. Objective
The objective of this proficiency study is to provide an initial assessment of laboratory
capabilities for the analysis of specific trace elements in several certified reference materials
and in CORESTA Reference Product 3 (CRP3). Arsenic, Beryllium, Cadmium, Chromium,
Cobalt, Lead, Nickel, and Selenium will be determined in the matrices using inductively
coupled plasma mass spectrometry (ICP-MS).
3. Time schedule
Date Activity
November 25, 2014 Laboratories state their intention to participate and order standard reference materials
December 3, 2014 Finalize protocol and distribute
March 1, 2015 Laboratories submit results by this date
April 29, 2015 Discuss results at STS meeting in Hangzhou, China
4. Participating Laboratories
The following laboratories have kindly agreed to take part in the study:
2015 Metals Proficiency Study Participants
Altria Client Services
Arista Laboratories
British American Tobacco, Souza Cruz S.A
China National Tobacco Quality Supervision and Test Center
Enthalpy Analytical
Essentra Scientific Services
Eurofins Food & Agro Testing, Sweden
Global Laboratory Services
Japan Tobacco, Inc.
Imperial Tobacco Group, Reemtsma
Imperial Tobacco Group, SEITA
KT&G R&D Center
Labstat International
Lorillard Tobacco Company

STS-CTR-Metals Proficiency Study – September 2015 15/21
2015 Metals Proficiency Study Participants
Microbac Laboratories, Wilson
Philip Morris International, Brazil
Philip Morris International, Neuchâtel (PPQ, OC Lab)
PT HM Sampoerna, Tbk
R.J. Reynolds Tobacco Company
Shanghai Tobacco Group Co., Ltd
Swedish Match Northern Europe
5. Samples
5.1 Selection
1) Oriental Basma Tobacco Leaves (INCT-OBTL-5)
2) Polish Virginia Tobacco Leaves (INCT-PVTL-6)
3) White Clover (BCR-402)
4) CRP3
The three reference materials are available from LGC Standards (www.lgcstandards.com).
CRP3 is available from North Carolina State University.
Note that different versions of the certified tobacco materials were available in the past.
Please ensure that you use the correct version for this study (INCT-OBTL-5 and INCT-
PVTL-6). Earlier versions of these materials will have different suffixes and are not suitable.
5.2 Storage
The three standard reference materials should be stored as specified by the distributer. CRP3
should be stored at −20°C).
6. Analysis
6.1 Analytes
The following analyses should be determined by each participating laboratory using ICP-MS:
Arsenic, Beryllium, Cadmium, Chromium, Cobalt, Lead, Nickel, and Selenium.
6.2 Methods
Laboratories should use their in house instrumental method. A closed vessel microwave
digestion procedure is provided in Appendix A for reference; however, use of the procedure is
not a requirement for this study.
6.3 Replicates
Conduct three (3) independent replicate preparations per sample.
STS-CTR-Metals Proficiency Study – September 2015 16/21
7. Data Reporting
1) The analytes should be reported in units of ng/g, on an as-is basis.
2) Data above the LOD, but below the LOQ should be reported and footnoted to indicate
the value was below the LOQ, but above the LOD.
3) If the instrumental result is less than the LOD, the numerical LOD should be reported
with a “<” symbol (e.g. <0.201).
The completed data sheet, provided below, should be sent to [email protected].
Microsoft Excel 97-2003 Worksheet
8. Statistical Analysis
Data for the certified reference materials will be compared to the certified values or reference
values, if available. Z-Scores will also be calculated for all samples.
9. Presentation of the Results
The final output will be a presentation for discussion at the spring STS meeting which is
scheduled to be held in Hangzhou, China on April 29, 2015.
Protocol Appendix A: Proposed Closed Vessel Microwave Digestion
Procedure
1. Sample Preparation
1.1. At the time of analysis, samples should be allowed to equilibrate to room
temperature before weighing.
1.2. Samples should be ground to a particle size of less than 1mm before digestion.
2. Sample digestion
2.1. Closed vessel microwave assisted acid digestion is used for the digestion of organic
material. This method should be regarded as a basic guideline for developing a
digestion procedure and not standard operating procedure. The manufacturer’s
instructions for the microwave digestion unit should be consulted before
developing a digestion method. This method will not dissolve refractory samples
such as silicates and may exhibit poor recovery for analytes bound in such matrices.
The goal of this digestion procedure is to digest the organic matrix in the sample
using nitric acid by maintaining a temperature of 200°C.Using an analytical
balance, weigh approximately 0.5g of sample into a microwave digestion vessel
and record the weight to the nearest 0.1 mg. If a pouched product is analysed, unit
pouches should be weighed for digestion.

STS-CTR-Metals Proficiency Study – September 2015 17/21
Note: The LOQ will be affected by the amount of tobacco digested. Some samples may
react more vigorously to the digestion procedure. In these cases, the sample weights and
/or digestion procedure will need to be adjusted accordingly.
2.2. Add 5.0±0.1 mL of nitric acid and gently swirl the sample being careful not to
deposit the sample on the vessel wall.
2.3. Screw the cap onto the digestion vessel and either leave the lid loose or leave the
vent cap loose to let digestion gases escape. Let the samples predigest in an
exhaust hood for a minimum of 1 hour and up to overnight before proceeding to the
microwave. The sample should no longer be effervescent when the vessel is sealed.
2.4. Tighten the digestion vessel cap and the vent cap. Place the microwave vessels into
the microwave and enter a digestion program based on manufacturer’s
specifications in order to reach a temperature of 150 °C over a period of 15
minutes. Allow the samples to cool and then remove the vessels from the
microwave unit and open the vessels to vent them.
2.5. Reseal the vessels and place the microwave vessels into the microwave and enter a
digestion program based on manufacturer’s specifications in order to reach a
temperature of 200 °C over a period of 15 minutes. Maintain 200 °C for an
additional 15 minutes. Allow the samples to cool and then remove them from the
microwave.
2.6. Quantitatively transfer the contents of each vessel to a 100mL graduated,
polypropylene vial or flask. Carefully rinse the digestion vessel with Type 1 water
and add to the polypropylene vial. Dilute the samples to 100mL final volume with
Type 1 water. Cap the samples and mix well.
2.7. The samples will have a final nitric acid concentration of approximately 5%. The
calibration standard used for analysis should also have a final nitric acid
concentration of 5%.

STS-CTR-Metals Proficiency Study – September 2015 18/21
APPENDIX B: Data Tables
INCT-OBTL-5 (ng/g, as-is basis)
Lab # As C
Be I
Cd C
Cr I
Co C
Pb C
Ni C
Se M
Assigned Value 637 77 2519 6011 936 1918 8110 88
1 782 ± 21 72.4 ± 0.6 2942 ± 23 5192 ± 110 974 ± 10 1767 ± 70 8673 ± 84 310 ± 43
2 857 ± 46 59.3 ± 0.6 2925 ± 95 3815 ± 155 ND 1770 ± 40 6948 ± 235 88 ± 2
3 524 ± 20 68.3 ± 0.8 2818 ± 42 4524 ± 93 882 ± 22 1658 ± 143 8867 ± 414 <2000
4 799 ± 79 ND 3454 ± 345 6062 ± 481 ND 1882 ± 80 7892 ± 648 68 ± 10
5 763 ± 24 112.5 ± 5.4 2992 ± 26 6736 ± 309 986 ± 23 2022 ± 91 8853 ± 162 45 ± 1
6 742 ± 19 44.8 ± 1.8 2727 ± 42 5383 ± 339 790 ± 4 1797 ± 49 8318 ± 274 202 ± 9
7 659 ± 9 43 ± 8.5 2207 ± 27 2494 ± 99 621 ± 3 1435 ± 67 5656 ± 92 539 ± 13
8 663 ± 27 88.9 ± 7 2507 ± 78 4074 ± 79 980 ± 24 2003 ± 42 8589 ± 257 <125
9 673 ± 32 61.3 ± 1.9 2962 ± 90 4119 ± 405 869 ± 33 1892 ± 106 7856 ± 217 54 ± 23
10 835 ± 22 47.6 ± 6.3 2785 ± 47 4127 ± 157 882 ± 16 1678 ± 57 8389 ± 19 <60
11 761 ± 13 74.9 ± 0.8 2872 ± 10 5187 ± 164 863 ± 14 1819 ± 44 7658 ± 87 54 ± 2
12 632 ± 49 <61 2363 ± 185 3618 ± 225 690 ± 33 1598 ± 76 6261 ± 416 <60
13 897 ± 19 75.1 ± 1.5 2737 ± 10 3926 ± 96 846 ± 15 2024 ± 64 7463 ± 92 249 ± 25
14 ND ND ND ND ND ND ND ND
15 657 ± 6 79.1 ± 4.7 2588 ± 48 4727 ± 113 1046 ± 30 1762 ± 25 9980 ± 254 36 ± 7
16 662 ± 41 83.0ǂ 2711 ± 296 4558 ± 184 740 ± 30 1670 ± 186 7108 ± 569 108 ± 15
17 932 ± 27 ND 3100 ± 52 4042 ± 430 ND 2018 ± 148 8170 ± 483 88 ± 31
18 614 ± 40 ND 3075 ± 199 4510 ± 331 842 ± 56 ND 7577 ± 456 ND
19 629 ± 67 65.9 ± 17.8 2770 ± 75 4953 ± 268 938 ± 39 1921 ± 52 7966 ± 109 799 ± 216
C: The assigned value was based upon the ‘certified’ value provided in the certificate of analysis. This value was converted to an as-is basis.
I: The assigned value was based upon the ‘informational’ value provided in the certificate of analysis. This value was converted to an as-is basis.
M: The assigned value was based upon the group median.
ǂ: Only one replicate was above the LOD; therefore, a standard deviation was not calculated
ND: the element was not determined by the laboratory
“<” Symbol: Signifies the analyte was below the LOD specified by the laboratory

STS-CTR-Metals Proficiency Study – September 2015 19/21
INCT-PVTL-6 (ng/g, as-is basis)
Lab # AsC Be
M Cd
C Cr
I Co
C Pb
C Ni
C Se
M
Assigned Value 133 20.0 2144 876 148 935 1433 49
1 131 ± 4 20.2 ± 0.3 2497 ± 31 688 ± 16 169 ± 2 662 ± 15 1459 ± 3 74 ± 5
2 143 ± 4 16.8 ± 0.3 2468 ± 37 522 ± 40 ND 661 ± 24 1094 ± 4 38 ± 3
3 <400 19.7 ± 1.2 2662 ± 61 613 ± 34 147 ± 3 1010 ± 124 1768 ± 30 <2000
4 138 ± 17 ND 3027 ± 183 761 ± 61 ND 726 ± 45 1282 ± 84 34 ± 7
5 133 ± 4 25.4 ± 0.5 2506 ± 42 742 ± 58 155 ± 3 767 ± 107 1380 ± 39 24 ± 1
6 138 ± 8 <13 2252 ± 54 622 ± 24 153 ± 6 689 ± 12 1512 ± 58 61 ± 3
7 112 ± 2 11 ± 1 1911 ± 16 361 ± 41 114 ± 2 632 ± 131 1063 ± 65 135 ± 8
8 144 ± 5 38.3 ± 5.1 2071 ± 28 961 ± 29 163 ± 5 744 ± 6 1449 ± 14 <125
9 121 ± 7 8.1 ± 5.9 2326 ± 135 320 ± 42 127 ± 3 664 ± 91 850 ± 70 17 ± 11
10 132 ± 4 <40 2376 ± 52 492 ± 15 135 ± 4 677 ± 117 1254 ± 63 <60
11 146 ± 3 20.5 ± 0.2 2470 ± 22 640 ± 56 149 ± 2 704 ± 10 1268 ± 12 29 ± 2
12 107 ± 5 <61 2314 ± 9 514 ± 25 138 ± 6 669 ± 15 1186 ± 65 <60
13 155 ± 6 19.5 ± 0.8 2351 ± 41 485 ± 31 136 ± 1 705 ± 35 1237 ± 17 <180
14 ND ND ND ND ND ND ND ND
15 125 ± 3 25.6 ± 3.7 2243 ± 9 595 ± 34 186 ± 4 794 ± 102 1677 ± 37 25 ± 1
16 138 ± 34 <62 2364 ± 22 384 ± 41 142 ± 4 669 ± 21 1188 ± 38 102 ± 4
17 156 ± 3 ND 2599 ± 36 622 ± 125 ND 686 ± 42 1176 ± 37 49 ± 7
18 114 ± 14 ND 2595 ± 371 1006 ± 100 158 ± 21 ND 1693 ± 505 ND
19 157 ± 60 <20 2423 ± 210 1079 ± 63 179 ± 10 784 ± 93 1872 ± 83 152 ± 106
C: The assigned value was based upon the ‘certified’ value provided in the certificate of analysis. This value was converted to an as-is basis.
I: The assigned value was based upon the ‘informational’ value provided in the certificate of analysis. This value was converted to an as-is basis.
M: The assigned value was based upon the group median.
ND: the element was not determined by the laboratory
“<” Symbol: Signifies the analyte was below the LOD specified by the laboratory
STS-CTR-Metals Proficiency Study – September 2015 20/21
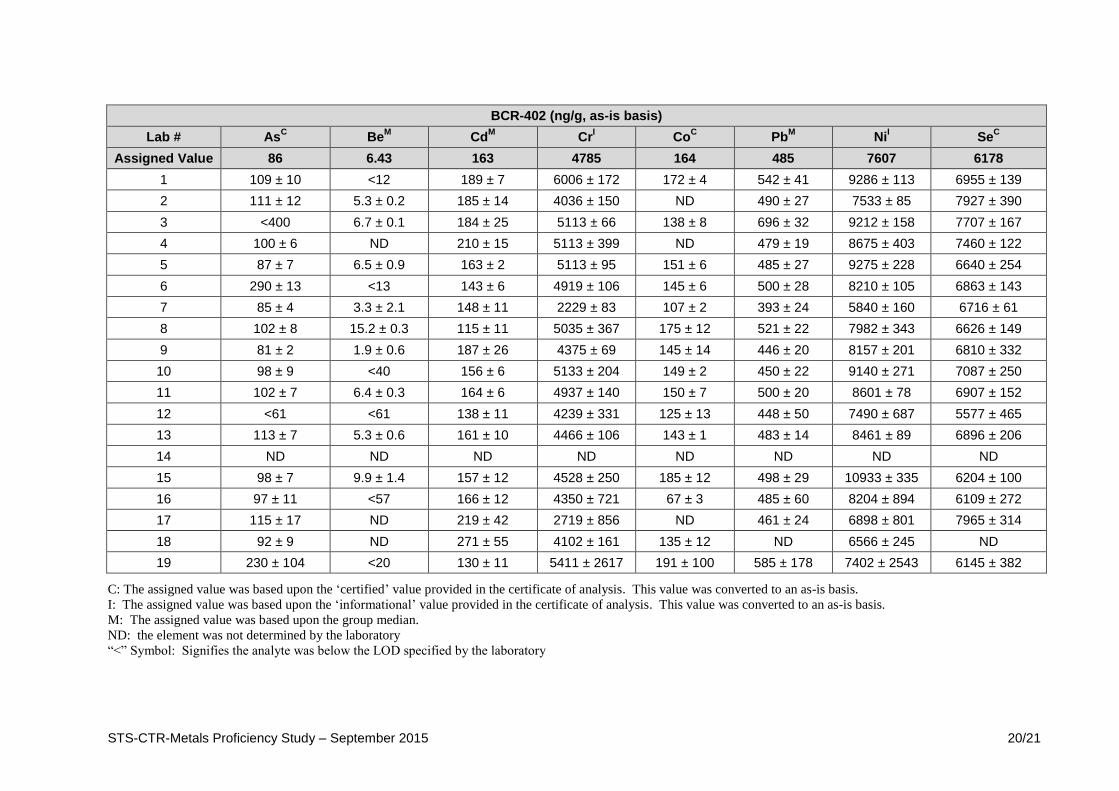
BCR-402 (ng/g, as-is basis)
Lab # AsC Be
M Cd
M Cr
I Co
C Pb
M Ni
I Se
C
Assigned Value 86 6.43 163 4785 164 485 7607 6178
1 109 ± 10 <12 189 ± 7 6006 ± 172 172 ± 4 542 ± 41 9286 ± 113 6955 ± 139
2 111 ± 12 5.3 ± 0.2 185 ± 14 4036 ± 150 ND 490 ± 27 7533 ± 85 7927 ± 390
3 <400 6.7 ± 0.1 184 ± 25 5113 ± 66 138 ± 8 696 ± 32 9212 ± 158 7707 ± 167
4 100 ± 6 ND 210 ± 15 5113 ± 399 ND 479 ± 19 8675 ± 403 7460 ± 122
5 87 ± 7 6.5 ± 0.9 163 ± 2 5113 ± 95 151 ± 6 485 ± 27 9275 ± 228 6640 ± 254
6 290 ± 13 <13 143 ± 6 4919 ± 106 145 ± 6 500 ± 28 8210 ± 105 6863 ± 143
7 85 ± 4 3.3 ± 2.1 148 ± 11 2229 ± 83 107 ± 2 393 ± 24 5840 ± 160 6716 ± 61
8 102 ± 8 15.2 ± 0.3 115 ± 11 5035 ± 367 175 ± 12 521 ± 22 7982 ± 343 6626 ± 149
9 81 ± 2 1.9 ± 0.6 187 ± 26 4375 ± 69 145 ± 14 446 ± 20 8157 ± 201 6810 ± 332
10 98 ± 9 <40 156 ± 6 5133 ± 204 149 ± 2 450 ± 22 9140 ± 271 7087 ± 250
11 102 ± 7 6.4 ± 0.3 164 ± 6 4937 ± 140 150 ± 7 500 ± 20 8601 ± 78 6907 ± 152
12 <61 <61 138 ± 11 4239 ± 331 125 ± 13 448 ± 50 7490 ± 687 5577 ± 465
13 113 ± 7 5.3 ± 0.6 161 ± 10 4466 ± 106 143 ± 1 483 ± 14 8461 ± 89 6896 ± 206
14 ND ND ND ND ND ND ND ND
15 98 ± 7 9.9 ± 1.4 157 ± 12 4528 ± 250 185 ± 12 498 ± 29 10933 ± 335 6204 ± 100
16 97 ± 11 <57 166 ± 12 4350 ± 721 67 ± 3 485 ± 60 8204 ± 894 6109 ± 272
17 115 ± 17 ND 219 ± 42 2719 ± 856 ND 461 ± 24 6898 ± 801 7965 ± 314
18 92 ± 9 ND 271 ± 55 4102 ± 161 135 ± 12 ND 6566 ± 245 ND
19 230 ± 104 <20 130 ± 11 5411 ± 2617 191 ± 100 585 ± 178 7402 ± 2543 6145 ± 382
C: The assigned value was based upon the ‘certified’ value provided in the certificate of analysis. This value was converted to an as-is basis.
I: The assigned value was based upon the ‘informational’ value provided in the certificate of analysis. This value was converted to an as-is basis.
M: The assigned value was based upon the group median.
ND: the element was not determined by the laboratory
“<” Symbol: Signifies the analyte was below the LOD specified by the laboratory

STS-CTR-Metals Proficiency Study – September 2015 21/21
CRP3 (ng/g, as-is basis)
Lab AsM Be
M Cd
M Cr
M Co
M Pb
M Ni
M Se
M
Assigned Value 287 30.2 1470 8531 1125 790 6730 116
1 287 ± 6 31.3 ± 0.3 1543 ± 2 9904 ± 27 1239 ± 9 756 ± 4 7478 ± 82 317 ± 19
2 295 ± 15 29.1 ± 1.1 1525 ± 25 6790 ± 406 ND 794 ± 38 5571 ± 204 116 ± 10
3 581 ± 58 32.1 ± 1.4 1465 ± 17 8906 ± 81 1102 ± 19 885 ± 33 7452 ± 137 <2000
4 290 ± 11 ND 1815 ± 34 8531 ± 1058 ND 770 ± 22 6949 ± 165 104 ± 3
5 280 ± 8 41.6 ± 0.7 1558 ± 45 9792 ± 24 1239 ± 20 867 ± 8 7768 ± 149 76 ± 9
6 276 ± 12 16.3 ± 2.1 1508 ± 6 9825 ± 218 993 ± 19 673 ± 15 7467 ± 55 198 ± 8
7 241 ± 5 19 ± 2.6 1107 ± 9 3937 ± 314 795 ± 2 548 ± 15 3841 ± 148 392 ± 23
8 279 ± 8 23 ± 2.6 1166 ± 5 8803 ± 238 1153 ± 51 839 ± 13 6346 ± 161 196 ± 26
9 220 ± 17 29 ± 5.5 1485 ± 50 8201 ± 194 1084 ± 25 773 ± 16 6454 ± 228 40 ± 8
10 300 ± 5 <40 1465 ± 75 9456 ± 253 1132 ± 55 723 ± 27 7325 ± 113 83 ± 4
11 305 ± 6 34.5 ± 2.3 1495 ± 6 9469 ± 46 1125 ± 14 857 ± 12 6867 ± 103 87 ± 3
12 242 ± 28 <61 1329 ± 123 7685 ± 774 967 ± 88 725 ± 68 6021 ± 505 73 ± 11
13 338 ± 3 38.1 ± 1.5 1387 ± 11 8340 ± 97 1131 ± 10 854 ± 32 6730 ± 182 310 ± 19
14 313 ± 9 ND 1363 ± 17 8956 ± 66 ND 787 ± 7 6307 ± 22 204 ± 9
15 281 ± 3 42.7 ± 4.9 1530 ± 39 8494 ± 137 1613 ± 16 945 ± 69 10440 ± 144 80 ± 2
16 259 ± 16 <61 1470 ± 18 8130 ± 988 1014 ± 9 757 ± 23 6289 ± 536 79 ± 13
17 325 ± 10 ND 1597 ± 22 4411 ± 745 ND 805 ± 42 5305 ± 476 201 ± 16
18 224 ± 33 ND 1357 ± 163 7509 ± 960 912 ± 118 ND 5482 ± 754 ND
19 521 ± 67 28.7 ± 9.7 1400 ± 89 9055 ± 209 1210 ± 8 794 ± 83 8114 ± 169 1504 ± 431
C: The assigned value was based upon the ‘certified’ value provided in the certificate of analysis. This value was converted to an as-is basis.
I: The assigned value was based upon the ‘informational’ value provided in the certificate of analysis. This value was converted to an as-is basis.
M: The assigned value was based upon the group median.
ND: the element was not determined by the laboratory
“<” Symbol: Signifies the analyte was below the LOD specified by the laboratory